Abstract
Mapping 1H brain metabolites using chemical shift imaging (CSI) is hampered by the presence of subcutaneous lipid signals, which contaminate the metabolites by ringing due to limited spatial resolution. Even though CSI at spatial resolution high enough to mitigate the lipid artifacts is infeasible due to signal-to-noise (SNR) constraints on the metabolites, the lipid signals have orders of magnitude higher concentration, which enables the collection of high-resolution lipid maps with adequate SNR. The previously proposed dual-density approach exploits this high-SNR property of the lipid layer to suppress truncation artifacts using high-resolution lipid maps. Another recent approach for lipid suppression makes use of the fact that metabolite and lipid spectra are approximately orthogonal, and seeks sparse metabolite spectra when projected onto lipid-basis functions. The present work combines and extends the dual-density approach and the lipid-basis penalty, while estimating the high-resolution lipid image from 2-average k-space data to incur minimal increase on the scan time. Further, we exploit the spectral-spatial sparsity of the lipid ring and propose to estimate it from substantially undersampled (acceleration R = 10 in the peripheral k-space) 2-average in vivo data using compressed sensing, and still obtain improved lipid suppression relative to using dual-density or lipid-basis penalty alone.
Introduction
The spatial resolution in proton spectroscopic imaging is constrained by the low SNR of the metabolite signals and the total scan time required for encoding in both chemical shift and space. Poor spatial resolution with impulse response functions of either square or circular k-space sampling leads to significant spatial ringing artifacts, which in the case of large and undesirable signals from subcutaneous lipid layer in spectroscopic imaging of the brain can significantly contaminate the desired metabolite spectra throughout the brain. Considering that the lipid signals are several orders of magnitude stronger than the biochemical spectra, the diagnostic quality of spectroscopic data is severely limited if the truncation artifacts are not mitigated by some means of lipid suppression.
Standard means of lipid suppression include outer-volume suppression (OVS) (1–3), inversion recovery (4–6), and selective brain-only excitation (7,8). Although these methods provide effective artifact reduction, their inevitable tradeoff and common drawback is the associated loss of brain metabolite signals, either through signal loss in peripheral brain regions (e.g. OVS, PRESS) or throughout the brain (IR). Another proposal for lipid artifact reduction is to acquire CSI data with a variable sampling density pattern and apply SNR-optimal apodization in the k-space to reduce the side-lobes of the point spread function (9). Optimal filters specifically designed to reduce the lipid contamination inside the brain yield further improvement over the variable density approach (10). An alternative approach acquires high-resolution lipid maps in addition to highly oversampled, low-resolution CSI data. This dual-density method (11–13) exploits the fact that the lipid signals have high SNR, so a high-resolution lipid estimate can be obtained with adequate SNR for subsequent processing, which includes spatial lipid masking and combination with low-resolution CSI data. Another research direction involves k-space extrapolation with prior knowledge of spatial boundaries of the brain (14,15). In particular, effective lipid suppression is demonstrated at a relatively short TE of 50 ms in (15). A yet different method of lipid suppression was recently proposed (16) by relying on the approximation that the metabolite and lipid spectra are orthogonal, and seeks sparse metabolite spectra when projected onto lipid-basis functions selected from the lipid layer.
Our work combines and extends the dual-density approach and the iterative lipid-basis reconstruction. We propose and demonstrate a method to estimate the high-resolution lipid image from 2-average k-space data in fast spiral CSI, and combine this with the low-resolution CSI image while imposing the lipid-basis penalty. This way, the truncation artifacts are substantially reduced at the expense of minimal increase in total scan time. We then refine this method by incorporating the observation that the high-resolution lipid ring is sparse in both space and chemical shift. This leads to successful recovery of the lipid image via compressed sensing (17,18) using highly-undersampled peripheral k-space data.
To demonstrate the performance of the proposed methods, single-slice, high-resolution (0.16 cc) CSI data were acquired in vivo at 3T with 20 averages, requiring 33 min of scan time. Applying the lipid-basis penalty to this high-resolution data yielded virtually artifact-free spectra, which were taken to be the gold-standard results. To apply the basic method with fully-sampled lipid data, 20 averages of low-resolution (0.56 cc, corresponding to 10 min of scan time) CSI data were combined with 2 averages of high-resolution data while imposing lipid-basis penalty, and reduced-artifact metabolite spectra were obtained with normalized root-mean-square error (NRMSE) of 8.5 % in the NAA maps relative to the gold-standard reconstruction. However, using the lipid-basis penalty approach (16) with 20 averages of 0.56 cc data yielded 41.3 % NRMSE in the NAA maps. Moreover, using the refined method, a high-resolution lipid layer was estimated via the FOCUSS algorithm (18) from 2-average, highly undersampled (Rhigh=10 in the peripheral k-space) data, which was combined with the 0.56 cc CSI image followed by lipid-basis penalty reconstruction to yield 17.0 % NRMSE in the NAA map. By incurring only a minimal increase in the scan time, we demonstrate 4.9- and 2-fold error reduction in metabolite maps relative to (16) using the basic and refined versions of the proposed method, respectively. We present further validation for the application of undersampling and compressed sensing recovery using variable density spirals with 10-fold undersampling on a synthetic phantom.
Theory
Dual-Density Reconstruction
We define ylow to be the k-space representation of low-resolution CSI data, and yhigh to be the k-space representation of high-resolution data from which the lipid image will be estimated due to
| (Eq.1) |
where xlipid is the high-resolution, masked lipid layer image, Mlipid is a binary mask marking the location of the lipid layer, and Fhigh is the Fourier Transform operator that samples the full extent of high-resolution k-space. Since yhigh usually has low SNR, the masking operation aims to select only the lipid layer and reduce the amount of noise that will propagate from the rest of the data.
Next, the low-resolution data is combined with the high-resolution lipid image via
| (Eq.2) |
Here, Flow is the Fourier Transform operator that samples only the lower frequency indices corresponding to ylow. Eq. 2 can be interpreted as extending the low-resolution k-space data using the high frequency content of the masked lipid image, which helps reducing the ringing artifact (11–13).
Iterative Reconstruction with Lipid-Basis Penalty
Again starting with the low-resolution CSI k-space data ylow, the artifact reduction algorithm in (16) aims to solve the convex programming problem
| (Eq.3) |
where Mbrain is a binary mask that indicates the metabolite region, xi is the spectrum at voxel i, λ is a regularization parameter that needs to be determined and xLB is the artifact-suppressed image. We denote the initial image with truncation artifacts with xlow (where ), and form a lipid-basis matrix Llow using the spectra inside the lipid layer of xlow as column vectors. Hence, to generate the lipid-basis Llow, the initial image with artifacts xlow is masked to retain only the lipid ring voxels. Next, each lipid spectra is assigned to be a column of the lipid-basis Llow. This way, the lipid-basis matrix will have n columns, where n is the number of voxels in the lipid mask, and each of its columns will be a lipid spectrum. Eq. 3 then aims to find spectra that match the acquired k-space data, but at the same time impose the constraint that no lipid signals arise from the brain itself.
The cost function in the iterative lipid-basis penalty reconstruction is composed of data consistency and lipid-basis penalty terms (Eq.3) which penalize the deviation from the k-space samples and the projection onto the lipid-basis, respectively. As the cost is composed of a linear combination of the convex ℓ2 and ℓ1 norms, the optimization problem is an unconstrained convex programming problem, which has the important feature that all local minima are also global (19).
The Basic Method: Combining 2-average, high-resolution data with high SNR, low-resolution data
Our first proposal is to combine the two orthogonal lipid suppression approaches: the dual-density method and the lipid-basis penalty. We make the additional assumption that the high-resolution k-space yhigh is obtained with only 2 averages, hence it has low metabolite SNR while having a rapid acquisition time, and that the low-resolution ylow is acquired with multiple averages to yield decent metabolite SNR. The combined image xdual is then formed by the application of Eqs. 1 and 2. Imposing lipid-basis penalty on xdual yields the final result,
| (Eq.4) |
where ydual = Fhighxdual is the k-space representation of the high-resolution combined image and xbasic is the artifact-suppressed spectra obtained with the first proposed method. In this case, Ldual contains the lipid spectra collected from the combined image xdual. After masking xdual to retain only the lipid ring voxels, each lipid spectrum is assigned to be a column of the lipid-basis matrix Ldual. This way, the lipid-basis is formed by using the high-frequency lipid information present in the combined image xdual.
The Refined Method: Combining 2-average, undersampled high-resolution data with high SNR, low-resolution data
Differently from the first method, yhigh now represents undersampled, 2-average, high-resolution k-space data. Owing to the fact the lipid layer is sparse in both spatial and spectral domains, we propose to estimate it using the sparsity-enforcing, iteratively reweighted least-squares algorithm, FOCUSS (18): For iteration number t = 1, … T,
| (Eq.5) |
| (Eq.6) |
| (Eq.7) |
Here, Wt is a diagonal weighting matrix whose jth diagonal entry is denoted as is the lipid layer estimate at iteration t whose jth entry is and MΩ is the undersampling mask in (kx, ky, kf). Masking out the background yields the final lipid image estimate, . Now, the combined image is formed using the compressed sensing-estimated lipid image,
| (Eq.8) |
and iterative lipid-basis reconstruction is applied as
| (Eq.9) |
to yield the artifact-suppressed image xrefined. Here, is the k-space representation of the combined image is the lipid-basis matrix collected from the compressed sensing reconstructed combined image. In other words, lipid ring voxels in the combined image are selected with masking, then each lipid spectrum is assigned to be a column of the lipid-basis matrix . Hence, the lipid-basis is formed by the lipid spectra in the compressed sensing reconstructed image, .
Methods
A healthy volunteer was scanned at a Siemens 3T scanner using 32-channel receive coil with high spatial resolution, single-slice, constant density spiral CSI (voxel size = 0.16 cc, FOVxy = 24 cm, slice thickness = 1cm, TE = 50 ms, TR = 2 s, number of averages = 20, acquisition time = 33 min, CHESS pulse applied for water suppression, PRESS-box excites entire FOV, including the skull). While the large number of averages at such high resolution made the total scan time significantly long, it enabled the reconstruction of the artifact suppressed gold-standard image. At the scanner, this spiral acquisition was coil-combined after being gridded onto a Cartesian grid, on which all subsequent processing was performed. The final gridded matrix size was (x,y,f) = (64,64,512). To reduce processing times, only the frequencies beyond the water peak were reconstructed. Lipid layer and brain masks (Mlipid,Mbrain) were generated manually based on the high-resolution CSI image. In particular, projection of the CSI image over the lipid frequencies served as a guide in determining the lipid mask. Additional data were collected by using a 9×9 cm2 PRESS-box to excite the interior of the brain (voxel size = 0.5 cc, number of averages = 20, acquisition time = 11 min, with water suppression), and outer-volume suppression bands were placed around the skull to null the lipid signals.
Next, we detail and enumerate the lipid suppression methods that were applied to the in vivo data:
Lipid-basis penalty method: A low-resolution, 20-average CSI k-space ylow was generated by sampling only the center 32-pixel diameter in kx-ky plane corresponding to the operator Flow. The voxel size of this low-resolution image was 0.56 cc (with 1cm slice thickness), corresponding to a 10 min scan. This image was then processed using the lipid-basis penalty method (16).
Gold-standard reconstruction: To obtain the gold-standard spectra, a lipid image was obtained from the high-resolution 20-average data which was masked with Mlipid to retain only the lipid ring, and then combined with the low-resolution 20-average CSI image as per the dual-density approach (11–13) in Eq. 2 and iterative reconstruction with lipid-basis penalty (16) was applied to this combined image to yield the gold-standard spectra.
The basic method: For this method, masked high-resolution lipid image was obtained from 2-average high-resolution data, and combined with the low-resolution 20-average CSI image. Lipid basis penalty reconstruction was then applied to this combined image.
The refined method: Here, the high-resolution lipid image was estimated from significantly undersampled 2-average data. In addition to the fully sampled center 32-pixel diameter k-space, the peripheral k-space region was substantially undersampled (Rhigh = 10). In particular, Cartesian undersampling was applied to the gridded data in all 3-dimensions by generating a randomly-undersampled kx-ky sampling mask at each kf sample. High-resolution lipid image was reconstructed with the FOCUSS algorithm (18) using the undersampled k-space data. This lipid layer estimate was then combined with the low-resolution CSI image, and lipid basis penalty was applied to further reduce the ringing artifacts.
Dual-density method: Finally, the dual density method (11–13) was applied without using lipid-basis penalty, by obtaining a masked high-resolution lipid image obtained from 2-average high-resolution data, and combining it with the low-resolution 20-average CSI image.
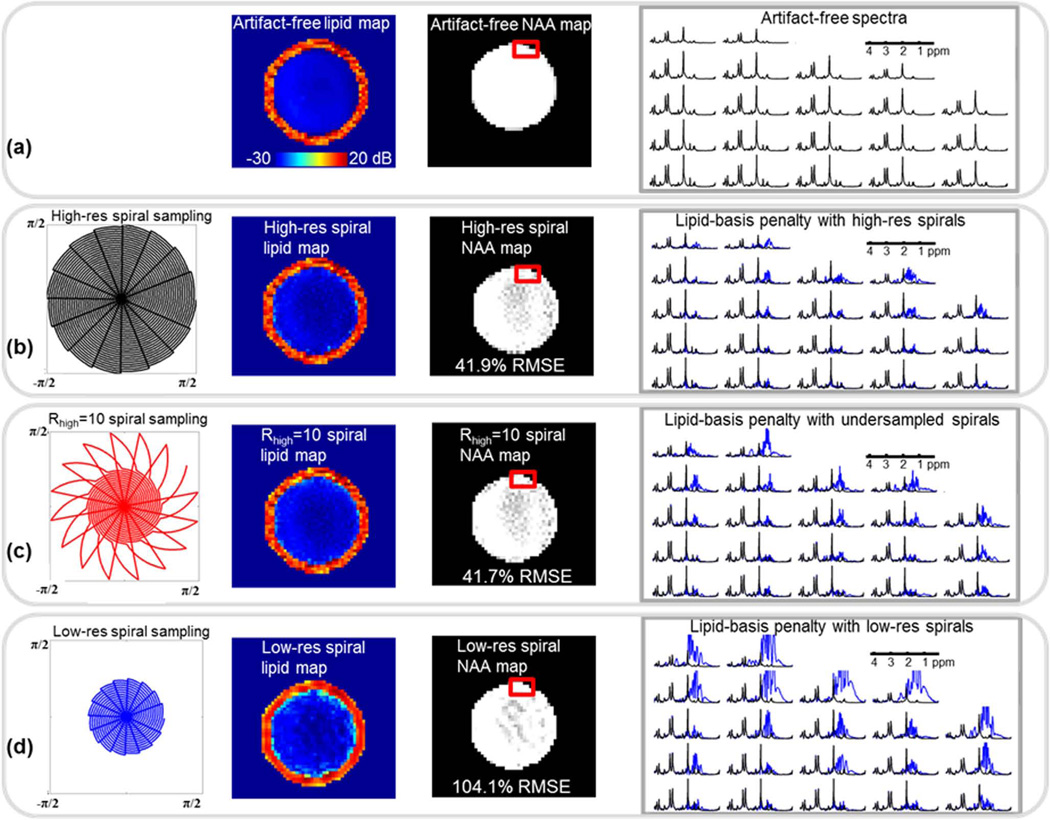
To provide a more practical undersampling example, a synthetically generated phantom was also studied. A Cartesian CSI phantom was formed by using metabolite data from a spectroscopic phantom scanned at 3T with a voxel size of 0.16 cc, and surrounding the phantom with in vivo lipid spectra sampled from the 20-average, 0.16 cc human subject dataset (Fig. 7). Hence, the metabolite spectra in the numerical phantom are derived from a spectroscopic phantom where no lipids are present, resulting in metabolite signals free of any lipid contamination. Also, each lipid spectrum in the lipid layer of the numerical phantom is unique and comes from an in vivo acquisition where spatial variations of lipids occur naturally. No synthetic noise was added to the numerical phantom, the only noise present is due to the acquisition of the source signals. The peak-to-peak NAA – lipid amplitude ratio was selected to be 1:100. Since the Cartesian phantom demonstrates no lipid ringing artifacts by design, it also serves as the gold-standard image. First, a constant density spiral sampling pattern at Nyquist rate was generated using time-optimal gradient design toolbox (20), from which spiral k-space data was generated using the Non-Uniform FFT (NUFFT) toolbox (21). Artifact suppression with lipid-basis penalty was applied to obtain a high-resolution lipid-suppressed image based on the spiral k-space samples. Second, a variable-density spiral trajectory with Nyquist rate sampling in the first half of the k-space, and undersampling with Rhigh = 10 in the second half of the k-space was generated. High-resolution lipid image estimate was generated using FOCUSS algorithm with NUFFT based on the undersampled spiral data. Next, a combined image was formed using the high-resolution lipid estimate and the fully-sampled portion of the k-space iteratively. Lipid-basis penalty was applied to yield an artifact suppressed image. Finally, a low-resolution image was generated by using only the first of the spiral k-space, which was then processed with the lipid-basis penalty. The Cartesian image without artifacts serves as a substitute for the gold-standard in vivo reconstruction, the Nyquist-rate sampled spiral data represent the in vivo basic method reconstruction, and the undersampled spiral data stand for the in vivo refined reconstruction. Likewise, the low-resolution spiral image is intended to represent the low-resolution in vivo image with lipid-basis penalty.
Fig. 7.
Lipid and NAA maps and artifact-free spectra for the Cartesian synthetic phantom are shown in (a). In (b), spiral sampling trajectory at Nyquist rate and reconstruction results upon the application of lipid-basis penalty are depicted. Using the undersampled spiral trajectory in (c), a high-resolution lipid image was estimated using FOCUSS, from which a combined image was computed due to the dual-density method. Finally, lipid-basis penalty was applied to this combined image. Panel (d) shows lipid suppression results when the k-space is sampled only at half of the full resolution and lipid-basis penalty is applied. For the three reconstruction methods, the example spectra (plotted in blue) belong to the region of interest marked with the red box, and are overplotted with the artifact-free spectra (in black) for comparison.
Choosing an Optimal Regularization Parameter
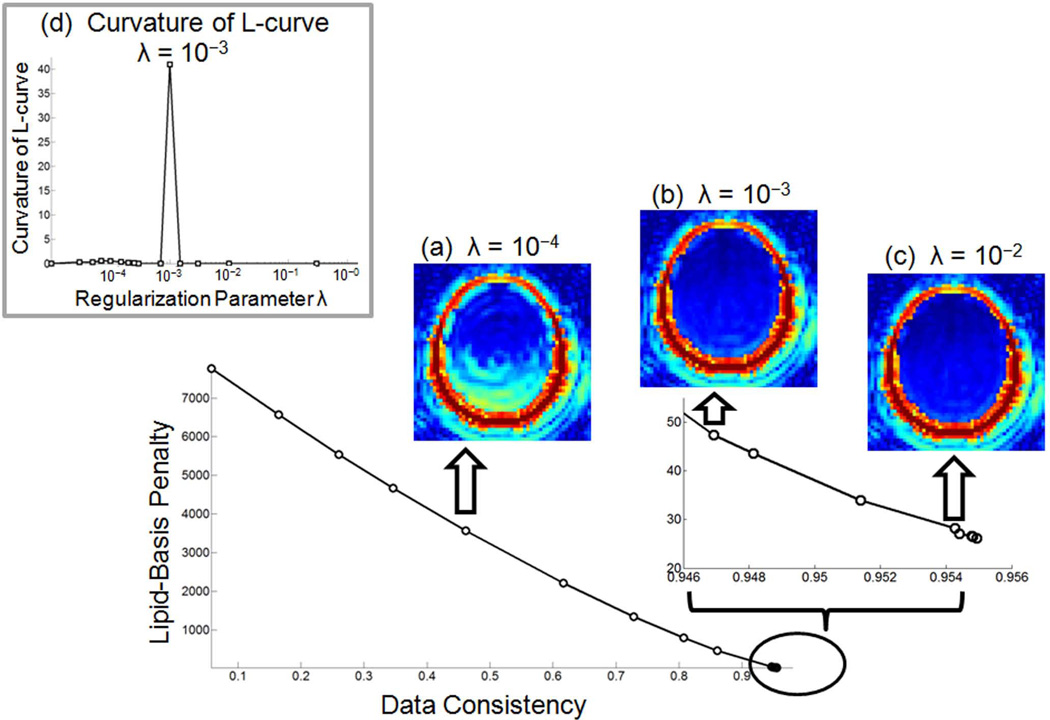
To choose an optimal regularization parameter λ for the lipid-basis penalty that balances the data consistency and artifact suppression, the L-curve approach was employed (22) for the in vivo study. After running the iterative reconstruction to compute the gold-standard image for several different regularization parameters, the resulting data consistency ∥Fhighxgold − ydual∥2 and lipid-basis norms traced a curve from which the data point with the largest curvature was chosen to be the optimal λ. Analytical curvature computation became possible by expressing the data consistency and lipid-basis penalty as functions of λ by cubic spline fitting. The optimal value of λ = 10−3 that is determined from the gold-standard dataset was then used for all iterative reconstructions in this work, where the optimization problems were solved using the conjugate gradient algorithm (19). Fig. 1 depicts the resulting L-curve and projections over the lipid frequencies for various λ values, as well as the curvature values at the sample points.
Fig. 1.
The L-curve traced by the data consistency and lipid-basis penalty terms as the regularization parameter λ varies. Summation over lipid frequencies for under-regularized (a), optimally regularized (b) and over-regularized reconstructions (c) are presented. Panel (d) depicts the analytically computed L-curve curvature results for the sample points.
In the phantom study, λ = 10−1 was taken to be the value of the regularization parameter for all of iterative reconstructions.
Results
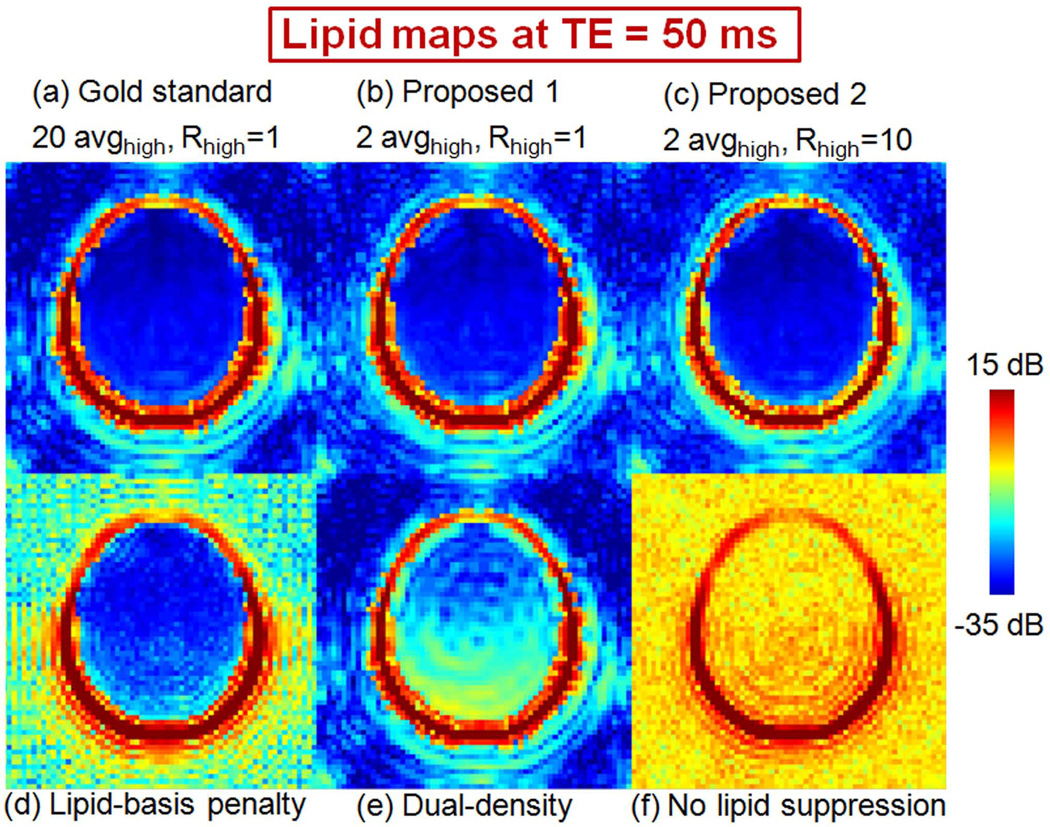
Artifact reduction performances of the five methods under evaluation, as well as spectra without any lipid suppression are compared by taking projections over the lipid resonance frequencies in Fig. 2. High-quality lipid images are obtained with the gold-standard (20 avghigh, Rhigh = 1, denoting that 20 averages of high-resolution data are used without peripheral k-space undersampling, shown in Fig. 1a), and the basic and refined methods (2 avghigh, Rhigh = 1 in Fig. 1b and 2 avghigh, Rhigh = 10 in Fig. 1c). Iterative reconstruction with lipid-basis penalty (16) also demonstrates substantial artifact reduction (Fig. 2d) while not being able to completely remove the ringing inside the brain. Using the dual-density approach (11–13) without lipid-basis penalty (Fig. 2e) provides partial artifact reduction relative to the low-resolution CSI image with no lipid suppression (Fig. 2f).
Fig. 2.
Comparing the different artifact reduction algorithms by taking projections over the lipid resonance frequencies (in dB scale). Gold standard reconstruction is obtained using 20 averages of high-resolution data without peripheral k-space undersampling (20 avghigh, Rhigh = 1, shown in (a)), while the basic proposed method is obtained using 2 averages of high-resolution data without undersampling (2 avghigh, Rhigh = 1, shown in (b)) and the refined proposed method uses 10-fold undersampled, 2 average high-resolution data (2 avghigh, Rhigh = 10, shown in (c)). Lipid suppression results obtained by using only lipid-basis penalty method and only dual-density approach are depicted in panels (d) and (e), respectively. Applying no lipid suppression (f) results in severely corrupted spectra.
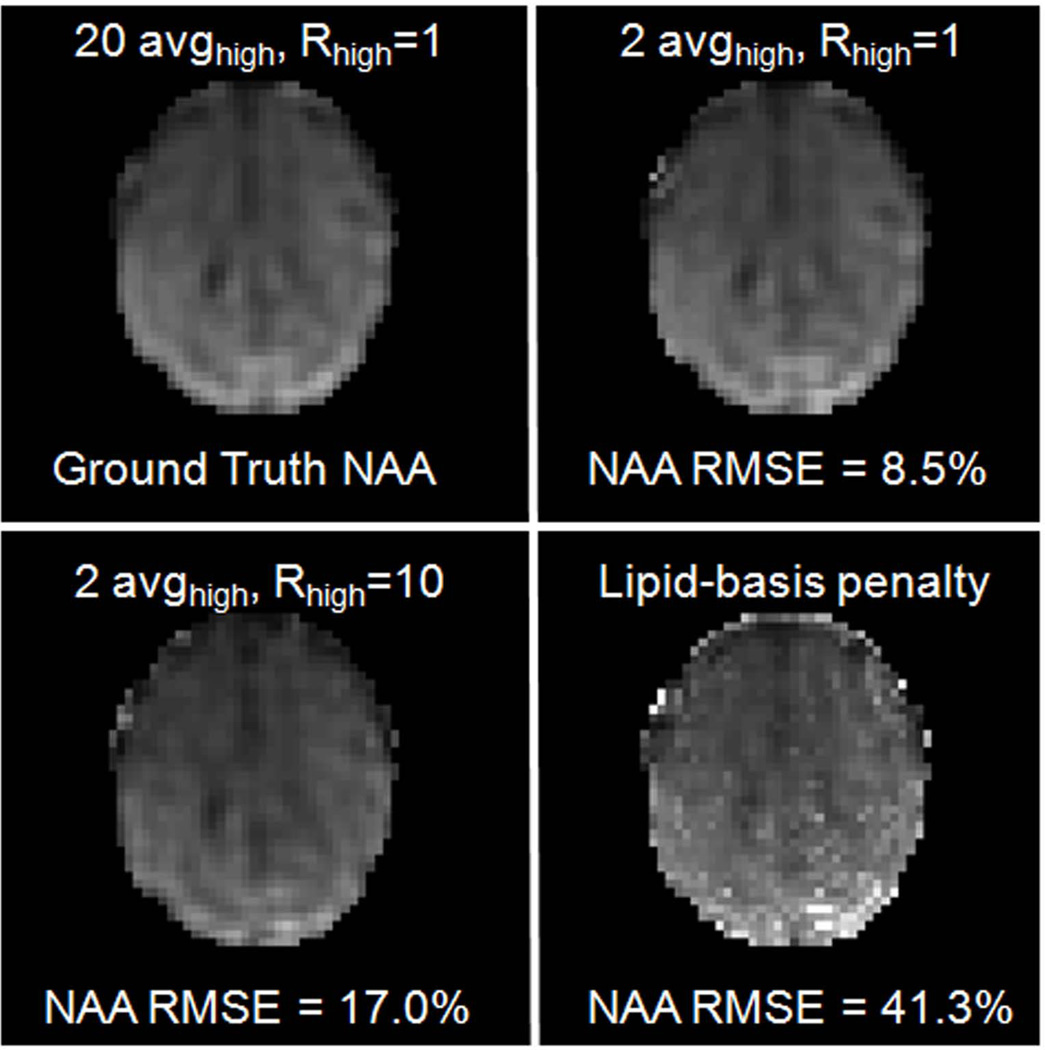
Fig. 3 validates the observation seen in Fig. 2 in terms of normalized root-mean-square error (NRMSE) by comparing the lipid-basis penalty algorithm and the two proposed artifact reduction methods with the gold-standard NAA map. All maps are generated by simple integration of NAA peaks over a 37.5 Hz bandwidth. While the lipid-basis algorithm (16) has 41.3% error in the NAA maps relative to the gold-standard, the basic method (2 avghigh, Rhigh = 1) reduces the error by 4.9 times to yield 8.5% error, and the refined method (2 avghigh, Rhigh = 10) by 2 times to give 17.0% error relative to lipid-basis penalty approach.
Fig. 3.
Comparison between normalized root-mean-square error (NRMSE) values of NAA maps relative to the gold standard reconstruction.
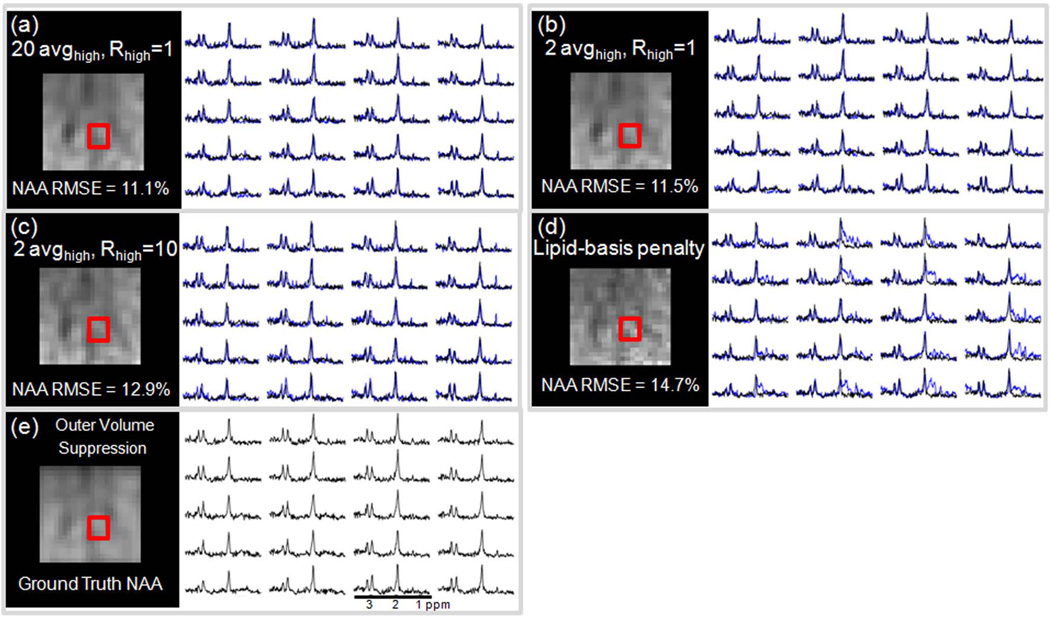
Fig.4 presents the NAA maps computed within the 9×9 cm2 excitation box used in the OVS acquisition. By taking the OVS NAA images as ground truth, the relative errors were found to be 11.1% for the gold-standard (20 avghigh, Rhigh = 1, shown in (a)), 11.5% for the basic (20 avghigh, Rhigh = 1, shown in (b)), 12.9% in the refined method (20 avghigh, Rhigh = 10, shown in (c)) and 14.7% in the NAA map produced by the lipid-basis penalty algorithm (shown in (d)). Reconstructed spectra are also overplotted with the OVS spectra for the four methods.
Fig. 4.
Comparison between normalized root-mean-square error (NRMSE) values of NAA maps computed within the 9×9 cm2 excitation box relative to the NAA maps obtained with the OVS method. In (a), reconstruction results obtained using the gold-standard (20 avghigh, Rhigh = 1) method (blue) and the OVS spectra (black) belonging to the region inside the red box are also overplotted. In (b), the basic proposed method (blue) and the OVS spectra are compared. The spectra obtained with the refined method (blue) and the OVS results (black) are overplotted in (c). Lipid-basis penalty and OVS spectra are compared in (d).
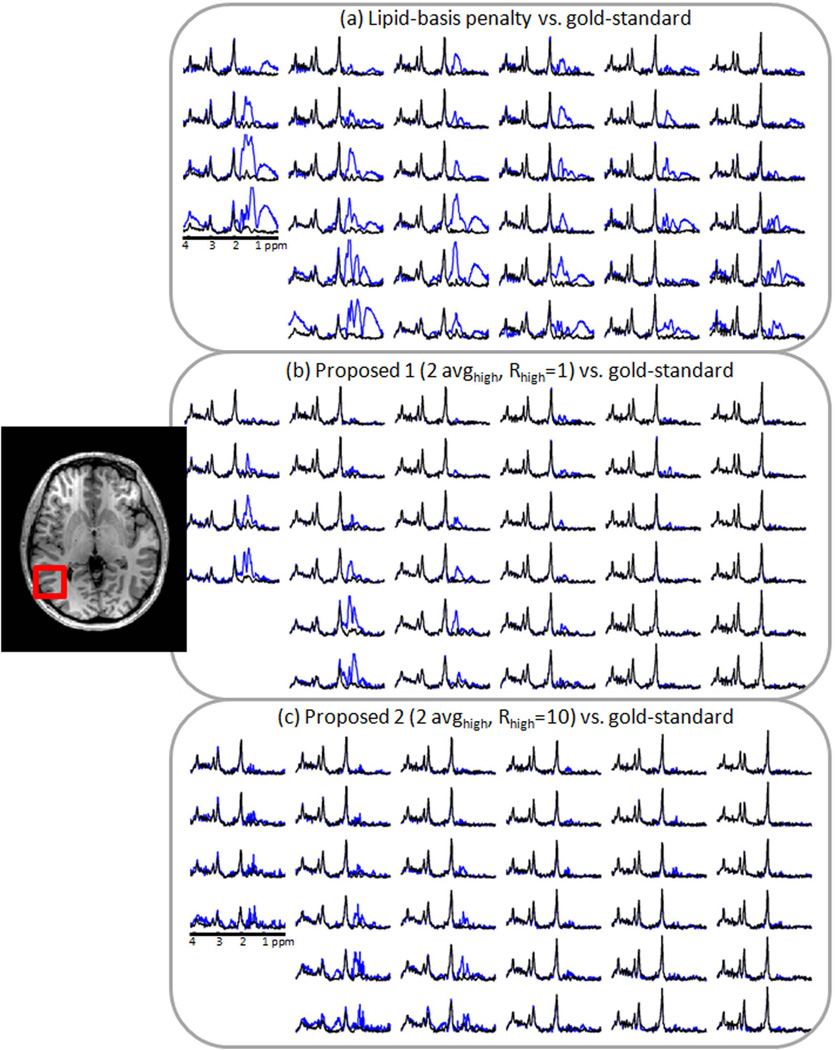
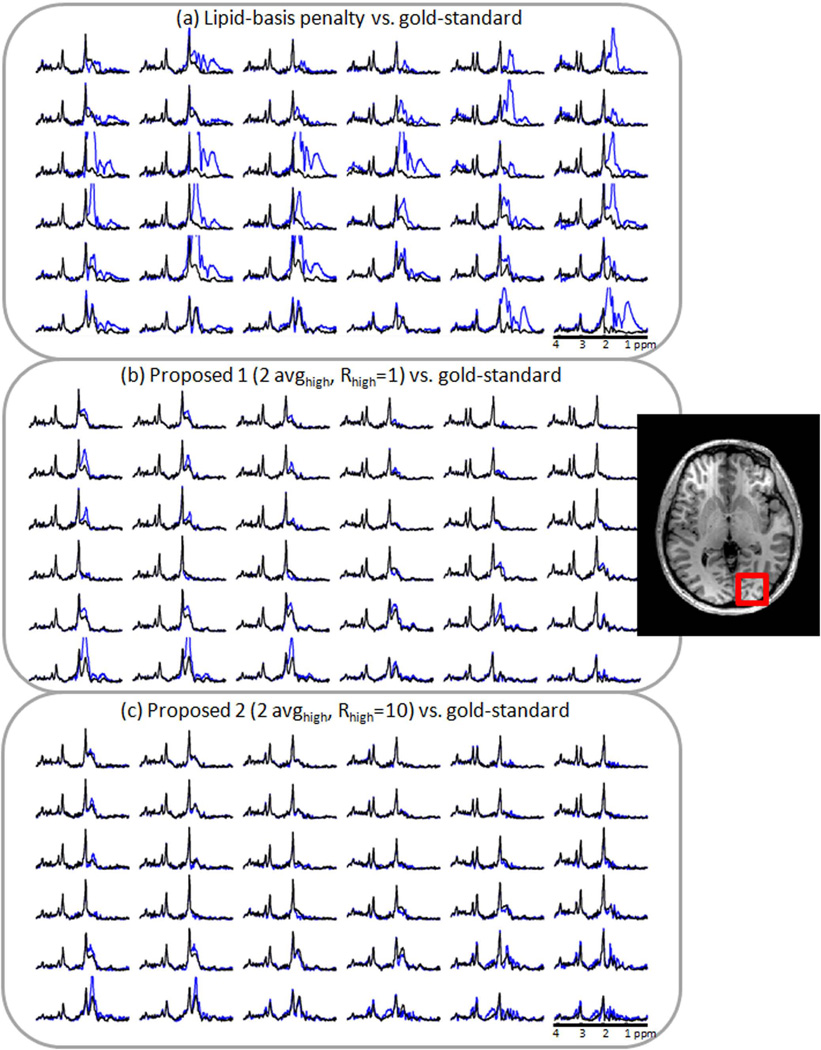
Figs. 5 and 6 show the performances of the lipid-basis algorithm (16), the proposed methods and the gold-standard reconstruction by comparing representative spectra in the vicinity of two sides of the skull. Panels a, b and c in Figs. 5 and 6 overplot the spectra from the gold-standard with lipid-basis method (16), the basic method (2 avghigh, Rhigh = 1) and the refined method (2 avghigh, Rhigh = 10), respectively.
Fig. 5.
Comparison of spectra inside the region of interest marked with the red box that were obtained with different lipid suppression methods. In (a), reconstruction results obtained using lipid-basis penalty method (blue) and the gold-standard reconstruction (black) are overplotted. In (b), the basic proposed method (blue) and the gold-standard spectra are presented. The spectra obtained with the refined method (blue) and the gold-standard results (black) are plotted in (c).
Fig. 6.
Comparison of spectra inside the region of interest marked with the red box that were obtained with different lipid suppression methods. Panel (a) overplots reconstruction results using lipid-basis penalty method (blue) and the gold-standard reconstruction (black). In (b), the basic proposed method (blue) and the gold-standard spectra are compared. The spectra obtained with the refined method (blue) and the gold-standard results (black) are depicted in (c).
Lipid suppression experiment performed with the synthetic phantom is depicted in Fig. 7. Panel a depicts the NAA and lipid maps from the Cartesian, artifact-free phantom and includes spectra free of contamination. In panel b, lipid-basis penalty is applied to the phantom that was sampled on a spiral trajectory at Nyquist rate, to yield 41.9% error in the NAA map. In c, lipid suppression results with undersampled spiral trajectory are presented. In this case, NAA map was recovered with 41.7% error. Panel d depicts the performance of lipid-basis penalty method when the k-space was sampled at half of the full resolution to yield 104.1% NRMSE in the NAA map.
The total reconstruction time for the in vivo dataset was 7 min for the iterative lipid-basis penalty algorithm and 4 min for compressed sensing reconstruction of the high-resolution lipid image with the FOCUSS algorithm on a workstation running Matlab with 48 GB memory and 12 processors.
Discussion
The dual-density method makes use of the fact that subcutaneous lipid signals have several orders of magnitude higher amplitudes than the brain metabolites, which enables their estimation from single-average, high-resolution data. In this study, the high-resolution lipid images had a voxel size of 0.16 cc, while the previous implementations of the dual-density method enjoyed a smaller voxel size (128×128 matrix size in (13) and 0.076 cc voxels with 128×128 matrix size in (11)). Naturally, the dual-density method is expected to perform better with increased lipid image resolution, however at the cost of increased scan time. Since the dual-density idea constitutes an important part of our proposed methods, their performances are also expected to increase when even higher resolution lipid priors are available. The optimal selection of the high-resolution voxel size to balance the impact on total scan time and lipid artifact reduction remains an open problem.
In the current work, selection of the lipid mask was performed manually, with the guidance of the projection over lipid resonance frequencies. The brain mask was then assigned to be region remaining inside the lipid mask. A more elegant approach can involve a pilot structural scan acquired at the same resolution as the lipid image, which can be then segmented (e.g. using FreeSurfer (23)) to yield the skull and brain regions. A similar idea was also implemented in (16).
A similar approach that also restricts the space in which the metabolite signals reside is by Eslami and Jacob (24), where the spectrum at each voxel is parameterized as a sparse linear combination of spikes and polynomials to capture the metabolite and baseline components, respectively. Their elegant method is a holistic framework that performs field map compensation, noise reduction and lipid artifact reduction simultaneously. In particular, their lipid suppression performance was seen to be comparable with extrapolation methods (15). Our proposed methods involve no parametric signal modeling, but they simply minimize projection onto lipid spectra. Hence, it might be possible to combine Eslami and Jacob’s method synergistically with our proposed schemes to further refine the metabolite spectra.
The L-curve analysis employed for selecting an optimal regularization parameter λ revealed that the operating points on the curve map virtually to the same point for a wide range of parameters (Fig. 1). In particular, the data consistency increases only 0.05 % and the regularization decreases only 3.8 % as λ increases from 10−2 to 102. Hence, if a slightly over-regularized reconstruction is acceptable, the selection of λ does not pose a problem as the reconstruction results are insensitive to its selection.
From a sequence design point of view, the 3-dimensional Cartesian undersampling pattern used in the in vivo dataset will not be feasible within the spiral CSI framework, as the samples were randomly removed in the Cartesian k-space of the gridded CSI data. Our current work involves designing undersampled trajectories that will make the refined method feasible for in vivo acquisitions (25).
Lipid suppression results obtained with the synthetic phantom demonstrates the feasibility of spiral undersampling. Relative to the conventional, low-resolution spiral reconstruction in Fig. 7d, the example spectra obtained with undersampled spirals in Fig. 7c exhibit substantially reduced lipid ringing artifacts in the vicinity of the lipid ring. Relative to the Nyquist rate spiral reconstruction, compressed sensing reconstruction with 10-fold accelerated spirals yielded comparable NAA maps and spectra. While the current work focused on undersampled spiral trajectory, other families of readout trajectories can be deployed in the proposed scheme, e.g. a trajectory that continues along the tangent of the spiral at the end of the low-resolution k-space (spiral+radial).
In vivo reconstructions at TE = 50 ms with the basic and refined methods exhibit successful artifact suppression in the cortical region (Figs. 5 and 6). Relative to the gold-standard reconstruction (20 avghigh, Rhigh = 1) corresponding to a 33 min scan, the proposed methods yielded comparable NAA maps (Fig. 3) with substantial savings in the imaging time. While using the lipid-basis penalty at 0.56 cc voxel size (corresponding to a 10 min scan) gives effective lipid suppression, the presence of residual lipid artifacts is visible in the lipid and NAA maps (Figs. 2 and 3) and the cortical spectra (Figs. 5 and 6).
For additional validation, the reconstruction methods were also compared with a commercially available lipid suppression method, OVS. Taking the NAA maps obtained with OVS as ground truth, the four methods, namely, gold-standard (20 avghigh, Rhigh = 1), basic (2 avghigh, Rhigh = 1) refined (20 avghigh, Rhigh = 10) and lipid-basis penalty, yielded similar fidelity where the gold-standard gave the smallest error (11.1%) and the lipid-basis penalty method had the largest mismatch (14.7%). Since the OVS method is obtained by exciting a 9×9 cm2 box inside the brain surrounded by suppression bands to null the lipid signal, the comparison is limited to the interior of the brain where the lipid ringing artifacts are milder than the periphery of the cortex. It is seen that the spectra reconstructed with the lipid-basis method still demonstrate residual artifacts while the proposed methods are free of lipid ringing (Fig. 4). To compute the RMSEs relative to the NAA map obtained from the OVS acquisition, all methods were masked in k-space to match the resolution of the OVS scan and the mean intensities of the NAA images were scaled to match the mean intensity of the OVS map.
Relative to the lipid-basis penalty method (16), the drawback of the proposed basic algorithm is the additional scan time required for collecting the peripheral k-space information. The refined method addresses this problem by aggressively undersampling the high k-space and exploiting the spatial and spectral sparsity of the lipid ring. While this entails an additional iterative reconstruction step for the FOCUSS (18) algorithm, the computational requirements of the refined method is not prohibitive for in vivo applications, taking only 11 min of processing time on a workstation.
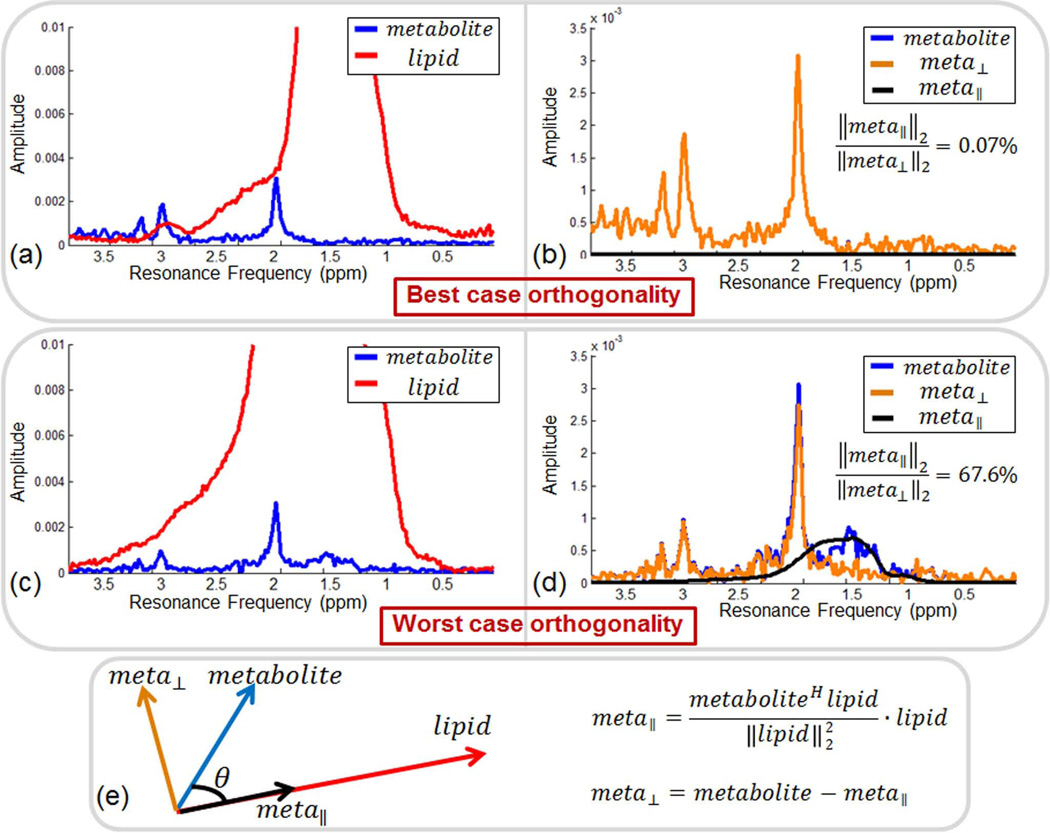
The validity of the approximation that lipid and metabolite spectra are orthogonal is demonstrated in Fig. 8. All lipid spectra inside the lipid mask were selected from the 33 min, 20 average in vivo scan (578 lipid spectra in total), and all metabolite spectra were chosen from the in vivo OVS acquisition (521 metabolite spectra in total). For each lipid spectrum, the parallel and orthogonal components of each metabolite spectrum were computed. Based on this, the worst and best case situations were identified, where the ratio of energy in the parallel and orthogonal components were highest and lowest, respectively. Fig. 8a overplots the lipid and metabolite spectra in the best case scenario. Even though the NAA peak completely overlaps with the lipid signal in resonance frequency, the component of the metabolite spectra parallel to the lipid signal has almost no energy compared to the orthogonal component. Fig. 8c shows the worst case scenario for the lipid and metabolite spectra with the least degree of orthogonality. In this case, parallel and orthogonal components have comparable signal energy. When averaged over all lipid and metabolite spectra, the ratio of parallel component energy to orthogonal component energy was 15.6%, showing that the orthogonality assumption is a reasonable one in practice.
Fig. 8.
Demonstration of approximate orthogonality between metabolite spectra obtained from in vivo OVS scan and lipid spectra from high resolution in vivo acquisition. In (a), the lipid and metabolite spectra with the highest orthogonality are plotted. In (b), the components of the metabolite spectrum that are orthogonal and parallel to the lipid spectrum for the best case in (a) are overplotted. The actual metabolite spectrum (in blue) is totally occluded by the orthogonal component (in orange). In (c), the lipid and metabolite spectra that are least orthogonal are depicted. In (d), the orthogonal and parallel components of the metabolite spectrum are overplotted for the worst case in (c). Panel (e) depicts the methodology used in computing the orthogonal and parallel metabolite components.
Limitations of this study include that,
No B0-correction was employed in post-processing, but simply the data acquired at the scanner were used as input to the proposed lipid suppression methods. Therefore, more refined metabolite images can be obtained when local B0 shifts are taken into account, e.g. Fig. 2 in (26) and Fig. 3 in (5).
The practical implementation of the dual-density method is considerably challenging, but this has been addressed adequately by previous investigators, e.g. (11,13). Similarly, practical realization of prospective undersampling with spiral readout is challenging.
Conclusions
The proposed lipid suppression algorithms combine and extend two previously proposed approaches, dual-density sampling and lipid-basis orthogonality, with minimal increase on the total scan time by collecting only 2-average high-resolution data and aggressive undersampling (R = 10) of high frequency k-space. We demonstrated successful in vivo lipid-suppression performance with artifact-free observation of metabolite spectra even in the peripheral cortical regions without any other means of lipid suppression during acquisition at TE = 50 ms.
Acknowledgements
Grant sponsor: National Institutes of Health; grant number: NIH R01 EB007942
Grant sponsor: National Science Foundation; grant number: 0643836
Siemens Healthcare (The Siemens-MIT Alliance)
CIMIT-MIT Medical Engineering Fellowship
References
- 1.Duyn JH, Gillen J, Sobering G, van Zijl PC, Moonen CT. Multisection proton MR spectroscopic imaging of the brain. Radiology. 1993;188(1):277–282. doi: 10.1148/radiology.188.1.8511313. [DOI] [PubMed] [Google Scholar]
- 2.Le Roux P, Gilles RJ, McKinnon GC, Carlier PG. Optimized outer volume suppression for single-shot fast spin-echo cardiac imaging. J Magn Reson Imaging. 1998;8(5):1022–1032. doi: 10.1002/jmri.1880080505. [DOI] [PubMed] [Google Scholar]
- 3.Luo Y, de Graaf RA, DelaBarre L, Tannus A, Garwood M. BISTRO: an outer-volume suppression method that tolerates RF field inhomogeneity. Magn Reson Med. 2001;45(6):1095–1102. doi: 10.1002/mrm.1144. [DOI] [PubMed] [Google Scholar]
- 4.Bydder GM, Young IR. MR imaging: clinical use of the inversion recovery sequence. J Comput Assist Tomogr. 1985;9(4):659–675. [PubMed] [Google Scholar]
- 5.Ebel A, Govindaraju V, Maudsley AA. Comparison of inversion recovery preparation schemes for lipid suppression in 1H MRSI of human brain. Magn Reson Med. 2003;49(5):903–908. doi: 10.1002/mrm.10444. [DOI] [PubMed] [Google Scholar]
- 6.Spielman DM, Pauly JM, Macovski A, Glover GH, Enzmann DR. Lipid-suppressed single- and multisection proton spectroscopic imaging of the human brain. J Magn Reson Imaging. 1992;2(3):253–262. doi: 10.1002/jmri.1880020302. [DOI] [PubMed] [Google Scholar]
- 7.Spielman D, Meyer C, Macovski A, Enzmann D. 1H spectroscopic imaging using a spectral-spatial excitation pulse. Magn Reson Med. 1991;18(2):269–279. doi: 10.1002/mrm.1910180203. [DOI] [PubMed] [Google Scholar]
- 8.Bottomley PA. Spatial localization in NMR spectroscopy in vivo. Ann N Y Acad Sci. 1987;508:333–348. doi: 10.1111/j.1749-6632.1987.tb32915.x. [DOI] [PubMed] [Google Scholar]
- 9.Adalsteinsson E, Star-Lack J, Meyer CH, Spielman DM. Reduced spatial side lobes in chemical-shift imaging. Magn Reson Med. 1999;42(2):314–323. doi: 10.1002/(sici)1522-2594(199908)42:2<314::aid-mrm14>3.0.co;2-x. [DOI] [PubMed] [Google Scholar]
- 10.Lee J, Adalsteinsson E. Algorithm for Lipid Suppression by Real-Time Isotropic Filter Design in Spectroscopic Brain Imaging. International Society for Magnetic Resonance in Medicine 20th Scientific Meeting; 2011. p. 1419. [Google Scholar]
- 11.Sarkar S, Heberlein K, Hu X. Truncation artifact reduction in spectroscopic imaging using a dual-density spiral k-space trajectory. Magn Reson Imaging. 2002;20(10):743–757. doi: 10.1016/s0730-725x(02)00608-2. [DOI] [PubMed] [Google Scholar]
- 12.Hu X, Stillman AE. Technique for reduction of truncation artifact in chemical shift images. IEEE Trans Med Imaging. 1991;10(3):290–294. doi: 10.1109/42.97578. [DOI] [PubMed] [Google Scholar]
- 13.Metzger G, Sarkar S, Zhang X, Heberlein K, Patel M, Hu X. A hybrid technique for spectroscopic imaging with reduced truncation artifact. Magn Reson Imaging. 1999;17(3):435–443. doi: 10.1016/s0730-725x(98)00187-8. [DOI] [PubMed] [Google Scholar]
- 14.Plevritis SK, Macovski A. MRS imaging using anatomically based k-space sampling and extrapolation. Magn Reson Med. 1995;34(5):686–693. doi: 10.1002/mrm.1910340506. [DOI] [PubMed] [Google Scholar]
- 15.Haupt CI, Schuff N, Weiner MW, Maudsley AA. Removal of lipid artifacts in 1H spectroscopic imaging by data extrapolation. Magn Reson Med. 1996;35(5):678–687. doi: 10.1002/mrm.1910350509. [DOI] [PMC free article] [PubMed] [Google Scholar]
- 16.Lee J, Adalsteinsson E. Iterative CSI Reconstruction with High-Resoluiton Spatial Priors for Improved Lipid Suppression. International Society for Magnetic Resonance in Medicine 19th Scientific Meeting; 2010. p. 965. [Google Scholar]
- 17.Lustig M, Donoho D, Pauly JM. Sparse MRI: The application of compressed sensing for rapid MR imaging. Magn Reson Med. 2007;58(6):1182–1195. doi: 10.1002/mrm.21391. [DOI] [PubMed] [Google Scholar]
- 18.Gorodnitsky IF, Rao BD. Sparse signal reconstruction from limited data using FOCUSS: A re-weighted minimum norm algorithm. Ieee T Signal Proces. 1997;45(3):600–616. [Google Scholar]
- 19.Bertsekas DP. Nonlinear programming. xiv. Belmont, Mass.: Athena Scientific; 1999. p. 777. [Google Scholar]
- 20.Lustig M, Kim SJ, Pauly JM. A fast method for designing time-optimal gradient waveforms for arbitrary k-space trajectories. IEEE Trans Med Imaging. 2008;27(6):866–873. doi: 10.1109/TMI.2008.922699. [DOI] [PMC free article] [PubMed] [Google Scholar]
- 21.Fessler JA, Sutton BP. Nonuniform fast Fourier transforms using min-max interpolation. Ieee T Signal Proces. 2003;51(2):560–574. [Google Scholar]
- 22.Hansen PC. The L-Curve and its Use in the Numerical Treatment of Inverse Problems. Computational inverse problems in electrocardiology. 2000:119–142. [Google Scholar]
- 23.Segonne F, Dale AM, Busa E, Glessner M, Salat D, Hahn HK, Fischl B. A hybrid approach to the skull stripping problem in MRI. Neuroimage. 2004;22(3):1060–1075. doi: 10.1016/j.neuroimage.2004.03.032. [DOI] [PubMed] [Google Scholar]
- 24.Eslami R, Jacob M. Robust reconstruction of MRSI data using a sparse spectral model and high resolution MRI priors. IEEE Trans Med Imaging. 2010;29(6):1297–1309. doi: 10.1109/TMI.2010.2046673. [DOI] [PubMed] [Google Scholar]
- 25.Gagoski B, Bilgic B, Adalsteinsson E. Accelerated Spiral Chemical Shift Imaging with Compressed Sensing. International Society for Magnetic Resonance in Medicine 21st Scientific Meeting.2012. [Google Scholar]
- 26.Ebel A, Maudsley AA, Schuff N. Correction of local B0 shifts in 3D EPSI of the human brain at 4 T. Magn Reson Imaging. 2007;25(3):377–380. doi: 10.1016/j.mri.2006.09.004. [DOI] [PMC free article] [PubMed] [Google Scholar]


