

Abstract
Zinc (Zn2+) homeostasis plays a vital role in cell function, and the dysregulation of intracellular Zn2+ is associated with mitochondrial dysfunction. Few tools exist to quantitatively monitor the buffered, free Zn2+ concentration in mitochondria of living cells ([Zn2+]mito). We have validated three high dynamic range, ratiometric, genetically encoded, fluorescent Zn2+ sensors that we have successfully used to precisely measure and monitor [Zn2+]mito in several cell types. Using one of these sensors, called mito-ZapCY1, we report observations that free Zn2+ is buffered at concentrations about 3 orders of magnitude lower in mitochondria than in the cytosol, and that HeLa cells expressing mito-ZapCY1 have an average [Zn2+]mito of 0.14 pM, which differs significantly from other cell types. These optimized mitochondrial Zn2+ sensors could improve our understanding of the relationship between Zn2+ homeostasis and mitochondrial function.
Keywords: genetically encoded FRET sensor, zinc homeostasis, mitochondrial zinc
Zn2+ is a micronutrient that is required for human life, and deficiency can lead to impaired cognition, immune dysfunction, diarrhea, and death, particularly in children under the age of 5 years.1 Although Zn2+ is essential for cell function, accumulation of Zn2+ to toxic levels leads to cell death. The human genome encodes two-dozen Zn2+-specific transporters and many metal-buffering proteins, which are expressed in a tissue-specific manner.2 Our current understanding of Zn2+ homeostasis is that intracellular Zn2+ is distributed into a large pool of structural or catalytic Zn2+ that is tightly bound, and two smaller pools of Zn2+: free Zn2+ and exchangeable Zn2+ bound loosely to small molecule or protein partners.3,4 Zn2+ homeostasis can be altered in diseases, such as neurodegeneration. 5 In order to effectively study Zn2+ biology, we must be able to observe and manipulate Zn2+ specifically with subcellular resolution.
Cellular Zn2+ homeostasis affects mitochondrial function through poorly understood mechanisms. Zn2+ toxicity can lead to the release of cytochrome c from the intermembrane space, caspase activation, and apoptosis.6–8 Changes in Zn2+ availability can affect metabolism, including oxidative phosphorylation. 9,10 Intracellular Zn2+ can depolarize mitochondria and decrease mitochondrial movement.11–13 Lastly, it is likely that mitochondria are a source and sink of Zn2+ in neurons and other cells.3,14–16 To understand how Zn2+ homeostasis affects mitochondrial function, we must be able to measure and monitor mitochondrial Zn2+.
Few tools exist to observe mitochondrial Zn2+ homeostasis in living cells with high specificity. Small molecule fluorescent probes are arguably the most popular tools. FluoZin-3 increases in intensity upon binding Zn2+ and has been used to observe free Zn2+ in isolated mitochondria.17,18 Positively charged probes, such as RhodZin-3, concentrate within mitochondria of intact cells due to the negative mitochondrial inner membrane potential (Δψm).17,19 Consequently, it is problematic to monitor Zn2+ in depolarized mitochondria using such probes because a decrease in fluorescence intensity could be caused by either a decrease in Zn2+ or in Δψm. Other mitochondrial sensors consist of both a small molecule fluorophore and a protein component, which can be genetically targeted to mitochondria. This approach was used to target the fluorescent Zn2+ probe Zinpyr1 to mitochondria,20 and to exclusively express an excitation ratiometric Zn2+ sensor derived from carbonic anhydrase in mitochondria.21 Other genetically encoded Zn2+ sensors, such as the eCALWY family, have not yet been targeted to mitochondria.22 Our group previously constructed mito-ZifCY1 (renamed from mito-Cys2His2), a genetically encoded, ratiometric, Zn2+-specific sensor targeted to mitochondria, but its measurements are limited by its small dynamic range.14
In this study, we show that increasing the dynamic range of genetically encoded Zn2+ sensors improves their precision. We make novel comparisons of the [Zn2+]mito of different cell types using improved sensors. We find [Zn2+]mito is about 3 orders of magnitude lower than the cytosolic free Zn2+ concentration and varies considerably among different cell types.
Results and Discussion
Sensor Design and Validation
The Zn2+ sensors constructed in this study are variants of previously published cytosolic ZapCY1 and ZifCY1 sensors (Figure 1, panel a, Supplementary Figure 1, Tables 1 and 2), which respond specifically to Zn2+ over other biologically relevant divalent cations, including calcium, magnesium, iron, and copper.14,23 The conformational change upon Zn2+ binding changes the Forster resonance energy transfer (FRET) efficiency, and thus the sensor’s fluorescence emission reports the proportion of bound sensor. We report the magnitude of FRET as the FRET ratio (R), which is the fluorescence intensity of the acceptor fluorescence protein (FP) divided by that of the donor FP when only the donor FP is excited. Estimation of free Zn2+ is possible when the sensor’s affinity for Zn2+ is known and an in vivo sensor calibration is performed. Importantly, these sensors cannot estimate total Zn2+.
Figure 1.

Design of genetically encoded mitochondrial Zn2+ sensors mito-ZapCY1 and mito-ZifCY1. a) These sensors undergo a conformational change upon binding Zn2+, which leads to a change in FRET. The Zn2+-binding domain used in the “Zap” and “Zif” sensors consists of the first two Zn2+ fingers of the Saccharomyces cerevisiae protein Zap1, and the Zn2+ finger from the mammalian protein Zif268, respectively. The mitochondria targeting sequence (MTS) is appended to the N-terminus of the sensor. b) mito-ZapCY1 colocalizes with MitoTracker Red in living HeLa cells; Pearson’s coefficient 0.938; scale bars represent 10 μm. c) The fractional saturation of the sensor mito-ZapCY1 was determined in HeLa cells by measuring R (at rest), Rmin, and Rmax. d) The in situ KD′ of mito-ZapCY1 was determined in HeLa cells at pH 7.4 and 8.0. Each point represents the average (R−Rmin) of at least 3 cells in a single experiment at a specific free [Zn2+].
In order to identify an improved mitochondrial Zn2+ sensor, several new sensors were constructed with different Zn2+ binding domains. Details of sensor design are included in Supplemental Methods. Specifically, we sought to identify sensors that have an appropriate affinity (KD′) for Zn2+ allowing detection of both decreases and increases in Zn2+ concentration and with an improved dynamic range (defined as the maximum R (Rmax) divided by the minimum R (Rmin)). In most cases, the Zn2+-saturated sensor reports Rmax and Zn2+-free sensor reports Rmin, but some display inverted responses. 22 Measurement of Rmax and Rmin was achieved by performing in situ calibrations of single HeLa cells expressing each sensor (Figure 1, panel c). In a typical in situ calibration, R is measured in living cells treated with 150 μM of the Zn2+ chelator N, N, N′, N′-tetrakis-(2-pyridylmethyl)-ethylenediamine (TPEN), followed by 0.75 μM pyrithione (a Zn2+ ionophore) and 10 μM ZnCl2. These calibrations are performed on single cells because the fractional saturation ((R−Rmin)/(Rmax−Rmin)) varies less than Rmin and Rmax from cell to cell (Supplementary Table 4). We also hoped to identify partially saturated sensors, which are best for quantitative measurements. Supplementary Table 3 reports the dynamic range and fractional saturation of all the sensors tested and reveals mito-ZapCY1 as a robust sensor with a resting fractional saturation of 8.7±5.8% and the current largest dynamic range of 3.2, significantly better than the previously reported mito-ZifCY1 sensor,14 which has a dynamic range of 1.2 (Supplementary Figure 3).
Sensors were targeted to the mitochondrial matrix by appending an N-terminal mitochondrial targeting sequence, and they display excellent co-localization with MitoTracker Red in HeLa cells (Figure 1, panel b) and other cells tested (Supplementary Figure 2).
Estimates of mitochondrial free Zn2+ in HeLa cells based on mito-ZapCY1 dramatically differ from those based on mito-ZifCY1. Using mito-ZifCY1 (in vitro ZifCY1 KD′ = 1.7±0.2 μM), we previously observed a fractional saturation of ~41%, identical to what we observe in the present study (Supplementary Table 3) leading to an estimate of [Zn2+]mito of 680±140 nM in HeLa cells. In contrast, measurements using mito-ZapCY1 (in vitro ZapCY1 KD′ = 2.53 pM, pH 7.4) estimate a [Zn2+]mito of 0.22 pM in HeLa cells. We hypothesized that the poor dynamic range of mito-ZifCY1 (Supplementary Figure 3) results in unreliable estimates of [Zn2+]mito and set out to improve its dynamic range. Circular permutation of FPs, which involves relocating the N-and C-termini to different loops, has been shown to impact the dynamic range of FRET sensors by changing the orientation of the two FPs (Figure 2, panel a).24–26 We screened 5 variants of circularly permuted Venus (cpV), each permuted at a different location, within the framework of mito-ZifCY1. Figure 2 presents the dynamic range and fractional saturation of these sensors and Supplementary Figure 4 presents representative calibration traces. The 5 variants yielded significantly different fractional saturation and dynamic ranges, resulting in two sensors with increased dynamic ranges, which were named mito-ZifCV1.49 and mito-ZifCV1.173, where the “49” denotes that Venus was circularly permuted at amino acid position 49. The high dynamic ranges of mito-ZifCV1.49 and mito-ZifCV1.173, which display inverted responses to Zn2+, result from increased FRET in the unbound state and little change in FRET in the Zn2+-bound state. We found that the fractional saturation decreases as the dynamic range increases, even though the Zn2+ binding domains are identical. It has been demonstrated that incorporation of cpV can decrease the KD′ 2–10-fold,25 but even variation of the KD′ cannot explain the strong correlation between the fractional saturation and dynamic range, suggesting that as hypothesized, measurements made using low dynamic range sensors can be inconsistent.
Figure 2.
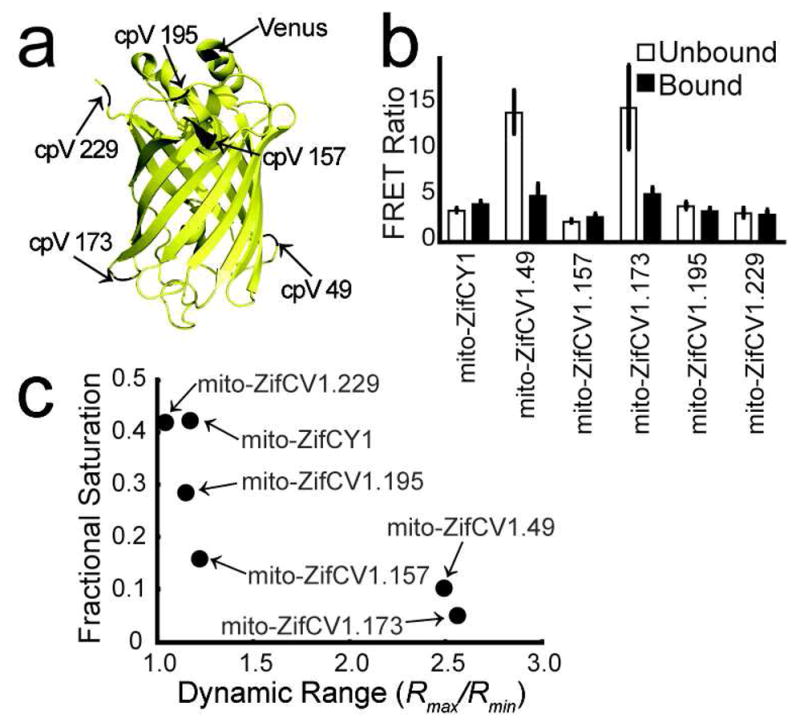
Circular permutation of mito-ZifCY1 dramatically increases its dynamic range. a) The N-and C-termini of cpV FPs are relocated to 5 different loops of the original Venus FP at the amino acid positions 49, 157, 173, 195, and 229. b) The average R of the unbound and bound sensors expressed in at least 10 cells from 2 or more independent experiments, acquired using identical exposure times, are summarized. c) High dynamic range sensors report lower fractional saturation.
Converting the fractional saturation to [Zn2+]mito requires estimation of the KD′. The molecular environment of mitochondrial matrix differs from cytosol, and the pH and redox balance can change significantly under different conditions. The pH in the mitochondrial matrix is typically ~8.0 without perturbation, but it can vary from about 6.5 to 8.5 under different conditions.27 Using Mito-pHRed,27 we estimated the mitochondrial pH in HeLa cells to be ~8.0. Therefore, we calibrated mito-ZapCY1 in mitochondria of living cells by adding Zn2+ buffered at different free concentrations to Ca2+-, Mg2+-, and phosphate-free imaging media in the presence of 50 μg mL−1 alamethicin. Alamethicin is an antimicrobial peptide that can permeabilize the mitochondrial inner membrane to small molecules only.28 Using this method, we found mito-ZapCY1 has an in situ KD′ of 1.6 pM and 17 pM at pH 8.0 and 7.4, respectively (Figure 1, panel d). These in situ affinities are comparable to the affinities measured in vitro at different pH (Supplementary Figure 5). We estimate [Zn2+]mito to be 0.14 pM in HeLa cells based on this in situ titration of mito-ZapCY1 at pH 8.0.
Comparison of Mitochondrial to Cytosolic Zn2+
Next, we confirmed that two high-dynamic-range sensors with different Zn2+ binding domains yield consistent estimates of [Zn2+]mito. As shown in Figure 3, the fractional saturations of mito-ZapCY1 and mito-ZifCV1.173 in HeLa cells were 16±10% and 5.8±3.1%, respectively while the corresponding sensors in the cytosol were almost completely saturated (90±7.3% and 95±1.1%, respectively). These data indicate that under resting conditions in HeLa cells, the free Zn2+ is buffered at concentrations about 3 orders of magnitude lower in mitochondria than in the cytosol.
Figure 3.
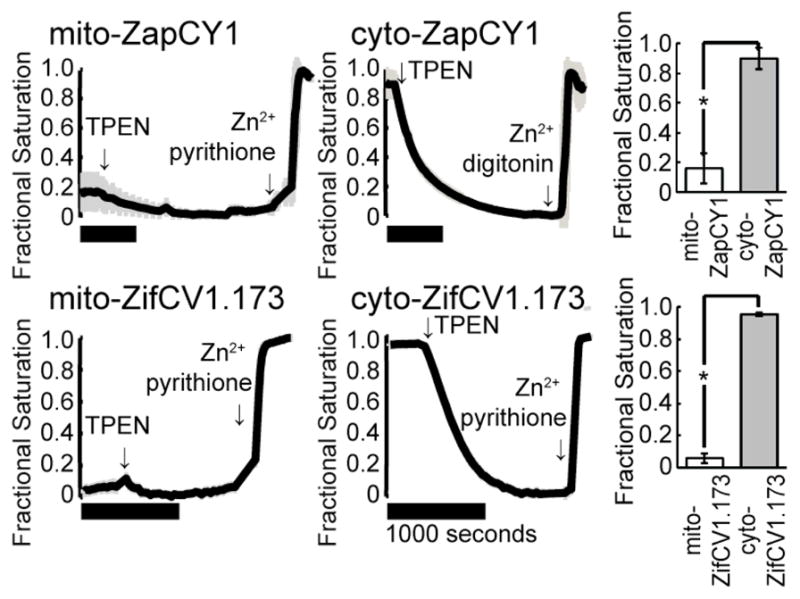
The fractional saturation of Zn2+ sensors is lower in the mitochondria than in the cytosol. Representative calibrations of ZapCY1 and ZifCV1.173 expressed in the mitochondrial matrix or the cytosol of HeLa cells are shown. Comparison of the fractional saturation of each sensor illustrates the difference in mitochondrial and cytosolic Zn2+ (* p < 0.0001, Student’s T-test). Horizontal black bars represent 1000 seconds. At least 3 cells were measured in each experiment.
If, in fact, [Zn2+]mito is buffered at a lower concentration than free cytosolic Zn2+, the addition of a Zn2+ ionophore, in the absence of extracellular Zn2+, should dissipate the Zn2+ gradient between these two subcellular compartments. Indeed, treatment of several cell types expressing mito-ZapCY1 with 5 μM pyrithione caused a rapid increase in mitochondrial Zn2+, which was reversed by the addition of 150 μM TPEN (Supplementary Figure 6). Our interpretation of these results is that pyrithione moves Zn2+ into mitochondria from other subcellular compartments, such as the cytosol, which buffer free Zn2+ at higher concentrations.
Comparison of [Zn2+]mito in different cell types
We used mito-ZapCY1 to quantitatively compare [Zn2+]mito in different cell types and different environmental conditions. Mito-ZapCY1 was expressed in HeLa cells, MIN6 cells (a mouse insulinoma cell line), primary cortical neurons, and HC11 cells (a mouse mammary epithelial cell line). Resting R, Rmin, and Rmax were measured in individual cells to determine the fractional saturation of mito-ZapCY1 in each of the different cell types. Figure 4 presents a summary of mito-ZapCY1’s fractional saturation in different cell types and pseudocolor images of cells at rest, upon TPEN treatment, and upon addition of Zn2+/pyrithione. Significant differences among cell types were observed, including lower fractional saturation of mito-ZapCY1 in HeLa cells (8.7±5.8%) than in MIN6 cells (41±18%) or neurons (59±20%). We also compared the fractional saturation of mito-ZapCY1 in HC11 cells grown in basal media (−prolactin) to those in lactogenic media (+prolactin) and found that [Zn2+]mito is significantly higher in non-lactogenic HC11 cells than in lactogenic HC11 cells (p=0.0022, Student’s T-test). This is particularly intriguing given that HC11 cells have been shown to undergo massive redistribution of intracellular Zn2+ pools and alterations in Zn2+ transporter expression upon lactogenic stimulation.29,30 These results suggest that [Zn2+]mito is regulated differently in several cell types and under different environmental conditions. While at this point we don’t know how cells maintain different levels of mitochondrial Zn2+, we speculate that they will likely exhibit different levels of Zn2+ transporters, buffers, and other regulatory proteins, that are necessary to ensure appropriate Zn2+ management for each specialized cell.
Figure 4.

Quantitative comparison of [Zn2+]mito in different cell types. a) Pseudocolor images of the FRET ratio of mito-ZapCY1 in HeLa cells, MIN6 cells, and a primary cortical neuron illustrate changes in the FRET ratio in response to treatment with 150 μM TPEN or with 0.75 μM pyrithione and 10 μM ZnCl2. Scale bars represent 10 μm. b) [Zn2+]mito differs significantly among cell types. Each marker shows the fractional saturation of mito-ZapCY1 in a single cell (*p<0.0022, Student’s T-test; ***p<0.0001, ANOVA, Tukey’s HSD post-hoc test).
In summary, we constructed and validated three genetically encoded, high dynamic range mitochondrial Zn2+ sensors. Although sensors with low dynamic range are capable of detecting relative changes in Zn2+, high dynamic range sensors are necessary for making consistent and quantitative comparisons of Zn2+ between different cell types. Using mito-ZapCY1, we estimate [Zn2+]mito to be 0.14 pM in HeLa cells. A recent study reports a similar [Zn2+]mito of 0.2 pM measured with a different ratiometric Zn2+ biosensor in the PC12 rat pheochromocytoma line.21 We believe that these mitochondrial Zn2+ sensors can be used to address the complex interplay between Zn2+ homeostasis and mitochondrial function.
Although FRET-based genetically encoded sensors are capable of making quantitative measurements in intact cells, it is poorly understood if and how Zn2+ sensor expression changes the total Zn2+ concentration and the Zn2+-buffering capacity of the cell. The fractional saturation of mito-ZapCY1 does not change as the sensor expression increases (Supplementary Figure 7), suggesting that in contrast to small molecule sensors 4,31, these sensors do not deplete the mitochondrial Zn2+ pool. The lack of perturbation of resting Zn2+ also suggests that, similar to the cytosol, mitochondrial Zn2+ is buffered and the sensor concentration is much lower than the concentration of the buffer.
A potential limitation of the Zn2+-finger binding domains of the mito-ZapCY1 and mito-ZifCV1 sensors is their sensitivity to oxidation and changes in pH. However, we observe little perturbation due to acidification by acetic acid or treatment with H2O2. We performed parallel experiments with the sensors mito-pHRed and mito-RoGFP2 and observed little change in pH or oxidation in the process of sensor calibration (Supplementary Figure 8).27,32
In conclusion, we created improved mitochondrial Zn2+ sensors to measure the buffered set point of free Zn2+ with superior accuracy and precision. These new sensors complement and expand our fluorescent toolbox for studying Zn2+ and other ions in complex, biological systems.
Methods
Sensor Construction
Four repeats of the coding sequence for the first 29 amino acids of the human cytochrome c oxidase subunit 8a (mitochondrial precursor; accession number NP_004065) precede the coding sequence of each Zn2+ sensor in the mammalian expression vector pcDNA3.1, as previously described.14 Citrine FP in “CY” sensors was replaced with cpV FPs to make “CV” sensors using 5′ SacI and 3′ EcoRI restriction sites. ZapCY1 was expressed in E. coli and purified for use in in vitro titrations as previously described 23. Please refer to Supplemental Methods for further details.
Cell culture
HeLa cells were maintained in high glucose Dulbecco’s Modified Eagle Medium (DMEM) with 10% fetal bovine serum (FBS) and penicillin/streptomycin (pen/strep). MIN6 cells were cultured in D-MEM supplemented with 10% (v/v) FBS, L-glutamine, sodium pyruvate, β-mercaptoethanol, and penicillin/streptomycin. HC11 cells were maintained, as previously published, in non-lactogenic medium, which was replaced with lactogenic medium 24–48 prior to imaging.30 All cells were transfected 48–72 hours before imaging with Mirus TransIT-LT or electroporated the Neon system (Life Technologies). Primary cortical neurons were obtained, cultured, and transfected as described in Supplemental Methods. Transfected cells were stained with MitoTracker Red (Life Technologies) for co-localization studies. During all experiments except in situ titrations, cells were imaged in phosphate-free HEPES-buffered Hanks Balanced Salt Solution (HHBSS), pH 7.4.
mito-ZapCY1 titrations
Zn2+ solutions used for the titration of mito-ZapCY1 were buffered using Zn2+ chelators (EGTA, EDTA, and HEDTA) using a previously published method23 with the following modifications. Solutions for both in vitro and in situ titrations were adjusted to the specified pH, and the free [Zn2+] in each Zn2+/chelator buffered solution was calculated for different pH. One HeLa cell imaging experiment was performed at each Zn2+ concentration and the average R of ≥3 cells was used to calculate KD′. Cells were imaged in phosphate-free HHBSS, pH 7.4 throughout Zn2+ chelation with 150 μM TPEN, then replaced with phosphate-, Ca2+-, and Mg2+-free HHBSS, pH 7.4 or pH 8.0 with 125 μM dithiothreitol (to prevent sensor oxidation) and Zn2+/chelator to buffer the free [Zn2+]. Cells and mitochondria were permeabilized using 50 μg ml−1 alamethicin. All chemicals were purchased from Sigma.
Imaging
Image acquisition and analysis were performed as previously published.23 Microscope filter combinations for FRET and CFP: 430/24 nm excitation filter, 455 nm dichroic mirror, 535/25 nm and 470/24 nm emission filters, respectively. Images were analyzed using ImageJ and Matlab software.
Statistical Analysis
Statistical analysis was performed using the Student’s T-test or ANOVA with Tukey’s HSD post-hoc test in the KaleidaGraph program.
Supplementary Material
Acknowledgments
Funding Sources
Signaling and Cell Cycle Regulation Training Grant (NIH T32 GM08759) to J.G.P. and NIH GM084027 and Alfred P. Sloan Fellowship to A.E.P.
We thank P. Marrack for the gift of HC11 cells. A. Miyawaki kindly provided plasmids encoding cpV FPs.
ABBREVIATIONS
- cpV
circularly permuted Venus
- FP
fluorescent protein
- FRET
Förster resonance energy transfer
- KD′
dissociation constant
- Δψm
mitochondrial inner membrane potential
- TPEN
N, N, N′, N′-tetrakis-(2-pyridylmethyl)-ethylenediamine
- [Zn2+]mito
the buffered Zn2+ concentration in the mitochondrial matrix
Footnotes
Author Contributions
The manuscript was written through contributions of all authors. All authors have given approval to the final version of the manuscript.
Supporting Information. Supplementary Figures 1–10, Tables 1–5, and Supporting Methods. This material is available free of charge via the Internet at http://pubs.acs.org.
References
- 1.Hambidge M. Human zinc deficiency. J Nutr. 2000;130:1344S–1349S. doi: 10.1093/jn/130.5.1344S. [DOI] [PubMed] [Google Scholar]
- 2.Lichten LA, Cousins R. Mammalian Zinc Transporters: Nutritional and Physiologic Regulation. Annu Rev Nutr. 2009;29:153–176. doi: 10.1146/annurev-nutr-033009-083312. [DOI] [PubMed] [Google Scholar]
- 3.Colvin R, Holmes W, Fontaine C, Maret W. Cytosolic zinc buffering and muffling: Their role in intracellular zinc homeostasis. Metallomics. 2010;2:306. doi: 10.1039/b926662c. [DOI] [PubMed] [Google Scholar]
- 4.Krezel A, Maret W. Zinc-buffering capacity of a eukaryotic cell at physiological pZn. J Biol Inorg Chem. 2006;11:1049–1062. doi: 10.1007/s00775-006-0150-5. [DOI] [PubMed] [Google Scholar]
- 5.Frederickson CJ, Koh JY, Bush AI. The neurobiology of zinc in health and disease. Nat Rev Neurosci. 2005;6:449–462. doi: 10.1038/nrn1671. [DOI] [PubMed] [Google Scholar]
- 6.Aizenman E, Stout AK, Hartnett KA, Dineley KE, McLaughlin B, Reynolds IJ. Induction of neuronal apoptosis by thiol oxidation: putative role of intracellular zinc release. Journal of Neurochemistry. 2000;75:1878–1888. doi: 10.1046/j.1471-4159.2000.0751878.x. [DOI] [PubMed] [Google Scholar]
- 7.Bossy-Wetzel E, Talantova MV, Lee WD, Schölzke MN, Harrop A, Mathews E, Götz T, Han J, Ellisman MH, Perkins GA, Lipton SA. Crosstalk between nitric oxide and zinc pathways to neuronal cell death involving mitochondrial dysfunction and p38-activated K+ channels. Neuron. 2004;41:351–365. doi: 10.1016/s0896-6273(04)00015-7. [DOI] [PubMed] [Google Scholar]
- 8.Jiang D, Sullivan PG, Sensi SL, Steward O, Weiss JH. Zn(2+) induces permeability transition pore opening and release of pro-apoptotic peptides from neuronal mitochondria. J Biol Chem. 2001;276:47524–47529. doi: 10.1074/jbc.M108834200. [DOI] [PubMed] [Google Scholar]
- 9.Dineley K, Votyakova T, Reynolds I. Zinc inhibition of cellular energy production: implications for mitochondria and neurodegeneration. Journal of Neurochemistry. 2003;85:563–570. doi: 10.1046/j.1471-4159.2003.01678.x. [DOI] [PubMed] [Google Scholar]
- 10.Dineley K, Richards LL, Votyakova T, Reynolds I. Zinc causes loss of membrane potential and elevates reactive oxygen species in rat brain mitochondria. Mitochondrion. 2005;5:55–65. doi: 10.1016/j.mito.2004.11.001. [DOI] [PubMed] [Google Scholar]
- 11.Malaiyandi L, Honick AS, Rintoul G, Wang QJ, Reynolds I. Zn2+ inhibits mitochondrial movement in neurons by phosphatidylinositol 3-kinase activation. J Neurosci. 2005;25:9507–9514. doi: 10.1523/JNEUROSCI.0868-05.2005. [DOI] [PMC free article] [PubMed] [Google Scholar]
- 12.Medvedeva Y, Lin B, Shuttleworth C, Weiss J. Intracellular Zn2+ Accumulation Contributes to Synaptic Failure, Mitochondrial Depolarization, and Cell Death in an Acute Slice Oxygen-Glucose Deprivation Model of Ischemia. Journal of Neuroscience. 2009;29:1105–1114. doi: 10.1523/JNEUROSCI.4604-08.2009. [DOI] [PMC free article] [PubMed] [Google Scholar]
- 13.Chang DT, Honick AS, Reynolds IJ. Mitochondrial trafficking to synapses in cultured primary cortical neurons. J Neurosci. 2006;26:7035–7045. doi: 10.1523/JNEUROSCI.1012-06.2006. [DOI] [PMC free article] [PubMed] [Google Scholar]
- 14.Dittmer P, Miranda J, Gorski J, Palmer A. Genetically Encoded Sensors to Elucidate Spatial Distribution of Cellular Zinc. Journal of Biological Chemistry. 2009;284:16289–16297. doi: 10.1074/jbc.M900501200. [DOI] [PMC free article] [PubMed] [Google Scholar]
- 15.Caporale T, Ciavardelli D, Ilio CD, Lanuti P, Drago D, Sensi SL. Ratiometric-pericam-mt, a novel tool to evaluate intramitochondrial zinc. Experimental Neurology. 2009;218:228–234. doi: 10.1016/j.expneurol.2009.04.003. [DOI] [PubMed] [Google Scholar]
- 16.Sensi SL, Ton-That D, Sullivan PG, Jonas EA, Gee KR, Kaczmarek LK, Weiss JH. Modulation of mitochondrial function by endogenous Zn2+ pools. Proc Natl Acad Sci USA. 2003;100:6157–6162. doi: 10.1073/pnas.1031598100. [DOI] [PMC free article] [PubMed] [Google Scholar]
- 17.Gee K, Zhou Z, Ton-That D, Sensi S, Weiss J. Measuring zinc in living cells. Cell Calcium. 2002;31:245–251. doi: 10.1016/S0143-4160(02)00053-2. [DOI] [PubMed] [Google Scholar]
- 18.Malaiyandi L, Vergun O, Dineley K, Reynolds I. Direct visualization of mitochondrial zinc accumulation reveals uniporter-dependent and -independent transport mechanisms. Journal of Neurochemistry. 2005;93:1242–1250. doi: 10.1111/j.1471-4159.2005.03116.x. [DOI] [PubMed] [Google Scholar]
- 19.Masanta G, Lim CS, Kim HJ, Han JH, Kim HM, Cho BR. A mitochondrial-targeted two-photon probe for zinc ion. J Am Chem Soc. 2011;133:5698–5700. doi: 10.1021/ja200444t. [DOI] [PubMed] [Google Scholar]
- 20.Tomat E, Nolan EM, Jaworski J, Lippard SJ. Organelle-specific zinc detection using zinpyr-labeled fusion proteins in live cells. J Am Chem Soc. 2008;130:15776–15777. doi: 10.1021/ja806634e. [DOI] [PMC free article] [PubMed] [Google Scholar]
- 21.Mccranor B, Bozym RA, Vitolo M, Fierke CA, Bambrick L, Polster B, Fiskum G, Thompson RB. Quantitative imaging of mitochondrial and cytosolic free zinc levels in an in vitro model of ischemia/reperfusion. J Bioenerg Biomembr. 2012;44:253–63. doi: 10.1007/s10863-012-9427-2. [DOI] [PMC free article] [PubMed] [Google Scholar]
- 22.Vinkenborg JL, Nicolson TJ, Bellomo EA, Koay MS, Rutter GA, Merkx M. Genetically encoded FRET sensors to monitor intracellular Zn2+ homeostasis. Nat Meth. 2009;6:737–740. doi: 10.1038/nmeth.1368. [DOI] [PMC free article] [PubMed] [Google Scholar]
- 23.Qin Y, Dittmer PJ, Park JG, Jansen KB, Palmer A. Measuring steady-state and dynamic endoplasmic reticulum and Golgi Zn2+ with genetically encoded sensors. Proc Natl Acad Sci USA. 2011;108:7351–7356. doi: 10.1073/pnas.1015686108. [DOI] [PMC free article] [PubMed] [Google Scholar]
- 24.Nagai T, Yamada S, Tominaga T, Ichikawa M, Miyawaki A. Expanded dynamic range of fluorescent indicators for Ca(2+) by circularly permuted yellow fluorescent proteins. Proc Natl Acad Sci USA. 2004;101:10554–10559. doi: 10.1073/pnas.0400417101. [DOI] [PMC free article] [PubMed] [Google Scholar]
- 25.Palmer A, Giacomello M, Kortemme T, Hires SA, Lev-Ram V, Baker D, Tsien RY. Ca2+ indicators based on computationally redesigned calmodulin-peptide pairs. Chemistry & Biology. 2006;13:521–530. doi: 10.1016/j.chembiol.2006.03.007. [DOI] [PubMed] [Google Scholar]
- 26.Piljić A, de Diego I, Wilmanns M, Schultz C. Rapid Development of Genetically Encoded FRET Reporters. ACS chemical biology. 2011;6:685–691. doi: 10.1021/cb100402n. [DOI] [PubMed] [Google Scholar]
- 27.Tantama M, Hung YP, Yellen G. Imaging intracellular pH in live cells with a genetically encoded red fluorescent protein sensor. J Am Chem Soc. 2011;133:10034–10037. doi: 10.1021/ja202902d. [DOI] [PMC free article] [PubMed] [Google Scholar]
- 28.Gostimskaya IS, Grivennikova VG, Zharova TV, Bakeeva LE, Vinogradov AD. In situ assay of the intramitochondrial enzymes: use of alamethicin for permeabilization of mitochondria. Anal Biochem. 2003;313:46–52. doi: 10.1016/s0003-2697(02)00534-1. [DOI] [PubMed] [Google Scholar]
- 29.Kelleher S, Velasquez V, Croxford TP, McCormick NH, Lopez V, MacDavid J. Mapping the zinc-transporting system in mammary cells: molecular analysis reveals a phenotype-dependent zinc-transporting network during lactation. J Cell Physiol. 2012;227:1761–1770. doi: 10.1002/jcp.22900. [DOI] [PMC free article] [PubMed] [Google Scholar]
- 30.Mccormick N, Velasquez V, Finney L, Vogt S, Kelleher S. X-Ray Fluorescence Microscopy Reveals Accumulation and Secretion of Discrete Intracellular Zinc Pools in the Lactating Mouse Mammary Gland. PLoS ONE. 2010;5:e11078. doi: 10.1371/journal.pone.0011078. [DOI] [PMC free article] [PubMed] [Google Scholar]
- 31.Dineley K, Malaiyandi L, Reynolds I. A reevaluation of neuronal zinc measurements: artifacts associated with high intracellular dye concentration. Mol Pharmacol. 2002;62:618–627. doi: 10.1124/mol.62.3.618. [DOI] [PubMed] [Google Scholar]
- 32.Meyer AJ. The integration of glutathione homeostasis and redox signaling. J Plant Physiol. 2008;165:1390–1403. doi: 10.1016/j.jplph.2007.10.015. [DOI] [PubMed] [Google Scholar]
Associated Data
This section collects any data citations, data availability statements, or supplementary materials included in this article.