

Abstract
Anthrax is an acute infectious disease caused by the spore-forming bacterium Bacillus anthracis. The anthrax toxin lethal factor (LF), an 89-kDa zinc hydrolase secreted by the bacilli, is the toxin component chiefly responsible for pathogenesis and has been a popular target for rational and structure-based drug design. Although hundreds of small-molecule compounds have been designed to target the LF active site, relatively few reported inhibitors have exhibited activity in cell-based assays and no LF inhibitor is currently available to treat or prevent anthrax. This study presents a new pharmacophore map assembly, validated by experiment, designed to rapidly identify and prioritize promising LF inhibitor scaffolds from virtual compound libraries. The new hypothesis incorporates structural information from all five available LF enzyme-inhibitor complexes deposited in the Protein Data Bank (PDB) and is the first LF pharmacophore map reported to date that includes features representing interactions involving all three key subsites of the LF catalytic binding region. In a wide-ranging validation study on all 546 compounds for which published LF biological activity data exist, this model displayed strong selectivity toward nanomolar-level LF inhibitors, successfully identifying 72.1% of existing nanomolar-level compounds in an unbiased test set, while rejecting 100% of weakly active (>100 µM) compounds. In addition to its capabilities as a database searching tool, this comprehensive model points to a number of key design principles and previously unidentified ligand-receptor interactions that are likely to influence compound potency.
Introduction
The rod-shaped, spore-forming bacterium Bacillus anthracis has emerged as one of the most dangerous biological weapons. As the causative agent of anthrax, the bacillus secretes a tripartite exotoxin comprising the lethal factor (LF), edema factor adenylate cyclase (EF), and protective antigen (PA), encoded by the pXO1 plasmid.1 The LF enzyme, a zinc metalloprotein, is the primary agent of anthrax-related toxicity. LF joins with PA to form the anthrax lethal toxin2 which enters cells and cleaves members of the mitogen activated protein kinase kinase (MAPKK) family, interfering with cellular immune defense mechanisms and allowing the pathogen to replicate unchecked.3–6 Host death may result suddenly from massive release of cytokines from spore-infected macrophages, or in later stages of the disease, from circulatory shock due to vascular barrier disruption and hypovolemia.7–10 The anthrax bacilli are susceptible to antibiotics, but early diagnosis and treatment are essential, as antibacterial therapeutics have no effect on the rapidly secreted lethal toxin. In cases of inhalational anthrax, host death is certain without treatment, and mortality rates approach 50% even with prophylactic antibiotics and aggressive support including mechanical ventilation, fluids, and vasopressors.11–13
As anthrax continues to pose a significant biowarfare threat, new and more effective treatment modalities are in high demand, and small-molecule LF inhibitors have attracted particular attention as potential postexposure drugs to be administered in the aftermath of a bioterror attack.6, 9, 14–35 LF inhibitor design is nontrivial, however, due to the presence of a catalytic zinc, challenging active-site topology, and cross-reactivity resulting from relatively high sequence homology with other zinc metalloproteins at the catalytic center.9, 28, 36–41 LF inhibitor scaffolds have progressed from small peptide sequences designed as substrate mimics10, 36, 42 to nonpeptidic acids incorporating hydroxamate groups,9 which are especially strong zinc chelators, to small molecules featuring a variety of other zinc-binding groups (ZBGs) intended to avoid the pharmacokinetic liabilities associated with hydroxamates,15, 16, 24–26, 32, 34, 43–54 yet no LF inhibitor has yet made it to the market as a preventive or therapeutic agent.
LF is a 90-kDa Zn metalloprotein consisting of four domains (Figure 1). The C-terminal domain includes the LF active site, in which a catalytic Zn2+ is coordinated to three active-site residues: His686, His690, and Glu735, all located on α-helices and comprising part of the signature HEXXH consensus sequence found in many Zn metalloproteinases.9, 43 Three subsites comprise the LF substrate binding region: the hydrophobic and sterically restricted S1’ subsite, the less constrained and partly solvent-exposed S1–S2 region, and the less well characterized, open-ended S2’ area (Figure 2).
Figure 1.

Anthrax toxin lethal factor domains II-IV (residues 297–809) (1YQY.pdb55), colored by secondary structure, with catalytic Zn2+ (gray sphere) and cocrystallized hydroxamate inhibitor MK-702/LF-1B (visualized in MacPyMOL 1.5.0.1, Schrödinger, LLC).
Figure 2.

Active site of the anthrax toxin lethal factor (1YQY.pdb55), with MOLCAD electrostatic potential mapping (red = positive, purple = negative); catalytic Zn2+ (magenta sphere); zinc-binding residues His686, His690, and Glu735; and illustrating three binding subsites: S1’, S1–S2, and S2’,56 visualized in SYBYL 8.0., Tripos, Inc.
Many diverse compound classes have been designed to inhibit LF; examples include small peptide sequences designed to parallel the natural MAPKK substrate with hydroxamic acid ZBGs,10, 36, 42 sulfonamide hydroxamate compounds,9 rhodanines,16, 25, 26, 43 and N,N'-di-quinoline urea derivatives,46 among others. Overall, hundreds of small-molecule LF inhibitors have been reported in the literature,6, 9, 14–35 and five X-ray structures of LF-ligand complexes are available in the Protein Data Bank (PDB): 1YQY,55 1ZXV,16 1PWP,46 1PWU,36 and 1PWQ.36 Cocrystallized inhibitors in these structures include the most active LF inhibitor designed to date, a sulfonamide hydroxamate (IC50 = 0.054 µM,9 1YQY), a rhodanine derivative (IC50 = 1.7 µM,24 1ZXV), a N,N'-di-quinoline urea analog (Ki = 0.5 µM,46 1PWP), and two peptide hydroxamates (Kiapp = 2.1 µM,36 and 11 µM,36 1PWQ and 1PWU). Figure 3 illustrates a superposition of all five ligands based on alignment of X-ray receptor structures (MOE 2010.10, Chemical Computing Group, Inc.). The chemical functionalities of these five ligands occupy various key regions of the LF active site, and taken together cover all three critical subsites (S1’, S1–S2, S2’) of the LF binding area.
Figure 3.

Superposition of bound conformations of five active anthrax toxin LF inhibitors,9 obtained via protein alignment (MOE 2010.10) illustrating the three binding subsites (visualized in MOE 2011.10). White = NSC 1215546; orange = GM600136; green = MK-702/LF-1B55; cyan = BI-MFM316; pink = thioacetyl-Tyr-Pro-Met-amide36.
Researchers are actively seeking novel LF inhibitor scaffolds23, 29, 35, 56 that demonstrate favorable biological activities, explore new regions in chemical space, and can serve as starting points for anti-anthrax drug design. Pharmacophore mapping has long been recognized as a valuable computational tool to pinpoint new drug and probe scaffolds based on ligand-receptor interactions engaged in by active compounds.57–59 LF inhibitor pharmacophore hypotheses have been reported in the literature and recommended for database screening.35, 46, 54, 60 However, these models were developed from limited training sets, i.e., from one or two structural classes of compounds found to partly occupy the LF binding site, which somewhat restricts their applicability and usefulness as searching tools. In the current study, we report a comprehensive pharmacophore model, UM1, which is designed to overcome this roadblock by building on experimentally determined binding modes involving the entire LF binding area. This new model was generated from a series of five preliminary maps UA1–5, using genetic algorithms,61 Pareto scoring62, 63, and ligand-receptor interaction diagrams based on experimental structural biology. The final model was validated using a dataset comprising 546 LF inhibitors – all compounds known to date with published in vitro biological activities against LF – including an unbiased external test set of sixty-eight nanomolar-level LF inhibitors that are structurally dissimilar to the compounds used to construct and optimize the model. We show that, when implemented with a partial match criterion of at least five features, all of which passed a key statistical significance test, UM1 successfully identified 49 (72.1%) of the 68 most potent LF inhibitors (IC50 or Ki < 1 µM) in the unbiased test set, and rejected all compounds with specified IC50 or Ki values greater than 100 µM. In addition to its highly selective searching ability, this comprehensive map elucidates important design principles for highly potent LF inhibitors. Specifically, a small molecule effective against LF must incorporate at least five of the following eight features: (1–3) three hydrophobic groups to interact with hydrophobic sidechains in the S1–S2 and zinc-chelating regions of the active site; (4) a hydrogen-bond acceptor interacting with Glu687 near the catalytic zinc; (5) hydrophobic interactions with one or more of the following: Lys656 (S2’), Leu677 (S1’), His686 (catalytic zinc area), or Tyr728 (S1–S2); (6) a hydrogen-bond acceptor interacting with Glu735 (S1–S2) or Tyr728; (7) a hydrogen-bond acceptor interacting with Lys656 or Gly657 (at the S2’ entrance); or (8) a hydrogen-bond donor interacting with Gly657 and/or Glu687.
Results and Discussion
Preliminary Pharmacophore Models
Five initial pharmacophore maps UA1–5 were generated based on the aforementioned experimental X-ray structures deposited in the Protein Data Bank.64 Two of these models, UA1 and UA2, were derived from active LF inhibitor series using genetic algorithms (GAs) and a scoring function based on Pareto multi-objective optimization, as implemented in the GALAHAD package61 (Tripos, Inc.) One model (UA3) was generated by modifying a published pharmacophore map based on further examination of ligand-receptor interactions observed in LF X-ray structures. Models UA4 and UA5 were obtained by creating new pharmacophoric feature representations derived solely from crystallographic enzyme-inhibitor interactions, as no analogs or derivatives of cocrystallized ligands from those complexes have been made available. Both GA-based hypotheses contained data from all molecules in the input set and were represented as a set of hypermolecules (ligand alignments and common features such as hydrogen bond donors/acceptors and hydrophobic centers). The GA models were subjected to multiple iterative refinements, and their accuracy was assessed by means of two key criteria: an overall Pareto score and a rank sum value incorporating (a) pharmacophoric concordance (a measure of the overall pharmacophoric similarity among ligand conformers; (b) steric overlap (a measure of the overall steric similarity among ligand conformers; and (c) agreement between the query tuplet and the pharmacophoric tuplets for the ligands as a group (essentially, a measure of similarity between the pharmacophoric query and the compound set used to build the model).61, 65 Within each set of hypotheses, models were ranked first by Pareto score; if all Pareto scores were equal, the models were then ordered by the rank sum value across criteria (a) – (c) listed above. Any remaining “ties” were subsequently broken by a total energy term representing the energies of all molecules in the training set (as estimated by the Tripos force field), where lower energies are considered more favorable.61, 65 It is important to note that the presence of a given feature and/or chemical functionality in more than one active compound does not necessarily indicate a significant contribution to compound activity, or signify a true enzyme-inhibitor interaction. We therefore generated two-dimensional ligand-receptor interaction maps (MOE 2010.10, Chemical Computing Group, Inc.) for each cocrystallized complex, to eliminate those features in each hypothesis that either did not parallel enzyme-inhibitor interactions as observed in the X-ray structures, or that represented those interactions inaccurately (i.e., incorrect hydrogen bonding directionality). As the MOE-based 2D maps do not illustrate hydrophobic interactions, we also generated PoseView66 2D diagrams to clarify those interactions in three cases (models UA3–5).
Model UA1: 1YQY.pdb (LF cocrystallized with the sulfonamide hydroxamate MK-702/LF-1B55)
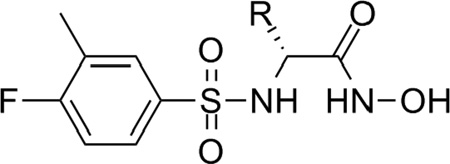
Fifteen preliminary hypotheses were derived from the five most active compounds in Ref. 9 as determined by LF FRET assay IC50 values: 38, 39, 46, 49, and 50 (Table 1), with in vitro activities ranging from 0.037 to 0.050 µM. All fifteen models exhibited an equivalent Pareto rank, so the six-featured hypothesis UA1_001 was chosen from among these by overall rank sum across pharmacophoric concordance, steric overlap, and tuplet agreement criteria as described earlier. Based on ligand–receptor interaction diagrams of the 1YQY.pdb X-ray structure (Figures 4a and 4b), two alterations were made to UA1_001: a feature representing the sulfonamide NH moiety as an acceptor was removed, and, the hydroxamate ZBG hydroxyl was represented as a hydrogen-bond donor. The resulting final model UA1 is shown in Figure 4c
Table 1.
The five most active sulfonamide hydroxamate LF inhibitor compounds from Ref. 9, as determined by in vitro LF FRET assay IC50 values.
 | ||
|---|---|---|
| Cpd # | R | LF IC50 (µM) |
| 38 | c-Hex | 0.042 |
| 39 | Ph | 0.050 |
| 46 | 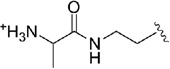 |
0.037 |
| 49 | 0.048 | |
| 50 | 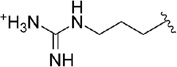 |
0.040 |
Figure 4.


(a) Ligand-receptor interaction diagram of sulfonamide hydroxamate MK-702 (LF-1B, 40) cocrystallized with the anthrax toxin lethal factor (1YQY.pdb55) (MOE 2010.10, Chemical Computing Group, Inc.). In this and subsequent MOE interaction diagrams, green spheres = “greasy” residues; spheres with red outline = acidic residues; spheres with blue outline = basic residues; spheres with black outline = polar residues; blue background spheres = receptor exposure to solvent; blue spheres on ligand atoms = ligand exposure to solvent; green dotted lines = sidechain donors/acceptors; blue dotted lines = backbone donors/acceptors; purple dotted line = metal contact; grey dotted line = proximity contour. (b) Additional ligand-receptor interaction map of MK-702 (LF-1B, 40) bound to LF (1YQY.pdb55) (PoseViewWeb66); in this and subsequent PoseView interaction diagrams, dashed lines = directed bonds between protein and ligand; spline sections = hydrophobic contacts between ligand moieties and the indicated receptor residues. (c) Preliminary LF inhibitor pharmacophore model UA1 based on a series of highly active analogs of MK-7029; green sphere = hydrophobic features; blue spheres = hydrogen-bond donors; pink sphere = hydrogen-bond acceptor (visualized in MOE 2010.10).
Model UA2: 1ZXV.pdb (LF bound to BI-MFM3, a rhodanine derivative)
Twenty preliminary models were derived from the three most active compounds 6, 7 and 8 (with in vitro LF FRET assay activities from 0.19 to 0.30 µM) in Ref. 24 (Table 2); all 20 hypotheses once again exhibited identical Pareto scores. The most favorable model chosen by pharmacophoric rank sum value, UA2_001, initially comprised six features. The ligand–receptor interaction diagrams for 1ZXV.pdb (Figures 5a and 5b) did not illustrate any ligand moieties functioning as hydrogen-bond acceptors; therefore two such features in UA2_001, corresponding to a furan oxygen and a carboxylic acid oxygen on the ligands, were removed. Additionally, a fast Connolly electron density surface of the LF active site including BI-MFM3 was generated with lipophilic potential mapping using MOLCAD67 in SYBYL 8.0 (Tripos, Inc.) (Figure 5c). This surface points to hydrophobic regions in the LF Zn-chelating and S1–S2 areas comprising Val653, Leu658, Tyr659, Pro661, and Tyr728, supporting the inclusion of three hydrophobic features corresponding to phenyl, furan, and 2-thioxothiazolidine-4-one moieties on the ligand that interact with this receptor area. An anionic feature in UA2_001 was also retained, as it corresponds to a solvent-exposed carboxylic acid functionality on the ligand set. The revised, final hypothesis UA2 comprised four features in total and is depicted in Figure 5d.
Table 2.
The three most active rhodanine-based LF inhibitor compounds from Ref. 24, as determined by in vitro LF FRET assay IC50 values.
| Cpd # | Structure | LF IC50 (µM) |
|---|---|---|
| 6 | 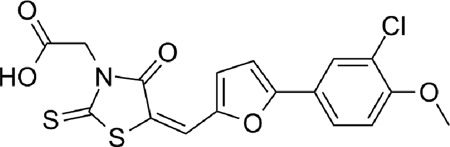 |
0.30 |
| 7 | 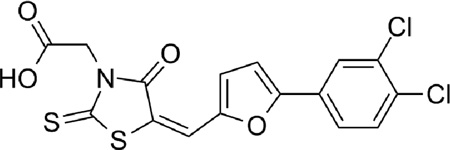 |
0.26 |
| 8 | 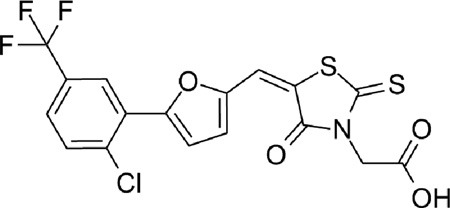 |
0.19 |
Figure 5.


(a) Ligand-receptor interaction diagram of rhodanine derivative BI-MFM3 cocrystallized with the anthrax toxin lethal factor (1ZXV.pdb16) (MOE 2010.10). (b) Additional ligand-receptor interaction map of BI-MFM3 bound to LF (1ZXV.pdb16) (PoseViewWeb 66). (c) MOLCAD Fast Connolly electron density surface of the LF active site (1ZXV.pdb16) with lipophilic potential mapping, shown with BI-MFM3; brown = highest lipophilicity; blue = highest hydrophobicity (SYBYL 8.0, Tripos, Inc.). (d) Preliminary LF inhibitor pharmacophore model UA2 derived from three closely related rhodanine analogs24; green spheres = hydrophobic features; red sphere = anionic feature (visualized in MOE 2010.10).
Model UA3: 1PWP.pdb (LF complexed with NSC 12155, a methylquinoline urea derivative)
Previously, Panchal and coworkers46 had developed a partial pharmacophore model of the LF S1–S2 subsite based on inhibitors NSC 12155, compound 1 (Ki = 0.5 µM) and NSC 357756, compound 2 (Ki = 4.9 µM) (Table 3). The initial hypotheses were refined by those workers using six other active compounds from virtual and experimental NCI database screening to generate the final reported model.46 This five-featured hypothesis comprised two aromatic centers, two polar centers and one neutral linker. However, only two aromatic features in this published model were present in experimental interaction diagrams of the 1PWP complex (Figures 6a and 6b), so the other three features were deleted to form revised model UA3 (Figure 6c).
Table 3.
Two analogs utilized by Panchal et al. 46 to derive a LF pharmacophore hypothesis covering the S1–S2 subsite.
| Cpd # | Structure | LF Ki (µM) |
|---|---|---|
| 1 | 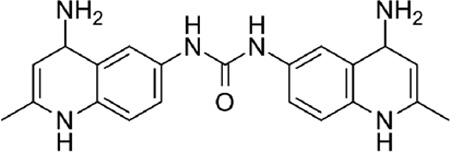 |
0.50 |
| 2 |  |
4.90 |
Figure 6.


(a) Ligand-receptor interaction diagram of methylquinoline urea compound NSC 12155 cocrystallized with the anthrax toxin lethal factor (1PWP.pdb46) (MOE 2010.10). (b) Additional ligand-receptor interaction map of NSC 12155 bound to LF (1PWP.pdb46) (PoseViewWeb66). (c) Preliminary LF inhibitor pharmacophore model UA3 derived from the published hypothesis of Panchal et al. 46 and modified based on enzyme-inhibitor interactions observed in the 1PWP.pdb X-ray structure; yellow spheres = aromatic centers (visualized in MOE 2010.10).
Models UA4 and UA5: 1PWQ.pdb (LF complexed with thioacetyl-Tyr-Pro-Met-amide) and 1PWU.pdb (LF bound to peptide-based matrix metalloprotease inhibitor GM6001)
As no published analogs exist for the small-molecule inhibitors in these two X-ray structures, the 2D ligand-receptor interaction maps generated for both complexes (Figures 7a–7b and 8a–8b) were used to determine key pharmacophoric features on the ligands. Two hydrogen-bond acceptors, one hydrogen-bond donor, and one hydrophobic group were present in the 1PWQ thioacetyl ligand; the corresponding features were combined using MOE 2010.10 to form model UA4 (Figure 7c). Similarly, model UA5 (Figure 8c) was constructed by assembling three hydrogen-bond acceptors, one hydrogen-bond donor, and one hydrophobic isopropyl group from GM6001 cocrystallized with LF in 1PWU. Although developing a pharmacophore model based on a single cocrystallized ligand is a nonstandard approach, the significance testing we conducted (see below) indicated that features in models UA4 and UA5 played key roles in identifying potent LF inhibitors, as well as in rejecting weakly potent and inactive compounds.
Figure 7.


(a) Ligand-receptor interaction diagram of thioacetyl-Tyr-Pro-Met amide cocrystallized with the anthrax toxin lethal factor (1PWQ.pdb36) (MOE 2010.10). (b) Additional ligand-receptor interaction map of thioacetyl-Tyr-Pro-Met amide bound to LF (1PWQ.pdb36) (PoseViewWeb66). (c) Preliminary LF inhibitor pharmacophore model UA4 developed from the 2D enzyme-inhibitor interaction diagrams; green sphere = hydrophobic center; pink spheres = hydrogen-bond acceptors; blue spheres = hydrogen-bond donors (visualized in MOE 2010.10).
Figure 8.


(a) Ligand-receptor interaction diagram of peptidic matrix metalloproteinase inhibitor GM6001 cocrystallized with the anthrax toxin lethal factor (1PWU.pdb36) (MOE 2010.10). (b) Additional ligand-receptor interaction map of GM6001 complexed with LF (1PWU.pdb36) (PoseViewWeb66). (c) Preliminary LF inhibitor pharmacophore model UA5 developed from the 2D enzyme-inhibitor interaction diagrams; green sphere = hydrophobic center; pink spheres = hydrogen-bond acceptors; blue sphere = hydrogenbond donor (visualized in MOE 2010.10).
Comprehensive Pharmacophore Hypothesis: Construction, Validation, and Refinement
All five models UA1–UA5 were combined in MOE 2010.10 to form an initial comprehensive hypothesis consisting of 19 features. Ten features required refinement due to redundancy: two hydrogen-bond acceptors, one hydrogen-bond donor and one hydrophobic feature were present in multiple preliminary hypotheses and, upon combination of the five models, appeared as multiple identical features separated by small distances (≤ 2.11 Å) in the superimposed X-ray structure assembly. Each group of features was therefore merged using MOE 2010.10 into a single representative feature localized on the group center of mass, where the radius of the merged feature was manually adjusted to cover the three-dimensional space occupied by the corresponding feature group. The resulting intermediate model UM1A comprising thirteen features is depicted in Figure 9.
Figure 9.


(a) Intermediate comprehensive LF pharmacophore hypothesis UM1A, superimposed on the LF active site (1YQY.pdb55), with key receptor residues, catalytic Zn2+ (magenta sphere), and three binding subsites displayed (MOE 2010.10). (b) List of features and their radii in UM1A: Don = hydrogen-bond donor; Ani = anion; Hyd = hydrophobic; Aro = aromatic; Acc = hydrogen-bond acceptor
Subsequent refinement and validation of UM1A was done by using that model to virtually screen small-molecule database DB1 comprising all 546 non-redundant compounds6, 9, 14–35 with reported experimental activity data against LF. (Note that compound analogs used to generate the GA-based preliminary models UA1 and UA2 had previously been removed from this dataset.) Database DB1 was divided into five initial subsets according to experimental biological activity values (see Tables 4 and 5): DB1A (strongly active compounds, IC50 or Ki < 1 µM, 102 structures), DB1B (weakly active compounds, IC50 or Ki = 1–100 µM, 320 structures), DB1C (inactive compounds with specified biological activity values from dose-response screens, IC50 or Ki > 100 µM, 9 structures), DB1D (115 compounds for which reported activity values were nonspecific and greater than 25 micromolar) and DB1E (47 compounds in DB1D for which reported activity values were nonspecific and greater than 100 micromolar). For validation purposes, the strongly active compound set DB1A was further subdivided into training and test sets: DB1A_Training (34 sulfonamide hydroxamate and rhodanine-based derivatives from Refs. 9, 16, 24 and 26) and DB1A_Test (68 compounds from Refs. 15, 20, 21, 22, 23, 27, 29 and 34 including guanidinylated 2–5, dideoxystreptamine derivatives, guanidinylated derivatives of neamine, aniline and γ-ether derivatives, a carboxylic and N-sulfonylated phenylfuran derivative, one N-hydroxyhexanamide analog, and (-)epigallocatechin-3-gallate). The sulfonamide hydroxamate and rhodanine-based DB1A compounds were chosen to constitute the training rather than the test set because those structures were similar to those used to construct preliminary pharmacophore hypotheses UA1 and UA2, and for proper model validation, it is important for the test set to be unbiased, i.e., to comprise compounds that had not been used in model construction and that are structurally dissimilar to those in the training set.
Table 4.
Results of significance test on comprehensive LF pharmacophore hypothesis UM1A, illustrating the number of compounds in each database subset returned by the hypothesis when the designated pharmacophoric feature was removed.
| Feature Removed | DB1A_Training | DB1B | DB1C | DB1D | DB1E |
|---|---|---|---|---|---|
| None (UM1A) | 33/34a | 251/320 | 4/9 | 66/115 | 26/47 |
| F5 Anib | 33 | 251 | 4/9 | 66 | 26 |
| F6 Hyd | 25 | 208 | 4/9 | 55 | 20 |
| F7 Hyd | 25 | 191 | 4/9 | 50 | 18 |
| F8 Hyd | 24 | 221 | 4/9 | 57 | 23 |
| F9 Aro | 33 | 228 | 4/9 | 55 | 21 |
| F10 Aro | 33 | 247 | 4/9 | 65 | 26 |
| F11 Don | 33 | 250 | 3/9 | 66 | 26 |
| F13 Acc | 17 | 212 | 4/9 | 54 | 24 |
| F17 Acc | 33 | 237 | 4/9 | 62 | 26 |
| F20 Hyd | 13 | 159 | 2/9 | 32 | 16 |
| F21 Acc | 13 | 157 | 3/9 | 39 | 19 |
| F22 Acc | 17 | 199 | 3/9 | 49 | 20 |
| F23 Don | 17 | 209 | 2/9 | 57 | 23 |
Total number of compounds in each database subset
Ani = anion; Hyd = hydrophobic; Aro = aromatic; Don = hydrogen-bond donor; Acc = hydrogen-bond acceptor
Table 5.
Performance of intermediate comprehensive pharmacophore hypothesis UM1A and final comprehensive hypothesis UM1 as evaluated by virtual screening of published active and inactive LF inhibitors.
| Database Subset | Experimental activity range of cpds in subset (IC50 or Ki values, µM) |
# cpds in subset |
# of “hits” and % cpds returned by model UM1A |
# of “hits” and % cpds returned by refined model UM1 |
|---|---|---|---|---|
| DB1A_Training | <1 | 34 | 33, 97.1% | 29, 85.3% |
| DB1A_Test | <1 | 68 | 67, 98.5% | 49, 72.1% |
| DB1B | 1–100 | 320 | 251, 78.4% | 122, 38.1% |
| DB1C | >100 | 9 | 4, 44.4% | 0, 0.0% |
| DB1D | unspecifieda | 115 | 66, 57.4% | 26, 22.6% |
| DB1E | unspecifiedb | 47 | 26, 55.3% | 8, 17.0% |
Compounds for which published biological activities were nonspecific, e.g., “greater than 25 micromolar”
Compounds for which published biological activities were nonspecific but “greater than 100 micromolar,” a subset of DB1D
In the first stage of this virtual screen, a partial-match validation test was done to find the optimal minimum number of pharmacophoric features in UM1A that must be matched by a given compound, for that compound to be considered a “hit”. Requiring at least four features to be matched resulted in a relatively high hit rate across the entire dataset, irrespective of activity: UM1A returned all 34 highly active compounds in DB1A_Training (LF IC50 or Ki less than one micromolar), all of the less actives (DB1B), 77.8% of the inactive DB1C structures, 95.7% of the inactives in our set with unspecified biological activity values, and 93.6% of those inactives with nonspecific activities reported as greater than 100 micromolar – meaning that the majority of structures in the 546-compound database matched four of the thirteen features in UM1A, and that a partial match criterion of ≥ 4 would not be sufficient to distinguish more potent from less potent compounds. Increasing the partial match criterion to ≥ 5 resulted in 97.1% of highly actives in DB1A_Training and 78.4% of the less actives being identified, but requiring at least 6 features to be matched greatly decreased the active compound hit rate to 2.9% (only one out of thirty-four structures). Consequently, a partial match criterion of five features was established for subsequent further refinement and screening.
Next, a significance test was conducted on UM1A, to assess whether each of its thirteen features must be present in order for the model to identify active compounds and reject inactives. This was done by removing one feature at a time from the hypothesis (keeping the partial match requirement of at least 5 features as described above), using the resulting twelve-featured model to screen the entire DB1 test set (MOE 2010.10), and comparing the results to those obtained by using the full thirteen-featured model (Table 4). The unaltered model UM1A returned 33 (97.1%, DB1A_Training) highly active compounds in the training set, 67 (98.5%, DB1A_Test) highly active compounds in the test set, and 251 of 320 (78.4%) less active compounds (DB1B), while rejecting 5 out of 9 (55.5%) inactive compounds (DB1C), 49 of 115 (42.6%) nonspecifics (DB1D) and 21 of 47 (44.6%) nonspecifics with activities reported as greater than 100 micromolar. Omitting anionic feature F5 had no effect on hit rate; the effect of removing features F10, F11, and F17 was also negligible (a change of ≤ 1% “hit” or “match” rate across all four subsets), indicating that none of these features played a significant role in identifying actives and could be safely omitted from the model. Omitting aromatic feature F9 resulted in a model that returned the same numbers of strongly active compounds in the training set (33 of 34) and specified inactives (4 of 9) as did UM1A, but resulted in an improvement in selectivity, as it matched 16 fewer nonspecifics in datasets DB1D and DB1E. Subsequently, the radii of the remaining features were optimized to minimize the return rates of inactives and nonspecifics (DB1C and DB1E compounds) while maintaining a reasonable hit rate for highly active compounds (DB1A_Training). Based on our significance test results, F20 and F23 played the most significant roles in matching DB1C compounds, as removal of either caused the largest decrease in the DB1C hit rate (see Table 4). The radii of F20 and F23 were therefore reduced by 0.1 Å increments until the DB1C hit rate reached zero. The presence of hydrogen-bond acceptor feature F13 strongly influenced the DB1A_Training hit rate, so the radius of this feature was increased by 0.1 Å increments until a temporary maximum DB1A_Training hit rate was achieved. Next, the radii of all features were fine-tuned until minimal hit rates for DB1C and DB1E and maximal hit rates for DB1A_Training were reached. This final comprehensive model UM1 is shown in Figure 10. (Note that although feature F13 originated from models UA4 and UA5, that were derived using structure-based interaction maps rather than by means of traditional pharmacophore mapping procedures using sets of ligand analogs, our significance test proved that this feature was required in order for the comprehensive model to pinpoint active compounds).
We found that this final hypothesis UM1 performed quite well in terms of selectively returning strongly active vs. less active LF inhibitors (see Table 5): 72.1% of the unbiased DB1A_Test structures vs. 38.1% of DB1B structures. UM1 also strongly disfavored inactive compounds, identifying none of the DB1C structures and only 22.6% of the structures with “unspecified” activities in DB1D – and only eight of the forty-seven compounds in DB1E with “unspecified” activities greater than 100 micromolar. Note also that while UM1 identified fewer strongly active compounds in DB1A_Test than did UM1A (73.5% vs. 98.5%), this refined model was able to distinguish more precisely between nanomolar- and micromolar-level compounds, matching only 38.1% vs. 78.4% of DB1B structures. Importantly, the high selectivity of UM1 for strong actives was not due to significant structural similarity between compounds used to build/optimize the model and those in the test set; the mean Tanimoto similarity for nearest-neighbor compounds in the training (DB1A_Training) and test (DB1A_Test) datasets was only 0.51.
Figure 10 illustrates hypothesis UM1 superimposed on the X-ray structure of the LF active site (1YQY.pdb)55, with all eight features illustrated: F6–F8, F13, and F20–F23. Hydrophobic features F6–F8, originating from preliminary model UA2, represent inhibitor moieties that are necessary to interact with residues in the hydrophobic S1–S2 and zinc-chelating regions of the LF active site. A key hydrogen-bonding interaction with Glu687 near the catalytic Zn2+ is represented by feature F13. Other hydrophobic interactions that may enhance compound activity are indicated by feature F20 (with the zinc-binding residue His686, Tyr728 in the LF S1–S2 region and Leu677 in the S1’ subsite, and with Lys656 in the less explored S2’ area). Feature F21 points to key hydrogen-bonding interactions between the ligand with Glu735 and Tyr728 in the S1–S2 area, while F22 represents a hydrogen-bond acceptor that may enhance binding by interacting with Gly657 near the bottom of the active site and Lys656 in the S2’ region. Finally, the donor feature F23 indicates two hydrogen bonds from the ligand to Gly657 and Glu687. Note that hydrophobic and/or hydrogen bonding interactions involving Tyr728, Gly657, and Glu687 are represented by multiple pharmacophoric features in UM1, suggesting that these residues may be especially important targets in the LF active site.
Concluding Remarks
In this paper, we have presented a new pharmacophore hypothesis UM1 for anthrax toxin lethal factor (LF) inhibitors, obtained from experimental X-ray binding modes of structurally diverse active compounds and spanning all three key subsites in the LF binding area. This eight-featured, comprehensive model was constructed from five preliminary models and was validated and optimized by screening all published LF inhibitors with experimental biological activity data – an extremely diverse dataset occupying a variety of distinct regions in chemical space – including an unbiased test set of 68 nanomolar-level LF inhibitors that are not structurally related to the compounds used in pharmacophore construction. When applied with a partial match criterion of at least five features, UM1 successfully identified 72.1% of the LF inhibitors in this test database, i.e., with biological activities less than 1 micromolar, and returned none of the published compounds with specified activities greater than 100 micromolar. Key design principles for active LF inhibitors are also illustrated by this pharmacophore hypothesis: for good potency, a small molecule should incorporate hydrophobic moieties to interact with residues in all three subsites including Lys656, Leu677, His686 and Tyr728; a selection of hydrogen-bond acceptors to interact with Glu687, Glu735, Tyr 728, Lys656 and/or Gly657; and a moiety that can function as a hydrogen-bond donor to Gly657 or Glu687. Notably, model UM1 was derived from experimentally determined bound configurations of a variety of active, structurally diverse LF inhibitors, and was validated against an even more diverse LF inhibitor compound database with a broad range of biological activities, including an external test set. Incorporating structural biology data via 2D ligand-receptor interaction maps increased the accuracy and predictability of the final model, and interaction maps for a single ligand and the LF target were able to provide enough information to generate models with essential features (as determined by significance testing) even when a series of active analogs was not available for traditional pharmacophore perception methods. We therefore recommend final model UM1 as an in silico searching tool to rapidly screen compound collections for new potential LF inhibitor scaffolds. Since this model additionally points to critical ligand-receptor interactions present in multiple X-ray structures of LF cocrystallized with small molecules (some of which were also revealed by genetic algorithm-based pharmacophore perception methodologies), we also recommend UM1 as an adjunct tool in lead optimization, to help increase the potency of existing compounds.
Methods and Computational Details
X-Ray Structure Preparation
In order to obtain a structural superimposition for pharmacophore perception, the five LF-inhibitor crystal structures available in the Protein Data Bank (1YQY,55 1ZXV,16 1PWP46, 1PWU36, and 1PWQ36) were aligned in Cartesian space by optimizing the sum of all pairwise alignment scores using the Homology/Align module in MOE 2010.10 (Chemical Computing Group, Inc.), with alignment based on protein coordinates rather than cocrystallized ligand coordinates.
Preparation of Small Molecules for Pharmacophore Perception
For the genetic algorithm-based models UA1 and UA2, all analogs used to construct models were built from the respective cocrystallized ligands (LF-1B in the case of UA1 and BI-MFM3 in the case of UA2). Each analog was then subjected to geometry optimization within the respective enzyme active site (X-ray structural coordinates) in order to approach a putative bound conformation as closely as possible. Minimization was done in MOE 2010.10 using the MMFF94s force field68, 69 with a convergence criterion of 0.05 kcal/mol•Å, while the receptor was held rigid.
Screening Dataset Preparation
A database of 546 non-redundant LF inhibitors (DB1) was assembled from structural and biological activity data reported in a total of twenty-three published works.6, 9, 14–31, 33–35 Each compound was individually sketched in MOE 2010.10 (Chemical Computing Group, Inc.) and was geometry optimized using the MMFF94s force field68, 69, applying a convergence criterion of 0.05 kcal/mol•Å. DB1 was divided into six total subsets, including training and test sets for nanomolar-level compounds, as described earlier. To obtain predicted bound conformations of these structures, each minimized compound was then docked into the LF active site (1YQY.pdb55) using Surflex-Dock70–73 and the CScore consensus scoring module74 in the SYBYL 8.0 discovery software suite (Tripos, Inc.). In the docking procedure, the active-site representation (protomol) was defined to encompass all receptor areas that were demonstrated in the X-ray structures to interact with moieties on all five cocrystallized ligands. The docking threshold and bloat parameters were set to 0.5 and 0, respectively.
The maximum number of conformations per compound fragment and the maximum number of poses per ligand were both set to 20, and the maximum allowable number of rotatable bonds per molecule was limited to 100. Post-dock geometry optimizations were done on each molecule to fine-tune the predicted bound conformations. Tanimoto coefficients measuring similarity between nearest-neighbor training and test set compounds were calculated in Pipeline Pilot 8.0 (Accelrys, Inc.), using ECFP_4 descriptors (Extended-Connectivity Fingerprint with maximum diameter of circular neighborhoods considered for each atom set to 4).
Supplementary Material
Figure 10.


(a) Final comprehensive LF pharmacophore hypothesis UM1, superimposed on the LF active site (1YQY.pdb55), with key receptor residues, catalytic Zn2+ (magenta sphere), and three binding subsites displayed (MOE 2010.10). (b) List of features and their radii in UM1: Hyd = hydrophobic; Acc = hydrogen-bond acceptor; Don = hydrogen-bond donor
Acknowledgements
The authors express their gratitude to Barry Finzel, Todd Geders, and Michael Walters for helpful discussions, and to the reviewers of this work for valuable observations and suggestions. This study was supported in part by the University of Minnesota Supercomputing Institute for Advanced Computational Research, and by the National Institutes of Health (R01 AI083234 to E.A.A.).
Footnotes
Supporting Information Available. Structures of all 546 published LF inhibitors comprising screening dataset DB1, divided into five subsets according to biological acitivity (with DB1A training and test set compounds indicated) and a list of features and pairwise distances for the final revised hypothesis UM1. This material is available free of charge at http://pubs.acs.org.
References
- 1.Pezard C, Berche P, Mock M. Contribution of individual toxin components to virulence of Bacillus anthracis. Infect. Immun. 1991;59:3472–3477. doi: 10.1128/iai.59.10.3472-3477.1991. [DOI] [PMC free article] [PubMed] [Google Scholar]
- 2.Chopra AP, Boone SA, Liang X, Duesbery NS. Anthrax lethal factor proteolysis and inactivation of MAPK kinase. J. Biol. Chem. 2003;278:9402–9406. doi: 10.1074/jbc.M211262200. [DOI] [PubMed] [Google Scholar]
- 3.Bardwell AJ, Abdollahi M, Bardwell L. Anthrax lethal factor-cleavage products of MAPK (mitogen-activated protein kinase) kinases exhibit reduced binding to their cognate MAPKs. Biochem. J. 2004;378:569–577. doi: 10.1042/BJ20031382. [DOI] [PMC free article] [PubMed] [Google Scholar]
- 4.Tanoue T, Nishida E. Molecular recognitions in the MAP kinase cascades. Cell. Signal. 2003;15:455–462. doi: 10.1016/s0898-6568(02)00112-2. [DOI] [PubMed] [Google Scholar]
- 5.Biondi RM, Nebreda AR. Signalling specificity of Ser/Thr protein kinases through docking-site-mediated interactions. Biochem. J. 2003;372:1–13. doi: 10.1042/BJ20021641. [DOI] [PMC free article] [PubMed] [Google Scholar]
- 6.Gaddis BD, Avramova LV, Chmielewski J. Inhibitors of anthrax lethal factor. Bioorg. Med. Chem. Lett. 2007;17:4575–4578. doi: 10.1016/j.bmcl.2007.05.089. [DOI] [PubMed] [Google Scholar]
- 7.Warfel JM, Steele AD, D'Agnillo F. Anthrax lethal toxin induces endothelial barrier dysfunction. Am. J. Pathol. 2005;166:1871–1881. doi: 10.1016/S0002-9440(10)62496-0. [DOI] [PMC free article] [PubMed] [Google Scholar]
- 8.Moayeri M, Leppla SH. The roles of anthrax toxin in pathogenesis. Curr. Opin. Microbiol. 2004;7:19–24. doi: 10.1016/j.mib.2003.12.001. [DOI] [PubMed] [Google Scholar]
- 9.Xiong Y, Wiltsie J, Woods A, Guo J, Pivnichny JV, Tang W, Bansal A, Cummings RT, Cunningham BR, Friedlander AM, Douglas CM, Salowe SP, Zaller DM, Scolnick EM, Schmatz DM, Bartizal K, Hermes JD, MacCoss M, Chapman KT. The discovery of a potent and selective lethal factor inhibitor for adjunct therapy of anthrax infection. Bioorg. Med. Chem. Lett. 2006;16:964–968. doi: 10.1016/j.bmcl.2005.10.088. [DOI] [PubMed] [Google Scholar]
- 10.Turk BE. Discovery and development of anthrax lethal factor metalloproteinase inhibitors. Curr. Pharm. Biotechnol. 2008;9:24–33. doi: 10.2174/138920108783497604. [DOI] [PubMed] [Google Scholar]
- 11.Beers MH, Porter RS, Jones TV. The Merck Manual of Diagnosis and Therapy. 18th ed. Wiley, John & Sons, Incorporated; 2006. [Google Scholar]
- 12.Guarner J, Jernigan JA, Shieh WJ, Tatti K, Flannagan LM, Stephens DS, Popovic T, Ashford DA, Perkins BA, Zaki SR. Pathology and pathogenesis of bioterrorism-related inhalational anthrax. Am. J. Pathol. 2003;163:701–709. doi: 10.1016/S0002-9440(10)63697-8. [DOI] [PMC free article] [PubMed] [Google Scholar]
- 13.Holty JE, Bravata DM, Liu H, Olshen RA, McDonald KM, Owens DK. Systematic review: a century of inhalational anthrax cases from 1900 to 2005. Ann. Intern. Med. 2006;144:270–280. doi: 10.7326/0003-4819-144-4-200602210-00009. [DOI] [PubMed] [Google Scholar]
- 14.Agrawal A, Johnson SL, Jacobsen JA, Miller MT, Chen LH, Pellecchia M, Cohen SM. Chelator fragment libraries for targeting metalloproteinases. ChemMedChem. 2010;5:195–199. doi: 10.1002/cmdc.200900516. [DOI] [PMC free article] [PubMed] [Google Scholar]
- 15.Dell'Aica I, Dona M, Tonello F, Piris A, Mock M, Montecucco C, Garbisa S. Potent inhibitors of anthrax lethal factor from green tea. EMBO Rep. 2004;5:418–422. doi: 10.1038/sj.embor.7400118. [DOI] [PMC free article] [PubMed] [Google Scholar]
- 16.Forino M, Johnson S, Wong TY, Rozanov DV, Savinov AY, Li W, Fattorusso R, Becattini B, Orry AJ, Jung D, Abagyan RA, Smith JW, Alibek K, Liddington RC, Strongin AY, Pellecchia M. Efficient synthetic inhibitors of anthrax lethal factor. Proc. Natl. Acad. Sci. USA. 2005;102:9499–9504. doi: 10.1073/pnas.0502733102. [DOI] [PMC free article] [PubMed] [Google Scholar]
- 17.Gaddis BD, Rubert Perez CM, Chmielewski J. Inhibitors of anthrax lethal factor based upon N-oleoyldopamine. Bioorg. Med. Chem. Lett. 2008;18:2467–2470. doi: 10.1016/j.bmcl.2008.02.044. [DOI] [PubMed] [Google Scholar]
- 18.Hanna ML, Tarasow TM, Perkins J. Mechanistic differences between in vitro assays for hydrazone-based small molecule inhibitors of anthrax lethal factor. Bioorg. Chem. 2007;35:50–58. doi: 10.1016/j.bioorg.2006.07.004. [DOI] [PubMed] [Google Scholar]
- 19.Jacobsen JA, Fullagar JL, Miller MT, Cohen SM. Identifying chelators for metalloprotein inhibitors using a fragment-based approach. J. Med. Chem. 2011;54:591–602. doi: 10.1021/jm101266s. [DOI] [PMC free article] [PubMed] [Google Scholar]
- 20.Jiao GS, Cregar L, Goldman ME, Millis SZ, Tang C. Guanidinylated 2,5-dideoxystreptamine derivatives as anthrax lethal factor inhibitors. Bioorg. Med. Chem. Lett. 2006;16:1527–1531. doi: 10.1016/j.bmcl.2005.12.038. [DOI] [PubMed] [Google Scholar]
- 21.Jiao GS, Simo O, Nagata M, O'Malley S, Hemscheidt T, Cregar L, Millis SZ, Goldman ME, Tang C. Selectively guanidinylated derivatives of neamine. Syntheses and inhibition of anthrax lethal factor protease. Bioorg. Med. Chem. Lett. 2006;16:5183–5189. doi: 10.1016/j.bmcl.2006.07.005. [DOI] [PubMed] [Google Scholar]
- 22.Jiao GS, Cregar L, Wang J, Millis SZ, Tang C, O'Malley S, Johnson AT, Sareth S, Larson J, Thomas G. Synthetic small molecule furin inhibitors derived from 2,5-dideoxystreptamine. Proc. Natl. Acad. Sci. USA. 2006;103:19707–19712. doi: 10.1073/pnas.0606555104. [DOI] [PMC free article] [PubMed] [Google Scholar]
- 23.Jiao GS, Kim S, Moayeri M, Cregar-Hernandez L, McKasson L, Margosiak SA, Leppla SH, Johnson AT. Antidotes to anthrax lethal factor intoxication. Part 1: Discovery of potent lethal factor inhibitors with in vivo efficacy. Bioorg. Med. Chem. Lett. 2010;20:6850–6853. doi: 10.1016/j.bmcl.2010.08.058. [DOI] [PMC free article] [PubMed] [Google Scholar]
- 24.Johnson SL, Jung D, Forino M, Chen Y, Satterthwait A, Rozanov DV, Strongin AY, Pellecchia M. Anthrax lethal factor protease inhibitors: synthesis, SAR, structure-based 3D QSAR studies. J. Med. Chem. 2006;49:27–30. doi: 10.1021/jm050892j. [DOI] [PMC free article] [PubMed] [Google Scholar]
- 25.Johnson SL, Chen LH, Pellecchia M. A high-throughput screening approach to anthrax lethal factor inhibition. Bioorg. Chem. 2007;35:306–312. doi: 10.1016/j.bioorg.2006.12.005. [DOI] [PMC free article] [PubMed] [Google Scholar]
- 26.Johnson SL, Chen LH, Harbach R, Sabet M, Savinov A, Cotton NJ, Strongin A, Guiney D, Pellecchia M. Rhodanine derivatives as selective protease inhibitors against bacterial toxins. Chem. Biol. Drug Des. 2008;71:131–139. doi: 10.1111/j.1747-0285.2007.00617.x. [DOI] [PubMed] [Google Scholar]
- 27.Johnson S, Barile E, Farina B, Purves A, Wei J, Chen LH, Shiryaev S, Zhang Z, Rodionova I, Agrawal A, Cohen SM, Osterman A, Strongin A, Pellecchia M. Targeting metalloproteins by fragment-based lead discovery. Chem. Biol. Drug Des. 2011;78:211–223. doi: 10.1111/j.1747-0285.2011.01136.x. [DOI] [PMC free article] [PubMed] [Google Scholar]
- 28.Johnson SL, Chen LH, Barile E, Emdadi A, Sabet M, Yuan H, Wei J, Guiney D, Pellecchia M. Structure-activity relationship studies of a novel series of anthrax lethal factor inhibitors. Bioorg. Med. Chem. 2009;17:3352–3368. doi: 10.1016/j.bmc.2009.03.040. [DOI] [PMC free article] [PubMed] [Google Scholar]
- 29.Kim S, Jiao GS, Moayeri M, Crown D, Cregar-Hernandez L, McKasson L, Margosiak SA, Leppla SH, Johnson AT. Antidotes to anthrax lethal factor intoxication. Part 2: structural modifications leading to improved in vivo efficacy. Bioorg. Med. Chem. Lett. 2011;21:2030–2033. doi: 10.1016/j.bmcl.2011.02.010. [DOI] [PMC free article] [PubMed] [Google Scholar]
- 30.Lewis JA, Mongan J, McCammon JA, Cohen SM. Evaluation and binding-mode prediction of thiopyrone-based inhibitors of anthrax lethal factor. ChemMedChem. 2006;1:694–697. doi: 10.1002/cmdc.200600102. [DOI] [PubMed] [Google Scholar]
- 31.Li B, Pai R, Cardinale SC, Butler MM, Peet NP, Moir DT, Bavari S, Bowlin TL. Synthesis and biological evaluation of botulinum neurotoxin a protease inhibitors. J. Med. Chem. 2010;53:2264–2276. doi: 10.1021/jm901852f. [DOI] [PMC free article] [PubMed] [Google Scholar]
- 32.Min DH, Tang WJ, Mrksich M. Chemical screening by mass spectrometry to identify inhibitors of anthrax lethal factor. Nat. Biotechnol. 2004;22:717–723. doi: 10.1038/nbt973. [DOI] [PubMed] [Google Scholar]
- 33.Numa MM, Lee LV, Hsu CC, Bower KE, Wong CH. Identification of novel anthrax lethal factor inhibitors generated by combinatorial Pictet-Spengler reaction followed by screening in situ. ChemBioChem. 2005;6:1002–1006. doi: 10.1002/cbic.200500009. [DOI] [PubMed] [Google Scholar]
- 34.Schepetkin IA, Khlebnikov AI, Kirpotina LN, Quinn MT. Novel smallmolecule inhibitors of anthrax lethal factor identified by high-throughput screening. J. Med. Chem. 2006;49:5232–5244. doi: 10.1021/jm0605132. [DOI] [PubMed] [Google Scholar]
- 35.Yuan H, Johnson SL, Chen LH, Wei J, Pellecchia M. A novel pharmacophore model for the design of anthrax lethal factor inhibitors. Chem. Biol. Drug Des. 2010;76:263–268. doi: 10.1111/j.1747-0285.2010.01000.x. [DOI] [PMC free article] [PubMed] [Google Scholar]
- 36.Turk BE, Wong TY, Schwarzenbacher R, Jarrell ET, Leppla SH, Collier RJ, Liddington RC, Cantley LC. The structural basis for substrate and inhibitor selectivity of the anthrax lethal factor. Nat. Struct. Mol. Biol. 2004;11:60–66. doi: 10.1038/nsmb708. [DOI] [PubMed] [Google Scholar]
- 37.Li F, Chvyrkova I, Terzyan S, Wakeham N, Turner R, Ghosh AK, Zhang XC, Tang J. Inhibition of anthrax lethal factor: lability of hydroxamate as a chelating group. Appl. Microbiol. Biotechnol. 2012 doi: 10.1007/s00253-012-3893-7. [DOI] [PMC free article] [PubMed] [Google Scholar]
- 38.Li F, Terzyan S, Tang J. Subsite specificity of anthrax lethal factor and its implications for inhibitor development. Biochem. Biophys. Res. Commun. 2011;407:400–405. doi: 10.1016/j.bbrc.2011.03.033. [DOI] [PMC free article] [PubMed] [Google Scholar]
- 39.Dalkas GA, Chasapis CT, Gkazonis PV, Bentrop D, Spyroulias GA. Conformational dynamics of the anthrax lethal factor catalytic center. Biochemistry. 49:10767–10769. doi: 10.1021/bi1017792. [DOI] [PubMed] [Google Scholar]
- 40.Roy J, Kumar UC, Machiraju PK, Muttineni RK, Kumar BVSS, Gundla R, Dayam R, Sarma JA. Insilico studies on anthrax lethal factor inhibitors: pharmacophore modeling and virtual screening approaches towards designing of novel inhibitors for a killer. J. Mol. Graph. Model. 29:256–265. doi: 10.1016/j.jmgm.2010.07.002. [DOI] [PubMed] [Google Scholar]
- 41.Jacobsen FE, Lewis JA, Cohen SM. The design of inhibitors for medicinally relevant metalloproteins. ChemMedChem. 2007;2:152–171. doi: 10.1002/cmdc.200600204. [DOI] [PubMed] [Google Scholar]
- 42.Tonello F, Seveso M, Marin O, Mock M, Montecucco C. Screening inhibitors of anthrax lethal factor. Nature. 2002;418:386. doi: 10.1038/418386a. [DOI] [PubMed] [Google Scholar]
- 43.Whittaker M, Floyd CD, Brown P, Gearing AJ. Design and therapeutic application of matrix metalloproteinase inhibitors. Chem. Rev. 1999;99:2735–2776. doi: 10.1021/cr9804543. [DOI] [PubMed] [Google Scholar]
- 44.Goldman ME, Cregar L, Nguyen D, Simo O, O'Malley S, Humphreys T. Cationic polyamines inhibit anthrax lethal factor protease. BMC Pharmacol. 2006;6:8. doi: 10.1186/1471-2210-6-8. [DOI] [PMC free article] [PubMed] [Google Scholar]
- 45.Karginov VA, Nestorovich EM, Moayeri M, Leppla SH, Bezrukov SM. Blocking anthrax lethal toxin at the protective antigen channel by using structureinspired drug design. Proc. Natl. Acad. Sci. USA. 2005;102:15075–15080. doi: 10.1073/pnas.0507488102. [DOI] [PMC free article] [PubMed] [Google Scholar]
- 46.Panchal RG, Hermone AR, Nguyen TL, Wong TY, Schwarzenbacher R, Schmidt J, Lane D, McGrath C, Turk BE, Burnett J, Aman MJ, Little S, Sausville EA, Zaharevitz DW, Cantley LC, Liddington RC, Gussio R, Bavari S. Identification of small molecule inhibitors of anthrax lethal factor. Nat. Struct. Mol. Biol. 2004;11:67–72. doi: 10.1038/nsmb711. [DOI] [PubMed] [Google Scholar]
- 47.Lee LV, Bower KE, Liang FS, Shi J, Wu D, Sucheck SJ, Vogt PK, Wong CH. Inhibition of the proteolytic activity of anthrax lethal factor by aminoglycosides. J. Am. Chem. Soc. 2004;126:4774–4775. doi: 10.1021/ja0495359. [DOI] [PubMed] [Google Scholar]
- 48.Kocer SS, Walker SG, Zerler B, Golub LM, Simon SR. Metalloproteinase inhibitors, nonantimicrobial chemically modified tetracyclines, and ilomastat block Bacillus anthracis lethal factor activity in viable cells. Infect. Immun. 2005;73:7548–7557. doi: 10.1128/IAI.73.11.7548-7557.2005. [DOI] [PMC free article] [PubMed] [Google Scholar]
- 49.Houseman BT, Huh JH, Kron SJ, Mrksich M. Peptide chips for the quantitative evaluation of protein kinase activity. Nat. Biotechnol. 2002;20:270–274. doi: 10.1038/nbt0302-270. [DOI] [PubMed] [Google Scholar]
- 50.Min DH, Su J, Mrksich M. Profiling kinase activities by using a peptide chip and mass spectrometry. Angew. Chem. Int. Ed. Engl. 2004;43:5973–5977. doi: 10.1002/anie.200461061. [DOI] [PubMed] [Google Scholar]
- 51.Su J, Mrksich M. Using mass spectrometry to characterize self-assembled monolayers presenting peptides, proteins, and carbohydrates. Angew. Chem. Int. Ed. Engl. 2002;41:4715–4718. doi: 10.1002/anie.200290026. [DOI] [PubMed] [Google Scholar]
- 52.Kim C, Gajendran N, Mittrucker HW, Weiwad M, Song YH, Hurwitz R, Wilmanns M, Fischer G, Kaufmann SH. Human alpha-defensins neutralize anthrax lethal toxin and protect against its fatal consequences. Proc. Natl. Acad. Sci. USA. 2005;102:4830–4835. doi: 10.1073/pnas.0500508102. [DOI] [PMC free article] [PubMed] [Google Scholar]
- 53.Dalkas GA, Papakyriakou A, Vlamis-Gardikas A, Spyroulias GA. Low molecular weight inhibitors of the protease anthrax lethal factor. Mini. Rev. Med. Chem. 2008;8:290–306. doi: 10.2174/138955708783744083. [DOI] [PubMed] [Google Scholar]
- 54.Agrawal A, de Oliveira CA, Cheng Y, Jacobsen JA, McCammon JA, Cohen SM. Thioamide hydroxypyrothiones supersede amide hydroxypyrothiones in potency against anthrax lethal factor. J. Med. Chem. 2009;52:1063–1074. doi: 10.1021/jm8013212. [DOI] [PMC free article] [PubMed] [Google Scholar]
- 55.Shoop WL, Xiong Y, Wiltsie J, Woods A, Guo J, Pivnichny JV, Felcetto T, Michael BF, Bansal A, Cummings RT, Cunningham BR, Friedlander AM, Douglas CM, Patel SB, Wisniewski D, Scapin G, Salowe SP, Zaller DM, Chapman KT, Scolnick EM, Schmatz DM, Bartizal K, MacCoss M, Hermes JD. Anthrax lethal factor inhibition. Proc. Natl. Acad. Sci. USA. 2005;102:7958–7963. doi: 10.1073/pnas.0502159102. [DOI] [PMC free article] [PubMed] [Google Scholar]
- 56.Chiu TL, Solberg J, Patil S, Geders TW, Zhang X, Rangarajan S, Francis R, Finzel BC, Walters MA, Hook DJ, Amin EA. Identification of novel non-hydroxamate anthrax toxin lethal factor inhibitors by topomeric searching, docking and scoring, and in vitro screening. J. Chem. Inf. Model. 2009;49:2726–2734. doi: 10.1021/ci900186w. [DOI] [PMC free article] [PubMed] [Google Scholar]
- 57.Guner OF. Pharmacophore modeling in drug design: recent advances. Curr. Comput. Aided Drug Des. 7:158. doi: 10.2174/157340911796504341. [DOI] [PubMed] [Google Scholar]
- 58.Khedkar SA, Malde AK, Coutinho EC, Srivastava S. Pharmacophore modeling in drug discovery and development: an overview. Med. Chem. 2007;3:187–197. doi: 10.2174/157340607780059521. [DOI] [PubMed] [Google Scholar]
- 59.Yang SY. Pharmacophore modeling and applications in drug discovery: challenges and recent advances. Drug Discov. Today. 15:444–450. doi: 10.1016/j.drudis.2010.03.013. [DOI] [PubMed] [Google Scholar]
- 60.Roy J, Kumar UC, Machiraju PK, Muttineni RK, Kumar BVSS, Gundla R, Dayam R, Sarma JA. Insilico studies on anthrax lethal factor inhibitors: pharmacophore modeling and virtual screening approaches towards designing of novel inhibitors for a killer. J. Mol. Graph. Model. 2010;29:256–265. doi: 10.1016/j.jmgm.2010.07.002. [DOI] [PubMed] [Google Scholar]
- 61.Richmond NJ, Abrams CA, Wolohan PR, Abrahamian E, Willett P, Clark RD. GALAHAD: 1. pharmacophore identification by hypermolecular alignment of ligands in 3D. J. Comput. Aided Mol. Des. 2006;20:567–587. doi: 10.1007/s10822-006-9082-y. [DOI] [PubMed] [Google Scholar]
- 62.Cottrell SJ, Gillet VJ, Taylor R, Wilton DJ. Generation of multiple pharmacophore hypotheses using multiobjective optimisation techniques. J. Comput. Aided Mol. Des. 2004;18:665–682. doi: 10.1007/s10822-004-5523-7. [DOI] [PubMed] [Google Scholar]
- 63.Gillet VJ, Willett P, Fleming PJ, Green DV. Designing focused libraries using MoSELECT. J. Mol. Graph. Model. 2002;20:491–498. doi: 10.1016/s1093-3263(01)00150-4. [DOI] [PubMed] [Google Scholar]
- 64.Berman HM, Westbrook J, Feng Z, Gilliland G, Bhat TN, Weissig H, Shindyalov IN, Bourne PE. The Protein Data Bank. Nucleic Acids Res. 2000;28:235–242. doi: 10.1093/nar/28.1.235. [DOI] [PMC free article] [PubMed] [Google Scholar]
- 65.GALAHAD Manual, SYBYL 8.0. Tripos, Inc.; 2007. pp. 17pp. 70–71. [Google Scholar]
- 66.Stierand K, Maaβ PC, Rarey M. Molecular complexes at a glance: automated generation of two-dimensional complex diagrams. Bioinformatics. 2006;22:1710–1716. doi: 10.1093/bioinformatics/btl150. [DOI] [PubMed] [Google Scholar]
- 67.Brickmann J, Exner TE, Keil M, Marhöfer RJ. Molecular Graphics - Trends and Perspectives. J. Mol. Model. 2000;6:328–340. [Google Scholar]
- 68.Halgren TA. MMFF VII. Characterization of MMFF94, MMFF94s, and other widely available force fields for conformational energies and for intermolecularinteraction energies and geometries. J. Comput. Chem. 1999;20:730–748. doi: 10.1002/(SICI)1096-987X(199905)20:7<730::AID-JCC8>3.0.CO;2-T. [DOI] [PubMed] [Google Scholar]
- 69.Halgren TA. MMFF VI. MMFF94s option for energy minimization studies. J. Comput. Chem. 1999;20:720–729. doi: 10.1002/(SICI)1096-987X(199905)20:7<720::AID-JCC7>3.0.CO;2-X. [DOI] [PubMed] [Google Scholar]
- 70.Jain AN. Surflex: Fully automatic flexible molecular docking using a molecular similarity-based search engine. J. Med. Chem. 2003;46:499–511. doi: 10.1021/jm020406h. [DOI] [PubMed] [Google Scholar]
- 71.Jain AN. Virtual screening in lead discovery and optimization. Curr. Opin. Drug Discov. Devel. 2004;7:396–403. [PubMed] [Google Scholar]
- 72.Jain AN. Surflex-Dock 2.1: robust performance from ligand energetic modeling, ring flexibility, and knowledge-based search. J. Comput. Aided Mol. Des. 2007;21:281–306. doi: 10.1007/s10822-007-9114-2. [DOI] [PubMed] [Google Scholar]
- 73.Pham TA, Jain AN. Parameter estimation for scoring protein-ligand interactions using negative training data. J. Med. Chem. 2006;49:5856–5868. doi: 10.1021/jm050040j. [DOI] [PubMed] [Google Scholar]
- 74.Meng CSB, Kuntz I. Automated docking with grid-based energy evaluation. J. Comp. Chem. 1992;13:505–524. [Google Scholar]
Associated Data
This section collects any data citations, data availability statements, or supplementary materials included in this article.