

Abstract
Presented is an extension of the CHARMM General force field (CGenFF) to enable the modeling of sulfonyl-containing compounds. Model compounds containing chemical moieties such as sulfone, sulfonamide, sulfonate and sulfamate were used as the basis for the parameter optimization. Targeting high-level quantum mechanical and experimental crystal data, the new parameters were optimized in a hierarchical fashion designed to maintain compatibility with the remainder of the CHARMM additive force field. The optimized parameters satisfactorily reproduced equilibrium geometries, vibrational frequencies, interactions with water, gas phase dipole moments and dihedral potential energy scans. Validation involved both crystalline and liquid phase calculations showing the newly developed parameters to satisfactorily reproduce experimental unit cell geometries, crystal intramolecular geometries and pure solvent densities. The force field was subsequently applied to study conformational preference of a sulfonamide based peptide system. Good agreement with experimental IR/NMR data further validated the newly developed CGenFF parameters as a tool to investigate the dynamic behavior of sulfonyl groups in a biological environment. CGenFF now covers sulfonyl group containing moieties allowing for modeling and simulation of sulfonyl-containing compounds in the context of biomolecular systems including compounds of medicinal interest.
Keywords: empirical force field, molecular mechanics, molecular dynamics, molecular modeling, potential energy function, sulfonamide, β-strand mimetic, peptidomimetic, medicinal chemistry, drug design
Introduction
Sulfonyl-containing compounds, with the general formula R-S(=O)2-R′ (Figure 1(a)), compose an important class of chemical moieties that are of medicinal and industrial interest. These include variations of the sulfonyl group such as sulfone (R=C, R′=C), sulfonate (R=C, R′=O), sulfonamide (R=C, R′=N), and sulfamate (R=N, R′=O). Sulfone derivatives were found to have varied antibacterial activities1 and are seen in several commercial pharmaceutical products including the drug Dapsone.2 In polymer form sulfone derivatives have gained prominence in material science, being used as the basis for proton exchange membranes due to their excellent chemical and thermal stability.3 Sulfonate derivatives, or so-called sulfonic esters, include bioactive compounds4,5 and are used as DNA alkylating agents to induce mutagenesis in experiments.6 As the R-SO2O− moiety is a good leaving group, sulfonate derivatives are commonly used as reagents in organic synthesis.7 And in a final example, sulfonate anions are frequently used in the studies of ionic liquids.8
Figure 1.

Sulfonyl group containing chemical moieties (a) and model compounds for acyclic (b) and cyclic (c) sulfonamide, sulfone (d), sulfonate (e) and sulfamate (f) used in the force field development.
Sulfonamides are common in medicinal compounds and have been shown to have various inhibitory activities such as antibacterial, antitumor, antithyroid and anti-carbonic anhydrase activities.9,10 They have long been in clinical use and occur in many commercial drugs such as hydrochlorothiazide (HCTZ) in a cyclic form and sulfisoxazole in an acyclic form.11 In addition, the sulfonamide motif plays an important role in organic synthesis12 and serves as a useful linkage to create novel analogs of peptides,13 DNA14 and saccharides.15 Also, their polymer forms have applications in the fields of biomedical and bioengineering as hydrogels.16 Though not as common as sulfonamides, sulfamate derivatives have specific biological activities and occur in therapeutic agents such as steroid sulfatase17 and aminoacyl-tRNA synthetases inhibitors.18 These species are also used as linkages in organic synthesis to introduce chemical diversity and to generate new biologically active compounds.19
Computational approaches are useful to improve understanding of structure, function and dynamic processes of molecules, which helps interpret experimental results and guide the design of experiments. A number of quantum mechanical (QM) studies employing semi-empirical, ab initio and density functional theory (DFT) methods have been performed on sulfonyl-containing compounds to understand their conformational preference,20 infrared vibrational (IR) spectra,21,22 nuclear magnetic resonance (NMR) chemical shifts,23 hydrogen bonding,24 gas-phase acidity25 and basicity,26 pKa, lipophilicity and solubility.27 However, while often of high accuracy, the polynomial increase in cost of QM calculations with increased system size* limits their application to study larger systems such as ligand-protein complexes and biomolecular conformational changes in aqueous environments. To study these and related types of systems, force field based molecular mechanics (MM) approaches offer great potential.
As MM methods are based on simple parametric energy functions, the quality of the force field parameters determines the reliability of the MM results.28 Targeting high-level QM and experimental data, the CHARMM additive all-atom force field has been developed for proteins,29,30 nucleic acids,31–34 lipids35,36 and carbohydrates37,38 and shown to be capable of accurately reproducing a number of experimental results.39 Compatible with the remainder of the CHARMM additive force field, the CHARMM General Force Field (CGenFF) is aimed at simulating drug-like molecules.40 Based on a consistent optimization protocol, CGenFF was designed to be highly general, covering a wide range of chemical functionalities. CGenFF is designed such that parameters from highly optimized chemical building blocks can be easily combined into larger molecules that contain those functional units. This allows for treatment of a wide range of molecules, with the range of molecules as well as the quality of the model only limited by the range of chemical entities for which CGenFF has been parameterized.
In this paper, CGenFF is extended to cover sulfonyl-containing chemical groups. Parameters for a series of sulfonyl-containing model compounds, including sulfones, sulfonates, sulfonamides and sulfomates, were fully optimized in a hierarchical fashion targeting high-level QM and experimental crystal data. The developed parameters were validated by comparing computed crystal intramolecular geometries and unit cell parameters as well as pure solvent densities with experimental reference values. The parameters were then used to study the conformational preference of a sulfonamide containing peptide system, showing their utility to study the role of a sulfonyl chemical group in a biomolecular context.
Methods
All empirical force field calculations were performed with the CHARMM program41 using the same potential energy function as used for the remainder of the CHARMM all-atom additive force field as previously described.29 Quantum mechanical (QM) calculations were performed using the Gaussian 09 program.42 Geometry optimizations and vibrational calculations were done at the MP2/6-31G(d) level43,44 with tight tolerances and target QM frequencies were scaled by 0.943 to account for limitations in the level of theory.45 To obtain QM target data for charge optimization, water molecules in the TIP3P geometry were individually placed at optimized geometries interacting with hydrogen bond donors and acceptor in the model compound at its monomer MP2/6-31G(d) optimized conformation. The interaction distance was optimized at the HF/6-31G(d) level with all other degrees of freedom fixed for each interacting pair. In order to yield parameters appropriate for the condensed phase simulation, the HF/6-31G(d) interaction energies were scaled by a factor of 1.16 and an offset of −0.2 Å was targeted for moderate to strong model compound-water interactions.28,46 Relaxed potential energy scans (PES) were performed at the MP2/6-31G(d) level; during the scan, the dihedral angle(s) being scanned was constrained while other degrees of freedom were fully optimized. For sulfonamide model compounds with amino group, improper dihedral PES were performed on the nitrogen with an increment of 3°; the same increment was used for out-of-plane scans of the cyclic sulfonamide model compound. In other cases, PES scans were performed either with an increment of 10° for asymmetric molecules (full 360° degree range) or an increment of 5° for symmetric molecules (180° or 120° degree range depending on the symmetry). Tests at the MP2/cc-pVTZ//MP2/6-31G(d) level of theory were also performed to get a general idea on how the PES results depend on the basis set. Similar PESs were found for the 4 representative model compounds tested, as shown in the Figure S1 of the supporting information (SI), with a root mean square difference of 0.4 kcal/mol. Thus, the MP2/6-31G(d) level of theory is a good compromise between accuracy and efficiency for the PESs of the studied systems.
Gas phase MM energy minimizations were performed using the conjugate gradient minimization method followed with the Newton-Raphson minimization algorithm to a gradient tolerance of 10−5 kcal/(mol Å) using an infinite nonbond interaction cutoff distance. Vibrational calculations were done using the VIBRAN module and corresponding potential energy distribution (PED) analyses were carried out using MOLVIB module with internal valence coordinates as proposed by Pulay et al.47 Water was modeled using a modified version of the TIP3P water model.48,49 MM PES were performed by reading the QM geometries of all the scan points into CHARMM and harmonic restrains with force constant of 10,000 kcal/(mol radian) were placed on the target dihedral angle(s) followed by minimization of all other degrees of freedom.
Crystal and pure solvent molecular dynamics (MD) simulations were performed using periodic boundary conditions.50 The particle mesh Ewald method51 with a real space cutoff of 12 Å was used to treat Coulomb interactions and a force-switching function52 was applied to smooth Lennard-Jones (LJ) interactions over the range of 10 – 12 Å. For LJ interactions beyond 12 Å, a long-range correction was applied.50 The Leapfrog integrator53 was used with a time step of 1 fs (crystal) or 2 fs (pure solvent) to integrate the equations of motion. The SHAKE algorithm54 was applied to constrain the length of covalent bonds involving hydrogen to their equilibrium values. The isothermal-isobaric ensemble (NPT) was generated with Nosé-Hoover thermostat55,56 and Langevin piston barostat.57
Crystal simulations were initiated with structures retrieved from the Cambridge Structural Database (CSD)58. Periodic boundary conditions were set up in accordance with the experimental unit cell length and angle parameters. With harmonic restraints of 1 kcal/(mol Å) on all atoms, each system was first minimized with 1,000 steepest descent (SD) steps followed by 500 adopted basis Newton-Raphson (ABNR) steps and then gradually heated to the relevant experimental temperature during a 100 ps MD simulation. This was followed by a 100 ps simulation in the NVT ensemble with the same harmonic restraints and another 100 ps NVT simulation without any restraints. Then a 100 ps NPT simulation at the experimental temperature and pressure was performed to further equilibrate the system and finally a 5 ns production run was performed. Unit cell length parameters were allowed to vary independently with unit cell angle parameters of 90° were constrained, while those not 90° were allowed to vary independently.
For pure solvent simulations, a cubic box containing 125 copies of the model compound was constructed by placing a copy of the molecule on each grid point of a cubic 5×5×5 lattice. The grid spacing was chosen to correspond to the experimental molecular volume. Each system was first minimized with 500 SD steps and then gradually heated to the relevant experimental temperature during a 10 ps MD simulation. This was followed by a 10 ps NVT equilibrium and a 500 ps NPT simulation to further equilibrate the system. The production simulations were performed for 5 ns and the volume of the systems were monitored allowing for calculation of the density using eq. (1).
| (1) |
Here, N is the number of molecules and MW is the molecular weight of the model compound in atomic mass unit, <V> is the average volume of the whole system calculated in Å 3 and the calculated density ρ is in g/cm3. The experimental density data were collected from the CRC Handbook of Chemistry and Physics.59
The simulation of a sulfonamide-based peptide in deuterated chloroform solution at room temperature13 was performed using the CHARMM22 protein force field with CMAP correction30 in combination with the developed CGenFF parameters. The rigid chloroform model of Dietz and Heinzinger (DH model),60 which has been shown to reproduce the experimental liquid properties61 was translated into CHARMM parameter format and used to describe chloroform. System preparation involved generation of a cubic box containing 512 copies of chloroform by placing each molecule on the grid points of a cubic 8×8×8 lattice. The grid spacing was chosen to correspond to the experimental density of deuterated chloroform at 25 °C which is 1.50 g/cm3. The scalar facility in CHARMM was used to set the mass of the hydrogen atom in chloroform from that of a proton to that of a deuterium. The peptide in its extended structure was then placed in the deuterated chloroform box and chloroform molecules within 2 Å from the peptide were deleted and a harmonic restraint of 1 kcal/(mol Å) was applied to the center of mass of the peptide using CHARMM’s MMFP facility to keep it in the center of the box during the simulation. The SHAKE algorithm was applied to constrain covalent bonds involving hydrogen and to keep the chloroform molecule rigid. The same Coulomb and LJ interaction treatments, integrator, thermostat and barostat setups as described above were used for the simulation.
The system was minimized with 1000 SD steps and then gradually heated to the relevant experimental temperature during a 10 ps MD simulation. This was followed by a 10 ps NVT equilibration and a 100 ps NPT simulation to further equilibrate the system. In order to obtain enhanced sampling, temperature replica exchange MD simulations62 using the REPDstr facility in CHARMM were performed for the production run. Eight replicas with temperatures in the range of 298 K to 340 K using exponential spacing (298.0, 303.7, 309.4, 315.3, 321.3, 327.4, 333.7 and 340.0 K) were simulated simultaneously for 10 ns with exchanges conducted every 2 ps during the simulation. As a result, dramatic structural changes occurred during the first 2 ns and, thus, this portion of the trajectory was treated as equilibration. Only the last 8 ns MD trajectory of the first replica was used for the final structural analysis.
Results and Discussion
1. Parameter optimization overview
The general parametrization procedure has been fully described40 and only a brief introduction is given here. Following creation of the topology, including assignment of atom types from CGenFF, missing parameters were identified and their initial values transferred from existing parameters by analogy. Initial partial atomic charges were either assigned from similar available chemical groups by analogy, or MP2/6-31G(d) level Merz-Kollman charges63,64 were used. Optimization involves an iterative procedure initiated from the MP2/6-31G(d) optimized geometry. Optimization of the charges is based on reproducing the QM water-model compound interaction energies and distances as well as the gas phase dipole moments. Generally, the deviation from the scaled HF/6-31G(d) interaction energy should be within 0.2 kcal/mol, and for neutral polar molecules, the QM dipole moment should be overestimated by 20 to 50% and its orientation should be reproduced. Next, equilibrium values of bond and angle parameters are optimized to reproduce the QM geometry with deviations within 0.03 Å and 3° for bonds and angles, respectively. Force constants are optimized to reproduce the QM PED while aiming for an average deviation of 5% from the scaled QM vibrational frequencies. The dihedral force constants are further optimized targeting the QM PES. Usually, only dihedral parameters defined based on non-hydrogen atoms are optimized based on the PES, with exceptions for dihedrals that involve a strong hydrogen donor such as a hydroxyl group. Following the initial round of optimization, the MM geometry is used and the entire procedure is repeated until convergence; typically only one or two iterations are needed.
During creation of the model compound topologies, new atom types were only introduced when available atom types and their associated parameters did not satisfactorily reproduce the target data. For example, though no atom type with the same chemical environment is found for the sulfonamide nitrogen, the existing atom type used for methylamine nitrogen was adopted considering their similar geometry in our QM calculations. For the sulfur atom, the existing atom types for sulfoxide and sulfate were first considered. However, in both cases, the associated S=O and S-C bond parameters yield overestimated sulfonamide S=O and S-C bond lengths, requiring that a new sulfur atom type be introduced and used for all neutral sulfonyl containing model compounds.
As multiple model compounds contain the same parameters, a hierarchical optimization scheme was used. The model compound with the fewest new parameters was optimized first. Shared parameters were then transferred to the next model compound and new parameters for that compound optimized. If a transferred parameter did not reproduce its related target data, a compromise was made between the optimum parameter for the current compound and the original transferred parameter. The procedure was applied to all the relevant compounds and repeated until all the compounds in the set were fully optimized. In all cases, parametrization was performed in a self-consistent fashion such that whenever one parameter was changed, all properties of all affected compounds were recomputed and other parameters were re-optimized as necessary.
Special attention was paid to covalent bonds involving sulfur. For sulfonamides, MP2 geometries are in good agreement with experimental gas phase geometries.20 However, significant differences occur between the gas and condensed phases for S=O, S-N and S-O bonds, a trend also observed for P-O bonds in phosphates.65,66 In our case, the average MP2 S=O, S-N and S-O bond lengths were 1.463, 1.684, and 1.652 Å, respectively, considering all related model compounds. In contrast, the corresponding condensed phase values are 1.433 Å, 1.621 Å and 1.595 Å, respectively, based on CSD crystal surveys of all related compounds with R values less than 0.05. As the force field is designed for simulations in the condensed phase, optimizing the parameters targeting only the QM bond lengths was inappropriate. Therefore, after the parametrization targeting the QM geometries, the final set of parameters was optimized to reproduce both the crystal and QM geometries, with emphasis on the crystal data. For example, the final MM S-O bond length was designed to be between the crystal average value of 1.595 Å and the QM average value of 1.652 Å, with emphasis on the crystal data resulting in a value around 1.610 Å.
For new sulfur atom types, ideally the LJ parameters are optimized to reproduce pure solvent properties. However, for sulfonyl containing model compounds, due to their high melting points, no liquid heats of vaporization are known and only a few experimental liquid densities are available. Some heats of sublimation data can be found for sulfone derivatives, but no information about the experimental temperature and crystal form is given. While this limited rigorous optimization of those parameters, as the sulfur atom is surrounded by two oxygen atoms and two additional non-hydrogen atoms, the LJ parameters are expected to have relatively little influence on the condensed phase properties. Consistent with this, LJ parameters from dimethylsulfoxide67 used for the new sulfur atom type were shown to reproduce the experimental pure solvent densities for sulfonate and sulfone model compounds quite well.
2. Sulfonamides
As the sulfonamide group is a common motif in medicinal chemistry, special emphasis was placed on this moiety. Eight model compounds including both acyclic and cyclic species were used in the optimization, including methanesulfonamide (MSAM), benzenesulfonamide (BSAM), N-methyl-methanesulfonamide (MMSM), N-methyl-benzenesulfonamide (MBSM), N-ethyl-ethanesulfonamide (EESM), N-phenyl-methanesulfonamide (PMSM), N-phenyl-benzenesulfonamide (PBSM) and 1,1-dioxo-3,4-dihydro-2H-1,2,4-benzothiadiazine (OBTZ) (Figure 1(b) and 1(c)). This collection of compounds includes both aliphatic and aromatic substitutions at both the sulfonamide S (S terminus) and N (N terminus) atom side as well as a cyclic analog.
Acyclic model compounds
Consistent with a hierarchical optimization scheme, model compound MSAM was first optimized and the resultant parameters transferred to BSAM. The scheme was continued with model compound MMSM and followed by MBSM, EESM, PMSM and finally to PBSM. Only atomic partial charges on unique moieties in the new compounds were optimized, while charges on entities transferred from the parent compound were maintained. For example, charges on the amino group and the two sulfonyl oxygen atoms in BSAM were directly transferred from MSAM. Aromatic C-H groups were assigned the standard charges of −0.115 and +0.115 on carbon and hydrogen atoms, respectively. Only atomic partial charges on the sulfur atom and adjacent aromatic carbon atom were optimized. Atomic charges for the sulfonamide of EESM were transferred from MMSM and additional methyl groups were assigned the CGenFF standard charges, shifting the charge of +0.09 on the methyl hydrogen atoms that were removed during the creation of EESM into their respective parent carbon atoms to retain a net charge of zero. The transferred charges yielded satisfactory agreement with QM dipole moments and water interactions, supporting the notion of transferability of group charges in CGenFF.
Figure 2 presents the MM PESs for all model compounds using the final set of optimized parameters along with the QM results. As seen, the QM PESs were reproduced to a satisfactory level of accuracy in all cases. Aside from their use as target data for the dihedral parametrization, the QM S-N PESs show some chemically interesting trends. Compared to MSAM, the S-N PES in BSAM shows a lower barrier and the energy difference between the two minima is smaller by about 2 kcal/mol. This can be attributed to the flat geometry of phenyl group compared to methyl group, which allows the amino group to rotate more easily. A similar effect occurs with MBSM and PMSM when compared to MMSM. In PBSM, the minimum near 60° is energetically favored by 2 kcal/mol, possibly due to favorable stacking interactions between the two phenyl groups. All these effects are reproduced satisfactorily in the MM PESs. Moreover, the good agreement between the MM and QM PESs in EESM and MMSM indicates a high-level of transferability of dihedral parameters involving aliphatic carbon atoms (e.g., atom type CG331 and CG321).
Figure 2.

Dihedral PESs for the acyclic sulfonamide model compounds. Solid line represents QM data and dashed line for MM data. Surfaces are in 3° increments for (a)–(c), 5° increment for (f), and 10° increments for the others. Discontinuities are related to simultaneous changes of dihedral or improper dihedral angles other than the one being scanned; pyramidal inversions of sulfonamide nitrogen atoms were particularly common in this respect.
The rotational barriers around S-C and S-N bond in para-methyl-benzenesulfonamide have been studied by Petrov et al..20 With the only distinction being an additional methyl group attached to the phenyl ring in para-position, similar behavior as in BSAM is expected. Two stable conformers defined as staggered, where the amino group is staggering the S-C bond, and eclipsed, where the amino group is eclipsing the sulfonyl group, were located in this previous study, which correspond to the two minima shown in Figure 2(b). In Petrov et al.’s study, the energy difference between these two minima was 1.00 kcal/mol at the MP2/6-31G(d,p) level and the energy barrier around the S-N bond was 4.37 kcal/mol at the B3LYP/6-311+G(d,p) level, which are similar to the value of 1.09 and 4.86 kcal/mol obtained in the present work. Moreover, their MP2/6-31G(d,p) and B3LYP/6-311+G(d,p) N-S-C-C PES plots are similar to that for BSAM as shown in Figure 2(c). The energy barrier for this rotation was evaluated to be 1.75 kcal/mol at both QM levels in Ref. 20, similar to the value that occurs in Figure 2(c).
The ability of the optimized parameters to reproduce QM geometries, vibrational frequencies, water interactions and dipole moments are presented in Tables S1–S28 in the SI. Statistical analysis of the total performance of the force field considering all the listed properties is shown in Table 1. Generally, the overall quality of all acyclic sulfonamide parameters is good, with the average deviations within the CGenFF target ranges. The RMS deviations for bonds, angles and dihedrals are 0.019 Å, 1.27° and 3.2°, respectively, which are similar to the RMS deviations for all compounds in the previous CGenFF release (0.016 Å, 1.51° and 7.3°). The S-N and S-O bond lengths are systematically underestimated compared to corresponding MP2 level data in order to reproduce crystal bond lengths. The vibrational frequencies are within acceptable limits with the average deviation of 4.6% indicating that the frequencies are slightly overestimated on average. The larger RMS deviation is caused by relatively high percent deviations in the frequencies lower than 100 cm−1. However, as these lower frequencies correspond to torsional vibrational modes that are generally parametrized targeting QM PESs, they are considered irrelevant. QM interaction energies with water are well reproduced with an RMS deviation of 0.24 kcal/mol, and the average deviation of −0.24 Å for the water interaction distances is ideal to reproduce bulk phase properties (see below). The gas phase dipole moments are systematically overestimated by 11% and the orientations of the MM dipole moments are, on average, within 6° of the QM orientations.
Table 1.
Statistical analysis of the difference between the final MM and QM geometries, vibrational frequencies, interactions with waters and dipole moments for all acyclic sulfonamide model compounds.
| Data points | AD | RMSD | AAD | |
|---|---|---|---|---|
| Bond lengths (Å) | 124 | −0.002 | 0.019 | 0.014 |
| Valence Angles (°) | 207 | 0.02 | 1.27 | 0.90 |
| Dihedrals (°) | 51 | 0.2 | 3.2 | 1.9 |
| Vibrational frequencies | 277 | 4.6% | 27.9% | 6.8% |
| Water interaction energies (kcal/mol) | 38 | 0.03 | 0.24 | 0.20 |
| Water interaction distances (Å) | 38 | −0.24 | 0.24 | 0.24 |
| ||μ|| | 7 | 11.3% | 12.5% | 11.3% |
| μ direction (°) | 7 | 5.7 | 6.4 | 5.7 |
Average deviation (AD), root mean square deviation (RMSD), and absolute average deviation (AAD) are presented for each property. Only the vibrational frequencies lower than 2700 cm−1 were considered. All bonds and angles in a molecule were counted, while only one dihedral for each rotational bond in a molecule was considered. For symmetric molecules, only one out of the symmetric hydrogen bond donors/acceptors was considered for water interactions. The QM level of theory is MP2/6-31G(d) for geometries, frequencies and dipole moments and HF/6-31G(d) for water interactions. Same for the following statistical analyses of other model compounds.
Cyclic model compound
Optimization of our cyclic model compounds is complicated by the additional rigidity introduced by the ring closure. One of the consequences of this is an increased parameter correlation, as several dihedral parameters and even angles can contribute to the same PES. To partially overcome this problem, dihedral parameters transferred from a corresponding acyclic molecule were used as a starting guess to optimize the dihedral parameters in the cyclic sulfonamide model compound OBTZ.
There are a total of six rotatable bonds in the sulfonamide-containing ring of OBTZ. CGenFF parameters from ortho-disubstituted benzene were used for the bridging C-C bond and parameters for the C-S bond were obtained from MBSM. To facilitate the optimization of the remaining dihedral parameters, an acyclic model compound analogous to OBTZ was designed (Figure 1C) and used for initial parameter optimization. In a first attempt, only the dihedral parameters containing non-hydrogen atoms were optimized. However, due to the inability to satisfactorily reproduce the QM PESs, the dihedral parameters involving the sulfonamide hydrogen atoms were also optimized, using additional QM scans on the improper dihedrals around the two sulfonamide nitrogen atoms as an additional source of target data.
MM PESs calculated using the final set of parameters are presented in the left column of Figure 3 for the acyclic model compound, along with the QM PESs. Overall, QM barriers and minima on the PES around the C-S-N-C dihedral were well reproduced. For S-N-C-N, although the shape and the locations of the maxima and minima were well reproduced, the relative energy of the local minimum on the right was overestimated. However, since the low energy regions were well reproduced, the difference in the local minimum in a relatively high-energy region was considered acceptable. A similar trend is seen for the N-C-N-C dihedral, except that this time the local minimum in question is only 2.6 kcal/mol higher than the global minimum in the QM, compared to 6.3 kcal/mol in the MM. Although this discrepancy is thermodynamically relevant, neither the S-N-C-N nor the N-C-N-C PES can be improved without introducing serious discrepancies in the N2 and N4 improper dihedral PESs and in the corresponding out-of-plane wagging motions of the sulfonamide and aniline-type hydrogen atoms, which were considered more important. In the end, the overall shape and locations of the minima in the N2 improper dihedral PES were well reproduced (Fig. 3(e1)); although the energy barrier was slightly overestimated, the energy difference between the two minima was well represented. For the N4 improper dihedral, the relative energy of the local minimum at the right was underestimated and the barrier overestimated, but as discussed above, this cannot be improved without sacrificing the performance on other PESs. The final set of parameters reflects the overall compromise made between these different PESs.
Figure 3.

Dihedral PESs for OBTZ (right column) and OBTZ related acyclic model compound (left column). Solid line represents QM data and dashed line for MM data. Surfaces are in 3° increments for (e1), (f1), (e2) and (f2), 5° increments for (a2)–(d2) and (g2), and 10° increments for the others.
The right column of Figure 3 represents the MM PESs of OBTZ using the dihedral parameters derived from the acyclic model compound. A general trend is that the energy barriers were elevated in OBTZ compared to the acyclic model compound due to the ring strain. For the same reason, the dihedral scans were limited to −90° to 90°. Similar difference patterns between MM and QM were observed for OBTZ as discussed above for the corresponding acyclic model compound. These include overestimated barriers on the S-N-C-N, N-C-N-C and N2 improper PESs, a shift in the minimum on the C-N-C-C PES, and opposite relative energy ordering of the two minima on N4 improper PES. However, the low energy regions of all PESs were reasonably reproduced, which is romising given the fact that all dihedral parameters were optimized using an acyclic counterpart and then directly applied to the cyclic compound. This demonstrates that CGenFF parameters that are optimized in a consistent way are reasonably transferrable between similar compounds. Though not included in the optimization, the N-S-C-C PES dihedral is also presented in Figure 3(g2) and the reasonable agreement between MM and QM further validates the transferability of the dihedral parameters, which in this case were optimized for MBSM.
The eight hydrogen bond donor/accepter - water pairs shown in Figure 4 were used to optimize atomic partial charges for oxygen, nitrogen as well as sulfonamide hydrogen atoms in OBTZ. The final set of optimized charges yields good agreement between MM and QM water interaction energies with differences lower that 0.3 kcal/mol as shown in Table 2. The interaction distances are typically underestimated by approximately 0.2 Å. As shown in Table 3, the magnitude of the dipole moment is overestimated by 26% compared to the MP2 value, which is desirable to correctly reproduce bulk phase properties. Also, the direction of the dipole moment vector deviates only 3.5° from the MP2 result.
Figure 4.
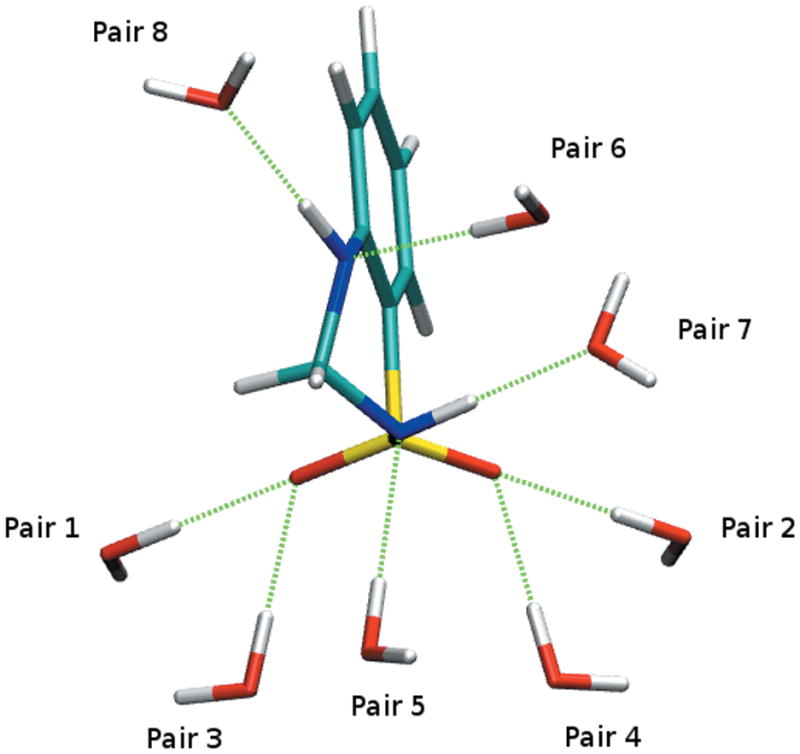
Interaction orientations of OBTZ with water molecules that were used for charge optimization.
Table 2.
MM and HF/6-31G(d) level interaction energies (kcal/mol) and distances (Å) of OBTZ water complexes as shown in Figure 4.
| Interaction Geometry | ΔE (QM)a | ΔE (MM) | Difference | r (QM) | r (MM) | Difference |
|---|---|---|---|---|---|---|
| Pair 1 | −5.04 | −4.74 | 0.30 | 2.12 | 1.88 | −0.24 |
| Pair 2 | −4.80 | −4.71 | 0.09 | 2.13 | 1.88 | −0.25 |
| Pair 3 | −5.53 | −5.77 | −0.23 | 2.10 | 1.83 | −0.27 |
| Pair 4 | −5.11 | −5.34 | −0.23 | 2.11 | 1.84 | −0.27 |
| Pair 5 | −1.93 | −1.91 | 0.02 | 2.34 | 2.11 | −0.23 |
| Pair 6 | −2.47 | −2.60 | −0.13 | 2.19 | 1.95 | −0.24 |
| Pair 7 | −5.76 | −5.67 | 0.09 | 2.02 | 1.83 | −0.19 |
| Pair 8 | −7.28 | −7.12 | 0.16 | 2.09 | 2.04 | −0.05 |
|
| ||||||
| AD | 0.01 | −0.22 | ||||
| RMSD | 0.18 | 0.23 | ||||
| AAD | 0.16 | 0.22 | ||||
HF level interaction energies were scaled by a factor of 1.16.
Table 3.
Gas phase dipole moment (Debye) of OBTZ calculated at the MP2/6-31G(d) and MM level of theory.
| μ | QM | MM |
|---|---|---|
| X | −5.9839 | −7.5211 |
| Y | −1.7956 | −2.3147 |
| Z | −0.2076 | 0.2226 |
| Total | 6.2509 | 7.8724 |
Table 4 represents the MM geometries along with the QM results. Except for the S-N bond, QM bond lengths are reproduced within 0.03 Å; moreover, the respective underestimations of 0.046 Å and 0.025 Å for the S-N and S=O bonds are desirable to reproduce the corresponding crystal bond lengths. MM optimized angles, dihedrals and improper dihedrals are all within 5° of the QM data. The scaled MP2 vibrational spectrum is fairly well reproduced as shown in Table S29. The agreement between the MM and QM PEDs is satisfactory considering that matching the individual modes is complicated for a large molecule like OBTZ because the mixing of the contributions from the internal degrees of freedom is different between the MM and QM.
Table 4.
MM and MP2/6-31G(d) level equilibrium geometry of OBTZ
| Coordinate | QM | MM | Difference |
|---|---|---|---|
| Bond length (Å) | |||
|
| |||
| S1-N2 | 1.683 | 1.636 | −0.046 |
| S1-O11 | 1.461 | 1.437 | −0.024 |
| S1-O12 | 1.461 | 1.437 | −0.025 |
| S1-C10 | 1.775 | 1.759 | −0.016 |
| N2-H2 | 1.023 | 1.016 | −0.008 |
| N2-C3 | 1.457 | 1.457 | 0.000 |
| C3-H31 | 1.098 | 1.116 | 0.018 |
| C3-H32 | 1.093 | 1.118 | 0.025 |
| C3-N4 | 1.457 | 1.474 | 0.016 |
| N4-H4 | 1.017 | 1.017 | 0.001 |
| N4-C5 | 1.400 | 1.420 | 0.020 |
| C5-C6 | 1.405 | 1.401 | −0.004 |
| C5-C10 | 1.410 | 1.416 | 0.006 |
| C6-H6 | 1.089 | 1.080 | −0.009 |
| C6-C7 | 1.390 | 1.402 | 0.012 |
| C7-H7 | 1.087 | 1.081 | −0.006 |
| C7-C8 | 1.399 | 1.400 | 0.001 |
| C8-H8 | 1.086 | 1.082 | −0.005 |
| C8-C9 | 1.391 | 1.400 | 0.009 |
| C9-H9 | 1.088 | 1.082 | −0.006 |
| C9-C10 | 1.398 | 1.408 | 0.010 |
|
| |||
| Dihedrals (°) | |||
|
| |||
| C10-S1-N2-C3 | 47.4 | 50.7 | 3.3 |
| S1-N2-C3-N4 | −70.1 | −73.4 | −3.4 |
| N2-C3-N4-C5 | 56.9 | 55.7 | −1.1 |
| C3-N4-C5-C10 | −24.3 | −22.8 | 1.4 |
| N4-C5-C10-S1 | 6.6 | 4.8 | −1.8 |
| C5-C10-S1-N2 | −17.3 | −17.0 | 0.3 |
| C10-C5-C6-C7 | 1.3 | 0.8 | −0.5 |
| C5-C6-C7-C8 | −1.5 | −0.2 | 1.3 |
| C6-C7-C8-C9 | 0.9 | −0.1 | −1.0 |
| C7-C8-C9-C10 | −0.1 | −0.3 | −0.2 |
| C8-C9-C10-C5 | −0.1 | 0.9 | 1.0 |
|
| |||
| Improper Dihedrals (°) | |||
|
| |||
| N2-S1-C3-H2 | 27.6 | 30.8 | 3.3 |
| N4-C3-C5-H4 | −2.8 | −23.6 | 0.8 |
|
| |||
| Angles (°) | |||
|
| |||
| N2-S1-O11 | 107.0 | 111.3 | 4.3 |
| N2-S1-O12 | 107.0 | 109.9 | 2.9 |
| N2-S1-C10 | 101.4 | 100.7 | −0.7 |
| O11-S1-O12 | 121.8 | 123.7 | 1.9 |
| O11-S1-C10 | 108.5 | 103.7 | −4.8 |
| O12-S1-C10 | 109.2 | 104.5 | −4.7 |
| S1-N2-H2 | 109.2 | 107.6 | −1.7 |
| S1-N2-C3 | 111.5 | 113.3 | 1.8 |
| H2-N2-C3 | 112.3 | 108.1 | −4.2 |
| N2-C3-H31 | 106.6 | 111.6 | 5.0 |
| N2-C3-H32 | 108.9 | 109.3 | 0.4 |
| N2-C3-N4 | 110.3 | 108.0 | −2.3 |
| H31-C3-H32 | 108.8 | 106.9 | −1.9 |
| H31-C3-N4 | 113.5 | 111.3 | −2.2 |
| H32-C3-N4 | 108.6 | 109.7 | 1.1 |
| C3-N4-H4 | 113.9 | 111.9 | 2.0 |
| C3-N4-C5 | 117.7 | 116.0 | −1.7 |
| H4-N4-C5 | 113.3 | 115.1 | 1.8 |
| N4-C5-C6 | 120.1 | 117.6 | −2.5 |
| N4-C5-C10 | 122.0 | 122.8 | 0.8 |
| C6-C5-C10 | 117.7 | 119.6 | 1.9 |
| C5-C6-H6 | 119.0 | 120.2 | 1.2 |
| C5-C6-C7 | 121.0 | 120.4 | −0.5 |
| H6-C6-C7 | 120.1 | 119.4 | −0.7 |
| C6-C7-H7 | 119.2 | 120.1 | 0.9 |
| C6-C7-C8 | 120.6 | 120.0 | −0.6 |
| H7-C7-C8 | 120.1 | 119.9 | −0.2 |
| C7-C8-H8 | 120.5 | 120.1 | −0.4 |
| C7-C8-C9 | 119.3 | 120.1 | 0.8 |
| H8-C8-C9 | 120.2 | 119.8 | −0.3 |
| C8-C9-H9 | 120.8 | 120.0 | −0.8 |
| C8-C9-C10 | 120.1 | 120.3 | 0.2 |
| H9-C9-C10 | 119.1 | 119.7 | 0.6 |
| S1-C10-C5 | 120.8 | 120.4 | −0.4 |
| S1-C10-C9 | 118.0 | 120.0 | 2.0 |
| C5-C10-C9 | 121.2 | 119.5 | −1.7 |
3 Sulfones
The two sulfone model compounds shown in Figure 1(d), dimethyl sulfone (DMSN) and ethyl methyl sulfone (EMSN), were used to optimize sulfone-related parameters. DMSN was used to optimize bond and angle parameters for the sulfone group and EMSN was selected to cover C-S-C-C dihedral parameters. DMSN was first optimized and atomic partial charges were then transferred to EMSN with the additional methyl group being assigned standard CHARMM charges. This set of charges yields good performance on water interactions (RMS deviation of 0.23 kcal/mol) and dipole moments (33% overestimation of QM value) for both DMSN and EMSN, as shown in Table 5. Figure 5(a) shows the MM PES scan result for C-S-C-C dihedral along with the QM result; the energetic profile is well reproduced. MM equilibrium geometries are in good agreement with MP2 data as indicated by the small RMS deviations for bonds (0.02 Å), angles (0.7°) and dihedrals (0.6°). Similar to sulfonamide model compounds, the S=O bond lengths in DMSN and EMSN are underestimated by 0.034 Å on average in order to reproduce the corresponding crystal data. Force constants in the parameters are well optimized as indicated by the small average deviation of 3% for vibrational frequencies compared to QM data. Detailed results for the sulfone model compounds can be found in Table S30–S37 in the SI.
Table 5.
Statistical analysis of the difference between the final MM and QM geometries, vibrational frequencies, interactions with waters and dipole moments for sulfone model compounds.
| Data points | AD | RMSD | AAD | |
|---|---|---|---|---|
| Bond lengths (Å) | 23 | 0.005 | 0.020 | 0.018 |
| Valence Angles (°) | 42 | −0.04 | 0.70 | 0.47 |
| Dihedrals (°) | 5 | −0.3 | 0.6 | 0.5 |
| Vibrational frequencies | 49 | 3.0% | 8.8% | 5.4% |
| Water interaction energies (kcal/mol) | 4 | −0.17 | 0.23 | 0.18 |
| Water interaction distances (Å) | 4 | −0.24 | 0.24 | 0.24 |
| ||μ|| | 2 | 33.0% | 33.0% | 33.0% |
| μ direction (°) | 2 | 2.0 | 2.9 | 2.0 |
Figure 5.

Dihedral PES for the model compounds of sulfone (a), neutral (b) and negatively charged (c) sulfonate and sulfamate (d). Solid line represents QM data and dashed line for MM data. Surfaces are in 5° increments.
4 Sulfonates
Two neutral model compounds, methyl methane sulfonate (MMST) and phenyl methanesulfonate (PMST) were used to optimize neutral sulfonate group related parameters. An anionic sulfonate group is also seen in medical use, such as taurine derivatives used as anti-convulsant, anti-alcoholic and anti-cancer agents,68 three negatively charged aliphatic sulfonate model compounds, methanesulfonate (MSNA), ethanesulfonate (ESNA) and propanesulfonate (PSNA) were optimized to cover the sulfonate anion related parameters. Their structures are shown in Figure 1(e). It should be noted that an aromatic sulfonate anion model compound, benzenesulfonate, had already been optimized and is present in CGenFF.69
Neutral model compounds
Model compounds MMST and PMST were used to cover aliphatic and aromatic sulfonate parameters, respectively. MMST was first optimized and atomic partial charges for the sulfonate group were directly transferred to PMST with standard aromatic C-H charges assigned to the additional phenyl group. Without further optimization, the transferred charges yielded good agreement between MM and QM water interaction energies for PMST as shown in Table S41. Figure 5(b) shows the MM PESs given by the final set of parameters along with the QM PESs. Similar to the findings for the studied sulfonamides, a lower QM energy barrier in the C-S-O-C PES is seen for the phenyl group containing model compound PMST compared to MMST. It should be noted that the PES of MMST is consistent with the PESs calculated for the same molecule in Ref. 21 at DFT and MP2 level of theory using different basis sets. Overall, the optimized parameters reproduced the QM PES quite well; their performance with respect to other properties can be found in Tables S38–S45 in the SI.
Table 6 shows the statistics of the force field’s performance on neutral sulfonate model compounds. QM geometries are well reproduced with an RMS deviation of 0.02 Å, 1.38° and 0.6° for bonds, angles and dihedrals, respectively. Similar to sulfonamides, the S-O bond length is underestimated by 0.037 Å and 0.056 Å for MMST and PMST in order to reproduce the crystal data. Vibrational frequencies are reproduced within 6.2% of QM values on average. Water interaction energies are also well reproduced with an RMS deviation of 0.19 kcal/mol, and interaction distances are underestimated by approximately 0.2 Å as desired. The dipole moments are overestimated by 34% on average and their directions are in good agreement with MP2 level data.
Table 6.
Statistical analysis of the difference between the final MM and QM geometries, vibrational frequencies, interactions with waters and dipole moments for sulfonate neutral model compounds.
| Data points | AD | RMSD | AAD | |
|---|---|---|---|---|
| Bond lengths (Å) | 30 | −0.001 | 0.020 | 0.016 |
| Valence Angles (°) | 41 | −0.03 | 1.38 | 0.98 |
| Dihedrals (°) | 12 | 0.0 | 0.6 | 0.4 |
| Vibrational frequencies | 67 | 6.2% | 16.7% | 7.6% |
| Water interaction energies (kcal/mol) | 8 | 0.00 | 0.19 | 0.16 |
| Water interaction distances (Å) | 8 | −0.26 | 0.26 | 0.26 |
| ||μ|| | 2 | 34.4% | 35.5% | 34.4% |
| μ direction (°) | 2 | 4.3 | 4.8 | 4.3 |
Negatively charged model compounds
For the sulfonate anions, a different sulfur atom type was adopted. This atom type was previously developed specifically for negatively charged sulfur containing compounds and was used in sulfates as well as benzenesulfonate.69 Since the latter molecule was previously used to optimize aromatic sulfonate parameters, the three model compounds with increasing alkyl chain lengths mentioned above were used to extend the force filed to cover aliphatic sulfonates. Partial atomic charges were optimized using MSNA and then directly transferred to ESNA and PSNA along with additional standard methyl or ethyl group charges. The transferability of the charges was verified by the good agreement between QM and MM water interaction energies with an RMS deviation of only 0.1 kcal/mol, as shown in Table 7. The interaction distances were also underestimated by 0.17 Å on average, as desired for the purpose of bulk phase simulations. As the dipole moment is translationally variant for charged molecules, the water interactions are used as the main target for charge optimization; nevertheless, it should be mentioned that after proper alignment of the MM and QM geometries, the QM dipole moments are well reproduced with an RMS angular deviation of 2.5° and an average deviation in magnitude of −2%.
Table 7.
Statistical analysis of the difference between the final MM and QM geometries, vibrational frequencies, interactions with waters and dipole moments for sulfonate anion model compounds.
| Data points | AD | RMSD | AAD | |
|---|---|---|---|---|
| Bond lengths (Å) | 30 | −0.003 | 0.026 | 0.022 |
| Valence Angles (°) | 54 | 0.01 | 0.58 | 0.44 |
| Dihedrals (°) | 6 | 0.0 | 0.3 | 0.2 |
| Vibrational frequencies | 66 | 4.0% | 9.3% | 6.2% |
| Water interaction energies (kcal/mol) | 5 | 0.05 | 0.10 | 0.07 |
| Water interaction distances (Å) | 5 | −0.17 | 0.17 | 0.17 |
| ||μ|| | 3 | −2.0% | 7.7% | 6.1% |
| μ direction (°) | 3 | 1.8 | 2.5 | 1.8 |
Figure 5(c) shows the MM and QM PESs for the O-S-C-C dihedral in ESNA and the O-S-C-C and S-C-C-C dihedrals in PSNA. Considering the symmetry of the groups involved in the dihedral scan, the O-S-C-C dihedrals in MSNA and PSNA were scanned from −60° to 60° and the S-C-C-C dihedral in PSNA was scanned from −180° to 0°. The quality of the corresponding dihedral parameters is evident from the excellent agreement between the QM and MM PESs. QM equilibrium geometries are well reproduced with an RMS deviation of 0.026 Å, 0.58° and 0.3° for bonds, angles and dihedrals, respectively. Vibrational frequencies are also well reproduced within 4% of the QM values on average. Detailed results can be found in Table S46–S57 in the SI.
5 Sulfamates
Two model compounds, methyl sulfamate (MSMT) and phenyl sulfamate (PSMT), were used to optimize sulfamate parameters (Figure 1(f)). Specifically, MSMT represents the aliphatic sulfamates while PSMT represents their aromatic counterparts. Atomic partial charges were first fully optimized in MSMT and then directly transferred to PSMT with the additional phenyl group being assigned standard CHARMM aromatic C-H charges. The charge on the aromatic carbon linked to the sulfamate group in PSMT was assigned the total charge of the methyl group in MSMT to keep a total charge of zero. The good quality of this set of charges is indicated by the small average deviation of 0.19 kcal/mol for the water interaction energies, as shown in Table 8. Again, the water interaction distances are generally underestimated by 0.2 Å. The gas phase dipole moments are overestimated by 27% on average compared to MP2 level data and the directions are well reproduced as indicated by the small RMS deviation of 1.2°.
Table 8.
Statistical analysis of the difference between the final MM and QM geometries, vibrational frequencies, interactions with waters and dipole moments for sulfamate model compounds.
| Data points | AD | RMSD | AAD | |
|---|---|---|---|---|
| Bond lengths (Å) | 28 | −0.006 | 0.019 | 0.014 |
| Valence Angles (°) | 44 | −0.14 | 1.39 | 1.00 |
| Dihedrals (°) | 12 | 0.6 | 1.1 | 0.8 |
| Vibrational frequencies | 63 | 5.6% | 12.4% | 7.1% |
| Water interaction energies (kcal/mol) | 12 | 0.19 | 0.51 | 0.33 |
| Water interaction distances (Å) | 12 | −0.20 | 0.24 | 0.22 |
| ||μ|| | 2 | 26.5% | 27.3% | 26.5% |
| μ direction (°) | 2 | 0.9 | 1.2 | 0.9 |
Dihedral parameters were optimized using QM PES scans on the N-S-O-C dihedrals in MSMT and PSMT. The S-O-C-C dihedral parameter was not adjusted for PSMT as it had already been fully optimized in PMST. The final MM PES results along with the corresponding QM PESs are represented in Figure 5(d). A higher barrier is seen for the QM PES around N-S-O-C in MSMT compared to PSMT, in line with the trend observed above. Good agreement is achieved between MM and QM results for all PES scans. QM equilibrium geometries are well reproduced as indicated by the small deviations in the bond lengths, angles and dihedrals listed in Table 8. Vibrational frequencies are reproduced within 5.6% of the corresponding QM frequencies on average. Detailed MM results can be found in Table S58–S65 in the SI.
6. Validation
MD simulations in both crystalline and liquid phases were undertaken to validate the developed parameters for sulfonyl group containing compounds. Crystal simulations were used mainly to test the ability of the force field to reproduce intramolecular geometries in bulk phase, thereby testing the bonded parameters. Nevertheless, the nonbonded parameters were also validated based on analyses of crystal cell volumes and unit cell parameters. Liquid phase simulations were used to validate nonbonded parameters based on the ability of the force field to reproduce experimental pure solvent densities. As CHARMM is a biomolecular force field mainly used in bulk phase simulations, such validations are important, reflecting the overall quality of the developed force field for condensed phase simulations.
Crystalline phase validation
A total of 11 compounds as shown in Figure S2, taken from the CSD, were simulated as infinite crystals using MD at constant temperature and pressure (NPT). These compounds were selected to the best possible extent to cover all model compounds that were used to develop sulfonyl group related parameters. Some CSD compounds are exactly the same as the model compounds, while others have the model compound moieties as their components. For example, CSD entry MIYFEF is a crystal of the model compound MMSM, while CSD entry GESSOM contains a molecule similar to the model compound MBSM but with an additional methyl group attached to the phenyl group in the para position. Sometimes, several CSD compounds were found to be derivatives of a given model compound. In such cases, only the CSD compounds with substituents that were readily available in CGenFF were selected, such that no new parametrization was required for their simulation. If more than one compound satisfied this requirement, then the one with the simplest substituent was used. Detailed information about the CSD compounds used in the validation is presented in Table 9. The crystal unit cell of CSD entry BAKLAA contains sodium ions, and these ions were represented by the ion parameters in the CHARMM22 protein force field during the simulation.70 For cyclic sulfonamide model compound OBTZ, only crystals that contain the drug compound HCTZ (CSD entry HCSBTZ04) were found. Compound HCTZ can be treated as a combination of model compounds BSAM and OBTZ. However, it also contains a chlorine atom on the heterocycle, which introduces a new S-C-C-CL dihedral parameter. Considering the aromatic nature of the central C-C bond, the standard parameter for inner ring dihedral around an aromatic bond was used. The atomic partial charges were transferred from BSAM and OBTZ, and the charge on chlorine and its adjacent C-H group was transferred from chlorobenzene, which is already present in CGenFF. After initially assigning these charges, the charges on the aromatic carbons were slightly adjusted to yield a total charge of zero.
Table 9.
Crystals used for force field validation.
| CSD code | Common name | Component model compound | Unit cell type | Number of molecules in unit cell | R factor (%) | Temperature (K) |
|---|---|---|---|---|---|---|
| MSULPH01 | Methanesulfonamide | MSAM | orthorhombic | 4 | 5.62 | 223 |
| MIYFEF | N-Methylmethane sulfonamide | MMSM | monoclinic | 4 | 3.50 | 150 |
| KUSVEZ02 | p-Toluene sulfonamide | BSAM | monoclinic | 4 | 3.55 | 133 |
| GESSOM | N-Methyl-p-toluene sulfonamide | MBSM | monoclinic | 8 | 4.30 | 293 |
| MSULFN | N-Phenyl methane sulfonamide | PMSM | monoclinic | 4 | 5.20 | 293 |
| TEWCAA | N-Phenyl benzene sulfonamide | PBSM | tetragonal | 8 | 3.94 | 150 |
| YIQBIK | 4-Chlorophenyl methane sulfonate | PMST | monoclinic | 4 | 2.76 | 130 |
| JEFNIS | Phenyl sulfamate | PSMT | orthorhombic | 4 | 3.12 | 130 |
| BAKLAA | Sodium methane sulfonate | MSNA | orthorhombic | 20 | 2.70 | 293 |
| DMSULO04 | Dimethyl sulfone | DMSN | orthorhombic | 4 | 2.70 | 100 |
| HCSBTZ04 | Hydrochlorothiazide | OBTZ BSAM |
monoclinic | 4 | 2.98 | 123 |
Table 10 shows the computed unit cell length parameters A, B and C as well as the volumes averaged over the 5 ns trajectories. For monoclinic unit cells, the unit cell angle parameter β is also listed. In general, the unit cell length parameters were well maintained, with the RMS deviations for A, B and C being 2.1%, 2.6% and 3.3%, respectively. In systems with a monoclinic unit cell, the unit cell angle β was allowed to vary during the simulation. For all of these 6 systems, β was well preserved during the simulation and the RMS deviation is only 0.5%. The volume of the crystal unit cell was well reproduced for all systems and an RMS deviation of 2.1% is obtained.
Table 10.
Crystalline unit cell geometries and volumes
| CSD code | A | B | C | β | volume | ||||||||||
|---|---|---|---|---|---|---|---|---|---|---|---|---|---|---|---|
| Expt | MD | %deva | Expt | MD | %dev | Expt | MD | %dev | Expt | MD | %devb | Expt | MD | %dev | |
| MSULPH01 | 10.01 | 10.09 | 0.74 | 7.44 | 7.02 | −5.57 | 5.36 | 5.46 | 1.80 | 90.0 | 90.0 | 399.2 | 386.5 | −3.2 | |
| MIYFEF | 6.67 | 6.74 | 1.07 | 8.97 | 8.96 | −0.18 | 8.50 | 8.67 | 2.01 | 104.4 | 105.0 | 0.6 | 492.6 | 503.9 | 2.3 |
| KUSVEZ02 | 6.62 | 6.30 | −4.81 | 16.26 | 16.41 | 0.92 | 7.59 | 7.80 | 2.78 | 91.7 | 92.4 | 0.7 | 817.3 | 806.1 | −1.4 |
| GESSOM | 14.35 | 14.52 | 1.15 | 7.02 | 7.03 | 0.11 | 19.51 | 19.69 | 0.92 | 111.1 | 111.4 | 0.3 | 1833.1 | 1868.6 | 1.9 |
| MSULFN | 9.20 | 9.18 | −0.26 | 8.22 | 8.49 | 3.29 | 11.03 | 10.88 | −1.34 | 103.7 | 104.2 | 0.5 | 810.0 | 820.0 | 1.2 |
| TEWCAA | 8.78 | 8.58 | −2.24 | 8.78 | 8.58 | −2.24 | 30.05 | 31.55 | 4.99 | 90.0 | 90.0 | 2315.6 | 2323.4 | 0.3 | |
| YIQBIK | 10.79 | 10.69 | −0.90 | 7.85 | 7.71 | −1.78 | 11.30 | 11.70 | 3.56 | 117.8 | 117.9 | 0.1 | 846.6 | 852.1 | 0.7 |
| JEFNIS | 8.04 | 8.16 | 1.49 | 5.38 | 5.20 | −3.37 | 16.51 | 17.15 | 3.88 | 90.0 | 90.0 | 714.2 | 727.5 | 1.9 | |
| BAKLAA | 17.07 | 17.47 | 2.33 | 22.02 | 21.98 | −0.21 | 5.61 | 5.25 | −6.37 | 90.0 | 90.0 | 2107.4 | 2014.6 | −4.4 | |
| DMSULO04 | 7.19 | 7.13 | −0.82 | 7.97 | 8.18 | 2.72 | 7.22 | 7.05 | −2.32 | 90.0 | 90.0 | 413.0 | 410.9 | −0.5 | |
| HCSBTZ04 | 9.47 | 9.18 | −3.06 | 8.24 | 8.38 | 1.72 | 15.06 | 15.34 | 1.84 | 113.1 | 113.9 | 0.7 | 1081.7 | 1079.4 | −0.2 |
|
| |||||||||||||||
| AD | −0.48 | −0.42 | 1.07 | 0.5 | −0.1 | ||||||||||
| RMSD | 2.12 | 2.57 | 3.30 | 0.5 | 2.1 | ||||||||||
| AAD | 1.71 | 2.01 | 2.89 | 0.5 | 1.6 | ||||||||||
MD deviations from experimental values are given in percentage calculated by (MD-Expt)/Expt × 100%.
As in monoclinic unit cell, all angles are constrained to 90°, these data are not included in the calculation of average deviations (AD), root mean square deviations (RMSD) and absolute average deviations (AAD).
MD results for the crystal intramolecular geometries are shown in Table 11. For each bond, angle and dihedral of interest, the MD result was averaged over the 5 ns simulation. For each crystal, there were several such averages for each geometric parameter since several independent molecules were present in one unit cell. Additionally, for each geometric parameter, averages were collected over all simulated systems in which it occurred. In other words, the statistical analyses listed in Table 11 reflect the final averaged deviations over all independent molecules and all simulated systems. Overall, the force field reproduces the crystal geometries to a satisfactory level of accuracy. The RMS deviations are typically less than 0.04 Å, 6° and 8° for bonds, angles and dihedrals, respectively. Among all bonds, the S-NH2 bond shows the largest average deviation as 0.038 Å, however, considering the deviation with QM data can be as large as −0.062 Å, such a difference is considered acceptable. Similarly, for the S-NH bond with an average deviation of 0.013 Å, the corresponding average deviation from QM is −0.047 Å. In summary, the few significant deviations in the crystal geometries reflect compromises made in the optimization of the bond parameters.
Table 11.
Statistical analysis of the difference between the final MM and experimental crystalline intramolecular geometries.
| Coordinate | Data points | AD | RMSD | AAD |
|---|---|---|---|---|
| Bond length (Å) | ||||
|
| ||||
| S=O | 104 | 0.000 | 0.008 | 0.006 |
| S-NH2 | 16 | 0.038 | 0.041 | 0.038 |
| S-NH | 28 | 0.013 | 0.017 | 0.014 |
| S-Car | 28 | 0.018 | 0.020 | 0.018 |
| S-CH3 | 24 | 0.027 | 0.027 | 0.027 |
| S-O | 8 | 0.014 | 0.014 | 0.014 |
| S-1-O | 60 | −0.011 | 0.012 | 0.011 |
| S-1-CH3 | 20 | 0.035 | 0.035 | 0.035 |
|
| ||||
| Dihedrals (°) | ||||
|
| ||||
| CH3-S-NH-CH3 | 4 | 0.0 | 5.6 | 5.6 |
| CH3-S-NH-Car | 4 | 0.0 | 5.6 | 5.6 |
| Car-S-NH-Car | 8 | 1.3 | 1.3 | 1.3 |
| Car-S-NH-CH3 | 8 | −1.5 | 5.7 | 5.3 |
| NH2-S-Car-Car | 8 | 0.0 | 2.7 | 2.2 |
| NH-S-Car-Car | 20 | 0.8 | 4.3 | 3.2 |
| S-NH-Car-Car | 12 | 2.6 | 3.4 | 3.3 |
| Car-S-NH-CH2 | 4 | 0.0 | 4.6 | 4.6 |
| CH3-S-O-Car | 4 | 0.0 | 0.9 | 0.9 |
| NH2-S-O-Car | 4 | 0.0 | 6.7 | 6.7 |
| S-O-Car-Car | 8 | 0.0 | 7.5 | 7.1 |
| S-NH-CH2-NH | 4 | 0.0 | 4.0 | 4.0 |
|
| ||||
| Angles (°) | ||||
|
| ||||
| O=S=O | 52 | 1.8 | 2.3 | 2.0 |
| O=S-NH2 | 32 | 0.9 | 1.6 | 1.4 |
| O=S-NH | 56 | 2.6 | 2.8 | 2.6 |
| O=S-Car | 56 | −2.2 | 3.2 | 2.6 |
| O=S-CH3 | 48 | −0.5 | 1.1 | 1.0 |
| Car-S-NH2 | 8 | −3.7 | 3.9 | 3.7 |
| Car-S-NH | 20 | −4.4 | 4.6 | 4.4 |
| CH3-S-NH | 8 | −4.5 | 4.5 | 4.5 |
| CH3-S-CH3 | 4 | −1.3 | 1.3 | 1.3 |
| S-Car-Car | 56 | 1.0 | 1.3 | 1.2 |
| S-NH-Car | 12 | 0.2 | 1.0 | 0.8 |
| S-NH-CH3 | 12 | −0.2 | 0.3 | 0.2 |
| S-NH-CH2 | 4 | 1.1 | 1.1 | 1.1 |
| O-S=O | 16 | 3.0 | 3.5 | 3.0 |
| S-O-Car | 8 | 0.2 | 0.3 | 0.2 |
| O-S-CH3 | 4 | −5.5 | 5.5 | 5.5 |
| O-S-NH2 | 4 | −5.6 | 5.6 | 5.6 |
| O-S-1-O | 60 | 1.1 | 1.5 | 1.3 |
| O-S-1-CH3 | 60 | −1.4 | 1.9 | 1.6 |
Each data point was collected with the corresponding geometry parameter averaged over the MD production time. S-1 refers to the sulfur atom in sulfonate anion. NH2 and NH are for nitrogens in amine group with one and two hydrogens. CH3 and CH2 are for methyl and methylene group carbons. Car refers to the aromatic carbon atoms as in phenyl group.
Pure solvent densities
Due to the high melting points of sulfonyl containing compounds, pure solvent density data were only available for model compound MMST and DMSN. However, such data still provide the opportunity to validate the LJ parameters adopted for the sulfonyl sulfur atom type by analogy as described above. Table 12 represents the calculated densities using eq. (1) over a 5ns MD simulation for model compounds MMST and DMSN at the respective experimental temperatures. The calculated densities are in good agreements with the experimental values, with all deviations falling within 2%; the RMS deviation is 1.3%. This suggests that the transferred LJ parameters work well for the sulfonyl group containing compounds. The deviations in reproducing solvent densities are generally less than the deviations in crystal unit cell volumes. This may be attributed to the highly directional hydrogen bonding networks in crystals, which are harder to reproduce than the orientationally-variant interaction networks in liquid phases, as noted in prior work.71
Table 12.
Comparison of the calculated and experimental pure solvent densities.
| Compound | Temperature (K) | Expt (g/cm3) | MDa (g/cm3) | Devb (%) |
|---|---|---|---|---|
| MMST | 293 | 1.294 | 1.317 | 1.77 |
| DMSN | 383 | 1.170 | 1.165 | −0.42 |
|
| ||||
| AD | 0.68 | |||
| RMSD | 1.29 | |||
| AAD | 1.10 | |||
Densities are calculated using eq. (2) with MD averaged volumes.
Deviations are given by (MD-expt)/expt×100%.
7. Application of the developed force field on a sulfonamide-terminated peptide
As a final validation, the force field was applied to study the conformational properties of a sulfonated peptide in solution. Non-peptidic segments that can be employed as β-strand mimetics have received much attention72–74 due to their potential to disrupt protein-protein interactions where extended peptide conformations serve as recognition motifs.75 In contrast to the trans configuration mainly adopted by the peptide bond, the relatively low rotational barrier around S-N bonds (Figure 2) may enable adjacent S=O and N-H moieties in sulfonamides to adopt more to hydrogen bonding opportunities with their environment. Towards understanding this possibility, Langenhan et al. have characterized the hydrogen bonding pattern of the sulfonamide unit in Ace-L-Val-D-Pro-Sulfonamide (Figure 6).13 NOE analysis confirmed that a hairpin-like conformation was significantly populated in deuterated chloroform. These experimental results provide an opportunity to test if the newly developed force field can give reasonable descriptions of conformational sampling of a peptide that includes a sulfonamide moiety.
Figure 6.
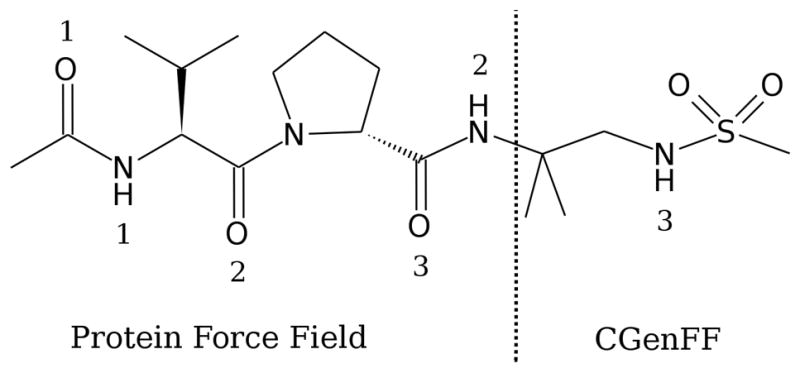
Sulfonamide containing peptide described by the CHARMM22/CMAP force field and CGenFF. Numbering of amide and carboxyl groups used in the text is shown. Vertical dashed line shows the interface.
The present CGenFF parameters were combined with the C22/CMAP protein parameters. Missing parameters associated with the peptide to sulfonamide link (Figure 6) were transferred from model compound EESM by analogy. The intrinsic compatibility of CGenFF with the remainder of the CHARMM additive force field greatly facilitates this process. For example, the quaternary carbon atom at the interface has an atom type of CG301 in CGenFF, while the amide nitrogen atom on the protein side has an atom type of NH1. This results in an undefined bond parameter as CG301-NH1. Considering the chemical environment, the amide nitrogen atom at the interface has a corresponding atom type NG2S1 in CGenFF. And as quaternary and tertiary carbons usually have similar parameters, the available bond parameter of CG311-NG2S1 can be used for the C-N bond at the interface. The remaining parameters were chosen in a similar fashion, with the final parameters defining the linkage included in Table S66 of the SI.
To enhance conformational sampling, temperature replica exchange (REX) MD was employed. A total of 8 replicas were simulated under different temperatures and the coordinates of adjacent replicas were either retained or exchanged based on the Metropolis criteria at intervals of 2 ps during the simulation.62 A temperature range of 298-340K with exponential spacing of the 8 replicas was used, yielding an exchange success rate of approximately 22%. The trajectory of the first replica at the experimental temperature was used for conformational analyses.
In the experimental work by Langenhan et al.13 NMR chemical shift data were recorded for the three amide protons in the compound. In addition, chemical shifts were also measured for two reference compounds that represent the two separate parts of the peptide obtained when breaking the proline Cα-C bond. This experiment was designed to clarify the impact of the peptide environment on hydrogen bonding. It was found that in the full peptide, the chemical shifts of the hydrogens in the sulfonamide, the valine amide and the proline C-terminal amide were, respectively, shifted 0.7, 0.3 and 0.17 ppm downfield with respect to the corresponding reference compounds. This indicated that these moieties were involved in hydrogen bonds in the full peptide that were not present in the reference compounds. There are six possible hydrogen bonds in the peptide system. These are the interactions between the valine N-H and the sulfonamide S=O (N-H1…O=S) or proline C=O (N-H1…O3=C), between the proline C-terminal N-H and the N-terminal C=O (N-H2…O1=C) or valine C=O (N-H2…O2=C), and between the sulfonamide N-H and the valine C=O (N-H3…O2=C) or N-terminal C=O (N-H3…O1=C). Figure 7 presents the sampling of the corresponding distances during the last 8 ns of the REX simulation. As is evident, extensive intramolecular hydrogen bonding is occurring, with several of those hydrogen bonds breaking and reforming multiple times during the REX simulation. Notably, the N-H2…O1=C is anticorrelated with the N-H1…O=S and N-H3…O2=C distances as the proline C terminus cannot form a close contact with the valine N terminus when the sulfonamide was in close contact with valine backbone. Hydrogen bonding analysis was performed based on a distance criterion76 of 2.4 Å with the results listed in Table 13. Notably, the calculated hydrogen bond occupancies are in the same order as the experimental chemical shift differences (i.e. the hydrogen bonds involving the sulfonamide N-H are populated the most while the proline C-terminal N-H hydrogen bonds are populated the least). The interaction between the sulfonamide N-H3 and valine C=O2 has the longest average life time which is consistent with the relatively small fluctuation seen in Figure 7, suggesting this hydrogen bond is very favorable. The average lifetime of 1.9 ps for the N-H1…O=S hydrogen bond suggests this interaction is relatively weak and can be broken easily in the simulation. This is consistent with the fact that the sulfonyl oxygen is a weak hydrogen bond acceptor compared to the carbonyl oxygen atom in the peptide unit, as mentioned in the experimental study. Though it has the lowest occupancy, the hydrogen bonding involving the proline C-terminus N-H2 still achieved an average lifetime of 1.9 ps.
Figure 7.

Samplings of the distances between hydrogen bonding donor oxygen atoms and acceptor hydrogen atoms during the simulation. Probability distributions are also shown on the right side of each plot. For the N-H1…O=S interaction pair, as there are two oxygen atoms in sulfonyl group, the shorter distance at each time step was used.
Table 13.
Hydrogen bonding analysis for specific atom pairs in the peptide system
| Hydrogen bonding pairs | Occupancy | Average life time (ps) |
|---|---|---|
| N-H1…O=S | 0.162 | 1.9 |
| N-H1…O3=C | 0.000 | 0.0 |
| All valine N-H1 involved pairs | 0.162 | 1.9 |
|
| ||
| N-H2…O2=C | 0.019 | 2.4 |
| N-H2…O1=C | 0.089 | 1.3 |
| All Pro C-terminus N-H2 involved pairs | 0.108 | 1.9 |
|
| ||
| N-H3…O2=C | 0.556 | 7.7 |
| N-H3…O1=C | 0.038 | 5.7 |
| All sulfonamide N-H3 involved pairs | 0.594 | 6.7 |
Besides measuring the chemical shifts, Langenhan et al. also measured NOEs.13 Strong correlations were found between a proline δ proton and both the valine α and γ protons. In addition, an interstrand NOE between the sulfonamide proton and valine amide proton was observed. Distances between these proton pairs calculated from the simulation are shown in Figure 8. The average distances were 2.25, 2.90 and 4.75 Å for Hδ… Hα, Hδ… Hγ and H1… H3, respectively, which is in good agreement with the experimental signals and intensities discussed above.
Figure 8.

Sampling of the distances between protons defining the experimental NOEs during the simulation along with the corresponding probability distributions along the right edge of the plots. As there are two proline δ protons and six valine γ protons, at each time step there are two Hδ… Hα and twelve Hδ…Hγ pairs. Only the shortest distance value was used for each time step.
In the published study, based on the observed NOEs it was concluded that a hairpin-like conformation was highly populated. Figure 9 presents the sampling of the pseudo angle defined by the valine N, the proline C and the sulfonamide S in the simulation. This pseudo angle samples two distinct regions: one around 55°, which is the most populated, and one around 90°. Snapshots associated with these peaks were obtained and are shown in Figure 9. Both conformations involve folded structures. The conformation associated with the 90° peak shows the sulfonamide H hydrogen bonding with the proline carboxyl group. In the 55° conformation, a fully folded β-structure is observed that involves hydrogen bonds formed between the sulfonamide group and the NH and CO moieties of the valine residue. This stabilizes the β-hairpin-like conformation, confirming the interpretation of the experimental data in the original study. Thus, the presented sulfonamide parameters in conjunction with the C22/CMAP force field can reproduce the published NMR data in the absence of any restraints, demonstrating the fitness of the force field for studying drug-like molecules.
Figure 9.
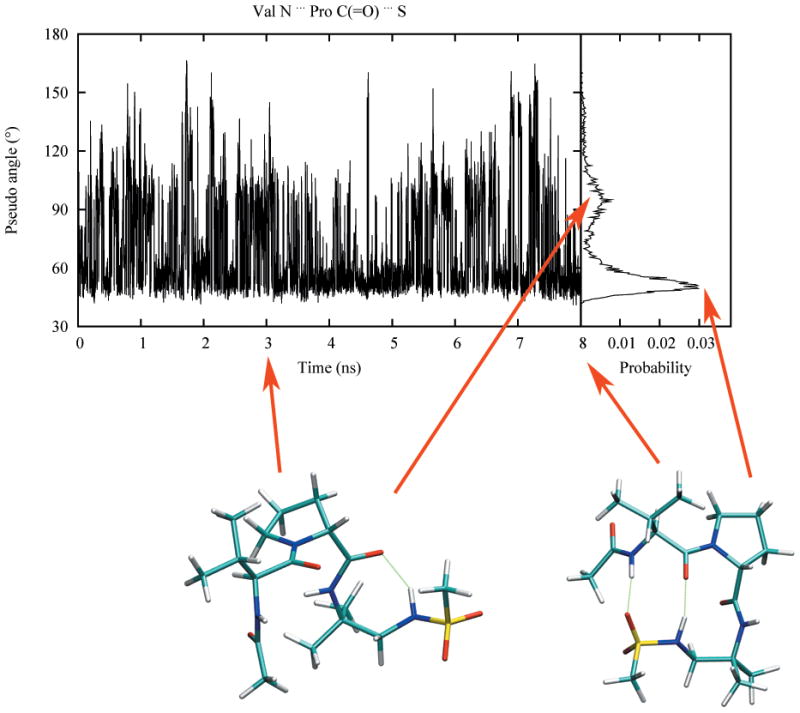
Sampling of the pseudo angle defined by the valine nitrogen atom, proline carbonyl carbon atom and sulfonamide sulfur atom during the simulation. Conformations taken from 3 and 8 ns are presented with hydrogen bonding interactions shown in dotted line. The corresponding angle values are indicated by arrows pointed to the probability map.
Conclusion
The present set of optimized parameters is an important extension of CGenFF, as it enables the modeling and simulation of commonly used sulfonyl group containing motifs. Representative model compounds from different sulfonyl group based chemical moieties such as sulfonamide, sulfone, sulfonate and sulfamate were considered to cover a wide range of functional groups. The optimization procedure adopted here is consistent with the remainder of the CHARMM additive force field and the optimization of all model compounds was done in a hierarchical fashion. Thus, the newly developed parameters are fully compatible with the existing CGenFF parameters and can be easily transferred to other sulfonyl group containing compounds.
Condensed phase simulations were employed to validate the ability of the force field to reproduce experimental geometric properties in both crystalline and liquid environment, with satisfactory agreement obtained in both cases. Finally, to test the performance of the force field in the context of a representative application, the conformational preference of a sulfonamide-containing peptide was studied and the results were compared to experimental data. Together with the CHARMM protein force field, the CGenFF parameters for sulfonamides were able to reproduce the experimentally predicted conformations and hydrogen bonding patterns during and enhanced-sampling MD simulation, and statistical analysis of the resulting MD trajectory showed an excellent agreement with the experimental NMR chemical shifts and NOE correlations. This application not only demonstrates the ability of the CHARMM force fields to correctly describe the behavior of biomolecules in biological environment, but also serves as a showcase of how the CHARMM force field can be used to interpret experiment results.
The newly developed parameters are available as part of the CGenFF topology and parameter files on the website of the MacKerell laboratory (http://mackerell.umaryland.edu/).
Supplementary Material
Acknowledgments
This work is supported by the Samuel Waxman Cancer Foundation, NIH grants GM051501, GM070855 and CA107331, and NSF grant CHE-0823198.
Footnotes
For the canonical MP2 method, the required computational time scales with the total number of basis functions to the power ~3.5, depending on the details of the algorithm being used.
Supporting Information Available: Tables for QM and MM level equilibrium geometries, vibrational spectra, water interaction energies and distances and gas phase dipole moments for all model compounds; parameters introduced by analogy to enable sulfonamide based peptide simulations; MP2/cc-pVTZ//MP2/6-31G(d) level PESs for selected model compounds; chemical structures of the CSD compounds used in the crystalline phase validations.
References
- 1.Xu WM, Han FF, He M, Hu DY, He J, Yang S, Song BA. J Agric Food Chem. 2012;60:1036–1041. doi: 10.1021/jf203772d. [DOI] [PubMed] [Google Scholar]
- 2.Fox RW, Lockey RF. J Allergy Clin Immunol. 1988;81:260. [Google Scholar]
- 3.Yan J, Hickner MA. Macromolecules. 2010;43:2349–2356. [Google Scholar]
- 4.Testero SA, Lee M, Staran RT, Espahbodi M, Llarrull LI, Toth M, Mobashery S, Chang M. ACS Med Chem Lett. 2011;2:177–181. doi: 10.1021/ml100254e. [DOI] [PMC free article] [PubMed] [Google Scholar]
- 5.Zuse A, Schmidt P, Baasner S, Bohm KJ, Muller K, Gerlach M, Gunther EG, Unger E, Prinz H. J Med Chem. 2007;50:6059–6066. doi: 10.1021/jm0708984. [DOI] [PubMed] [Google Scholar]
- 6.Lundin C, North M, Erixon K, Walters K, Jenssen D, Goldman AS, Helleday T. Nucleic Acids Res. 2005;33:3799–3811. doi: 10.1093/nar/gki681. [DOI] [PMC free article] [PubMed] [Google Scholar]
- 7.Szafraniec LJ, Szafraniec LL, Aaron HS. J Org Chem. 1982;47:1936–1939. [Google Scholar]
- 8.Rai R, Baker GA, Behera K, Mohanty P, Kurur ND, Pandey S. Langmuir. 2010;26:17821–17826. doi: 10.1021/la103689m. [DOI] [PubMed] [Google Scholar]
- 9.Mary MM, Anthony W. Annu Rep Med Chem. Vol. 41. Academic Press; 2006. pp. 251–262. [Google Scholar]
- 10.Supuran CT, Innocenti A, Mastrolorenzo A, Scozzafava A. Mini Rev Med Chem. 2004;4:189–200. doi: 10.2174/1389557043487402. [DOI] [PubMed] [Google Scholar]
- 11.Erin EC. Prim Care Update Ob/Gyns. 1998;5:32–35. [Google Scholar]
- 12.Wilden JD. J Chem Res. 2010;34:541–548. [Google Scholar]
- 13.Langenhan JM, Fisk JD, Gellman SH. Org Lett. 2001;3:2559–2562. doi: 10.1021/ol016237x. [DOI] [PubMed] [Google Scholar]
- 14.Glemarec C, Reynolds RC, Crooks PA, Maddry JA, Akhtar MS, Montgomery JA, Secrist JA, III, Chattopadhyaya J. Tetrahedron. 1993;49:2287–2298. [Google Scholar]
- 15.Lopez M, Bornaghi LF, Driguez H, Poulsen SA. J Org Chem. 2011;76:2965–2975. doi: 10.1021/jo2001269. [DOI] [PubMed] [Google Scholar]
- 16.Kang SI, Na K, Bae YH. Macromol Symp. 2001;172:149–156. [Google Scholar]
- 17.Purohit A, Woo LW, Barrow D, Hejaz HA, Nicholson RI, Potter BV, Reed MJ. Mol Cell Endocrinol. 2001;171:129–135. doi: 10.1016/s0303-7207(00)00428-7. [DOI] [PubMed] [Google Scholar]
- 18.Winum JY, Scozzafava A, Montero JL, Supuran CT. Med Res Rev. 2005;25:186–228. doi: 10.1002/med.20021. [DOI] [PubMed] [Google Scholar]
- 19.Ciobanu LC, Maltais R, Poirier D. Org Lett. 2000;2:445–448. doi: 10.1021/ol990381p. [DOI] [PubMed] [Google Scholar]
- 20.Petrov VM, Girichev GV, Oberhammer H, Petrova VN, Giricheva NI, Bardina AV, Ivanov SN. J Phys Chem A. 2008;112:2969–2976. doi: 10.1021/jp710532z. [DOI] [PubMed] [Google Scholar]
- 21.Tuttolomondo ME, Navarro A, Pena T, Varetti EL, Parker SF, Ben Altabef A. J Phys Chem A. 2009;113:8401–8408. doi: 10.1021/jp902993p. [DOI] [PubMed] [Google Scholar]
- 22.Ogruc-Ildiz G, Akyuz S, Ozel AE. J Mol Struct. 2009;924–926:514–522. [Google Scholar]
- 23.Chiş V, Botond S, Laszlo S, Ristoiu D, Filip S, David L, Cozar O. Analele Univ Oradea, Fizica. 2003;13A:143–158. [Google Scholar]
- 24.Oznobikhina L, Chipanina N, Aksamentova T, Shainyan B. Russ J Gen Chem. 2009;79:1674–1682. [Google Scholar]
- 25.Gomes JRB, Gomes P. Tetrahedron. 2005;61:2705–2712. [Google Scholar]
- 26.Shainyan BA, Chipanina NN, Oznobikhina LP. J Phys Org Chem. 2012 In press. [Google Scholar]
- 27.Milan RJ. Mol Struct THEOCHEM. 2010;944:34–42. [Google Scholar]
- 28.Mackerell AD., Jr J Comput Chem. 2004;25:1584–1604. doi: 10.1002/jcc.20082. [DOI] [PubMed] [Google Scholar]
- 29.MacKerell AD, Bashford D, Bellott Dunbrack RL, Evanseck JD, Field MJ, Fischer S, Gao J, Guo H, Ha S, Joseph-McCarthy D, Kuchnir L, Kuczera K, Lau FTK, Mattos C, Michnick S, Ngo T, Nguyen DT, Prodhom B, Reiher WE, Roux B, Schlenkrich M, Smith JC, Stote R, Straub J, Watanabe M, Wiórkiewicz-Kuczera J, Yin D, Karplus M. J Phys Chem B. 1998;102:3586–3616. doi: 10.1021/jp973084f. [DOI] [PubMed] [Google Scholar]
- 30.Mackerell AD, Jr, Feig M, Brooks CL., III J Comput Chem. 2004;25:1400–1415. doi: 10.1002/jcc.20065. [DOI] [PubMed] [Google Scholar]
- 31.MacKerell AD, Banavali NK. J Comput Chem. 2000;21:105–120. [Google Scholar]
- 32.Foloppe N, MacKerell JAD. J Comput Chem. 2000;21:86–104. [Google Scholar]
- 33.Denning EJ, Priyakumar UD, Nilsson L, Mackerell AD., Jr J Comput Chem. 2011;32:1929–1943. doi: 10.1002/jcc.21777. [DOI] [PMC free article] [PubMed] [Google Scholar]
- 34.Hart K, Foloppe N, Baker CM, Denning EJ, Nilsson L, Mackerell AD., Jr J Chem Theory Comput. 2012;8:348–362. doi: 10.1021/ct200723y. [DOI] [PMC free article] [PubMed] [Google Scholar]
- 35.Feller SE, Gawrisch K, MacKerell AD., Jr J Am Chem Soc. 2002;124:318–326. doi: 10.1021/ja0118340. [DOI] [PubMed] [Google Scholar]
- 36.Klauda JB, Venable RM, Freites JA, O’Connor JW, Tobias DJ, Mondragon-Ramirez C, Vorobyov I, MacKerell AD, Jr, Pastor RW. J Phys Chem B. 2010;114:7830–7843. doi: 10.1021/jp101759q. [DOI] [PMC free article] [PubMed] [Google Scholar]
- 37.Guvench O, Hatcher E, Venable RM, Pastor RW, MacKerell AD. J Chem Theory Comput. 2009;5:2353–2370. doi: 10.1021/ct900242e. [DOI] [PMC free article] [PubMed] [Google Scholar]
- 38.Guvench O, Mallajosyula SS, Raman EP, Hatcher E, Vanommeslaeghe K, Foster TJ, Jamison FW, II, Mackerell AD., Jr J Chem Theory Comput. 2011;7:3162–3180. doi: 10.1021/ct200328p. [DOI] [PMC free article] [PubMed] [Google Scholar]
- 39.Zhu X, Lopes PEM, MacKerell AD. WIREs Comput Mol Sci. 2012;2:167–185. doi: 10.1002/wcms.74. [DOI] [PMC free article] [PubMed] [Google Scholar]
- 40.Vanommeslaeghe K, Hatcher E, Acharya C, Kundu S, Zhong S, Shim J, Darian E, Guvench O, Lopes P, Vorobyov I, Mackerell AD., Jr J Comput Chem. 2010;31:671–690. doi: 10.1002/jcc.21367. [DOI] [PMC free article] [PubMed] [Google Scholar]
- 41.Brooks BR, Brooks CL, III, Mackerell AD, Jr, Nilsson L, Petrella RJ, Roux B, Won Y, Archontis G, Bartels C, Boresch S, Caflisch A, Caves L, Cui Q, Dinner AR, Feig M, Fischer S, Gao J, Hodoscek M, Im W, Kuczera K, Lazaridis T, Ma J, Ovchinnikov V, Paci E, Pastor RW, Post CB, Pu JZ, Schaefer M, Tidor B, Venable RM, Woodcock HL, Wu X, Yang W, York DM, Karplus M. J Comput Chem. 2009;30:1545–1614. doi: 10.1002/jcc.21287. [DOI] [PMC free article] [PubMed] [Google Scholar]
- 42.Frisch MJ, Trucks GW, Schlegel HB, Scuseria GE, Robb MA, Cheeseman JR, Montgomery JA, Vreven T, Kudin KN, Burant JC, Millam JM, Iyengar SS, Tomasi J, Barone V, Mennucci B, Cossi M, Scalmani G, Rega N, Petersson GA, Nakatsuji H, Hada M, Ehara M, Toyota K, Fukuda R, Hasegawa J, Ishida M, Nakajima T, Honda Y, Kitao O, Nakai H, Klene M, Li X, Knox JE, Hratchian HP, Cross JB, Bakken V, Adamo C, Jaramillo J, Gomperts R, Stratmann RE, Yazyev O, Austin AJ, Cammi R, Pomelli C, Ochterski JW, Ayala PY, Morokuma K, Voth GA, Salvador P, Dannenberg JJ, Zakrzewski VG, Dapprich S, Daniels AD, Strain MC, Farkas O, Malick DK, Rabuck AD, Raghavachari K, Foresman JB, Ortiz JV, Cui Q, Baboul AG, Clifford S, Cioslowski J, Stefanov BB, Liu G, Liashenko A, Piskorz P, Komaromi I, Martin RL, Fox DJ, Keith T, Laham A, Peng CY, Nanayakkara A, Challacombe M, Gill PMW, Johnson B, Chen W, Wong MW, Gonzalez C, Pople JA. Gaussian 03, Revision C.02. Gaussian Inc; Wallingford, CT: 2003. [Google Scholar]
- 43.Møller C, Plesset MS. Phys Rev. 1934;46:618–622. [Google Scholar]
- 44.Hariharan PC, Pople JA. Theor Chim Acta. 1973;28:213–222. [Google Scholar]
- 45.Scott AP, Radom L. J Phys Chem. 1996;100:16502–16513. [Google Scholar]
- 46.MacKerell AD, Karplus M. J Phys Chem. 1991;95:10559–10560. [Google Scholar]
- 47.Pulay P, Fogarasi G, Pang F, Boggs JE. J Am Chem Soc. 1979;101:2550–2560. [Google Scholar]
- 48.Durell SR, Brooks BR, Ben-Naim A. J Phys Chem. 1994;98:2198–2202. [Google Scholar]
- 49.Jorgensen WL, Chandrasekhar J, Madura JD, Impey RW, Klein ML. J Chem Phys. 1983;79:926–935. [Google Scholar]
- 50.Allen MP, Tildesley DJ. Computer Simulation of Liquids. Oxford University Press; Oxford, U. K: 1987. [Google Scholar]
- 51.Darden T, York D, Pedersen L. J Chem Phys. 1993;98:10089–10092. [Google Scholar]
- 52.Steinbach PJ, Brooks BR. J Comput Chem. 1994;15:667–683. [Google Scholar]
- 53.Hockney RW. In: Methods in Computational Physics. Alder B, Fernbach S, Rotenberg M, editors. Academic Press; New York: 1970. pp. 136–211. [Google Scholar]
- 54.Ryckaert JP, Ciccotti G, Berendsen HJC. J Comput Phys. 1977;23:327–341. [Google Scholar]
- 55.Hoover WG. Phys Rev A. 1985;31:1695–1697. doi: 10.1103/physreva.31.1695. [DOI] [PubMed] [Google Scholar]
- 56.Nosé S. Mol Phys. 1984;52:255–268. [Google Scholar]
- 57.Feller SE, Zhang Y, Pastor RW, Brooks BR. J Chem Phys. 1995;103:4613–4621. [Google Scholar]
- 58.Allen FH. Acta Crystallogr B. 2002;58:380–388. doi: 10.1107/s0108768102003890. [DOI] [PubMed] [Google Scholar]
- 59.CRC Handbook of Chemistry and Physics. 84. CRC Press; Boca Raton, Florida: 2003. [Google Scholar]
- 60.Dietz W, Heinzinger K. Ber Bunsen-Ges Phys Chem. 1985;89:968–977. [Google Scholar]
- 61.Tironi IG, Van Gunsteren WF. Mol Phys. 1994;83:381–403. [Google Scholar]
- 62.Sugita Y, Okamoto Y. Chem Phys Lett. 1999;314:141–151. [Google Scholar]
- 63.Besler BH, Merz KM, Kollman PA. J Comput Chem. 1990;11:431–439. [Google Scholar]
- 64.Singh UC, Kollman PA. J Comput Chem. 1984;5:129–145. [Google Scholar]
- 65.André I, Tvaroska I, Carver JP. J Phys Chem A. 2000;104:4609–4617. [Google Scholar]
- 66.Petrová P, Koca J, Imberty A. J Am Chem Soc. 1999;121:5535–5547. [Google Scholar]
- 67.Strader ML, Feller SE. J Phys Chem A. 2002;106:1074–1080. [Google Scholar]
- 68.Gupta RC, Win T, Bittner S. Curr Med Chem. 2005;12:2021–2039. doi: 10.2174/0929867054546582. [DOI] [PubMed] [Google Scholar]
- 69.He X, Guvench O, MacKerell AD, Klein ML. J Phys Chem B. 2010;114:9787–9794. doi: 10.1021/jp101860v. [DOI] [PMC free article] [PubMed] [Google Scholar]
- 70.Beglov D, Roux B. J Chem Phys. 1994;100:9050–9063. [Google Scholar]
- 71.Guvench O, Greene SN, Kamath G, Brady JW, Venable RM, Pastor RW, Mackerell AD. J Comput Chem. 2008;29:2543–2564. doi: 10.1002/jcc.21004. [DOI] [PMC free article] [PubMed] [Google Scholar]
- 72.Loughlin WA, Fairlie DP. Amino Acids, Peptides and Proteins in Organic Chemistry. Wiley-VCH Verlag GmbH & Co. KGaA; Weinheim, Germany: 2011. pp. 129–147. [Google Scholar]
- 73.Loughlin WA, Tyndall JDA, Glenn MP, Hill TA, Fairlie DP. Chem Rev. 2010;110:PR32–PR69. doi: 10.1021/cr900395y. [DOI] [PubMed] [Google Scholar]
- 74.Nielsen PE, editor. Pseudo Peptides in Drug Discovery. Wiley-VCH Verlag GmbH & Co. KGaA; Weinheim, Germany: 2004. [Google Scholar]
- 75.Whitby LR, Ando Y, Setola V, Vogt PK, Roth BL, Boger DL. J Am Chem Soc. 2011;133:10184–10194. doi: 10.1021/ja201878v. [DOI] [PMC free article] [PubMed] [Google Scholar]
- 76.De Loof H, Nilsson L, Rigler R. J Am Chem Soc. 1992;114:4028–4035. [Google Scholar]
Associated Data
This section collects any data citations, data availability statements, or supplementary materials included in this article.