

Abstract
Critically ill patients need life saving treatments and are often exposed to medications requiring careful titration. The aim of this paper was to review systematically the research literature on the efficacy of interventions in reducing medication errors in intensive care. A search was conducted of PubMed, CINAHL EMBASE, Journals@Ovid, International Pharmaceutical Abstract Series via Ovid, ScienceDirect, Scopus, Web of Science, PsycInfo and The Cochrane Collaboration from inception to October 2011. Research studies involving delivery of an intervention in intensive care for adult patients with the aim of reducing medication errors were examined. Eight types of interventions were identified: computerized physician order entry (CPOE), changes in work schedules (CWS), intravenous systems (IS), modes of education (ME), medication reconciliation (MR), pharmacist involvement (PI), protocols and guidelines (PG) and support systems for clinical decision making (SSCD). Sixteen out of the 24 studies showed reduced medication error rates. Four intervention types demonstrated reduced medication errors post-intervention: CWS, ME, MR and PG. It is not possible to promote any interventions as positive models for reducing medication errors. Insufficient research was undertaken with any particular type of intervention, and there were concerns regarding the level of evidence and quality of research. Most studies involved single arm, before and after designs without a comparative control group. Future researchers should address gaps identified in single faceted interventions and gather data on multi-faceted interventions using high quality research designs. The findings demonstrate implications for policy makers and clinicians in adopting resource intensive processes and technologies, which offer little evidence to support their efficacy.
Keywords: intensive care, interventions, medication errors, systematic review
Introduction
Patients in intensive care require complex, life saving treatments and are often exposed to medications that need careful titration. They have also a limited ability to be actively involved in decisions about their health care. Past reviews on medication errors in intensive care have been narrative reviews rather than systematic reviews [1, 2]. Emphasis has been placed on examining the incidence of medication errors and risk factors [3–5]. Recent developments have involved the use of innovative interventions, the effects of which have not been assessed via a systematic review.
The aim of this paper is to review systematically the research literature to determine which interventions reduce medication errors in intensive care.
Methods
Definition
A medication error was defined as any preventable event that may cause or lead to inappropriate medication use or patient harm [6]. Medication errors could occur at any stage of the medication management process, including prescription, transcription, preparation and administration.
Searching
A search was conducted of PubMed, CINAHL, EMBASE, Journals@Ovid, International Pharmaceutical Abstract Series via Ovid, Science Direct, Scopus, Web of Science, PsycInfo, Cochrane Database of Systematic Reviews and the Cochrane Central Register of Controlled Trials from inception to October 2011. The following keywords were used in combination: ‘medication error’, ‘preventive adverse drug event’, ‘intensive care unit (ICU)’, ‘intensive care’, ‘critical care’ and ‘intervention’. Reference lists of articles were examined manually to identify additional papers.
Study selection
Studies were considered if they involved delivery of an intervention in ICU for adult patients with the intent of reducing medication errors. The incidence of medication errors had to be identified and included as a primary or secondary outcome. Only papers published in English were included. Papers were excluded if they focused on medication errors occurring in paediatric ICUs. Case studies, epidemiological studies, reviews, editorials and commentaries were also not considered.
Two authors read identified abstracts to locate relevant papers and full papers of all potentially relevant studies were examined independently to determine if they met the inclusion criteria. If there was uncertainty or disagreement about whether certain studies met the inclusion criteria, all authors discussed and negotiated agreement on eligible studies.
Data abstraction, level of evidence and quality assessment
Data were extracted using a standard form that included the study design, country of study, setting, sample size, intervention type, and outcomes obtained for medication errors. Two authors independently extracted data from the papers. Level of evidence of included papers was assessed using the tool developed by the Oxford Centre for Evidence-Based Medicine [7].
Quality of included papers was calculated independently by the first two authors through two quality checklists. The Transparent Reporting of Evaluations with Nonrandomized Designs (TREND) checklist [8] was used to assess quasi-experimental studies and the CONsolidated Standards of Reporting Trials (CONSORT) checklist [9] was used for randomized trials. These checklists were selected as they are strongly endorsed by prominent journals and leading editorial organizations [10]. Total possible scores for the TREND and CONSORT checklists were 58 and 37 respectively. One point was allocated for each item addressed and raw scores were converted to percentages. When a discrepancy occurred for a particular raw score, the two authors achieved resolution by consensus.
Statistical analysis
Attempts were made to conduct a meta-analysis using Review Manager (RevMan, Cochrane Collaboration, version 5.1, Oxford UK), which was specified a priori using a random effects model. The studies demonstrated extensive heterogeneity for medication errors, the outcome variable. Thus, only summary statistics were calculated for each study and no pooling of results was undertaken.
Results
Initial searching identified 1223 possible papers. Another five papers were added from hand-searching references, leading to a total of 1228 papers. Abstracts (n= 78) were selected for further examination and 36 full papers were identified for additional screening. Of these, 24 papers were considered relevant for data extraction [11–34] (Figure 1).
Figure 1.
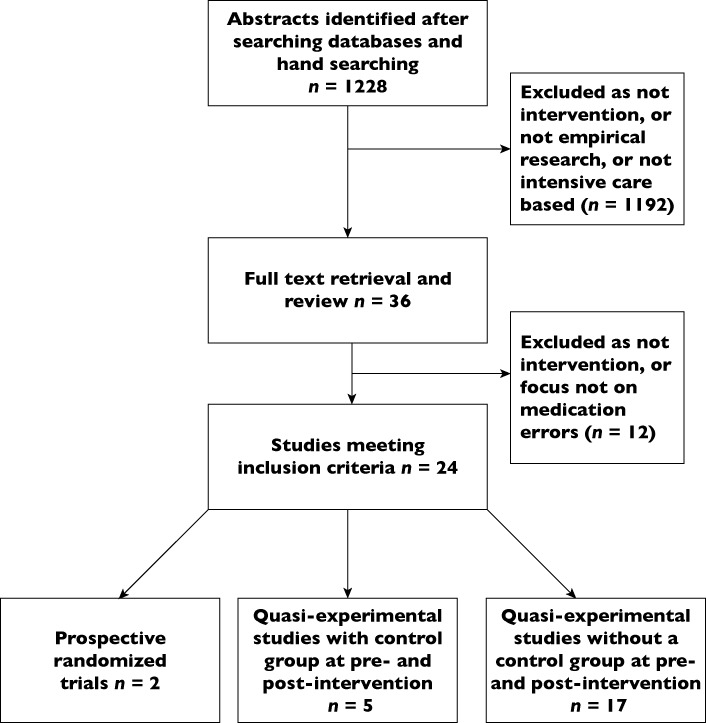
Flowchart of systematic review
Study and patient characteristics
Of the 24 studies, sample sizes ranged from 25 to 8901 patients and a single ICU was used as the research site in 15 studies (Table 1). Research designs were largely pre-post interventional studies aside from two studies, which involved prospective randomized trials [16, 18]. In five studies, a control group was incorporated in research involving quasi-experimental designs [13, 19, 24, 27, 29].
Table 1.
Overview of studies included in the systematic review
| Reference | Study design, patient enrollment | Country and setting(s) | Number of patients (n) | Intervention type | Type of medication error analyzed and effect of intervention on medication error rate |
|---|---|---|---|---|---|
| Computerized physician order entry (CPOE) | |||||
| Ali et al. [11] | Prospective, time series, cross-sectional study, consecutive sample | United Kingdom (UK), 25 bed cardiothoracic intensive care unit (ICU) | Pre: 190 | Computerized physician order entry and clinical information system | Incorrect dose or no dose prescribed for regular and stat. (immediate) medications (chart review) |
| Post 5 months: 210 | Pre-intervention: 229/3720 prescription errors (6.2%) | ||||
| Post 12 months: 204 | 5 months post-intervention: 0/4828 prescription errors (0%) | ||||
| 12 months post-intervention: 0/4905 prescription errors (0%) | |||||
| No P value reported | |||||
| Severity of harm of medication errors not examined | |||||
| Bradley et al. [12] | Pre-post intervention study, with reported errors | USA, university hospital, three ICUs (bed number not stated) | Not stated | Computerized physician order entry with clinical decision support | Medication errors (voluntary and solicited reported incidents) |
| Pre-intervention: 135/112,500 dose errors (0.12%) | |||||
| Post-intervention: 164/65,600 dose errors (0.25%) | |||||
| P < 0.05 | |||||
| Severity of harm of medication errors - | |||||
| Pre-intervention: 4.04 errors causing no harm/100 patients | |||||
| Post-intervention: 7.93 errors causing no harm/100 patients | |||||
| Pre-intervention: 0.41 errors causing harm/100 patients | |||||
| Post-intervention: 0.07 errors causing harm/100 patients | |||||
| Colpaert et al. [13] | Prospective controlled cross-sectional trial, random assignment | Belgium, tertiary university hospital, 22-bed surgical ICU | Not stated | Computerized physician order entry and clinical decision support system | Medication prescription errors (chart review) |
| Control unit (paper-based): 331/1224 prescription errors (27%) | |||||
| Intervention unit: 44/1286 prescription errors (3.4%) | |||||
| P < 0.001 (no baseline analysis undertaken) | |||||
| Severity of harm of medication errors – | |||||
| Control unit: 225/1224 minor prescription errors (18%), Intervention unit: 9/1286 minor prescription errors (0.7%) | |||||
| Control unit: 60/1224 serious prescription errors (5%), Intervention unit: 23/1286 serious prescription errors (1.8%) | |||||
| Shulman et al. [14] | Prospective, pre-post interventional study, consecutive sample | UK, university hospital, 22 bed ICU | Not stated | Computerized physician order entry without decision support | Prescription and administration errors (chart review) |
| Handwritten group: 71/1036 prescription errors (6.9%) | |||||
| CPOE group: 117/2429 prescription errors (4.8%) | |||||
| P < 0.04 | |||||
| Severity of harm of medication errors – | |||||
| Handwritten group: 50/1036 minor errors (4.8%), CPOE group: 95/2429 minor errors (3.9%) | |||||
| Handwritten group: 19/1036 moderate/major errors (1.8%), CPOE group: 22/2429 moderate/major errors (0.9%) | |||||
| Weant et al. [15] | Prospective, pre-post study, consecutive sample | USA, medical centre, neurosurgical ICU | Not stated | Computerized physician order entry and involvement of pharmacy intern | Number of medication errors (voluntary reporting) |
| Pre-intervention: 22 errors | |||||
| Post-intervention: 66 errors | |||||
| (No denominator given) | |||||
| P= 0.03 | |||||
| Total medication errors per 1000 doses | |||||
| Pre-intervention: 1.31 errors per 1000 doses | |||||
| Post-intervention: 2.49 errors per 1000 doses | |||||
| P < 0.05 | |||||
| Severity of harm of medication errors – | |||||
| Pre-intervention: 0.938 errors per 1000 doses causing no harm (9%), Post-intervention: 1.839 per 1000 doses causing no harm (18%) | |||||
| Pre-intervention: 0.137 errors per 1000 doses causing harm (1.4%), Post-intervention: 0.0152 errors per 1000 doses causing harm (0.15%) | |||||
| Changes in work schedules (CWS) | |||||
| Landrigan et al. [16] | Prospective randomized study, randomized sample, no accompanying control group during intervention period | USA, large academic hospital, 10 bed medical ICU, 10 bed coronary care unit (CCU) | Traditional schedule: 354 | Reduction of intern work hours < 24 h work shifts | Serious medication errors (chart review, observation, voluntary reports, computerized event-detection monitor) |
| Intervention schedule: 227 | Traditional: 99.7 errors per 1000 patient-days | ||||
| Intervention: 82.5 errors per 1000 patient-days | |||||
| P= 0.03 | |||||
| Severity of harm of medication errors: serious medication errors were the main focus of study | |||||
| Intravenous systems (IS) | |||||
| Nuckols et al. [17] | Pre-post, retrospective cohort study, consecutive sample | USA, academic hospital and non-academic hospital, surgical, trauma, burn and medical ICUs | 4604 overall | Smart pumps with programmed alerts in two hospitals | Preventable i.v. adverse drug events (chart review) |
| Conventional pump rate: 4.78 errors per 1000 patient-days | |||||
| Smart pump rate: 4.95 errors per 1000 patient-days | |||||
| P = 0.96 | |||||
| Severity of harm of medication errors not addressed | |||||
| Rothschild et al. [18] | Prospective randomized time-series trial, random sample | USA, academic medical centre, two cardiac surgery ICUs and two cardiac surgery step-down units | Control periods: 364 admissions; Intervention periods: 380 admissions | Decision support through smart infusion pumps: (4 × 8 week data) – 1st and 3rd periods are control periods, and 2nd and 4th periods are intervention periods | Serious medication errors (pump log data, chart review, staff reports, incident reports, surveillance monitor) |
| Control periods: 2.03 errors per 100 patient-pump days | |||||
| Intervention periods: 2.41 errors per 100 patient-pump days | |||||
| P= 0.124 | |||||
| Severity of harm of medication errors: serious medication errors were the main focus of study | |||||
| Modes of education (ME) | |||||
| Ford et al. [19] | Prospective, parallel, controlled pre-post intervention study, consecutive sample | USA, regional trauma centre, 32 bed medical ICU (didactic), 10-bed coronary care unit (CCU) (simulation) | Total of 880 doses to 76 patients across three time periods | Simulation-based learning | Medication error rates in doses (direct observation) |
| Pre-intervention: Control group: 33/159 errors (20.8%) | |||||
| Test group: 48/156 errors (30.8%) | |||||
| 1-4 weeks post-intervention: Control group: 39/172 errors (22.7%), P= 0.672 compared with pre-intervention | |||||
| Test group: 6/149 errors (4.0%), P < 0.001 compared to pre-intervention. | |||||
| 8-12 weeks: | |||||
| Control: 12/147 errors (36.7%), P= 0.002 compared to pre-intervention | |||||
| Test: 6/97 errors (6.2%) P < 0.001 compared to pre-intervention | |||||
| Severity of harm of medication errors not examined | |||||
| Thomas et al. [20] | Pre-post intervention study, consecutive sample | UK, 16 bed mixed general and neurosciences unit | Not stated | Use of educational and audit tool (three audit cycles for each phase) | Prescription errors (chart review, sum of all three cycles for each phase) |
| Pre-intervention: 156/691 errors (22.6%) | |||||
| Post-intervention: 155/974 errors (15.9%) | |||||
| 6 week post-intervention: 57/1022 (5.6%) | |||||
| P < 0.0005 | |||||
| Severity of harm of medication errors not addressed | |||||
| Medication reconciliation (MR) | |||||
| Pronovost et al. [21] | Pre-post prospective audit study, random sample | USA, academic hospital, 14-bed surgical ICU | Pre-intervention: 33 patients | Medication reconciliation survey for discharge from ICU | Prescribing medication errors in discharge order in medication reconciliation (chart review) |
| Post- intervention: 25 patients | Pre-intervention: 31/33 patients (94%) had orders changed | ||||
| Post-intervention: 10/25 patients (40%) had orders changed | |||||
| No P value reported | |||||
| Severity of harm of medication errors not addressed | |||||
| Protocols and guidelines (PG) | |||||
| Bertsche et al. [22] | Retrospective cohort and prospective pre-post intervention study, consecutive sample | Germany, teaching hospital, 12 bed ICU | Retrospective pre-intervention: 100 | Standard operating procedure for drug incompatibilities, 15-minute instruction | Prevalence of incompatible medication pairs (retrospective chart review) |
| Prospective: 50 (25 pre-intervention + 25 post-intervention) | Pre-intervention only: 262/3617 errors (7.2%) | ||||
| Prevalence of incompatible medication pairs (prospective chart review) | |||||
| Pre-intervention: 30/516 errors (5.8%) | |||||
| Post-intervention: 14/592 errors (2.4%) | |||||
| P < 0.003 | |||||
| Severity of harm of medication errors not examined | |||||
| McMullin et al. [23] | Prospective longitudinal observational study, consecutive sample | Canada, university hospital, 15 bed medical and surgical ICU | Phase 1 (usual practice): 68 | Thromboprophylaxis guideline | Errors of omission (chart review) |
| Phase 2 (intervention): 261 | Proportion of ICU days (median %): | ||||
| Phase 1: 135/674 median days with errors (20%) | |||||
| Phase 3 (3 month follow-up): 101 | Phase 2: 0/2819 median days with errors (0%) | ||||
| Phase 3: 0/1206 median days with errors (0%) | |||||
| P < 0.001 | |||||
| Severity of harm of medication errors not addressed | |||||
| Wasserfallen et al. [24] | Prospective pre-post controlled study, consecutive sample | Switzerland, university hospital, 14 bed medical ICU, 17 bed surgical ICU | 225 patients in medical ICU (control ward), 192 patients in surgical ICU (intervention ward) | Formatting of medical order sheet | Ambiguous, unsafe antibiotic prescription errors (chart review) |
| Baseline: | |||||
| Control ward: 160/954 errors (16.8%) | |||||
| Intervention ward: 330/1117 errors (29.5%) | |||||
| Follow-up: | |||||
| Control ward: 62/698 errors (8.9%) | |||||
| Intervention ward: 3/509 errors (0.6%) | |||||
| P < 0.001 between and across groups | |||||
| Severity of harm of medication errors not addressed | |||||
| Pharmacist involvement (PI) | |||||
| Klopotowska et al. [25] | Prospective pre-post intervention study | The Netherlands, tertiary teaching hospital, 28 bed ICU | Pre-intervention: 115 | On-ward participation of pharmacist at patient review meetings | Prescribing errors (chart review) |
| Pre-intervention: 190.5 errors per 1000 patient-days | |||||
| Post-intervention: 1058 | Post-intervention: 62.5 errors per 1000 patient-days | ||||
| P < 0.001 | |||||
| Severity of harm of medication errors – | |||||
| Pre-intervention: 132.9 errors per 1000 monitored patient-days causing no harm | |||||
| Post-intervention: 45.4 errors per 1000 monitored patient-days causing no harm | |||||
| Pre-intervention: 53.6 errors per 1000 monitored patient-days causing harm | |||||
| Post-intervention: 16.1 errors per 1000 monitored patient-days causing harm | |||||
| Langebrake & Hilgarth [26] | Prospective pre-post intervention study, consecutive sample | Germany 13 bed medical ICU, 11 bed neurologic ICU, 12 bed neurosurgery ICU, 10 bed cardiac ICU, 12 bed heart surgery ICU, 16 bed surgical ICU | Not stated | Pharmacist participation on consultant ward round and chart review | Medication errors (documentation of pharmacist activities) |
| Pre-intervention: not stated | |||||
| During 2 year period: 27 errors/2312 interventions (1.2%) | |||||
| No P value reported | |||||
| Severity of harm of medication errors not addressed | |||||
| Leape et al. [27] | Pre-post intervention study with control unit in post-intervention, random sample | USA, large tertiary care hospital, 17 bed medical ICU, 15 bed CCU | Control unit: 125 | Senior pharmacist attending rounds | Preventable prescribing adverse drug events (review of medical records, pharmacist interventions tracking form) |
| Intervention unit: 140 | Control unit: Pre-intervention: 10.9 errors per 1000 patient-days, Post-intervention: 12.4 errors per 1000 patient-days | ||||
| P > 0.05 | |||||
| Intervention unit: Pre-intervention: 10.4 errors per 1000 patient-days, Post-intervention: 3.5 errors per 1000 patient-days, P < 0.001 | |||||
| Severity of harm of medication errors not addressed | |||||
| Lee et al. [28] | Interventional study with control phase following intervention phase, consecutive sample | USA, Veteran Affairs medical centre, 18 bed integrated ICU | Control phase: 173 | Participation of pharmacist in collaborative management. | Medication error rate (medical record review, documentation of pharmacist recommendations) comprising averted (recommendations accepted by provider) and non-averted errors (recommendations not accepted by provider) |
| Pharmacist phase: 179 | Control phase: 80.1 errors per 1000 patient days | ||||
| Pharmacist phase: 370 errors per 1000 patient days | |||||
| P < 0.0001 | |||||
| Averted medication errors, leading to improved clinical outcomes: | |||||
| Pre-intervention phase: 7/56 errors (15.2%) | |||||
| Post-intervention phase: 66/194 errors (34%) | |||||
| Severity of harm of medication errors not addressed | |||||
| Support systems for clinical decision-making (SSCD) | |||||
| Chapuis et al. [29] | Pre-intervention and post-intervention study, random sample | France, university hospital, 2 ICUs of 8 and 10 beds | Control unit (pre-intervention): 31, (post-intervention): 25 | Automated drug dispensing system | Overall medication error rate for picking, preparation and administration (direct observation) |
| Pre-intervention: Control unit: 58/300 errors per medication (19.3%), Test unit: 75/368 errors per medication (20.4%), P > 0.05 | |||||
| Test unit (pre-intervention): 32, (post-intervention): 27 | Post-intervention: Control unit: 62/333 errors (18.6%), Test unit: 64/475 errors (13.5%) | ||||
| P < 0.05 between units | |||||
| Severity of harm of medication errors as a proportion of detailed opportunities for error | |||||
| Control unit: 190/6154 errors causing no harm (3.1%), Test unit: 54/2599 errors causing no harm (2.1%) | |||||
| Control unit: 35/6154 errors causing harm (0.6%), Test unit: 16/2599 errors causing harm (0.7%) | |||||
| DeYoung et al. [30] | Prospective pre-post intervention study, consecutive sample | USA, community teaching hospital, 38 bed medical ICU | Pre-intervention: 47 | Bar-code assisted medication administration | Medication administration errors (direct observation) |
| Post-intervention: 45 | Pre-intervention: 153/775 errors (19.7%) | ||||
| Post-intervention: 60/690 errors (8.7%) | |||||
| P < 0.001 | |||||
| Severity of harm of medication errors not examined | |||||
| Evans et al. [31] | Prospective comparative, pre-post study | UK, teaching hospital, one ICU (bed umber. not stated) | Not stated | Computer-assisted prescribing | Medication prescribing errors for i.v. fluids, i.v. infusions and intermittent medications (chart review) |
| Pre-intervention 148/1184 errors (12.5%) | |||||
| Post-intervention: 299/1225 errors (24.4%) | |||||
| No P value reported | |||||
| Severity of harm of medication errors not examined | |||||
| Evans et al. [32] | Prospective pre-post intervention study, consecutive sample | USA, community, acute care referral hospital, 12 bed ICU | Pre-intervention: 1136 | Computerised decision support program and computer-based patient records | Excess daily doses (review of antibiotic dose monitor, medical record review) |
| Post-intervention: 545 | Pre-intervention: 405/8937 errors (4.5%) doses | ||||
| Post-intervention: 87/4221 errors (2.1%) doses | |||||
| P < 0.01 | |||||
| Severity of harm of medication errors not examined | |||||
| Evans et al. [33] | Prospective pre-post intervention study, consecutive sample | USA, tertiary care centre, 12 bed shock, trauma, respiratory ICU | Pre-intervention: 8901 | Computer-assisted antibiotic-dose monitor | Patients receiving excessive drug dose (review of antibiotic dose monitor, medical record review) |
| Post-intervention: 4483 | Pre-intervention: 4494/8901 errors (50%) | ||||
| Post-intervention:1974/4483 errors (44%) | |||||
| P < 0.001 | |||||
| Severity of harm of medication errors not examined | |||||
| Fraenkel et al. [34] | Longitudinal observational pre-post study, consecutive sample | Australia, tertiary referral teaching hospital, 12 bed ICU | Not stated | Clinical information system | Medication incidents (voluntary reporting) |
| Pre-intervention: 85 errors | |||||
| Post-intervention: 55 errors (no denominator) | |||||
| P < 0.05 | |||||
| Severity of harm of medication errors not examined | |||||
Level of evidence and quality of studies
Tables 2 and 3 show the level of evidence and quality scores for the quasi-experimental studies and randomized trials, respectively, included in the systematic review. In all, 17 studies were at level 4 for evidence, two were at level 3 and four were at level 2. Quality scores ranged from 50 to 76%. Sixteen studies had a quality score greater than 60%.
Table 2.
Level of evidence and quality analysis of data for quasi-experimental studies with section raw scores, overall scores and percentages (N= 22)
| Study and level of evidence | Title and abst. | Bgd. | Partic. | Int. | Obj. | Outc. | Sp. Sz. | Assign. mtd. | Bld. | Unit of anal. | Stat. mtd. | Part. flow | Recru. | Basel. data | Basel. equiv. | No. anal. | Outc. and estim. | Anc. Anal. | Adv. Ev. | Inter. | Gen. | Ov. Evid. | n/N |
|---|---|---|---|---|---|---|---|---|---|---|---|---|---|---|---|---|---|---|---|---|---|---|---|
| % | |||||||||||||||||||||||
| Ali et al. [11] (COPE) Level 4 | 3/4 | 0/1 | 1/3 | 8/9 | 1/1 | 2/3 | 0/1 | 1/3 | 0/1 | 1/2 | 2/4 | 5/7 | 1/1 | 0/4 | 0/1 | 2/2 | 2/3 | 0/1 | 0/1 | 4/4 | 1/1 | 1/1 | 36/58 |
| 62% | |||||||||||||||||||||||
| Bradley et al. [12] (COPE) Level 4 | 2/4 | 0/1 | 2/3 | 9/9 | 1/1 | 3/3 | 0/1 | 1/3 | 0/1 | 1/2 | 1/4 | 0/7 | 1/1 | 0/4 | 0/1 | 0/2 | 2/3 | 1/1 | 1/1 | 4/4 | 0/1 | 1/1 | 30/58 |
| 52% | |||||||||||||||||||||||
| Colpaert et al. [13] (COPE) Level 3 | 3/4 | 0/1 | 3/3 | 8/9 | 0/1 | 3/3 | 0/1 | 1/3 | 1/1 | 1/2 | 2/4 | 4/7 | 1/1 | 1/4 | 0/1 | 2/2 | 3/3 | 1/1 | 1/1 | 4/4 | 1/1 | 1/1 | 41/58 |
| 71% | |||||||||||||||||||||||
| Shulman et al. [14] (COPE) Level 4 | 3/4 | 0/1 | 1/3 | 8/9 | 1/1 | 2/3 | 0/1 | 1/3 | 1/1 | 1/2 | 1/4 | 5/7 | 1/1 | 0/4 | 1/1 | 2/2 | 3/3 | 0/1 | 1/1 | 4/4 | 1/1 | 1/1 | 38/58 |
| 66% | |||||||||||||||||||||||
| Weant et al. [15] (COPE) Level 4 | 3/4 | 0/1 | 1/3 | 8/9 | 1/1 | 3/3 | 0/1 | 1/3 | 0/1 | 1/2 | 2/4 | 2/7 | 1/1 | 2/4 | 1/1 | 0/2 | 3/3 | 0/1 | 1/1 | 4/4 | 0/1 | 1/1 | 35/58 |
| 60% | |||||||||||||||||||||||
| Nuckols et al. [17] (IS) Level 4 | 1/4 | 0/1 | 2/3 | 8/9 | 1/1 | 1/3 | 0/1 | 1/3 | 1/1 | 1/2 | 2/4 | 5/7 | 1/1 | 4/4 | 1/1 | 2/2 | 3/3 | 0/1 | 1/1 | 4/4 | 1/1 | 1/1 | 41/58 |
| 71% | |||||||||||||||||||||||
| Ford et al. [19] (ME) Level 3 | 3/4 | 0/1 | 2/3 | 6/9 | 1/1 | 3/3 | 0/1 | 0/3 | 1/1 | 1/2 | 1/4 | 3/7 | 0/1 | 1/4 | 0/1 | 2/2 | 2/3 | 0/1 | 0/1 | 4/4 | 1/1 | 1/1 | 32/58 |
| 55% | |||||||||||||||||||||||
| Thomas et al. [20] (ME) Level 4 | 3/4 | 0/1 | 1/3 | 8/9 | 1/1 | 3/3 | 0/1 | 1/3 | 0/1 | 2/2 | 2/4 | 4/7 | 1/1 | 1/4 | 1/1 | 2/2 | 3/3 | 1/1 | 1/1 | 4/4 | 1/1 | 0/1 | 40/58 |
| 69% | |||||||||||||||||||||||
| Pronovost et al. [21] (MR) Level 4 | 2/4 | 1/1 | 1/3 | 9/9 | 1/1 | 2/3 | 0/1 | 1/3 | 0/1 | 1/2 | 1/4 | 3/7 | 1/1 | 0/4 | 1/1 | 2/2 | 3/3 | 0/1 | 1/1 | 4/4 | 1/1 | 1/1 | 36/58 |
| 62% | |||||||||||||||||||||||
| Bertsche et al. [22] (PG) Level 4 | 3/4 | 0/1 | 3/3 | 8/9 | 1/1 | 3/3 | 0/1 | 1/3 | 1/1 | 1/2 | 2/4 | 4/7 | 0/1 | 1/4 | 0/1 | 2/2 | 2/3 | 1/1 | 0/1 | 3/4 | 0/1 | 1/1 | 37/58 |
| 64% | |||||||||||||||||||||||
| McMullin et al. [23] (PG) Level 4 | 3/4 | 0/1 | 3/3 | 8/9 | 1/1 | 2/3 | 0/1 | 1/3 | 0/1 | 1/2 | 2/4 | 6/7 | 1/1 | 3/4 | 1/1 | 2/2 | 3/3 | 1/1 | 1/1 | 4/4 | 1/1 | 1/1 | 44/58 |
| 76% | |||||||||||||||||||||||
| Wasserfallen et al. [24] (PG) Level 3 | 3/4 | 0/1 | 1/3 | 8/9 | 1/1 | 3/3 | 0/1 | 1/3 | 0/1 | 1/2 | 1/4 | 5/7 | 1/1 | 2/4 | 0/1 | 2/2 | 3/3 | 0/1 | 0/1 | 4/4 | 1/1 | 1/1 | 38/58 |
| 66% | |||||||||||||||||||||||
| Klopotowska et al. [25] (PI) Level 4 | 3/4 | 0/1 | 3/3 | 7/9 | 1/1 | 3/3 | 0/1 | 1/3 | 0/1 | 1/2 | 2/4 | 6/7 | 1/1 | 3/4 | 0/1 | 1/2 | 3/3 | 0/1 | 0/1 | 4/4 | 1/1 | 1/1 | 41/58 |
| 71% | |||||||||||||||||||||||
| Langebrake & Hilgarth [26] (PI) Level 4 | 3/4 | 0/1 | 2/3 | 7/9 | 1/1 | 3/3 | 0/1 | 1/3 | 0/1 | 1/2 | 1/4 | 0/7 | 1/1 | 0/4 | 0/1 | 0/2 | 2/3 | 0/1 | 1/1 | 4/4 | 1/1 | 1/1 | 29/58 |
| 50% | |||||||||||||||||||||||
| Leape et al. [27] (PI) Level 2 | 3/4 | 0/1 | 2/3 | 5/9 | 0/1 | 3/3 | 0/1 | 1/3 | 1/1 | 1/2 | 1/4 | 3/7 | 1/1 | 0/4 | 1/1 | 2/2 | 3/3 | 0/1 | 1/1 | 4/4 | 1/1 | 1/1 | 34/58 |
| 59% | |||||||||||||||||||||||
| Lee et al. [28] (PI) Level 4 | 3/4 | 0/1 | 1/3 | 8/9 | 1/1 | 3/3 | 0/1 | 1/3 | 0/1 | 1/2 | 2/4 | 6/7 | 1/1 | 3/4 | 1/1 | 2/2 | 3/3 | 0/1 | 1/1 | 4/4 | 0/1 | 1/1 | 42/58 |
| 72% | |||||||||||||||||||||||
| Chapuis et al. [29] (SSCM) Level 2 | 3/4 | 0/1 | 3/3 | 6/9 | 1/1 | 3/3 | 1/1 | 1/3 | 0/1 | 0/2 | 2/4 | 3/7 | 0/1 | 3/4 | 0/1 | 1/2 | 2/3 | 0/1 | 1/1 | 4/4 | 1/1 | 1/1 | 36/58 |
| 62% | |||||||||||||||||||||||
| DeYoung et al. [30] (SSCM) Level 4 | 3/4 | 0/1 | 3/3 | 7/9 | 1/1 | 2/3 | 0/1 | 1/3 | 0/1 | 1/2 | 3/4 | 0/7 | 1/1 | 0/4 | 0/1 | 1/2 | 3/3 | 1/1 | 1/1 | 4/4 | 1/1 | 1/1 | 34/58 |
| 59% | |||||||||||||||||||||||
| Evans et al. [31] (SSCM) Level 4 | 3/4 | 0/1 | 3/3 | 9/9 | 1/1 | 2/3 | 0/1 | 0/3 | 1/1 | 1/2 | 0/4 | 2/7 | 1/1 | 0/4 | 0/1 | 1/2 | 2/3 | 1/1 | 1/1 | 4/4 | 1/1 | 1/1 | 34/58 |
| 59% | |||||||||||||||||||||||
| Evans et al. [32] (SSCM) Level 4 | 3/4 | 0/1 | 2/3 | 7/9 | 1/1 | 2/3 | 0/1 | 1/3 | 0/1 | 0/2 | 2/4 | 3/7 | 1/1 | 4/4 | 1/1 | 2/2 | 3/3 | 1/1 | 1/1 | 4/4 | 0/1 | 0/1 | 38/58 |
| 66% | |||||||||||||||||||||||
| Evans et al. [33] (SSCM) Level 4 | 3/4 | 0/1 | 3/3 | 6/9 | 1/1 | 1/3 | 0/1 | 1/3 | 0/1 | 2/2 | 2/4 | 5/7 | 1/1 | 3/4 | 0/1 | 2/2 | 3/3 | 1/1 | 1/1 | 4/4 | 0/1 | 0/1 | 39/58 |
| 67% | |||||||||||||||||||||||
| Fraenkel et al. [34] (SSCM) Level 4 | 3/4 | 0/1 | 1/3 | 7/9 | 1/1 | 3/3 | 0/1 | 1/3 | 0/1 | 0/2 | 1/4 | 2/7 | 1/1 | 0/4 | 0/1 | 0/2 | 2/3 | 0/1 | 1/1 | 4/4 | 1/1 | 1/1 | 29/58 |
| 50% |
Note. For levels of evidence, level 1 refers to systematic reviews of randomized controlled trials, level 2 refers to randomized trials, or observational studies with dramatic effects, level 3 refers to a non-randomized controlled cohort, follow-up study, level 4 refers to case series, case-control studies or historically controlled studies and level 5 refers to mechanism-based reasoning. CPOE refers to computerized physician order entry, CWS refers to changes in work schedules, IS refers to intravenous systems, ME refers to modes of education, MR refers to medication reconciliation, PG refers to protocols and guidelines, PI refers to pharmacist involvement and SSCD refers to support systems for clinical decision-making. The following abbreviations were used in the table: Title and abst., Title and abstract; Bgd., Background; Partic., Participants; Int., Interventions; Obj., Objectives; Outc., Outcomes; Sp. sz., Sample size; Assign. mtd., Assignment method; Bld., Blinding; Unit of anal., Unit of analysis; Stat. mtd., Statistical methods; Part. flow, Participant flow; Recru., Recruitment; Basel. data, Baseline data; Basel. equiv., Baseline equivalence; No. anal., Number analyzed; Outc. and estim., Outcomes and estimation; Anc. anal., Ancillary analyses; Adv. ev., Adverse events; Inter. = Interpretation; Gen., Generalizability; Ov. evid., Overall evidence.
Table 3.
Level of evidence and quality analysis of data for prospective randomized trials with section raw scores, overall scores and percentages (n= 2)
| Title and abst. | Bgd. | Des. | Partic. | Int. | Outc. | Sp. sz. | Seq. | Alloc. | Imp. | Bld. | Stat. mtd. | Part. flow | Recru. | Basel. data | No. anal. | Outc. and estim. | Anc. anal. | Hms. | Lim. | Gen. | Inter. | Oth. | n/N | |
|---|---|---|---|---|---|---|---|---|---|---|---|---|---|---|---|---|---|---|---|---|---|---|---|---|
| % | ||||||||||||||||||||||||
| Landrigan et al. [16] (CWS) Level 2 | 1/2 | 2/2 | 1/2 | 2/2 | 1/1 | 1/2 | 1/2 | 0/2 | 0/1 | 1/1 | 1/2 | 2/2 | 1/2 | 1/2 | 1/1 | 1/1 | 0/2 | 1/1 | 1/1 | 1/1 | 1/1 | 1/1 | 3/3 | 25/37 |
| 68% | ||||||||||||||||||||||||
| Rothschild et al. [18] (IS) Level 2 | 1/2 | 2/2 | 1/2 | 2/2 | 1/1 | 1/2 | 0/2 | 2/2 | 0/1 | 1/1 | 1/2 | 2/2 | 1/2 | 2/2 | 1/1 | 1/1 | 0/2 | 1/1 | 1/1 | 1/1 | 1/1 | 1/1 | 3/3 | 27/37 |
| 73% |
Note. For levels of evidence, level 1 refers to systematic reviews of randomized controlled trials, level 2 refers to randomized trials, or observational studies with dramatic effects, level 3 refers to a non-randomized controlled cohort, follow-up study, level 4 refers to case series, case-control studies or historically controlled studies and level 5 refers to mechanism-based reasoning. CWS refers to changes in work schedules and IS refers to intravenous systems. The following abbreviations were used in the table: Title and abst., Title and abstract; Bgd., Background; Des., Design; Partic., Participants; Int., Interventions; Outc., Outcomes; Sp. sz., Sample size; Seq., Sequence generation; Alloc., Allocation; Imp., Implementation; Bld., Blinding; Stat. mtd., Statistical methods; Part. flow, Participant flow; Recru., Recruitment; Basel. data, Baseline data; No. anal., Numbers analyzed; Outc. and estim., Outcomes and estimation; Anc. anal., Ancillary analyses; Hms., Harms; Lim., Limitations; Gen., Generalizability; Inter., Interpretation; Oth., Other information, including registration, protocol, and funding.
Identified interventions
Eight different types of interventions were identified: computerized physician order entry (CPOE), changes in work schedules (CWS), intravenous systems (IS), modes of education (ME), medication reconciliation (MR), pharmacist involvement (PI), protocols and guidelines (PG) and support systems for clinical decision-making (SSCD). Sixteen out of the 24 studies demonstrated statistically significant reductions in medication error rates. Four studies showed increased medication error rates and four studies demonstrated no change or an unclear effect. Figure 2 shows the risk ratio summary statistics for 22 studies. Risk ratio results could not be calculated for two studies [26, 34]. In one study, no pre-intervention or control data were available that could be compared with intervention data [26] and for the other study, no details were given about the total opportunities for medication errors (denominator term) [34]. All studies that involved CWS, ME, MR or PG as interventional approaches resulted in decreased medication error rates.
Figure 2.
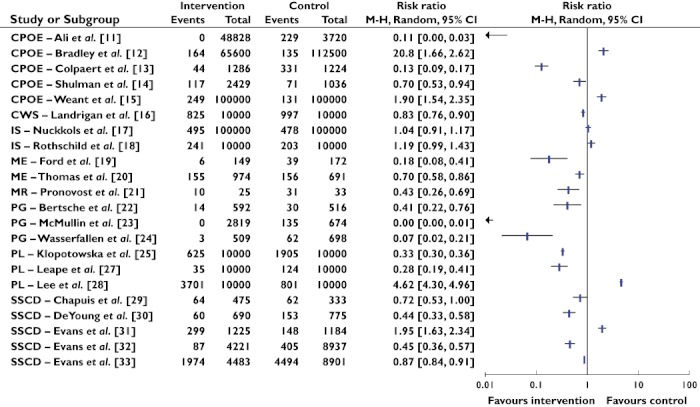
Summary statistics and forest plot of studies (n= 22). Note: CPOE refers to computerized physician order entry, CWS refers to changes in work schedules, IS refers to intravenous systems, ME refers to modes of education, MR refers to medication reconciliation, PG refers to protocols and guidelines, PI refers to pharmacist involvement and SSCD refers to support systems for clinical decision-making. The studies by Fraenkel et al. [26] and Langebrake & Hilgarth [34] were not included in the risk ratio analysis as no denominator values were available and no data were available at pre-intervention respectively. Risk ratio M-H refers to Risk ratio Mantel-Haenszel. M-H, Mantel-Haenszel
CPOE
The impact of CPOE in reducing medication errors was examined in five studies [11–15]. Three studies involved testing CPOE with decision support [11–13], while two studies involved examining the effects of CPOE without decision support [14, 15]. Following the introduction of CPOE, Ali et al. [11] found the proportion of dosing errors decreased from 6.2% (229/3720 medications) to no dosing errors at 5 or 12 months post-intervention. In their pre-post intervention study using retrospective trend analysis, Bradley et al. [12] showed the total number of reported medication errors following introduction of CPOE increased from 0.12% to 0.25% per prescribed dose. However, the proportion of errors producing harm actually decreased. Colpaert et al. [13] examined the effect of CPOE in reducing medication errors compared with paper-based prescriptions in a 22 bed surgical ICU split into two units. No baseline data were provided. At post intervention, the number of prescription errors in the intervention unit (44/1286, 3.4%) was significantly less than those in the control unit (331/1224, 27%). With respect to the two studies investigating CPOE with no clinical decision support [14, 15], one exhibited a 30% reduction in the CPOE group compared with the handwritten group [14] while the other showed a 90% increase in medication errors at post-intervention compared with pre-intervention [15]. In studies relying on voluntarily reported errors [12, 15], both demonstrated an increase in the total number of medication errors post implementation of CPOE, but a decrease in medication errors leading to patient harm.
CWS
Only one study involved an investigation of the effect of CWS using a randomized, non-blinded design [16]. Comparisons were undertaken of medication errors made by medical interns working in a traditional work schedule compared with those made when extended work shifts were removed. Interns in the intervention group made fewer serious medication errors than those undertaking a traditional work schedule: 82.5 errors per 1000 patient-days compared with 99.7 errors per 1000 patient-days (P= 0.03).
(IS)
Two studies were identified involving strategies for IS, which included smart pumps to provide point of care decision support. Nuckols et al. [17] examined retrospectively patients' medical records before and after conventional i.v. pumps were replaced by smart pumps. No changes were found in the incidence of preventable intravenous adverse drug events across the two periods (4.78 vs. 4.95 per 1000 patient-days, P= 0.96). Suggested reasons for the low rate of events detected by smart pumps included pumps not being designed to address medication boluses, dosage ranges being too wide for certain patients and insufficient integration with vital sign and laboratory data. Rothschild et al. [18] examined the effect of real-time decision support by smart pumps compared with no decision support. Rates for serious medication errors did not differ between the control and intervention periods respectively (2.03 vs. 2.41 errors per 100 patient-pump days, P= 0.124). During the intervention period, 571 (25%) bypasses of the medication library in smart pumps were made.
ME
The effects of ME were investigated in two studies [19, 20]. Ford et al. [19] compared simulation-based training delivered to nurses working in a coronary care unit to didactic lectures given to nurses situated in a medical ICU. After observing nurses provided with the simulation, medication administration error rates decreased from 31% at baseline to 4% at initial post-intervention (P < 0.001), and to 6% at 12 weeks post-intervention (P < 0.001). Conversely, nurses provided with didactic lectures did not lead to changes in medication administration errors from baseline (21%) to initial post-intervention (23%, P= 0.672). The medication administration error rate at 12 weeks post-intervention in the didactic lecture group increased compared with that at baseline (37%, P= 0.002), which the authors were unable to explain. Thomas et al. [20] examined the effect of prescriber education in ward-based teaching and feedback in reducing prescribing errors in three sets of cycles at three intervention points. Prescribing errors ranged from 22.6% at pre-training to 15.9% at the post-intervention and 5.6% at the 6 week post-intervention point (P < 0.0005).
MR
One study examined the impact of using a discharge survey as part of a MR process to reduce medication errors [21]. About 10% of discharges were audited each week of the study, and all of 31 patients discharged during the baseline phase had their orders changed. After implementation of the discharge survey, 10 of the 25 patients audited had their medication orders changed. No details were provided about the total number of medication charts audited for each phase or on how representative the 10% of discharges was of the patient population admitted to the unit. No inferential statistical analysis was undertaken.
PG
PG were employed in three studies [22–24]. Bertsche et al. [22] tested a standard operating system in identifying drug incompatibilities in a 12 bed ICU. The incidence of incompatible medication pairs reduced from 5.8% in the baseline period to 2.4% in the study period (P < 0.003). In implementing an evidence-based thromboprophylaxis guideline, McMullin and colleagues [23] examined medication errors of omission in a medical-surgical ICU. They found the proportion of days where heparin prophylaxis was omitted reduced from 20.0% (135/674) at baseline to 0% (0/2819) in the intervention period and 0% (0/1206) in the 10 month follow-up period. Finally, Wasserfallen et al. [24] examined the effect of formatting a medical order sheet, in reducing ambiguous, antibiotic prescription errors. A 14 bed medical ICU was a control ward where physicians used the usual medical order sheet and a 17 bed surgical ICU acted as the intervention ward. From baseline to follow-up, the proportion of ambiguous errors varied from 16.8 to 8.9% in the control ward and from 29.5 to 0.6% in the intervention ward (P < 0.001).
PI
Research on PI involved four studies [25–28]. Klopotowska et al. [25] examined prescribing errors in a 28 bed ICU before and after pharmacist participation at patient review meetings. Following pharmacist participation, prescription errors reduced from 190.5 per 1000 patient-days to 62.5 per 1000 patient-days (P < 0.001). Over a 2 year period, Langebrake & Hilgarth [26] evaluated pharmacists' participation on the consultant ward round and chart review. They found pharmacists identified 2312 interventions and 27 (1%) of these comprised medication errors. No information was provided about the proportion of medication errors occurring in relation to total opportunities for medication errors, or about the proportion of medication errors transpiring before pharmacists' participation. In reporting the effect of pharmacist participation on medical ward rounds, Leape et al. [27] compared preventable adverse drug events in a 17 bed medical ICU with a 15 bed coronary care unit with no PI as a control unit. In the medical ICU, the rate of preventable prescribing adverse drug events decreased from 10.4 to 3.5 events per 1000 patient-days (P < 0.001), while no significant changes were observed in the control unit (10.9 vs. 12.4 per 1000 patient-days, P > 0.05). Lee et al. [28] sought to examine PI with medical rounds and ongoing monitoring of patients' medications in reducing medication errors in ICU. The medication error rate during the pharmacist phase was significantly higher compared with the control phase (370 per 1000 patient-days vs. 80.1 per 1000 patient-days, P < 0.0001).
SSCD
Six studies were located that examined the effects of SSCD [29–34]. Chapuis et al. [29] evaluated the effects of automatic dispensing on medication errors. At baseline, the overall medication error rates were similar in the control and test units (19.3% vs. 20.4%, P > 0.05), respectively. Following implementation of the dispensing system, while the proportion of medication errors reduced in the test unit compared with the control unit (13.5% vs. 18.6%, P < 0.05) respectively, risk ratio analysis demonstrated that the impact of the dispensing system on medication error reduction was not significant (Figure 2). The dispensing system had a greater effect on reducing preparation errors rather than on prescribing or administration errors, and most errors caused no harm. In considering the effect of bar-code medication administration, DeYoung et al. [30] undertook a pre-post intervention study in a 38 bed medical ICU. Medication administration errors reduced from 19.7% to 8.7% (P < 0.001). Evans et al. [31] compared computer-assisted prescriptions with handwritten prescriptions for accuracy, completeness, legibility and time spent prescribing in ICU. Medication prescribing errors for intravenous fluids, infusions and intermittent medications increased across the study period from 12.5 to 24.4%. However, no inferential statistics were undertaken on results. Evans and colleagues [32, 33] evaluated a computer-assisted management program for antibiotics in a community referral hospital and in a tertiary care hospital. Within the community hospital, excess dose errors reduced significantly between the control and intervention phases from 4.5% to 2.1% (P < 0.01) [32]. Application of the intervention within the tertiary hospital showed that 50.4% of patients received excessive antibiotic doses during the pre-intervention compared with 44.0% of patients during the post-intervention period (P < 0.001) [33]. Fraenkel et al. [34] compared a clinical information system to paper-based charts and reported the number of medication incidents reduced from 85 to 55 across the study period (P < 0.05). No information was provided on the total number of medications prescribed or administered during the course of the research.
Discussion
This systematic review examined the effects of various interventions in reducing medication errors in intensive care. Most studies involved single-arm, before and after designs without a comparative control group. Quality assessment results showed certain aspects were not well addressed: lack of blinding of the assessor, lack of statistical consideration of the clustering effect involving patients experiencing the error, or health professionals committing the error and lack of subgroup and adjusted statistical analyses.
Of the eight types of interventions identified, four types demonstrated reduced medication errors post-intervention: CWS, ME, MR or PG. However, it is not possible to promote these interventions as positive models for patient safety because of the lack of work undertaken with a particular type, and concerns regarding level of evidence and quality of the research. The two studies associated with the use of IS demonstrated no change in medication error rates [17, 18]. While further research is required on this intervention type, possible reasons for no change in medication error rates include the inability of IS to address medication boluses, imprecision with dosage ranges that can be assigned to particular patients, lack of integration with patient monitoring data, extensive bypasses of medication libraries, over-riding of alerts and the possibility that the intervention is ineffective. Further research with IS should ensure compliance with dose-checking features are measured and barriers to compliance are identified and addressed.
Mixed results were demonstrated in studies involving CPOE, PI or SSCD as interventional approaches. With respect to the use of CPOE, three out of five studies demonstrated decreased medication error rates post CPOE implementation [11, 13, 14]. The remaining two studies, demonstrating increased medication error rates [12, 15], which could have been associated with shortcut or default selections that were over-ridden by clinicians in situations relating to non-standard prescribing for underweight patients, children and older adults, resulting in toxic doses. Frequent alerts may have interrupted work flow, causing these messages to be ignored by clinicians.
Mixed results were also demonstrated in studies involving PI. Two out of the four studies showed decreased medication error rates [25, 27] while one study showed an increase [28] and the remaining one had an unclear effect [26]. In the two studies associated with decreased medication error rates following PI, there was extensive participation of pharmacists in intensive care activities. In Klopotowska et al.'s work, pharmacists regularly attended multidisciplinary review meetings and followed up with doctors to make prescribing recommendations [25]. Similarly, in Leape et al.'s work, pharmacists participated on rounds, remained in the ICU for consultation and were on call [27]. In Lee et al.'s research, where a significant increase in medication errors was noted in PI, data collection in the pharmacist phase involved the ICU intervention pharmacist screening medication [28]. This use of the intervention pharmacist, who would have had increased knowledge about patients, could have skewed results to signify an increase in medication error rate. Lee et al. sought to examine the effect of PI in reducing medication errors. Yet, it is clear that a pharmacist's presence in ICU increased detection of medication errors compared with the control phase, and that many of these errors, termed averted errors, were addressed with an alternative treatment plan. This apparent discrepancy between impact in reducing medication errors and making recommendations for alternative plans was not considered by the authors. Langebrake & Hilgarth's research was difficult to evaluate as no details were given about total opportunities for medication errors [26].
In the use of SSCD, four out of six studies showed decreased medication error rates [30, 32–34], while one study demonstrated an increase [31] and the remaining study showed no change [29]. Those studies demonstrating reduced medication errors had longer intervention periods, thereby enabling opportunities for problems relating to the SSCD intervention to be resolved. For instance, in DeYoung et al. ‘s work [30], the study period included 1 month before and 4 months after implementation of bar-code medication administration, which resulted in 775 administrations in 47 patients before implementation and 690 administrations in 45 patients after implementation. While a 56% relative risk reduction was achieved, this benefit was largely attributable to incorrect-time errors. Evans et al. [32] recruited 1136 patients over a 2 year pre-intervention period and 545 patients during a 1 year intervention period. Similarly, Evans and colleagues [33] had 8901 patients in a 2 year pre-intervention period and 4483 patients in a 1 year intervention period. In addition, Fraenkel et al. [34] had a 23 month pre-intervention phase and 25 month post-intervention phase in their study. They also administered a nursing survey before and after implementation to identify potential barriers in provision of patient care. Conversely, in Evans et al.'s work [31], which demonstrated an increased medication error rate, data were collected over a 3 week period when handwritten prescriptions were evaluated and 1 month after introduction of computer assisted prescribing. The intervention phase was conducted over a 3 week period. Duplicated orders and discontinued prescriptions remaining on charts were common occurrences in the intervention period, leading to increased medication error rates. In Chapuis et al.'s work [29], where reduced medication errors occurred but the risk ratio showed no significant change (RR = 0.72, 95% CI 0.53, 1.00), there was a 2 month observation period before implementation and a 2 month observation period after implementation of the system. Only small numbers of patients were recruited in the control and study units.
Limitations were associated with the systematic review. Only papers published in English were examined. Due to extensive heterogeneity between studies, it was not possible to undertake a meta-analysis.
Conclusion
This systematic review has demonstrated the lack of conclusive data to support the use of interventions to reduce medication error rates. These findings demonstrate implications for policy makers and clinicians in adopting resource intensive process and technologies, which offer little evidence to support their efficacy. Future researchers should gather data on single and multi-faceted interventions using high quality research designs.
Acknowledgments
Work undertaken for this paper has been supported by an Australian Research Council, Discovery Project Grant (DP1093038).
Competing Interests
There are no competing interests to declare.
REFERENCES
- 1.Camiré E, Moyen E, Stelfox HT. Medication errors in critical care: risk factors, prevention and disclosure. Can Med Assoc J. 2009;180:936–43. doi: 10.1503/cmaj.080869. [DOI] [PMC free article] [PubMed] [Google Scholar]
- 2.Moyen E, Camiré E, Stelfox HT. Clinical review: medication errors in critical care. Crit Care. 2008;12:208. doi: 10.1186/cc6813. [DOI] [PMC free article] [PubMed] [Google Scholar]
- 3.Kiekkas P, Karga M, Lemonidou C, Aretha D, Karanikolas M. Medication errors in critically ill adults: a review of direct observation evidence. Am J Crit Care. 2011;20:36–44. doi: 10.4037/ajcc2011331. [DOI] [PubMed] [Google Scholar]
- 4.Wilmer A, Louie K, Dodek P, Wong H, Ayas N. Incidence of medication errors and adverse drug events in the ICU: a systematic review. Qual Saf Health Care. 2010;19:e7. doi: 10.1136/qshc.2008.030783. Epub 2010 Jul 29. [DOI] [PubMed] [Google Scholar]
- 5.Kane-Gill SL, Jacobi J, Rothschild JM. Adverse drug events in intensive care units: risk factors, impact, and the role of team care. Crit Care Med. 2010;38(Suppl.):S83–S9. doi: 10.1097/CCM.0b013e3181dd8364. [DOI] [PubMed] [Google Scholar]
- 6.National Coordinating Council for Medication Error Reporting and Prevention. About medication errors. 2011. Available at http://www.nccmerp.org/aboutMedErrors.html (last accessed 10 May 2011)
- 7.Oxford Centre for Evidence-Based Medicine, Levels of Evidence Working Group. Levels of evidence. 2011. Available at http://www.cebm.net/index.aspx?o=5653 (last accessed 20 January 2012)
- 8.Des Jarlais DC, Lyles C, Crepaz N Group atT. Improving the reporting quality of nonrandomized evaluations of behavioral and public health interventions: the TREND Statement. Am J Public Health. 2004;94:361–6. doi: 10.2105/ajph.94.3.361. [DOI] [PMC free article] [PubMed] [Google Scholar]
- 9.Schulz KF, Altman DG, Moher D for the CONSORT Group. CONSORT 2010 Statement: updated guidelines for reporting parallel group randomized trials. Open Med. 2010;4:60–8. [PMC free article] [PubMed] [Google Scholar]
- 10.Simera I, Moher D, Hoey J, Schulz KF, Altman DG. A catalogue of reporting guidelines for health research. Eur J Clin Invest. 2010;40:35–53. doi: 10.1111/j.1365-2362.2009.02234.x. [DOI] [PubMed] [Google Scholar]
- 11.Ali J, Barrow L, Vuylsteke A. The impact of computerised physician order entry on prescribing practices in a cardiothoracic intensive care unit. Anaesthesia. 2010;65:119–23. doi: 10.1111/j.1365-2044.2009.06134.x. [DOI] [PubMed] [Google Scholar]
- 12.Bradley V, Steltenkamp C, Hite K. Evaluation of reported medication errors before and after implementation of computerized practitioner order entry. J Healthc Inf Manag. 2006;20:46–53. [PubMed] [Google Scholar]
- 13.Colpaert K, Claus B, Somers A, Vandewoude K, Robays H, Decruyenaere J. Impact of computerized physician order entry on medication prescription errors in the intensive care unit: a controlled cross-sectional trial. Crit Care. 2006;10:R21. doi: 10.1186/cc3983. [DOI] [PMC free article] [PubMed] [Google Scholar]
- 14.Shulman R, Singer M, Goldstone J, Bellingan G. Medication errors: a prospective cohort study of hand-written and computerised physician order entry in the intensive care unit. Crit Care. 2005;9:R516–R21. doi: 10.1186/cc3793. [DOI] [PMC free article] [PubMed] [Google Scholar]
- 15.Weant KA, Cook AM, Armitstead JA. Medication-error reporting and pharmacy resident experience during implementation of computerized prescriber order entry. Am J Health Syst Pharm. 2007;64:526–30. doi: 10.2146/ajhp060001. [DOI] [PubMed] [Google Scholar]
- 16.Landrigan CP, Rothschild JM, Cronin JW, Kaushal R, Burdick E, Katz JT, Lilly CM, Stone PH, Lockley SW, Bates DW, Czeisler CA. Effect of reducing interns’ work hours on serious medical errors in intensive care units. N Engl J Med. 2004;351:1838–48. doi: 10.1056/NEJMoa041406. [DOI] [PubMed] [Google Scholar]
- 17.Nuckols TK, Bower AG, Paddock SM, Hilborne LH, Wallace P, Rothschild JM, Griffin A, Fairbanks RJ, Carlson B, Panzer RJ, Brook RH. Programmable infusion pumps in ICUs: an analysis of corresponding adverse drug events. J Gen Intern Med. 2008;23(Suppl.):41–5. doi: 10.1007/s11606-007-0414-y. [DOI] [PMC free article] [PubMed] [Google Scholar]
- 18.Rothschild JM, Keohane CA, Cook EF, Orav EJ, Burdick E, Thompson S, Hayes J, Bates DW. A controlled trial of smart infusion pumps to improve medication safety in critically ill patients. Crit Care Med. 2005;33:533–40. doi: 10.1097/01.ccm.0000155912.73313.cd. [DOI] [PubMed] [Google Scholar]
- 19.Ford DG, Seybert AL, Smithburger PL, Kobulinsky LR, Samosky JT, Kane-Gill SL. Impact of simulation-based learning on medication error rates in critically ill patients. Intensive Care Med. 2010;36:1526–31. doi: 10.1007/s00134-010-1860-2. [DOI] [PubMed] [Google Scholar]
- 20.Thomas A, Boxall E, Laha S, Day A, Grundy D. An educational and audit tool to reduce prescribing error in intensive care. Qual Saf Health Care. 2008;17:360–3. doi: 10.1136/qshc.2007.023242. [DOI] [PubMed] [Google Scholar]
- 21.Pronovost P, Weast B, Schwarz M, Wyskiel RM, Prow D, Milanovich SN, Berenholtz S, Dorman T, Lipsett P. Medication reconciliation: a practical tool to reduce the risk of medication errors. J Crit Care. 2003;19:201–5. doi: 10.1016/j.jcrc.2003.10.001. [DOI] [PubMed] [Google Scholar]
- 22.Bertsche T, Mayer Y, Stahl R, Hoppe-Tichy T, Encke J, Haefeli WE. Prevention of intravenous drug incompatibilities in an intensive care unit. Am J Health Syst Pharm. 2008;65:1834–40. doi: 10.2146/ajhp070633. [DOI] [PubMed] [Google Scholar]
- 23.McMullin J, Cook D, Griffith L, McDonald E, Clarke F, Guyatt G, Gibson J, Crowther M. Minimizing errors of omission: behavioural reenforcement of heparin to avert venous emboli: the BEHAVE study. Crit Care Med. 2006;34:694–9. doi: 10.1097/01.CCM.0000201886.84135.CB. [DOI] [PubMed] [Google Scholar]
- 24.Wasserfallen J-B, Butschi A-J, Muff P, Biollaz J, Schaller M-D, Pannatier A, Revelly J-P, Chiolero R. Format of medical order sheet improves security of antibiotics prescription: the experience of an intensive care unit. Crit Care Med. 2004;32:655–9. doi: 10.1097/01.ccm.0000114835.97789.ab. [DOI] [PubMed] [Google Scholar]
- 25.Klopotowska JE, Kuiper R, van Kan HJ, de Pont AC, Dijkgraaf MG, Lie-A-Huen L, Vroom MB, Smorenburg SM. On-ward participation of a hospital pharmacist in a Dutch intensive care unit reduces prescribing errors and related patient harm: an intervention study. Crit Care. 2010;14:R174. doi: 10.1186/cc9278. [DOI] [PMC free article] [PubMed] [Google Scholar]
- 26.Langebrake C, Hilgarth H. Clinical pharmacists' interventions in a German University Hospital. Pharm World Sci. 2010;32:194–9. doi: 10.1007/s11096-010-9367-z. [DOI] [PubMed] [Google Scholar]
- 27.Leape LL, Cullen DJ, Clapp MD, Burdick E, Demonaco HJ, Erickson JI, Bates DW. Pharmacist participation on physician rounds and adverse drug events in the intensive care unit. JAMA. 1999;282:267–70. doi: 10.1001/jama.282.3.267. [DOI] [PubMed] [Google Scholar]
- 28.Lee AJ, Chiao TB, Lam JT, Khan S, Boro MS. Improving medication safety in the ICU: the pharmacist's role. Hosp Pharm. 2007;42:337–44. [Google Scholar]
- 29.Chapuis C, Roustit M, Gaelle B, Schwebel C, Timsit J-F, Allenet B, Bosson J-L, Bedouch P. Automated drug dispensing system reduces medication errors in an intensive care setting. Crit Care Med. 2010;38:1–7. doi: 10.1097/CCM.0b013e3181f8569b. [DOI] [PubMed] [Google Scholar]
- 30.DeYoung JL, Vanderkooi ME, Barletta JF. Effect of bar-code-assisted medication administration on medication error rates in an adult medical intensive care unit. Am J Health Syst Pharm. 2009;66:1110–5. doi: 10.2146/ajhp080355. [DOI] [PubMed] [Google Scholar]
- 31.Evans K, Benham S, Garrard C. A comparison of handwritten and computer-assisted prescriptions in an intensive care unit. Crit Care. 1998;2:73–8. doi: 10.1186/cc129. [DOI] [PMC free article] [PubMed] [Google Scholar]
- 32.Evans RS, Pestotnik SL, Classen DC, Clemmer TP, Weaver LK, Orme JF, Lloyd JF, Burke JP. A computer-assisted management program for antibiotics and other antiinfective agents. N Engl J Med. 1998;338:232–8. doi: 10.1056/NEJM199801223380406. [DOI] [PubMed] [Google Scholar]
- 33.Evans RS, Pestotnik SL, Classen DC, Burke JP. Evaluation of a computer-assisted antibiotic-dose monitor. Ann Pharmacother. 1999;33:1026–31. doi: 10.1345/aph.18391. [DOI] [PubMed] [Google Scholar]
- 34.Fraenkel DJ, Cowie M, Daley P. Quality benefits of an intensive care clinical information system. Crit Care Med. 2003;31:120–5. doi: 10.1097/00003246-200301000-00019. [DOI] [PubMed] [Google Scholar]