

Abstract
AIMS
Cyclophosphamide, the precursor to the active 4-hydroxycyclophosphamide, is used in active glomerulonephritis despite limited pharmacokinetics data. The pharmacokinetics of cyclophosphamide and 4-hydroxycyclophosphamide were evaluated. The influence of laboratory and pharmacogenomic covariates on pharmacokinetics was evaluated as a secondary aim.
METHODS
Glomerulonephritis patients (n = 23) participated in a pharmacokinetic evaluation. Blood was serially collected and assayed for cyclophosphamide and 4-hydroxycyclophosphamide by LC/MS methods. Kidney function, serum albumin and polymorphisms in drug metabolism or transport genes were evaluated. Analyses included non-compartmental pharmacokinetics and parametric and non-parametric statistics.
RESULTS
The mean area under the plasma concentration–time curve (AUC(0,∞)) data were 110 100 ± 42 900 ng ml−1 h and 5388 ± 2841 ng ml−1 h for cyclophosphamide and 4-hydroxycyclophosphamide, respectively. The mean metabolic ratio was 0.06 ± 0.04. A statistically significant relationship was found between increased serum albumin and increased half-life (0.584, P = 0.007, 95% CI 0.176, 0.820) and a borderline relationship with AUC(0,∞) (0.402, P = 0.079, 95% CI –0.064, 0.724) for 4-hydroxycyclophosphamide. Covariate relationships that trended toward significance for cyclophosphamide included decreased serum albumin and increased elimination rate constant (–0.427, P = 0.061, 95% CI 0.738, 0.034), increased urinary protein excretion and increased AUC(0,∞) (–0.392, P = 0.064, 95% CI –0.699 to 0.037), decreased Cmax (0.367, P = 0.085, 95% CI –0.067, 0.684) and decreased plasma clearance (–0.392, P = 0.064, 95% CI –0.699, 0.037). CYP2B6*9 variants vs. wildtype were found to have decreased elimination rate constant (P = 0.0005, 95% CI 0.033, 0.103), increased Vd (P = 0.0271, 95% CI −57.5, −4.2) and decreased Cmax (P = 0.0176, 95% CI 0.696, 6179) for cyclophosphamide. ABCB1 C3435T variants had a borderline decrease in cyclophosphamide elimination rate constant (P = 0.0858; 95% CI –0.005, 0.102).
CONCLUSIONS
Pharmacokinetics of cyclophosphamide and 4-hydroxycyclophosphamide in patients with lupus nephritis and small vessel vasculitis are similar. Clinical and pharmacogenetic covariates alter disposition of cyclophosphamide and 4-hydroxycyclophosphamide. Clinical findings of worsened glomerulonephritis lead to increased exposure to cyclophosphamide vs. the active 4-hydroxycyclophosphamide, which could have relevance in terms of clinical efficacy. The CYP2B6*9 and ABCB1 C3435T polymorphisms alter the pharmacokinetics of cyclophosphamide and 4-hydroxycyclophosphamide in glomerulonephritis.
Keywords: 4-hydroxycylophosphamide, cyclophosphamide, glomerulonephritis, lupus nephritis, pharmacogenomics, pharmacokinetics
WHAT IS ALREADY KNOWN ABOUT THIS SUBJECT
The pharmacokinetics of cyclophosphamide and 4-hydroxycyclophosphamide in cancer patients have been well described. The current study was conducted to document the pharmacokinetics of cyclophosphamide and 4-hydroxycyclophosphamide in patients with glomerulonephritis. The study was necessary due to the numerous clinical abnormalities that are present in glomerulonephritis (altered glomerular filtration rate, proteinuria, hypoalbuminaemia) which can alter the disposition of drugs.
WHAT THIS STUDY ADDS
This study documents the differences in pharmacokinetics of cyclophosphamide and 4-hydroxycyclophosphamide in glomerulonephritis vs. the cancer population. The current results demonstrate that clinical and pharmacogenetic covariates can both alter the disposition of cyclophosphamide and 4-hydroxycyclophosphamide in glomerulonephritis.
Introduction
Cyclophosphamide is an alkylating agent used in the treatment of breast, ovarian and lung carcinomas and to treat glomerulonephritides resulting from systemic lupus erythematosus (SLE) and small vessel vasculits (SVV) [1–5]. The later application is off-label use in the USA. Cyclophosphamide undergoes biotransformation by cytochrome P450 (CYP450) enzymes to a series of metabolites including the important pharmacologically active moiety, 4-hydroxycyclophosphamide [6–8]. The CYP450s CYP2B6, CYP2C9, CYP3A4 and, possibly, CYP2C9 are relevant in the formation of 4-hydroxycyclophosphamide from cyclophosphamide. 4-hydroxycyclophosphamide undergoes a spontaneous reaction to the phosphoramide mustard [N,N-bis-2-(2-chloroethyl) phosphorodiamidic acid] to alkylate guanidine residues in DNA [9, 10].
The pharmacokinetics of cyclophosphamide and 4-hydroxycyclophosphamide are important determinants of therapeutic responses in the treatments of various cancers, with greater exposure to 4-hydroxycyclophosphamide leading to better outcomes but with increased toxicity risks [11, 12]. In patients with glomerulonephritis, cyclophosphamide treatment-related outcomes are highly variable. This could be due to factors that may alter exposure to 4-hydroxycyclophosphamide including patient genetic background, drug interactions or physiologic changes related to nephritis, e.g. urinary protein excretion and/or decreased serum albumin. Inferior efficacy to cyclophosphamide-based treatments based on race has been reported in steroid resistant nephrotic syndrome and SLE nephritis [13–16]. The metabolism of cyclophosphamide can be altered based on concomitant medications. Induction can occur with glucocorticoids, ondansetron, rifampicin and phenobarbital and autoinduction can occur with cyclophosphamide itself [17–19]. However, induction of metabolism may be beneficial secondary to increased formation of 4-hydroxycyclophosphamide. Finally, glomerulonephritis-associated changes in kidney function and plasma proteins may alter the disposition of cyclophosphamide and exposure to 4-hydroxycyclophosphamide.
Since cyclophosphamide treatment-related outcomes are variable in patients with glomerulonephritis, studies to evaluate its pharmacokinetics are urgently needed. These studies lay the groundwork for subsequent assessments of the relationship between pharmacokinetics and outcomes and ultimately towards development of clinical guidelines defining exposure targets for 4-hydroxycyclophosphamide. The primary objective of this study was to describe the pharmacokinetics of cyclophosphamide and 4-hydroxycyclophosphamide in patients with glomerulonephritis secondary to SLE nephritis and SVV. Secondary objectives were to explore the influence of covariates of race, gender, concomitant medications, genetic variability and clinical parameters on the pharmacokinetics of cyclophosphamide and 4-hydroxycyclophosphamide.
Methods
Patients
Patients with biopsy confirmed SLE or SVV nephritis and prescribed monthly intravenous cyclophosphamide were evaluated for enrolment. Female patients were required to have a negative urine pregnancy test. All patients were required to have an absolute neutrophil count of >3.0 × 10⁹ l−1 and haemoglobin of at least 10 mg dl–1. Concomitant therapy with other medications was allowed and recorded.
Enrolled subjects were admitted to the General Clinical Research Unit (GCRC) to participate in a 24 h pharmacokinetic analysis of cyclophosphamide and 4-hydroxycyclophosphamide. Patients were fasting at study initiation and fed a special diet throughout the study. The diet avoided food items including cruciferous vegetables, spinach, garlic, grapefruit, char-grilled meats, and smoked meats that can influence the activity of CYP450 drug metabolizing enzymes [20]. Clinical parameters measured or calculated at the time of the study were serum creatinine, estimated creatinine clearance (eCLcr), urinary protein to creatinine excretion ratio (UP : Cr) and serum albumin [21]. The study and consent form were approved by the Biomedical Institutional Review Board.
Pharmacokinetic study
Blood samples for cyclophosphamide and 4-hydroxycyclophosphamide determination were collected at the beginning of the infusion and at 0.5, 1, 2, 3, 4, 6, 8, 12, 18 and 24 h after commencement. The collection tubes were prepared by filling 7.0 ml EDTA blood tubes with 4 ml of a derivatizing agent, phenylhydrazine hydrochloride (Fisher Scientific, Pittsburgh, PA). Briefly, bulk phenylhydrazine solution was prepared as 4.0% (w/v) phenylhydrazine hydrochloride in 0.1 m sodium citrate buffer adjusted to pH 6.0 with 0.5 m NaOH. Aliquots (4 ml) were transferred to lightly capped 7.0 ml plastic vacutainer tubes and placed in a vacuum chamber (20 inches (50.8 cm) Hg for 5–12 min). The tubes were stored at −80°C until thawed for use. During the pharmacokinetic study, 3 ml of whole blood was collected into the prepared vacutainer tubes, inverted to complete mixing, kept on ice at 4°C and centrifuged at 3000 rev min–1 (2100 g) for 5 min (Beckman CS-6R centrifuge).
Chemicals and reagents
Chemicals including methanol, acetonitrile, glacial acetic acid, sodium hydroxide, sodium citrate and cyclophosphamide were obtained from Fisher Scientific (Pittsburgh, PA). The 4-hydroperoxycyclophosphamide and d4-cyclophosphamide were obtained from NIOMECH at the Institute for Innovation Transfer at the University of Bielefeld (Bielefeld, Germany). p-chlorowarfarin (Coumachlor) was purchased from Sigma-Aldrich (St Louis, MO).
Sample processing and assays
4-hydroxycyclophosphamide
The sample processing and assay procedures for 4-hydroxycyclophosphamide were modified from a previously published method [22]. To start, 1 ml of sample was centrifuged and extracted using Bond Elute SPE columns (C-18, 200 mg, Varian, Lake Forest, CA). Next, 10 µl of the internal standard, p-chlorowarfarin (20 µm) and 175 µl of eluate were transfered to HPLC-autosampler vials. All processed samples were analyzed immediately.
Sample analysis involved a Shimadzu solvent delivery system (Columbia, MD) and a Leap HTC Pal autosampler (Carrboro, NC) connected to an Applied Biosystems API 3000 triple quadrupole mass spectrometer (Foster City, CA) with a TurboIonSpray source. Tuning, operation, peak integration and data analysis were performed in negative ion mode using multiple reaction monitoring (Analyst software v.1.4.1, Applied Biosystems). Reverse phase separation (aqueous phase was 1.0 mm ammonium chloride, 10 mm ammonium acetate, pH 8.5 and organic mobile phase was 100% methanol) was accomplished using a Synergi Max-RP 30 × 2 mm column with a 4 µ particle size (Phenomenex, Torrence, CA). Analysis required a 5 µl injection and a solvent flow of 0.75 ml min−1. Total run time, including equilibration, was 6 min per injection. Calibration curves, from 6.2 to 2771 ng ml−1 (0.166 to 10 µm) were constructed as peak area ratios of derivatized 4-hydroxycyclophosphamide (401.0→401.0, parent-to-parent transition) and p-chlorowarfarin (341.2→160.9) found in spiked phenylhydrazine-derivitized EDTA plasma stock. All standards were prepared and analyzed in duplicate and were back-calculated to within 15% of nominal.
Cyclophosphamide
The sample processing and assay procedures for cyclophosphamide were modified from a previously published method [23]. Briefly, aliquots (100 µl) of either EDTA plasma stock (Valley Biomedical, Winchester, VA) spiked with cyclophosphamide for standard curves or patient plasma had 10 µl of d4-cyclophosphamide (0.25 mg ml−1 in methanol) added as the internal standard. Following protein precipitation [300 µl methanol : acetonitrile (1:1)], 50 µl of supernatant was transferred to HPLC-autosampler vials.
Sample analysis involved the identical instrumentation as described above for 4-hydroxycyclophosphamide. Tuning, operation, peak integration and data analysis were performed in positive ion mode using multiple reaction monitoring (Analyst software v.1.4.1, Applied Biosystems). Reverse phase separation (aqueous phase 1 mm ammonium hydroxide, pH 10, organic phase 100% acetonitrile) was accomplished using a Synergi Fusion-RP 30 × 2 mm column with a 4 µ particle size (Phenomenex, Torrence, CA). Analysis required a 3 µl injection and a solvent flow of 0.75 ml min−1. Total run time, including equilibration, was 3 min per injection. Calibrators were prepared from a phenylhydrazine-derivatized plasma stock containing 8313 mg ml−1 (30 µm) 4-hydroxycyclophosphamide and cyclophosphamide concentrations ranging from 0 to 40 000 ng ml−1. A derivatized stock was used for the standard curve preparation in order to mirror the plasma samples from patients. Calibration curves were constructed as peak area ratios of CTX (261.0→140.0) and d4-CTX (265.0→144.0). All standards were prepared and analyzed in duplicate and were back-calculated to within 15% of nominal.
Pharmacokinetic analysis
Non-compartmental pharmacokinetic analysis of cyclophosphamide and 4-hydroxycyclophosphamide was conducted using WinNonlin v.4.1 (Pharsight, Mountain View CA) for AUC determination using the linear up-log down approach. The following parameters were reported: terminal elimination rate constant (λz), terminal half-life (t1/2), maximum concentration (Cmax), time to maximum concentration (tmax), AUC from time zero to infinity (AUC(0,∞)), plasma clearance (CL), volume of distribution (Vz), estimated volume of distribution at steady-state (Vss) and mean residence time (MRT). A bioactivation (metabolic) ratio was calculated as the ratio of 4-hydroxycyclophosphamide AUC : cyclophosphamide AUC.
Genotyping assessments
A 5 ml whole blood sample was collected (EDTA vacutainer) and genomic DNA was isolated using a Flexigene Qiagen kit (Qiagen, Inc., Valencia, CA, USA). Genotyping was conducted for single nucleotide polymorphisms (SNPs) in CYP450 genes (CYP3A4, CYP2B6, and CYP2C9) as the proteins of these genes are relevant for metabolism of cyclophosphamide to 4-hydroxycyclophosphamide [6–8]. Additionally, SNPs in MDR1/ABCB1, the gene responsible for the multidrug resistance protein (P-glycoprotein) were evaluated secondary to the role of P-glycoprotein in the disposition of glucocorticoids and numerous chemotherapeutic agents. Genotyping assays for CYP2B6*5 C1459T (c30634242), CYP2B6*9 G516T (c22275631) and ABCB1/MDR1 C1236T (c75866621) were available from Applied Biosystems, Foster City, CA. Genotyping for ABCB1/MDR1 C3435T, CYP3A4*1b A-392G and CYP2B6*4 A785G was conducted using custom assays manufactured by Applied Biosystems, Foster City, CA. Allelic discrimination was assessed using 5 µl of TaqMan Universal PCR Master Mix, No AmpErase UNG(2X) (Applied Biosystems), 0.25 µl (40X assay) or 0.5 µl (20X assay), 1–20 ng genomic DNA for a reaction volume of 10 µl. The reactions were cycled with an initial denaturation of 95°C for 10 min followed by 50 cycles of 92°C for 15 s, and then 60°C for 1.5 min on an Applied Biosystems 7900 Taqman PCR instrument. Prior to conducting the allelic discrimination reactions, a subset of samples was sequenced using primers for the targeted single nucleotide polymorphisms in CYP3A4*1b (A-392G)[5-TTACATCTGTGTGAGGAGTTTGGTG-3(forward), 5-GAGTCCAAGGGTTCTGGGTTCT-3(reverse)], CYP2B6*9 G516T[5-CTCTCGGTCTGCCCATCTATAAAC-3(forward), 5-CTGATTCTTCACATGTCTGCGTTT-3(reverse)], CYP2B6*4 A785G[5-AAAAGTATGAGAAAGACAAATAAACAGGCT-3(forward), 5-CTTTCTTTCCTTCCTCATGTTCTCTC-3(reverse)], CYP2B6*5 C1459T[5-GGCCCCAGAAGACATCGAT-3(forward), 4-TTGCAATGTGACCTCAGACAACT-3(reverse)], ABCB1/MDR1C3435T[5-GAGCCCATCCTGTTTGACTG-3(forward), 5-GCATGTATGTTGGCCTCCTT-3(reverse)] and ABCB1/MDR1C1236T[5-GAAGAGTGGGCACAAACCAGATA-3(forward), 5-CATCCCCTCTGTGGGGTCATA-3(reverse)] from Integrated DNA Technologies, Inc. to serve as positive controls for the allelic discrimination assays.
Pyrosequencing assays were performed at the National Institute of Environmental Health Sciences (NIEHS) in Research Triangle Park, NC to determine the presence of the CYP2C9*2 (Arg144Cys) C430T and CYP2C9*3 (Ile359Leu) A1075C alleles as described previously [24]. Pyrosequencing was performed using a PSQTM96MA System (Biotage, Uppsala, Sweden) and allelic determination was assessed using the PMQTM96MA System Softwarere V.2.02.
All genotyping results were coded as 0 (wildtype/wildtype), 1 (heterozygote) or 2 (variant/variant) for subsequent analyses.
Statistical analysis
Descriptive analyses (mean values and SDs) were applied to the pharmacokinetic and laboratory parameters and demographics. The observed genotype frequencies for each locus were used in a chi-square test procedure for evaluating Hardy–Weinberg equilibrium. t-tests or non-parametric equivalent (Mann–Whitney U-test) were used to assess for differences in demographics, laboratory values, and pharmacokinetic parameters between SVV and SLE groups. Relationships between continuous pharmacokinetic variables for both cyclophosphamide (λz, Cmax, AUC(0,∞), CL, Vz, Vss), 4-hydroxycyclophosphamide (λz, Cmax, AUC(0,∞)), metabolic ratio, and laboratory parameters (eCLcr, UP : Cr, serum albumin) were assessed by Spearman rank correlation coefficients. Linear regression was applied to significant Spearman correlations. Differences between the pharmacokinetics by race, gender or laboratory parameters were assessed by Wilcoxon two sample test. In order to explore the effects of any prescribed medications on pharmacokinetics, mean differences in cyclophosphamide and hydroxycyclophosphamide AUC(0,∞) values were compared between (i) prednisone-treated and untreated, (ii) CYP2C9 inhibitor-treated and untreated and (iii) CYP3A4 inducer-treated and untreated using t-tests or the Mann–Whitney test, as appropriate. Differences in mean pharmacokinetic parameters between the CYP and ABCB1/MDR1 genotype groups (coded as 0, 1, or 2) were compared using generalized linear model analyses. The generalized linear model also controlled for race and cyclophosphamide dose. P values <0.05 were considered significant. Statistics were performed using SAS Statistical Software, V.9.2 (SAS Institute, Inc., Cary, NC).
Results
Study population
The study consisted of SVV (n = 7) and SLE (n = 16) patients who participated in pharmacokinetic evaluations of cyclophosphamide and 4-hydroxycyclophosphamide (Table 1). All patients had received monthly i.v. cyclophosphamide prior to study participation. The i.v. cyclophosphamide (Baxter Healthcare Corporation, New Providence, NJ) dosages (mean ± SD) were dependent on body surface area: average dose 1.5 ± 0.5 g or 0.8 ± 0.2 g m−2 (range 0.8–2.5 g). The patients were 40 ± 15 years of age, weighed 93 ± 29 kg and had body surface areas of 2.0 ± 0.3 m2. The population included 19 females and 4 males; 74% were non-Caucasian (15 African-American, 1 Hispanic, 1 other). At the time of cyclophosphamide administration, the patients had mild to moderate kidney disease: serum creatinine 1.2 ± 0.6 mg dl–1, UP : Cr of 1.4 ± 1.8, eCLcr 94 ± 39 ml min−1 1.73 m–2, and serum albumin 3.5 ± 0.7 g dl–1. There were no significant differences noted for demographics or laboratory parameters between disease groups, with the exception of race. Not surprisingly, more non-Caucasian patients were found in the SLE nephritis as compared with SVV group (95% CI 1.169, 12.205, P = 0.045). Eighty-three percent (n = 19) of patients were receiving chronic treatment with glucocorticoids, with a daily prednisone dose of 28 ± 20 mg (mean ± SD). All patients received a pre-cyclophosphamide anti-emetic regimen of dexamethasone and ondansetron. Medication lists were reviewed for potential inducers and inhibitors of CYP2B6, CYP2C9 and CYP3A4 [25]. One patient received the CYP2C9/CYP3A4 inhibitor amiodarone. Three additional patients received vitamin D, which is a potential inducer of CYP3A4 and possibly other CYPs. Two patients received sulfamethoxazole, a CYP2C9 inhibitor. These numbers of patients were too small to perform statistical analyses.
Table 1.
Patient descriptors
| All patients (n = 23) | Small vessel vasculitis (n = 7) | Lupus nephritis (n = 16) | |
|---|---|---|---|
| Gender (%) | |||
| Male | 4 (17%) | 2 (29%) | 2 (13%) |
| Female | 19 (83%) | 5 (71%) | 14 (87%) |
| Race (%) | |||
| Caucasian | 6 (26%) | 4 (57%) | 2 (13%) |
| African-American | 15 (65%) | 1 (14%) | 14 (87%) |
| Other | 2 (9%) | 2 (29%) | 0 (0%) |
| Age (years) | 40 ± 15 | 47 ± 20 | 36 ± 11 |
| Serum albumin (g dl−1) | 3.5 ± 0.7 | 3.6 ± 0.8 | 3.4 ± 0.7 |
| UP : Cr | 1.4 ± 1.8 | 0.8 ± 0.7 | 1.7 ± 2.1 |
| Creatinine clearance (ml min−1) | 94 ± 39 | 88 ± 29 | 97 ± 43 |
| Cyclophosphamide dose (mg m−2) | 0.8 ± 0.2 | 0.7 ± 0.2 | 0.8 ± 0.2 |
| Prescribed prednisone therapy (%) | 19 (83%) | 6 (86%) | 13 (81%) |
| Prescribed CYP450 inducers (%) | 3 (13%) | 0 (0%) | 3 (19%) |
| Prescribed CYP450 inhibitors (%) | 3 (13%) | 2 (29%) | 1 (7%) |
Data represented as mean ± SD. CYP450, cytochrome P450 drug metabolizing enzyme; UP : Cr, urinary protein to creatinine excretion ratio.
Pharmacokinetics of cyclophosphamide and 4-hydroxycyclophosphamide
Average i.v. cyclophosphamide doses of 0.7 ± 0.2 g m−2 and 0.8 ± 0.2 g m−2 were administered to SVV and SLE patients, respectively. Plasma concentration vs. time profiles for cyclophosphamide and 4-hydroxycyclophosphamide in all 23 patients are shown in Figure 1. The mean (± SD) pharmacokinetic parameters for the study populations of SVV and SLE patients are presented in Table 2. Of note, it shows dose-normalized (to a 1 g dose) and non-dose normalized Cmax and AUC for cyclophosphamide.
Figure 1.
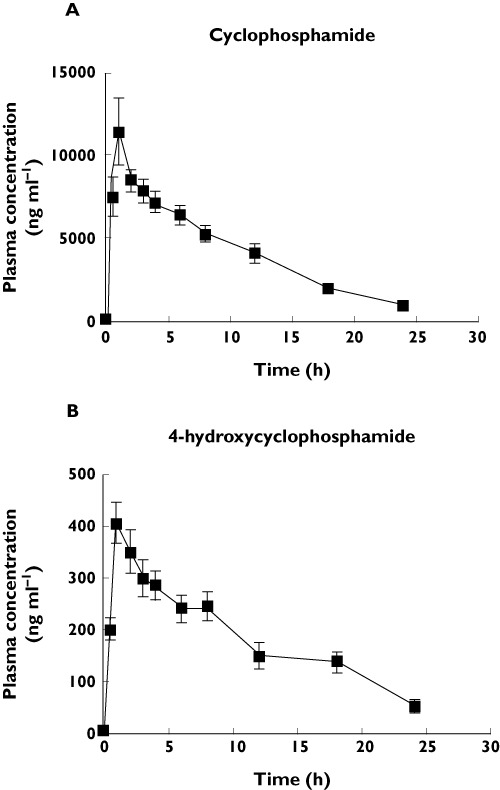
Plasma concentration (ng ml−1) vs. time (h) profile for (A) cyclophosphamide and (B) 4-hydroxycyclophosphamide in 23 patients with glomerulonephritis secondary to lupus nephritis and small vessel vasculitis. Error bars represent mean ± SD
Table 2.
Cyclophosphamide and 4-Hydroxycyclophosphamide pharmacokinetics
| All patients (n = 23) | Small vessel vasculitis (n = 7) | Lupus nephritis (n = 16) | |
|---|---|---|---|
| Cyclophosphamide | |||
| λz (h−1) | 0.13 ± 0.06 | 0.13 ± 0.05 | 0.13 ± 0.06 |
| tmax (h) | 1.7 ± 1.3 | 1.4 ± 0.9 | 1.8 ± 1.4 |
| Cmax (ng ml−1) | 12 210 ± 10 300 | 11 670 ± 8 650 | 12 400 ± 11 200 |
| DN Cmax (ng ml−1) | 7 793 ± 5 268 | 8 231 ± 3 835 | 7 601 ± 5 890 |
| Vz (l 70 kg−1) | 102 ± 33 | 97 ± 33 | 104 ± 35 |
| Vss (l 70 kg−1) | 111 ± 31 | 109 ± 39 | 112 ± 28 |
| CL (l h−1 70 kg−1) | 12.0 ± 4.7 | 12.7 ± 6.1 | 11.7 ± 4.1 |
| AUC(0,∞) (ng ml−1 h ) | 110 100 ± 42 900 | 104 700 ± 55 200 | 112 500 ± 38 300 |
| DN AUC(0,∞) (ng ml−1 h ) | 74 000 ± 26 100 | 77 800 ± 34 100 | 72 300 ± 23 000 |
| MRT (h) | 10.2 ± 4.3 | 9.3 ± 3.2 | 10.6 ± 4.8 |
| 4-hydroxycyclophosphamide | |||
| λz (h−1) | 0.13 ± 0.11 | 0.10 ± 0.02 | 0.14 ± 0.13 |
| tmax (h) | 2.1 ± 2.5 | 3.3 ± 4.0 | 1.5 ± 1.3 |
| Cmax (ng ml−1) | 436 ± 214 | 333 ± 98 | 481 ± 238 |
| AUC(0,∞) (ng ml−1 h) | 5 388 ± 2 841 | 4 330 ± 2 302 | 5 850 ± 2 995 |
| MRT (h) | 13.7 ± 6.9 | 11.6 ± 1.4 | 14.6 ± 8.1 |
| Metabolic ratio % | 5.6 ± 3.7 | 5.2 ± 3.6 | 5.7 ± 3.9 |
Data represented as mean ± SD. AUC(0,∞), area under the plasma concentration time curve from time zero to infinity; Cmax, maximum concentration in plasma; CL, systemic clearance; DN, dose normalized to 1 g dose; MRT, mean residence time; tmax, time to maximum concentration in plasma; Vss, estimated volume of distribution at steady-state; Vz, volume of distribution based on the terminal concentration phase.
The dose-normalized Cmax was 7793 ± 5268 ng ml−1 for cyclophosphamide and occurred at 1.7 ± 1.3 h and the dose-normalized AUC(0,∞) was 74 000 ± 26 100 ng ml−1 h. For 4-hydroxycyclophosphamide, the Cmax was 436 ± 214 ng ml−1 and occurred at 2.1 ± 2.5 h and the AUC(0,∞) was 5388 ± 2841 ng l−1 h. The plasma CL and Vz for cyclophosphamide were adjusted to a 70 kg patient to eliminate differences secondary to body weight. Plasma CL of cyclophosphamide was 12.0 ± 4.7 l h−1 70 kg–1 and Vz was 102 ± 33 l 70 kg–1. The t1/2 of cyclophosphamide was 6.6 ± 3.3 h and the apparent t1/2 of hydroxycyclophosphamide was 8.6 ± 5.8 h. Pharmacokinetics parameters for cyclophosphamide and 4-hydroxycyclophosphamide were similar between the SLE and SVV groups.
Genetic and clinical covariates and pharmacokinetics
The frequencies of assessed genotypes (Table 3) were all in Hardy–Weinberg equilibrium. There were no differences found in the frequencies of any of the tested genetic variants between the SLE nephritis and SVV patient groups. Comparisons between the mean pharmacokinetic parameters in the homozygous wildtype group vs. either the heterozygote or homozygous variant groups were assessed. The comparisons with heterozygous vs. homozygous variant groups were dependent on the numbers of patients available per group. We required at least five patients per group for any meaningful statistical analysis. Homozygous wildtypes for CYP2B6*9 G516T had an increased λz (0.160 ± 0.057 h−1vs. 0.093 ± 0.032 h−1, 95% CI 0.033, 0.103, P = 0.0005) for cyclophosphamide vs. variants (Figure 2A). Cyclophosphamide Vz was reduced in homozygous wildtypes (86.9 ± 34.0 l kg−1vs. 118 ± 25.4 l kg−1, 95% CI −57.5, −4.2,P = 0.0271) (Figure 2B). Cyclophosphamide dose-normalized Cmax was 1.6-fold greater in homozygous wildtypes (9437 ± 6864 ng ml−1vs. 6000 ± 1566 ng ml−1, 95% CI 696, 6179, P = 0.0176) vs. variants (Figure 2C). For the ABCB1/MDR1 C3435T polymorphism, there was a trend for cyclophosphamide λz to be greater in homozygous wildtypes (0.143 ± 0.082 h−1) vs. variants (0.094 ± 0.027 h−1, 95% CI –0.005, 0.102, P = 0.0858). Additionally, a trend was demonstrated for greater 4-hydroxycyclophosphamide Cmax in wildtypes (511 ± 231 ng ml−1) compared with variants (396 ± 201 ng ml−1, 95% CI −77.2, 308.0, P = 0.0433). When controlling separately for race or cyclophosphamide dose, the significant differences in pharmacokinetic parameters described above based on genotype were maintained. Additionally, homozygous wildtypes for CYP2B6*9 G516T had reduced λzs for 4-hydroxycyclophosphamide (6.8 ± 1.7 h−1) as compared with variants (10.4 ± 8.0 h−1, 95% CI −8.3, 0.031, P = 0.0556), when controlling for dose. Graphical displays of metabolic ratios by haplotype are provided in Figure 3. Haplotype data were not analyzed by statistics since some haplotype groups had few patients. Due to the low frequency of the CYP2C9 variants, pharmacokinetic differences between CYP2C9*2 and CYP2C9*3 were not assessed [26]. There were no differences in pharmacokinetic variables detected in patients according to CYP3A4*1b and ABCB1 C1236T variant status.
Table 3.
Allelic frequency distributions
| Frequency | |
|---|---|
| CYP3A4*1b A-392G (n = 46) | |
| A | 0.63 |
| G | 0.37 |
| CYP2B6*5 C1459T (n = 46) | |
| C | 0.85 |
| T | 0.15 |
| CYP2B6*9 G516T (n = 46) | |
| G | 0.74 |
| T | 0.26 |
| CYP2B6*4 A785G (n = 46) | |
| A | 0.96 |
| G | 0.04 |
| CYP2C9*2 C430T (n = 24) | |
| C | 1.0 |
| T | 0.0 |
| CYP2C9*3 A1075C (n = 24) | |
| A | 1.0 |
| C | 0.0 |
| ABCB1/MDR1 C1236T (n = 46) | |
| C | 0.70 |
| T | 0.30 |
| ABCB1/MDR1 C3435T (n = 46) | |
| C | 0.63 |
| T | 0.37 |
CYP, cytochrome P450 gene; MDR1, multidrug resistance gene.
Figure 2.
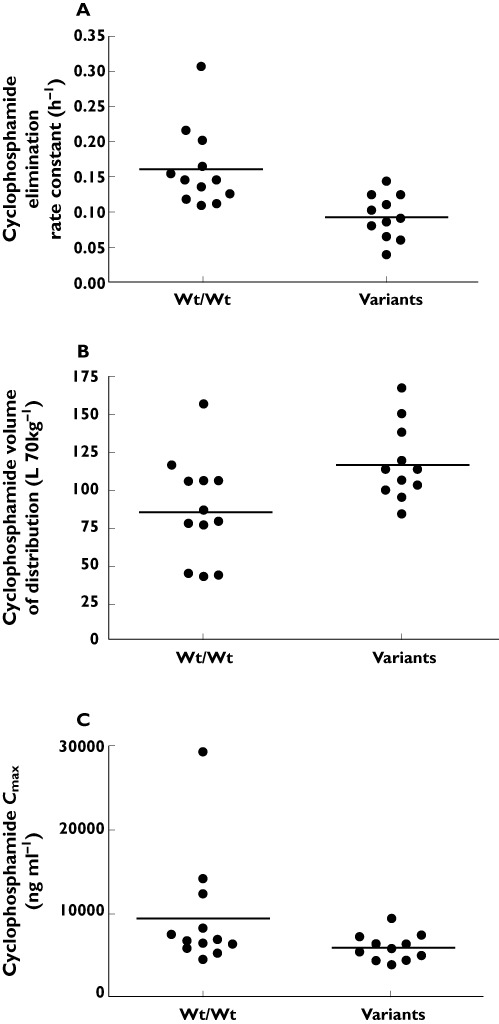
The differences in (A) cyclophosphamide elimination rate constant (P = 0.0005), (B) volume of distribution (P = 0.0271) and (C) dose-normalized Cmax (P = 0.0176) according to the homozygous wildtype grouping vs. presence of variant grouping in the CYP2B6*9 G516T single nucleotide polymorphism
Figure 3.
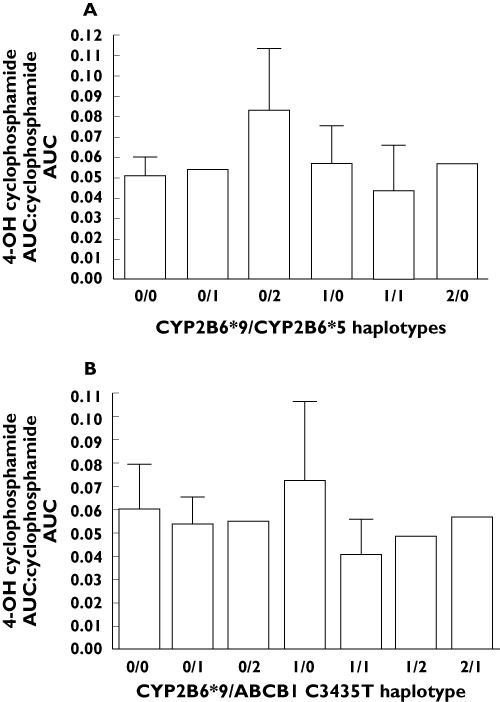
Graphical displays of metabolic ratios in patients according to haplotypes. (A) The CYP2B6*9/CYP2B6*5 haplotypes vs. corresponding metabolic ratio (4-hydroxycyclophosphamide AUC : cyclophosphamide AUC) are graphically represented. (B) The CYP2B6*9/ABCB1 C3435T haplotypes vs. corresponding metabolic ratio are provided. For each graph, 0 = wildtype/wildtype, 1 = heterozygous, 2 = variant/variant
Spearman correlation coefficients were used to determine the influence of continuous clinical and demographic covariates on cyclophosphamide and 4-hydroxycyclophosphamide pharmacokinetics. A strong correlation was found between the apparent t1/2 of 4-hydroxycyclophosphamide and serum albumin (0.584, 95% CI 0.176, 0.820, P = 0.007). Figure 4 represents the results of linear regression analysis of the relationship between 4-hydroxycyclophosphamide and serum albumin. Greater systemic exposure to 4-hydroxycyclophosphamide was found in patients with serum albumin concentrations near normal values (0.402, 95% CI –0.064, 0.724, P = 0. 079). Correlations of borderline statistical significance (0.05 < P < 0.1) were found for cyclophosphamide pharmacokinetics: λz and serum albumin (–0.427, 95% CI –0.738, 0.034, P = 0.061), Cmax and UP : Cr (0.367, 95% CI –0.067, 0.684, P = 0.085) and plasma CL and UP : Cr (–0.392, 95% CI –0.699, 0.037, P = 0.064). These former relationships suggest decreased cyclophosphamide clearance and less exposure to 4-hydroxycyclophosphamide in patients with increased urinary protein excretion. No significant relationships between the clinical laboratory parameters and metabolic ratio were demonstrated. Neither cyclophosphamide nor 4-hydroxycyclophosphamide pharmacokinetics varied by race or gender. Similarly, no difference in cyclophosphamide or 4-hydroxycyclophosphamide exposure was found between CYP450 inducer treated and untreated patients. The mean AUC(0,∞) values for cyclophosphamide and 4-hydroxycyclophosphamide appeared to be similar in prednisone treated vs. untreated patients. Statistical comparisons were, however, limited secondary to the small numbers of patients who did not receive prednisone (n = 4) or who were actually receiving CYP450 inducing (n = 3) or inhibiting (n = 3) medications.
Figure 4.
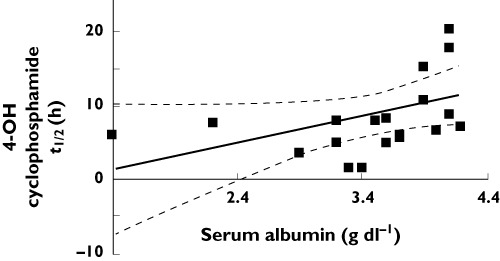
Linear regression results. Linear regression of serum albumin (g dl–1) vs. 4-hydroxycyclophosphamide half-life (t½, h). Regression line defined as: y = 3.566(x) − 3.593; r = 0.4007, P = 0.0799
Discussion
Cyclophosphamide in combination with glucocorticoids has been used extensively in the treatment of glomerulonephritis. Comprehensive pharmacokinetic studies are needed to begin to guide dosing strategies for cyclophosphamide in glomerulonephritis secondary to SLE and/or SVV. These studies are warranted since cyclophosphamide metabolism to the active therapeutic moiety is complicated, and alterations in serum proteins, urine protein excretion and kidney function, all common to glomerulonephritis, may alter its disposition [9, 10, 25, 27]. In this study, we reported the pharmacokinetics of cyclophosphamide and 4-hydroxycyclophosphamide in 16 SLE and seven SVV patients with kidney manifestations. The correlation data for this study suggest that patients with increased UP : Cr have increased cyclophosphamide exposures (AUC(0,∞) and dose-normalized Cmax, and decreased plasma CL. Urinary protein loss may hence be a marker for enhanced exposure to inactive cyclophosphamide as opposed to the pharmacologically active metabolite 4-hydroxycyclophosphamide. Correlations between increased serum albumin and increased t1/2 and AUC(0,∞) were demonstrated for 4-hydroxycyclophosphamide. These results suggest that patients with decreased serum albumin will have less exposure to 4-hydroxycyclophosphamide than patients with more physiologically normal albumin concentrations. The data from the current study imply that clinicians may want to consider the role of increased urinary protein excretion and reduction in serum albumin as factors that can limit exposure to 4-hydroxycyclophosphamide. The correlation data from this study suggest that for every 1 g dl–1 reduction in serum albumin, there is a decrease of 950 ng ml−1 h in 4-hydroxycyclophosphamide AUC. This could have implications for future dosing strategies based on AUC targets that are yet to be defined.
Cyclophosphamide is only 20% bound in plasma so variability in pharmacokinetics secondary to protein binding (e.g. serum albumin) would not be predicted to be relevant and this was consistent with our data [28]. However, cyclophosphamide metabolites are moderately bound to plasma proteins (50 and 67%) and the pharmacokinetic disposition of total metabolite concentrations may be influenced by alterations in plasma protein binding through serum albumin [28, 29]. In support of this assumption, the correlation analyses demonstrated a relationship between decreased serum albumin and decreased 4-hydroxycyclophosphamide t1/2 (P = 0.007) and a trend towards decreased serum albumin and decreased 4-hydroxycyclophosphamide AUC(0,∞) (P = 0.079). These data suggest that decreased serum albumin may enhance the fraction of 4-hydroxycyclophosphamide available for further metabolism and excretion. When we evaluated the mean 4-hydroxycyclophosphamide AUC(0,∞) between patients with reduced serum albumin (<3.5 g dl–1) and patients with values near normal (≥3.5 g dl–1), the previous assumption was supported. The 4-hydroxycyclophosphamide AUC(0,∞) results for patients with serum albumin <3.5 g dl–1 was 1.7-fold lower than in patients with serum albumin ≥3.5 g dl–1 (3165 ± 1787 ng ml−1 h vs. 6524 ± 2425 ng ml−1 h; P = 0.02). The influence of alterations in albumin on unbound 4-hydroxycyclophosphamide was not assessed.
Cyclophosphamide pharmacokinetics in glomerulonephritis patients resulted in higher clearance (7.5 ± 2.4 l h−1 m−2), lower dose normalized AUC (74 000 ± 26 100 ng ml−1 h) and greater Vz (1.5 ± 0.5 l kg−1) than in patients with cancer [30, 31]. Patients with cancer receiving cyclophosphamide doses consistent with our patients (500–1000 mg m−2) had a t1/2 of 4.8–6.2 h, AUC 166 000–443 000 ng ml−1 h (0.6–1.6 mmol l−1 h), CL 2.5–2.7 l h−1 m−2 and Vz 0.41–0.57 l kg−1[30, 31]. These data suggest that exposure to 4-hydroxycyclophosphamide may actually be greater overall in patients with glomerulonephritis as compared with patients with cancer receiving a comparable dose. However, since 4-hydroxycyclophosphamide pharmacokinetics are rarely reported in most cancer publications, this statement may not be applicable across all patients.
A previous study in Caucasians with systemic vasculitis and reduced kidney function (mean eCLcr values 78 ± 61 ml min−1; two patients <10 ml min−1) allows comparison of cyclophosphamide pharmacokinetics with the current study. Cyclophosphamide dose-normalized Cmax (17.3 ± 8.3 mg l−1vs. 7.6 ± 5.2 mg l−1) and dose-normalized AUC(0,∞) (154 ± 62.7 mg l−1 h vs. 72.5 ± 25.6 mg l−1 h) were 2-fold higher in the previous publication [32]. Additionally, the cyclophosphamide plasma CL values (unadjusted for weight) were 2-fold less (120 ± 67 ml min−1vs. 250 ± 77 ml min−1) in the former vs. current study [32]. The 4-hydroxycyclophosphamide Cmax (0.14 ± 0.07 vs. 0.44 ± 0.21 mg l−1) and AUC(0,∞) (1.9 ± 1.1 vs. 5.4 ± 2.8 mg l−1 h) were 2-fold lower in the former study. These results suggest increased formation of metabolite in the current study. A comparison of metabolic ratios (AUC(0,∞) 4-hydroxycyclophosphamide : AUC(0,∞) cyclophosphamide) between studies support enhanced metabolism of cyclophosphamide to 4-hydroxycyclophosphamide in the current study (5.6 ± 3.7% vs. 1.3 ± 0.8%) [32]. Clinically, the two glomerulonephritis study populations are different when considering mean laboratory values for kidney function, serum albumin, and urinary protein excretion. The current study included patients with more limited perturbations in these laboratory parameters. The influence of kidney function on cyclophosphamide pharmacokinetics were previously reported in patient groups with eCLcr values of 25–50 ml min−1, 10–24 ml min−1 and <10 ml min−1 who underwent dialysis [33]. The plasma clearance of cyclophosphamide was significantly reduced as a function of eCLcr. Reduced kidney function as an aetiology for reduced plasma clearance could at least partly explain differences in the plasma CL and AUC results in the previous vasculitis study [32]. However, since only four of the patients in the current study had eCLcr values <60 ml min−1, we could not directly assess the role of different levels of kidney function on cyclophosphamide pharmacokinetics.
The current study is the first to evaluate the influence of genetic variants in drug metabolizing enzymes on a comprehensive panel of cyclophosphamide and 4-hydroxycyclophosphamide pharmacokinetic parameters in patients with glomerulonephritis. Genotypes in CYP2B6*9 G516T and ABCB1/MDR1 C3435T were found to influence cyclophosphamide disposition. Patients with the CYP2B6*9 G516T variant exhibited a decreased λz, higher Vz and decreased dose-normalized Cmax for cyclophosphamide as opposed to patients who were homozygous wildtype. In the present study of patients with the CYP2B6*9 G516T variant, the pharmacokinetic results demonstrate an opposing direction of influence on Vz and λz. This would produce the net result of an increase in t1/2 and a decrease in cyclophosphamide CL. Patients exhibiting the ABCB1/MDR1 variant exhibited a decrease in the λz of cyclophosphamide. The overall influence on systemic CL would be a reduction, assuming that there was no change in the Vz. These findings, while preliminary, suggest a role for CYP2B6*9 and ABCB1 C3435T in cyclophosphamide disposition in glomerulonephritis. As elimination is comprised of metabolism and excretion, a decreased elimination rate for cyclophosphamide could reflect decreased metabolism to 4-hydroxycyclophosphamide. However, we did not detect significant differences in metabolic ratio by genotype. We did not measure urinary excretion of cyclophosphamide, which is reportedly 20% excreted through the kidney as unchanged drug [34]. The role of genotype, serum albumin and urinary protein excretion on cyclophosphamide and 4-hydroxycyclophosphamide disposition requires assessment of the contributing influence of each factor on pharmacokinetics. A study design employing a larger subset of patients exhibiting the clinical and/or genotype variables would be needed to differentiate the role of each variable on disposition.
In addition to the current study, previous publications have reported on the influence of polymorphisms in CYP450 genes on cyclophosphamide pharmacokinetics. In patients with cancer, CYP2B6*4 A785G and CYP2B6*9 G516T polymorphisms were reported to decrease cyclophosphamide CL, while the CYP2B6*5 C1459T polymorphism reportedly increased cyclophosphamide CL [35]. Non-significant, small effect sizes of between 3 to 9% were reported. A recently published study reported CYP2B6 pharmacogenetics in 16 patients with SLE nephritis receiving i.v. cyclophosphamide [36]. The authors reported a lower metabolic ratio in patients with at least one CYP2B6*5 C1459T variant allele. Our data did not demonstrate any relationship between the CYP2B6*5 polymorphism and metabolic ratio. In fact, we included a visual check on metabolic ratio in patients with various haplotypes of CYP2B6*9 and CYP2B6*5. Our data suggested the highest metabolic ratio was demonstrated in patients who were homozygous wildtype for CYP2B6*9 and homozygous variant for CYP2B6*5. This would contradict the findings from the previous study. Of major concern was the unusual method for determination of metabolic ratio in the previous study, which could have contributed to improper conclusions. The authors obtained only one concentration for determination of metabolic ratio instead of comparisons of AUC. The time point (1.25 h) was below the tmax for cyclophosphamide (1.7 ± 1.3 h) and 4-hydroxycyclophosphamide (2.1 ± 2.5 h).
It has previously been suggested that the CYP3A4*1b A-392G polymorphism is associated with increased cyclophosphamide CL, but with a small effect size of 2% [35]. Three previous investigations also reported that CYP2C19*2 and/or CYP2C19*3 genotypes were associated with a reduction in the cyclophosphamide λz, decreased bioactivation, poor kidney outcomes and a reduced risk of premature ovarian failure [36–38]. Although hampered by small numbers of patients, these data suggest that there may be reductions in the extent of 4-hydroxycyclophosphamide formation in carriers of the CYP2C19*2 and/or CYP2C19*3 variants [38]. These data concerning CYP2C19 genotypes are perplexing given that CYP2B6, CYP3A4 and CYP2C9 proteins are most contributory (45%, 25% and 12%, respectively), towards cyclophosphamide metabolism to 4-hydroxycyclophosphamide as compared with CYP2C19 protein [6–8, 39]. The CYP2B6*5/*5 genotype (characterized by the C1459T polymorphism) has been associated with a higher probability of reaching end-stage renal disease in patients with lupus nephritis [38].
In conclusion, the pharmacokinetics of cyclophosphamide and 4-hydroxycyclophosphamide appear to be different in patients with glomerulonephritis as opposed to patients with cancer. Among patients with glomerulonephritis with disease secondary to SLE or SVV, the pharmacokinetics of cyclophosphamide are similar. The present study demonstrated that reductions in serum albumin and increases in urinary protein excretion certainly influence cyclophosphamide pharmacokinetic parameters, resulting in reduced exposure to the 4-hydroxycyclophosphamide metabolite. Patients with glomerulonephritis with the defined genetic polymorphisms CYP2B6*9 and ABCB1 C3435T have reductions in the λz for cyclophosphamide. The current study supports an influence of clinical covariates (urinary protein excretion and serum albumin) and genetic covariates (polymorphisms in CYP2B6 and ABCB1) on cyclophosphamide and 4-hydroxycyclophosphamide disposition. While the data in this manuscript provide pharmacokinetics for cyclophosphamide and 4-hydroxycyclophosphamide, additional research in terms of development of a population PK model is needed in order to assess adequately the dosage refinements in specific patients and/or patient groups. Prospectively designed studies are needed to test dosing strategies in order to clarify the role of clinical covariates and pharmacogenomics on cyclophosphamide pharmacokinetics and related outcomes and to define pharmacokinetic targets for optimizing responsiveness to glomerulonephritis treatment regimens employing cyclophosphamide.
Acknowledgments
This research was funded, in part, by the National Institutes of Health K23DK64888 (MSJ), General Clinical Research Centers program of the Division of Research Resources, National Institutes of Health RR00046 (MSJ), Clinical and Translational Science Award U54RR024383 (MSJ), and American College of Clinical Pharmacy Research Institute's Frontier's Award (MSJ), and by the Intramural Research Program of NIH, National Institute of Environmental Health Sciences under NIH intramural project number Z01ES02124 (JB, JAG).
We gratefully acknowledge the assistance of Thomas Kalhorn, PhD, University of Washington, for his guidance in the conduct of the 4-hydroxycyclophosphamide assay and related procedures.
Competing Interests
There are no competing interests to declare.
REFERENCES
- 1.Bonadonna G, Valagussa P, Moliterni A, Zambetti M, Brambilla C. Adjuvant cyclophosphamide, methotrexate, and fluorouracil in node-positive breast cancer: the results of 20 years of follow-up. N Engl J Med. 1995;332:901–6. doi: 10.1056/NEJM199504063321401. [DOI] [PubMed] [Google Scholar]
- 2.Harper P, Marx GM. Combined modality treatments in early non-small cell lung cancer. Lung Cancer. 2002;38:S23–5. doi: 10.1016/s0169-5002(02)00248-9. [DOI] [PubMed] [Google Scholar]
- 3.Chrystal K, Cheong K, Harper P. Chemotherapy of small cell lung cancer: state of the art. Curr Opin Oncol. 2004;16:136–40. doi: 10.1097/00001622-200403000-00009. [DOI] [PubMed] [Google Scholar]
- 4.Austin HA, III, Klippel JH, Balow JE, le Riche NG, Steinberg AD, Plotz PH, Decker JL. Therapy of lupus nephritis. Controlled trial of prednisone and cytotoxic drugs. N Engl J Med. 1986;314:614–9. doi: 10.1056/NEJM198603063141004. [DOI] [PubMed] [Google Scholar]
- 5.Hogan SL, Nachman PH, Wilkman AS, Jennette JC, Falk RJ. Prognostic markers in patients with antineutrophil cytoplasmic autoantibody-associated microscopic polyangiitis and glomerulonephritis. J Am Soc Nephrol. 1996;7:23–32. doi: 10.1681/ASN.V7123. [DOI] [PubMed] [Google Scholar]
- 6.Chen CS, Lin JT, Goss KA, He YA, Halpert JR, Waxman DJ. Activation of the anticancer prodrugs cyclophosphamide and ifosfamide: identification of cytochrome P450 2B enzymes and site-specific mutants with improved enzyme kinetics. Mol Pharmacol. 2004;65:1278–85. doi: 10.1124/mol.65.5.1278. [DOI] [PubMed] [Google Scholar]
- 7.Huang Z, Roy P, Waxman DJ. Role of human liver microsomal CYP3A4 and CYP2B6 in catalyzing N-dechloroethylation of cyclophosphamide and ifosfamide. Biochem Pharmacol. 2000;59:961–72. doi: 10.1016/s0006-2952(99)00410-4. [DOI] [PubMed] [Google Scholar]
- 8.Roy P, Yu LJ, Crespi CL, Waxman DJ. Development of a substrate-activity based approach to identify the major human liver P-450 catalysts of cyclophosphamide and ifosfamide activation based on cDNA-expressed activities and liver microsomal P-450 profiles. Drug Metab Dispos. 1999;27:655–66. [PubMed] [Google Scholar]
- 9.Colvin OM. An overview of cyclophosphamide development and clinical applications. Curr Pharm Des. 1999;5:555–60. [PubMed] [Google Scholar]
- 10.Pette M, Gold R, Pette DF, Hartung HP, Toyka KV. Mafosfamide induces DNA fragmentation and apoptosis in human T-lymphocytes. A possible mechanism of its immunosuppressive action. Immunopharmacology. 1995;30:59–69. doi: 10.1016/0162-3109(95)00005-e. [DOI] [PubMed] [Google Scholar]
- 11.Ayash LJ, Wright JE, Tretyakov O, Gonin R, Elias A, Wheeler C, Eder JP, Rosowsky A, Antman K, Frei E. Cyclophosphamide pharmacokinetics: correlation with cardiac toxicity and tumor response. J Clin Oncol. 1992;10:995–1000. doi: 10.1200/JCO.1992.10.6.995. [DOI] [PubMed] [Google Scholar]
- 12.Yule SM, Price L, McMahon AD, Pearson AD, Boddy AV. Cyclophosphamide metabolism in children with non-Hodgkin's lymphoma. Clin Cancer Res. 2004;10:455–60. doi: 10.1158/1078-0432.ccr-0844-03. [DOI] [PubMed] [Google Scholar]
- 13.Bhimma R, Adhikari M, Asharam K. Steroid-resistant nephrotic syndrome: the influence of race on cyclophosphamide sensitivity. Pediatr Nephrol. 2006;21:1847–53. doi: 10.1007/s00467-006-0276-2. [DOI] [PubMed] [Google Scholar]
- 14.Adler M, Chambers S, Edwards C, Neild G, Isenberg D. An assessment of renal failure in an SLE cohort with special reference to ethnicity, over a 25-year period. Rheumatology. 2006;45:1144–7. doi: 10.1093/rheumatology/kel039. [DOI] [PubMed] [Google Scholar]
- 15.Dooley MA, Hogan S, Jennette C, Falk R. Cyclophosphamide therapy for lupus nephritis: poor renal survival in black Americans. Glomerular Disease Collaborative Network. Kidney Int. 1997;51:1188–95. doi: 10.1038/ki.1997.162. [DOI] [PubMed] [Google Scholar]
- 16.Appel GB, Contreras G, Dooley MA, Ginzler EM, Isenberg D, Jayne D, Li LS, Mysler E, Sánchez-Guerrero J, Solomons N, Wofsy D Aspreva Lupus Management Study Group. Mycophenolate mofetil versus cyclophosphamide for induction treatment of lupus nephritis. J Am Soc Nephrol. 2009;20:1103–12. doi: 10.1681/ASN.2008101028. [DOI] [PMC free article] [PubMed] [Google Scholar]
- 17.Gilbert CJ, Petros WP, Vredenburgh J, Hussein A, Ross M, Rubin P, Fehdrau R, Cavanaugh C, Berry D, McKinstry C, Peters WP. Pharmacokinetic interaction between ondansetron and cyclophosphamide during high-dose chemotherapy for breast cancer. Cancer Chemother Pharmacol. 1998;42:497–503. doi: 10.1007/s002800050851. [DOI] [PubMed] [Google Scholar]
- 18.Boddy AV, Furtun Y, Sardas S, Sardas O, Idle JR. Individual variation in the activation and inactivation of metabolic pathways of cyclophosphamide. J Natl Cancer Inst. 1992;84:1744–8. doi: 10.1093/jnci/84.22.1744. [DOI] [PubMed] [Google Scholar]
- 19.Chang TK, Yu L, Maurel P, Waxman DJ. Enhanced cyclophosphamide and ifosfamide activation in primary human hepatocyte cultures: response to cytochrome P-450 inducers and autoinduction by oxazaphosphorines. Cancer Res. 1997;57:1946–54. [PubMed] [Google Scholar]
- 20.Fujita K. Food-drug interactions via human cytochrome P450 3A (CYP3A) Drug Metabol Drug Interact. 2004;20:195–217. doi: 10.1515/dmdi.2004.20.4.195. [DOI] [PubMed] [Google Scholar]
- 21.Cockcroft DW, Gault MH. Prediction of creatinine clearance from serum creatinine. Nephron. 1976;16:31–41. doi: 10.1159/000180580. [DOI] [PubMed] [Google Scholar]
- 22.Kalhorn TF, Howald WN, Cole S, Phillips B, Wang J, Slattery JT, McCune JS. Rapid quantitation of cyclophosphamide metabolites in plasma by liquid chromatography-mass spectrometry. J Chromatogr B Analyt Technol Biomed Life Sci. 2006;835:105–13. doi: 10.1016/j.jchromb.2006.03.022. [DOI] [PubMed] [Google Scholar]
- 23.Ekhart C, Gebretensae A, Rosing H, Rodenhuis S, Beijnen JH, Huitema AD. Simultaneous quantification of cyclophosphamide and its active metabolite 4-hydroxycyclophosphamide in human plasma by high-performance liquid chromatography coupled with electrospray ionization tandem mass spectrometry (LC-MS/MS) J Chromatogr B Analyt Technol Biomed Life Sci. 2007;854:345–9. doi: 10.1016/j.jchromb.2007.04.024. [DOI] [PubMed] [Google Scholar]
- 24.Joy MS, Dornbrook-Lavender K, Blaisdell J, Hilliard T, Boyette T, Hu Y, Hogan SL, Candiani C, Falk RJ, Goldstein JA. CYP2C9 genotype and pharmacodynamic responses to losartan in patients with primary and secondary kidney diseases. Eur J Clin Pharmacol. 2009;65:947–53. doi: 10.1007/s00228-009-0707-7. [DOI] [PMC free article] [PubMed] [Google Scholar]
- 25.Indiana University SoM. 2003. Cytochrome P450 Drug Interaction Table.
- 26.Limdi NA, Arnett DK, Goldstein JA, Beasley TM, McGwin G, Adler BK, Acton RT. Influence of CYP2C9 and VKORC1 on warfarin dose, anticoagulation attainment and maintenance among European-Americans and African-Americans. Pharmacogenomics. 2008;9:511–26. doi: 10.2217/14622416.9.5.511. [DOI] [PMC free article] [PubMed] [Google Scholar]
- 27.Zhang J, Tian Q, Yung Chan S, Chuen Li S, Zhou S, Duan W, Zhu YZ. Metabolism and transport of oxazaphosphorines and the clinical implications. Drug Metab Rev. 2005;37:611–703. doi: 10.1080/03602530500364023. [DOI] [PubMed] [Google Scholar]
- 28.Moore MJ. Clinical pharmacokinetics of cyclophosphamide. Clin Pharmacokinet. 1991;20:194–208. doi: 10.2165/00003088-199120030-00002. [DOI] [PubMed] [Google Scholar]
- 29.Richmond R, McMillan TW, Luqmani RA. Optimisation of cyclophosphamide therapy in systemic vasculitis. Clin Pharmacokinet. 1998;34:79–90. doi: 10.2165/00003088-199834010-00004. [DOI] [PubMed] [Google Scholar]
- 30.Bailey H, Mulcahy RT, Tutsch KD, Rozental JM, Alberti D, Arzoomanian RZ, Tombes MB, Trump DL, Wilding G. A phase I study of SR-2508 and cyclophosphamide administered by intravenous injection. Cancer Res. 1991;51:1099–104. [PubMed] [Google Scholar]
- 31.Busse D, Busch FW, Bohnenstengel F, Eichelbaum M, Fischer P, Opalinska J, Schumacher K, Schweizer E, Kroemer HK. Dose escalation of cyclophosphamide in patients with breast cancer: consequences for pharmacokinetics and metabolism. J Clin Oncol. 1997;15:1885–96. doi: 10.1200/JCO.1997.15.5.1885. [DOI] [PubMed] [Google Scholar]
- 32.Belfayol-Pisante L, Guillevin L, Tod M, Fauvelle F. Pharmacokinetics of cyclophosphamide (CP) and 4-OH-CP/aldophosphamide in systemic vasculitis. Fundam Clin Pharmacol. 2000;14:415–21. doi: 10.1111/j.1472-8206.2000.tb00424.x. [DOI] [PubMed] [Google Scholar]
- 33.Haubitz M, Bohnenstengel F, Brunkhorst R, Schwab M, Hofmann U, Busse D. Cyclophosphamide pharmacokinetics and dose requirements in patients with renal insufficiency. Kidney Int. 2002;61:1495–501. doi: 10.1046/j.1523-1755.2002.00279.x. [DOI] [PubMed] [Google Scholar]
- 34.de Jonge ME, Huitema AD, Rodenhuis S, Beijnen JH. Clinical pharmacokinetics of cyclophosphamide. Clin Pharmacokinet. 2005;44:1135–64. doi: 10.2165/00003088-200544110-00003. [DOI] [PubMed] [Google Scholar]
- 35.Ekhart C, Doodeman VD, Rodenhuis S, Smits PH, Beijnen JH, Huitema AD. Influence of polymorphisms of drug metabolizing enzymes (CYP2B6, CYP2C9, CYP2C19, CYP3A4, CYP3A5, GSTA1, GSTP1, ALDH1A1 and ALDH3A1) on the pharmacokinetics of cyclophosphamide and 4-hydroxycyclophosphamide. Pharmacogenet Genomics. 2008;18:515–23. doi: 10.1097/FPC.0b013e3282fc9766. [DOI] [PubMed] [Google Scholar]
- 36.Helsby NA, Hui CY, Goldthorpe MA, Coller JK, Soh MC, Gow PJ, De Zoysa JZ, Tingle MD. The combined impact of CYP2C19 and CYP2B6 pharmacogenetics on cyclophosphamide bioactivation. Br J Clin Pharmacol. 2010;70:844–53. doi: 10.1111/j.1365-2125.2010.03789.x. [DOI] [PMC free article] [PubMed] [Google Scholar]
- 37.Timm R, Kaiser R, Lotsch J, Heider U, Sezer O, Weisz K, Montemurro M, Roots I, Cascorbi I. Association of cyclophosphamide pharmacokinetics to polymorphic cytochrome P450 2C19. Pharmacogenomics J. 2005;5:365–73. doi: 10.1038/sj.tpj.6500330. [DOI] [PubMed] [Google Scholar]
- 38.Takada K, Arefayene M, Desta Z, Yarboro CH, Boumpas DT, Balow JE, Flockhart DA, Illei GG. Cytochrome P450 pharmacogenetics as a predictor of toxicity and clinical response to pulse cyclophosphamide in lupus nephritis. Arthritis Rheum. 2004;50:2202–10. doi: 10.1002/art.20338. [DOI] [PubMed] [Google Scholar]
- 39.Chang TK, Yu L, Goldstein JA, Waxman DJ. Identification of the polymorphically expressed CYP2C19 and the wild-type CYP2C9-ILE359 allele as low-Km catalysts of cyclophosphamide and ifosfamide activation. Pharmacogenetics. 1997;7:211–21. doi: 10.1097/00008571-199706000-00006. [DOI] [PubMed] [Google Scholar]