

Abstract
In the cerebrovascular endothelium, monocarboxylic acid transporter 1 (Mct1) controls blood-brain transport of short chain monocarboxylic and keto acids, including pyruvate and lactate, to support brain energy metabolism. Mct1 function is acutely decreased in rat brain cerebrovascular endothelial cells by β-adrenergic signaling through cyclic adenosine monophosphate (cAMP); however, the mechanism for this acute reduction in transport capacity is unknown. In this report, we demonstrate that cAMP induces the dephosphorylation and internalization of Mct1 from the plasma membrane into caveolae and early endosomes in the RBE4 rat brain cerebrovascular endothelial cell line. Additionally, we provide evidence that Mct1 constitutively cycles through clathrin vesicles and recycling endosomes in a pathway that is not dependent upon cAMP signaling in these cells. Our results are important because they show for the first time the regulated and unregulated vesicular trafficking of Mct1 in cerebrovascular endothelial cells; processes which have significance for better understanding normal brain energy metabolism, and the etiology and potential therapeutic approaches to treating brain diseases, such as stroke, in which lactic acidosis is a key component
Keywords: monocarboxylic acid transporter, cerebrovascular endothelium, blood-brain barrier, caveolae, endocytosis, regulation
1. Introduction
Cerebral lactic acid levels are dependent on the activity of the monocarboxylic acid transporter 1 (Mct1) in the cerebral microvasculature where it is the only facilitator of lactic acid transport across the blood-brain barrier (Daneman et al., 2010; Enerson and Drewes, 2006). Because lactate is a critical energy substrate that has important roles in brain health and disease, understanding Mct1’s physiological regulation in cerebrovascular endothelial cells is of great significance (Gerhart et al., 1997; Smith and Drewes, 2006). This is illustrated by the importance of Mct1 in controlling post-ischemic brain lactate concentrations, a key biochemical indicator of outcomes following stroke and brain injury (Coon et al., 2006; Frykholm et al., 2005; Wagner et al., 1992; Wagner et al., 1998; Wass and Lanier, 1996). Mct1 is further implicated in metabolic coupling between astrocytes and neurons for brain energy metabolism, for regulating tumor growth, inflammatory responses, and for long term memory consolidation (Belanger et al., 2011; Coon et al., 2006; Erlichman et al., 2008; Frykholm et al., 2005; Murray et al., 2005; Sonveaux et al., 2008; Suzuki et al., 2011; Wagner et al., 1992; Wass and Lanier, 1996).
Previously, we have shown that the function of Mct1 is acutely regulated in a cerebrovascular endothelial cell line (RBE4) by a β-adrenergic receptor-mediated pathway that signals through adenylyl cyclase, cyclic adenosine monophosphate (cAMP), and protein kinase A (PKA). The regulation reduced the Michaelis-Menten parameter Vmax, but not KM, consistent with stimulus dependent reduction in the number of functional transporters on the cell surface (Smith and Drewes, 2006). However, the mechanism linking PKA activation to reduced Mct1 function was not elucidated and questions remain regarding Mct1’s plasma membrane location, phosphorylation status and trafficking.
PKA-dependent phosphorylation has been well characterized in having direct effects on the gating and kinetic function of various ion channels and transporters. This type of regulation is often associated with changes in KM; however, this was not observed in our previous studies with RBE4 cells. Alternatively, phosphorylation-dependent vesicular trafficking to and from the plasma membrane also controls the cellular function of a diversity of membrane proteins and transporters, and is a plausible hypothesis for the cAMP-dependent changes in Mct1’s Vmax that we observed (Balklava and Grant, 2005; Ceresa and Schmid, 2000; Dart, 2010; Delom and Fessart, 2011; Melikian, 2004). Included among the transporters that are regulated by vesicular trafficking are monoamine transporters, aquaporins, sodium-hydrogen exchangers, proton pumps, and glucose transporters (Jayanthi et al., 2004; Lau et al., 2009; Lukashova et al., 2011; Moeller et al., 2011; Mortensen et al., 2008; Reinhardt et al., 2002; Yang and Holman, 2006). Vesicular trafficking occurs by different mechanisms including most notably the clathrin and caveolin-dependent vesicular pathways. The caveolar pathway has been particularly well characterized in capillary endothelial cells, where it mediates not only the surface expression of proteins but also transcytosis of molecules between the luminal and abluminal surfaces of the endothelial barrier (Demeule et al., 2000; Frank et al., 2003; Stewart, 2000). Both clathrin- and caveolin-dependent endocytosis deliver protein cargos to various internal compartments including lysosomes, trans-golgi, endoplasmic reticulum, and Rab 11 positive recycling endosomes. The specificity of protein trafficking to these organelles is controlled through processes involving early-sorting endosomes, which are identified by their expression of the small GTPase Rab5, and EEA1. Therefore, we predicted that treatment of RBE4 cells with cAMP analogs would reduce the levels of Mct1 on the plasma membrane and increase Mct1 in clathrin-coated pits or caveoli, early-sorting endosomes, and targeted cytoplasmic organelles. Identification of such a regulatory pathway, and whether direct Mct1 phosphorylation is involved, would greatly increase our understanding of the mechanism linking PKA activation to reduced Mct1 function, and could contribute to the development of new treatments for diseases in which monocarboxylate transport across the cerebral microvasculature is important.
2. Results
2.1. Mct1 phosphorylation and surface expression were reduced by cAMP
Mct1 transport function was reduced by more than 25% when RBE4 cells were treated for 10 minutes with membrane-permeant cAMP analogs (8-BrcAMP or db-cAMP), a result that is consistent with our previous report (Smith and Drewes, 2006; see also figure 6). Because we previously determined that this reduction was PKA-dependent, we assessed whether treatment with cAMP analogs causes a change in Mct1’s phosphorylation status. This was achieved by purifying cellular membrane phosphoproteins from treated and untreated RBE4 cell cultures followed by Western blot analysis and densitometry. Under basal conditions, 41% of the Mct1 signal was present in the phosphoprotein fraction and cAMP analogs reduced the signal to 29% (Figure 1A). This reduction was statistically significant (p<0.05), thus, cAMP signaling via PKA does not directly phosphorylate Mct1, but rather reduces the phosphorylation of Mct1.
Figure 6. cAMP and methyl-β-cyclodextrin (MβCD) inhibited Mct1 but the inhibition was not additive.
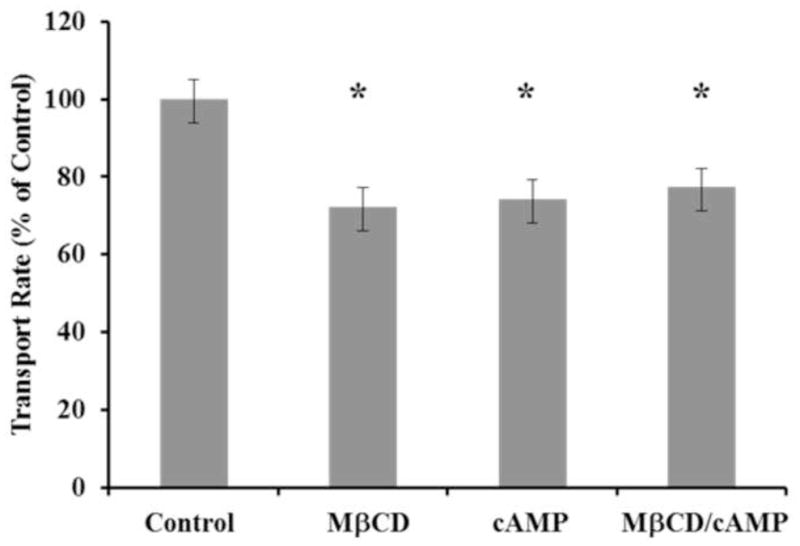
In BCECF pHi imaging experiments, all RBE4 cells responded to 25 mM L-lactate with an immediate cytoplasmic acidification. The acidification for each cell was fit with a linear regression over the first 10 seconds of the response to quantify the transport rate. These rates were normalized to the average control rate and are presented in the upper panel +/− the SEM (n = 177 to 225 cells per group combined from 4 experiments). Statistical significance in comparison to control is indicated by a star and described numerically in the text.
Figure 1. Mct1 phosphorylation and surface expression were reduced by cAMP.

A. Cultured RBE4 cells were treated briefly with 500 μM db-cAMP (cAMP) or with vehicle (control). Total cellular phosphoprotein was fractionated using a phosphoprotein purification column (Qiagen)-both flow through (unphosphoryated) and eluate (phosphoproteins) fractions were collected. MCT1 was detected in equal μg amounts of flow through and eluate proteins by Western blotting and quantified by densitometry using actin as a normalizing control. A representative blot is shown (above). The percentage of phosphorylated Mct1 was determined as elute/(elute + flow through) (below). The mean +/− s.e.m. from 4 independent experiments is shown and values were compared using the student’s t test (* P<0.05). B. The percentage of Mct1 in the plasma membrane was measured following treatment with cAMP analogs. Following treatment, surface proteins were biotinylated, solubilized, and purified on an avidin column. Mct1 was detected by Western blot and quantified by densitometry. A representative blot is shown (above). The amount of plasma membrane Mct1 was normalized to control. As an additional non-trafficking control some cells were treated with cAMP analogs but kept at 4°C for the entire process to halt intracellular trafficking (4°C). Values represent the mean +/− s.e.m. from 4 independent experiments. Differences in means were compared to control using the student’s t test (* P<0.05).
Because the phosphorylation status of membrane proteins can control their surface expression, and because we previously showed that adrenergic signaling through cAMP decreases Mct1’s Michaelis-Menten parameter Vmax (Smith and Drewes, 2006), we next assessed whether the surface expression of Mct1 was affected by elevated cytoplasmic cAMP. This was accomplished by brief treatment of RBE4 cells with cAMP analogs followed by biotinylation of the cell-surface proteins that were isolated on streptavidin columns and subjected to Western blot detection and densitometry. Treatment resulted in a 16% reduction (p<0.02) in the level of Mct1 detected at the cell surface when compared to untreated controls or non-trafficking controls that were treated at 4°C (Figure 1B). Therefore, our combined results (Figure 1) demonstrate that elevated cytoplasmic cAMP causes dephosphorylation of Mct1 and that it becomes internalized from the surface of RBE4 cells. Thus, the cAMP dependent reduction of Vmax is a result of Mct1 dephosphorylation and internalization.
2.2. Colocalization of Mct1 with caveolin-1, but not clathrin, was increased by cAMP
To explore further the pathway for internalization of Mct1, we used dual immunostaining and fluorescence confocal imaging of Mct1 combined with either clathrin or caveolin-1 in RBE4 cells (Figure 2). Widespread expression of Mct1 on the plasma membrane and especially at the leading edge of lamellipodia was observed. Mct1 was also detected across the cytoplasmic face in numerous puncta of different sizes and shapes as well as in a large perinuclear compartment that stained very brightly in most cells (Figures 2 and 3, green). Clathrin immunoreactivity (Figure 2A, red) was present in numerous round puncta that were distributed across the cytoplasmic face and in the large perinuclear compartment. Overlap between Mct1 and clathrin (yellow) was present in a subset of the round puncta that appeared to be very close to the plasma membrane, within the cytoplasm, and especially prominent in the brightly staining large central compartment. As has been reported in brain endothelial, smooth muscle, C6 glioma cells and neurons, treatment of the RBE4 cells with cAMP analogs caused them to round up, often accompanied by retraction of the lamellipodia (Kempski et al., 1987; Hu et al., 2008). However the overall patterns of Mct1, clathrin, and the overlap in staining, was not obviously changed. Pearson’s coefficients of overlap (Rr) were calculated for Z stacks of multiple images and compared by two-sample t-tests. Rr values near 1 indicate the highest level of overlap and range to -1 when repulsion is present (Zinchuk and Grossenbacher-Zinchuk, 2009). Rr was near 0.8 for Mct1-clathrin pairs, consistent with Mct1’s presence in clathrin coated vesicles; however, treatment with cAMP analogs did not appreciably change Rr (Figure 4), suggesting that signaling through cAMP does not regulate Mct1’s association with clathrin coated vesicles.
Figure 2. Colocalization of Mct1 with Caveolin-1, but not Clathrin, was increased by cAMP.

A. Images of RBE4 cells that were dual-immunostained to visualize Mct1 (green) and Clathrin (red) as indicated in the Figure. Merged images showed colocalization (yellow) in scattered puncta across the cytoplasmic face (arrowheads) and in a prominent perinuclear compartment (arrows) that was present in most cells. Treatment with 8Br-cAMP (right hand panels) did not appear to change the pattern of staining. B. Images ofRBE4 cells that were dual-immunostained to visualize Mct1 (green) and Caveolin-1 (red) as indicated in the Figure. Caveolin-1 staining was present in localized areas close to the plasma membrane and in numerous slightly elongated puncta on the cytoplasmic face (arrowheads). Merged images from untreated cells showed less colocalization (yellow) in contrast to the more widespread colocalization observed in cells that were treated with cAMP analogs (arrows in right hand panel). Images are max-z projections of confocal images and the scale bar for merged images is 10 μm.
Figure 3. Colocalization of Mct1 with EEA1 but not Rab11 was increased by cAMP.

A. Images of RBE4 cells that were dual-immunostained to visualize Mct1 (green) and EEA1 (red) as indicated in the Figure. Merged images showed colocalization (yellow) in scattered puncta across the cytoplasmic face (arrowheads) and in a prominent perinuclear compartment (solid arrows) that was present in most cells. Treatment with cAMP analogs appeared to increase colocalization near the plasma membrane of some cells (open arrows). B. Images of RBE4 cells that were dual-immunostained to visualize Mct1 (green) and Rab11 (red) as indicated in the Figure. Merged images showed colocalization (yellow) in scattered puncta (arrowheads) and in a prominent perinuclear compartment (arrows) that was present in most cells and very strongly immunoreactive against Rab11 (a and b). Treatment with 8Br-cAMP (b) did not appear to change the pattern of staining. Images are max-z projections of confocal images and the scale bar for merged images is 10 μm.
Figure 4. Pearson’s Coefficients of Overlap (Rr) for dual immunofluorescence images of untreated control and 8Br-cAMP treated RBE4cells.

In Mct1/clathrin stained cells Rr was 0.82 +/− 0.008 in control images and 0.082 +/− 0.007 in images from treated cells (p = 0.775 showed no significant difference between groups, n.s.). In Mct1/Caveolin-1 stained cells Rr was 0.56 +/− 0.014 in control images and 0.62 +/− 0.016 in images from treated cells (p = 0.01). In Mct1/EEA1 stained cells Rr was 0.74 +/− 0.008 in control images and 0.78 +/− 0.012 in images from treated cells (p = 0.02). In Mct1/Rab11 stained cells Rr was 0.79 +/− 0.01 in control images and 0.77 +/− 0.005 in images from treated cells (p = 0.12, n.s.). For each bar, N = 10 images like those represented in Figures 3–6. Similar results were seen when these experiments were repeated.
Caveolin-1 staining (Figure 2B, red) was present in vastly elongated regions on the plasma membrane, in numerous slightly elongated or round cytoplasmic puncta, and in larger clusters within the cytoplasm. It was largely absent in lammellipodia and the large central compartments that contained Mct1 and clathrin. In control cells, the overlap between Mct1 and caveolin-1 was diffusely localized in scattered cytoplasmic puncta and at the plasma membrane, particularly where some of the cells contacted one another. A cAMP-dependent increase in yellow overlap signal was obvious and widespread within intracellular puncta, cytoplasmic clusters, and in vastly elongated regions on the plasma membrane. The coefficient of overlap, Rr, for Mct1-Caveolin-1 stained cells was in the range of 0.5 and was statistically significantly increased upon treatment with cAMP analogs (Figure 4). Combined, the above results are consistent with a cAMP-dependent increase in endocytosis of Mct1 into caveolae via a clathrin-independent pathway.
2.3. Colocalization of Mct1 with EEA1 but not Rab11 was increased by cAMP
The pathway of cAMP-induced internalization of Mct1 was further explored by confocal imaging of Mct1 with markers for early-endosomes, EEA1 and Rab5, or with a marker for recycling endosomes, Rab11. EEA1 was readily detected in numerous round puncta that were spread across the cytoplasmic face and crowded along the perimeter of the plasma membrane of RBE4 cells (Figure 3A, red). Furthermore, EEA1 was present in the large perinuclear compartments described above (section 2.2). Colocalization between Mct1 and EEA1 was apparent in sparsely distributed puncta in the cytoplasm, near the plasma membrane, and in the large perinuclear compartment (Figure 3A). Supporting the notion of colocalization between Mct1 and EEA1, Rr for these images was near 0.7, and most importantly, a brief exposure to cAMP analogs significantly increased the Rr values for the Mct1-EEA1 pairs (Figure 4). In many cells, the overlap appeared most prominent just adjacent to the plasma membrane (Figure 3A). Similar results were seen with immunostains for Rab5, a different marker of early endosomes; however, the change induced by cAMP did not reach statistical significance, possibly reflecting subtle differences among the endosomal populations identified or labeling efficacy achieved with the different markers (data not shown). Overall, these results are consistent with cAMP-dependent internalization of Mct1 into an EEA1-positive population of early-sorting endosomes.
As described above (sections 2.2 and 2.3), Mct1 staining was very bright in a large and well-defined cytoplasmic region near the nucleus of many RBE4 cells. Clathrin, EEA1, and Rab5, invariably stained strongly in these regions as well; however, the boundaries of the region were broader and more diffuse for these markers than for Mct1. Interestingly, Rab11, a marker of recycling endosomes also strongly labeled these regions with a pattern similar to that seen for EEA1, Rab5 and clathrin (Figure 3B, red). Rab11 staining was also detected in fine puncta at the plasma membrane, and across the cytoplasmic face. In some images the cytoplasmic puncta appeared to form lines that radiated from the central region to the plasma membrane. Overlap between Mct1 and Rab11 was most prominent in the large cytoplasmic regions, and also occurred in finer puncta at the plasma membrane, cytoplasm, and along some of the radial lines. Rr values for this pair were near 0.8; however, treatment with cAMP analogs did not cause an appreciable change in the level of overlap (Figure 4). These results indicate that Mct1 was present in recycling endosomes, but that its presence therein was not regulated by cAMP.
2.4. cAMP reduced the level of caveolin-1 phosphorylation
Because our results suggested that the major pathway for cAMP-dependent internalization of Mct1 from the plasma membrane of RBE4 cells is mediated through caveolae, and because phosphorylation of caveolin-1 changes its functional status, we used Western blotting to see whether phosphorylation of caveolin-1 changed in RBE4 cells after treatment with cAMP analogs. Under non-stimulated conditions caveolin-1 was detected in whole cell lysate from RBE4 cells using an antibody that recognizes the Y14 phosphorylated form of the protein (Figure 5A). Similarly we detected total caveolin-1 in these samples with an antibody that recognizes caveolin-1 independent of its phosphorylation status. Supporting the notion that cAMP leads to a change in caveolin-1 activity, brief cell treatment with cAMP analogs caused a statistically significant reduction in the phospho-caveolin-1 signal (p<0.02). However, the signal generated with the phosphorylation-independent antibody was unchanged. The specificity of the anti-phospho-caveolin-1 antibody and consistency in the loading of sample volumes was shown by the lack of a treatment-dependent change in the signal generated with the control antibody. Thus, cAMP led to a change in the activation status of caveolin-1 consistent with its involvement in the regulation of Mct1.
Figure 5. cAMP reduced the levels of Caveolin-1 phosphorylation and TritonX-100 soluble Mct1.
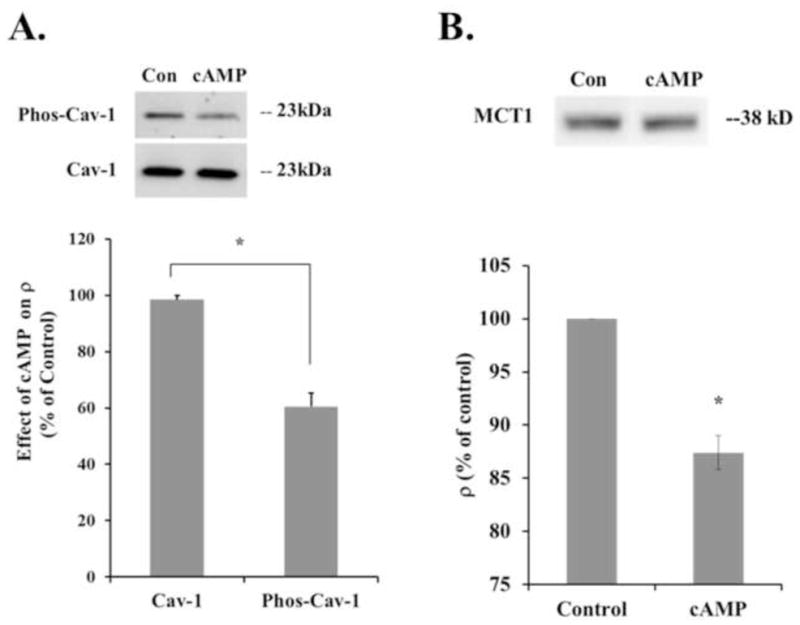
A. CytoplasmiccAMP reduced Caveolin-1 phosphorylation, a single band of 23 kD was detected with antibodies against phosphorylated Caveolin-1 and Caveolin-1 independent of its phosphorylation status. Treatment for 10 minutes with 500 μM 8-BrcAMP significantly reduced the level of phosphorylated Caveolin-1, measured by the density of the band (ρ), by 40 +/− 5% (n = 3 experiments, p = 0.02). The level of total Caveolin-1 that was detected was unchanged. B. Adherent RBE4 cells were incubated in Triton X-100 and the supernatant was probed with an antibody against Mct1 to determine the level of Mct1 protein solubilized by this treatment. Cells that were treated for 10 minutes with 500 μM 8-BrcAMP showed a significant 12.5 +/− 1.6% decrease in Mct1 solubility (n = 3 experiments, p = 0.02).
2.5. cAMP reduced the level of Triton X-100 soluble Mct1
Next, whether cAMP signaling increases the association between Mct1 and caveolae was further investigated by taking advantage of the complete resistance of caveolae, and proteins associated with them, to solubilization in ice cold Triton X-100. Therefore, we extracted cAMP treated and untreated RBE4 cells with ice cold 1% Triton X-100 for 10 minutes and measured the level of Mct1 that was solubilized using Western blot and densitometry. The Triton X-100 solubility of Mct1 was significantly reduced in RBE4 cells that were treated for 10 minutes with 500 μM 8-BrcAMP (Figure 5B). This result is consistent with cAMP causing Mct1 to be internalized into caveolae and supports the findings of our confocal imaging data.
2.6. Methyl-β-cyclodextrin and cAMP inhibited Mct1, but the inhibition was not additive
To evaluate further whether caveolae are involved in the functional regulation of Mct1 by cAMP, we conducted intracellular pHi imaging experiments with BCECF to assess how Mct1 dependent transport of L-lactate was affected by cAMP and the cholesterol-depleting agent methyl-β-cyclodextrin (MβCD). MβCD has been shown to disrupt caveolae in numerous cell types. When RBE4 cells were exposed to 500 μM 8-BrcAMP for 10 minutes the transport rate was inhibited to 74 +/− 11% of control (Figure 6, p < 0.01). Treatment with 5 mg/ml MβCD for 30 minutes also inhibited Mct1 to 72 +/− 5% of control (p < 0.002), and in experiments where MβCD was combined with 8-BrcAMP, Mct1 function was reduced to 77 +/− 5% of control (p < 0.01). Because we have previously shown that Mct1’s transport rates are heavily dependent on pHi, in these experiments we paired the data by the resting pHi to negate pHi dependent effects that treatments or random variability may have produced (Uhernik et al., 2011). Thus, the effects of cAMP and MβCD were similar in magnitude, but not additive, consistent with both agents utilizing the same, caveoli-dependent, mechanism to reduce Mct1 function.
3. Discussion
3.1. Overview of the major results of this paper
Our previous work demonstrated a pathway in which β–adrenergic signaling through adenylyl cyclase, cAMP, and PKA reduces Vmax for Mct1, suggesting a mechanism involving a reduction in the cell surface expression of functional transporters (Smith and Drewes, 2006). In this report we extend that result and show a detailed mechanism in which cAMP signaling causes dephosphorylation of Mct1 and caveolin-1 with an associated internalization of Mct1 from the plasma membrane into caveolae and EEA1 positive early/sorting endosomes. While caveolar pathways are less prominent in brain endothelium as compared to other endothelial cell types, the role of caveolae in regulating Mct1 is not surprising given 1) the prominent role that caveolae are known to play in endothelium in general, and 2) that major components of the β-adrenergic pathway, including β–adrenergic receptors, adenylyl cyclase, and PKA also localize to caveolae where they are thought to form microdomains and focus the signaling pathway spatially and temporally (Gratton et al., 2004; Razani et al., 2002). Additionally, our data indicate that pathways involving clathrin dependent endocytosis and Rab11 positive recycling endosomes may be part of Mct1’s trafficking pattern, but that this is constitutive and unregulated by cAMP. In this work, we chose RBE4 cells as a model for brain endothelial cells to be consistent in extending our previous work (Smith and Drewes 2006). RBE4 cells are a cell line derived by immortalization of rat brain endothelial cells and, therefore, represent an in vitro model useful in brain barrier research. A relatively short sub-culture period and the use of the cells at sub-confluence standardized our model as a more fundamental cellular, rather than barrier, model of brain endothelial cells which helped to avoid confusion associated with controversy surrounding the expression of Mct1 in the three dimensional blood-brain barrier.
3.2. Mechanism for cAMP dependent endocytosis of Mct1 into caveolae
The events in which cAMP leads to the removal of Mct1 from the membrane were consistent with activation of a phosphatase that dephosphorylated Mct1 and caveolin-1 concurrent with entry of Mct1 into caveolae. The identity of the phosphatase remains unknown, although, a number of prominent phosphor-serine,-threonine protein phosphatases and a phosphotyrosine phosphatase are known to be activated by PKA in endothelial cells, including alkaline phosphatase and myosin light chain phosphatase. The latter plays an important role in cytoskeleton remodeling and the breakdown in vascular barrier permeability during disease (Aslam et al., 2010; Beuckmann et al., 1995; Goeckeler and Wysolmerski, 2005). Therefore, PKA-dependent dephosphorylation of Mct1 may be a component of such pathological processes and it will be important to identify the phosphatase in future studies.
In brain, Mct1 is phosphorylated at 11 different serine and threonine residues suggesting that dephosphorylation at one or more of these residues may facilitate its entry into caveolae (Huttlin et al., 2010). Two possible mechanisms are that 1) dephosphorylation increases Mct1’s affinity for caveolae or 2) dephosphorylation decreases Mct1’s affinity for a substrate that restricts its entry into caveolae. Regarding the first possibility, binding of cargo proteins to caveolin-1 facilitates their entry into caveolae; however, Mct1 does not contain one of the known φXXXφ motifs that facilitate direct interactions with caveolin-1, suggesting that this pathway is unlikely. On the other hand, Mct1’s molecular chaperone, CD147, contains an φXXXφ motif and it reportedly facilitates a specific interaction with caveolin-1 (Razani et al., 2002; Tang et al., 2004; Tang and Hemler, 2004). Thus, similar to its known role as the determinant of apical/basolateral sorting of Mct1 in epithelial cells, one of CD147’s functions may be to chaperone Mct1’s entry into caveolae (Castorino et al., 2011). Despite this, Mct1’s interaction with CD147 involves transmembrane domains in the two proteins making regulation by dephosphorylation of Mct1 in a cytoplasmic domain less plausible (Bergersen et al., 2001; Wilson et al., 2002). Considering the second possibility, dephosphorylation of Mct1 may cause it to be released from a factor that otherwise prevents it and CD147 from entering caveolae as a complex. Of the residues known to be phosphorylated in Mct1, S230 in its large intracellular loop, and S476 in the C-terminus, have the correct sequences to be binding motifs for type 4 WW domains, and Y11 in the N terminus is part of a PY domain which is a ligand for a type 1 WW domain. WW domains are analogous to SH3 and SH2 domains and mediate protein-protein interactions that can be regulated through phosphorylation, while PY motifs have been shown to bind to the WW domains of ubiquitin ligases and mediate phosphorylation dependent internalization and protein degradation (Staruschenko et al., 2005). Also, S492 at the extreme C-terminus of Mct1 has the correct sequence to be a PDZ ligand that could facilitate a dephosphorylation dependent release of Mct1 from a protein-protein interaction that otherwise prevents its translocation into caveolae. It is clear that the dynamics of heterodimer formation and its interactions with membranes is complex and requires more detailed analysis.
Finally, our result that cAMP caused dephosphorylation of caveolin-1 at Y14 not only backs-up the idea that cAMP signaling activates a phosphatase in RBE4 cells, but also suggests a complementary role for caveolin-1 dephosphorylation in facilitating Mct1’s entry into caveolae. Phosphorylation of caveolin-1 at Y14 is required for caveolin-1 to bind SH2 or PTB domain-containing proteins, so dephosphorylation at this site may prevent its binding to a protein that blocks interactions with CD147-Mct1 complexes. Release of such a block may allow binding to the scaffolding domain of caveolin-1 to facilitate entry of Mct1-CD147 into caveolae. These possibilities suggest a detailed plan for future work that will show the precise molecular determinants of cAMP dependent internalization of Mct1 into caveolae.
3.3. Intracellular pathways and potential significance of regulated Mct1 trafficking
A second major contribution of this work is showing basic trafficking patterns of Mct1 in brain endothelial cells for the first time. Our results showing a cAMP dependent reduction in Mct1 surface expression and increased colocalization with EEA1 and caveolin-1 demonstrates that the regulatory pathway includes increased trafficking of Mct1 through caveolae to early/sorting endosomes. That the regulation was mimicked by the caveolae disrupting compound MβCD, and the decreased solubility of Mct1 in TritonX-100 following 8Br-cAMP treatment further supported a role for caveolae in the regulatory pathway. On the other hand, the presence of Mct1 in Rab11 positive recycling endosomes and clathrin vesicles was not affected by cAMP in our colocalization analyses, suggesting that clathrin dependent endocytosis into recycling endosomes must be part of a constitutive Mct1 trafficking pathway that is not regulated by cAMP. Supporting this idea, Mct1 contains an YXXφ motif in its C terminus that would facilitate interactions with AP-2 complexes to promote clathrin dependent internalization (Staruschenko et al., 2005). An illustration of the regulated and constituitive pathways of MCT1 trafficking reported here is presented (Figure 7).
Figure 7. Regulation of Mct1 by cAMP-dependent internalization into caveolae and early endosomes, and an unregulated clathrin-dependent recycling pathway.
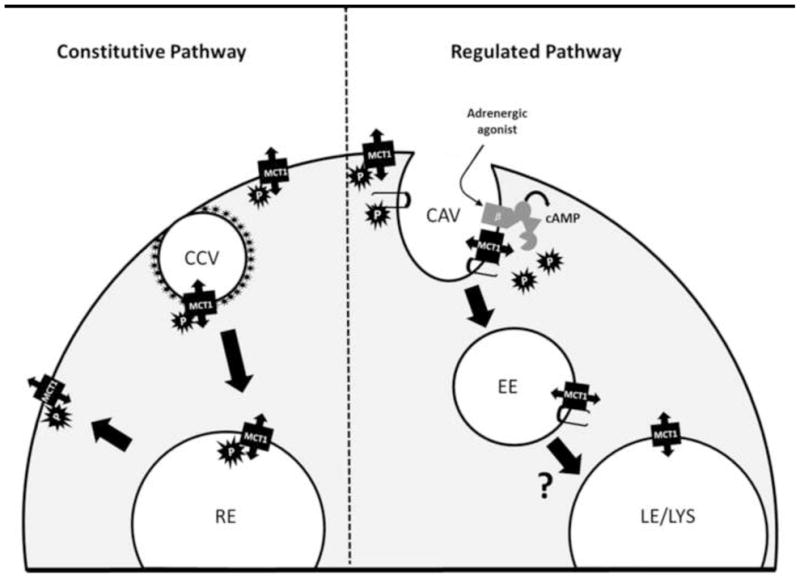
Right side: In the regulated pathway, activation of β-adrenergic receptors leads to cAMP production and activation of a phosphatase which dephosphorylates plasma membrane Mct1, and caveolin-1 (hairpin structures), facilitating an interaction between Mct1 and caveolin-1 to promote internalization of Mct1 into caveolae (CAV) and early endosomes (EE). From here Mct1 could be trafficked to various compartments such as late endosomes and lysosomes (LE/LYS), similar to the protein-kinase dependent trafficking of kainite receptors and aquaporins (Martin and Henley 2004; Sidhaye et al., 2005). Left side: In the constitutive pathway, Mct1 is internalized into clathrin coated vesicles (CCV) where it is trafficked to recycling endosomes (RE) for redistribution on the plasma membrane, however, adrenergic signaling does not affect this trafficking pathway.
Finally, in a number of brain pathologies, lactic acidosis is either causal or a key indicator of brain damage. For example, in ischemic stroke, hyperglycemic stroke, and brain injury, the severity of lactic acidosis is a principle indicator of outcomes (Coon et al., 2006; Frykholm et al., 2005; Schnaberth et al., 1981; Wagner et al., 1992; Wass and Lanier, 1996; Siesjo et al., 1993; Wei et al., 2003; Clausen et al., 2005; DeSalles et al., 1986; Unterberg et al., 2004). MCT1 is ideally positioned in the cerebrovascular endothelial cells of the blood-brain barrier to counter lactic acidosis; however, lactic acid fails to flow readily from brain to blood during stroke and brain injury indicating that Mct1 is an ideal pharmacological target for modulating lactic acidosis in a novel therapeutic approach. Precedence for such a caveolar-based strategy comes from studies in cardiac tissue in which caveolae were targeted to modulate glucose transporter trafficking to improve reperfusion injury (Roth and Patel, 2011). The results presented here are also relevant for cancer because MCT1 controls lactate efflux from tumor cells, a factor that limits hyperplasia, and because CD147-caveolin-1 interactions reduce extracellular matrix remodeling which is necessary for tumor invasion (Carpenter and Halestrap, 1994; Dai et al., 2009; Tang and Hemler, 2004; Weidle et al., 2010). Therefore, the results presented here advance our understanding of the biochemical regulatory mechanism by which cAMP signaling controls MCT1 function in cerebrovascular endothelial cells, and is important for understanding molecular transport processes in the neurovascular unit in both health and disease.
4. Experimental Procedure
4.1. RBE4 Cell Culture
RBE4 cells, a gift from F. Roux, were cultured as previously described (Roux et al., 1994; Roux and Couraud, 2005; Uhernik et al., 2011). Briefly, cells were grown on collagen-coated polystyrene tissue culture dishes or collagen-coated number 1 coverslips in Minimum Essential Medium Alpha and F-10 Nutrient (Ham’s)(1:1) with 10% fetal bovine serum, 1% antibiotic–antimycotic, 0.3 mg/ml geneticin, and 1.0 ng/ml basic fibroblast growth factor. Cells were trypsinized, replated between 3 and 8 hours prior to experimentation, and used at subconfluency.
4.2. Whole-Cell Protein Isolation and Western Blot Detection
Cells were lysed on ice for 45 minutes in pH 8 lysis buffer containing 10 mM Tris-Cl, 5 mM NaCl, 135 mM KCl, 2.5 mM EDTA, 2.5 mM iodoacetamide, 1% Triton X-100, 1 mM phenylmethylsulfonyl fluoride (PMSF), protease inhibitor cocktail (Roche), and phosphatase inhibitor cocktail (Santa Cruz Biotechnology). Lysates were sonicated for 10 minutes at 4°C and centrifuged at 13,000xg for 8 minutes at 4 °C to remove debris and total protein was quantified with a BCA assay (Pierce Thermoscientific). Equivalent masses and volumes of protein were electrophoresed on 10% SDS-PAGE gels electrophoretically transferred to polyvinylidene fluoride membranes. Membranes were blocked in 50 mM Tris-buffered saline (pH = 8.0), 5% non-fat milk, 1% Tween-20, and probed with primary antibodies overnight at 4°C. Primary antibodies were diluted as follows: rabbit anti caveolin-1 (1:1,000; Cell Signaling Technology), phospho-caveolin-1 (1:1,000; Cell Signaling Technology), and chicken anti Mct1 antibody (1:5,000) produced as previously described (Leino et al., 2001). Membranes were washed in blocking buffer and incubated in a goat anti-rabbit IgG-HRP to detect caveolin antibodies, (1:3,000; Santa Cruz Biotechnology) or a rabbit anti chicken IgY-HRP (1:5,000; Pierce Thermoscientific) to detect Mct1 antibodies. Blots were visualized using a Bio-Rad ABC chemiluminescence detection kit and imager.
4.3. Surface Biotinylation and Internalization
Cell surface proteins were biotinylated using reagents as described by the vendor’s instructions (Pierce Thermoscientific; kit #89881) and quantified by immunoblotting. Briefly, RBE4 cell cultures (75cm2 flasks) were exposed for 30 min. at room temperature to Hepes Buffered Saline (HBS) or HBS containing 500 μM db-cAMP. Protein concentration was determined using the Pierce 660nm Protein Assay kit including the Ionic Detergent Compatibility reagent (Pierce Thermoscientific). Proteins were run on SDS-Page gels, transferred to nitrocellulose membranes, blotted with chicken anti Mct1 IgY (1:5000) and mouse anti β-actin (1:10,000; Millipore). The proteins were detected using a secondary antibody consisting of HRP conjugated goat anti mouse IgG (1:10,000); Pierce Thermoscientific) or rabbit anti chicken IgY-HRP (1:5,000; Pierce Thermoscientific) followed by Super Signal West Pico Chemiluminescent substrate (Pierce Thermoscientific). Mct1 and β-actin specific bands were imaged and quantified by spot densitometry using a ccd camera (Alpha Innotech) and related software.
4.4. Mct1 Phosphorylation Assay
RBE4 cell cultures (75 cm2 flasks) were exposed for 30 min. at room temperature to HBS or HBS containing 500 μM db-cAMP followed by a rinse with ice cold HBS. Cells were scraped in 800 μl homogenization buffer (20 mM Tris-Cl pH 7.4, 40 mM NaCl, 1 mM dithiothreitol with Complete Protease Inhibitor Cocktail (Roche), homogenized using a motorized homogenizer, and ultracentrifuged at 50,000 RPM 100,000 x g for 30 min. at 4°C. Membrane pellets were solubilized and phosphoproteins separated using a Phosphoprotein Purification Kit according to the vendor’s instructions (Qiagen). Briefly, solubilized membrane proteins were applied to an agarose column with high affinity for phosphoproteins. Unphosphorylated proteins do not bind and were present in the flow through. Bound phosphoproteins were eluted with high phosphate and high salt buffer. Protein determinations were made using a BCA protein assay (Pierce Thermoscientific). Representative aliquots of the flow through and eluate were subjected to SDS-PAGE gel electrophoresis, Western blotting, and quantitation by densitometry (normalized with actin) as described in section 4.2. The phosphorylated fraction was reported as the percentage of the total Mct1 (see Figure 1 legend).
4.5. Triton X-100 Solubilization Assay
Following treatment, RBE4 cells were lysed in situ on ice for 10 minutes in the lysis buffer described above (section 4.2). The supernatant (soluble fraction) was collected and the remaining insoluble cellular material was scraped from the culture substrate and resuspended in lysis buffer (insoluble fraction). Lysates were sonicated for 10 minutes at 4°C. Equivalent volumes of each sample were mixed with DNase I (Invitrogen) and loaded onto gels for SDS-PAGE as described above (section 4.2).
4.6. Immunofluorescence Staining
RBE4 cells were fixed in 3.7% formalin/PBS for 25 minutes followed by permeabilization with 0.5% Triton X-100 for 2.5 minutes at room temperature. Cells were rinsed with PBS, blocked with 1.5% goat serum, and stained with anti-Mct1 chicken diluted 1:1000 (Millipore) and anti-caveolin-1 rabbit diluted 1:700, anti-clathrin rabbit diluted 1:100, anti-EEA1 rabbit diluted 1:500, or anti-Rab11 rabbit diluted 1:300 primary antibodies (Cell Signaling) followed by detection with Alexafluor 488 diluted 1:125 and Alexafluor 568 diluted 1:75 secondary antibodies (Molecular Probes). Slides were mounted in ProLong® Gold Antifade Reagent (Molecular Probes).
4.7. Laser Scanning Confocal Microscopy and Colocalization Analysis
Images were acquired using an Olympus FV10i laser scanning microscope using a 60x oil immersion objective and internally standardized illumination and detection-sensitivity parameters. Z-slices were acquired at 0.646 μM/slice and Z-stacks spanned the thickness of each specimen. Colocalization analysis was performed using the colocalization function of Olympus Fluoview software version 3.1.
4.8. BCECF-AM Ratiometric pH Imaging
Internal pH measurements in RBE4 cells were made in HEPES-buffered saline (HBS) essentially as described previously (Smith and Drewes, 2006; Uhernik et al., 2011). Briefly, BCECF-AM loaded cells were exposed to 25 mM L-lactate and the initial rate of acidification was fit with a linear regression over the first ten seconds of the response. Image pairs, generated alternately with 440 and 495 nm excitation filters and 530 nm emission filter, were sampled at 60 Hz during the response. Following the response, the lactate-containing HBS was replaced with fresh HBS to allow the cells to recover and a two point calibration was made in nigericin-containing high K+ HBS at pH 7.8 and 6.5. The ratio data was transformed to indicate intracellular pH by linear regression.
4.9. Drugs and Statistics
All drugs were purchased from Sigma-Aldrich. Pearson’s coefficients (Zinchuk and Grossenbacher-Zinchuk, 2009) were compared with a 2 sample t-test. Initial rates of L-lactate dependent acidification were measured in groups of a few hundred individual cells by BCECF imaging and binned by the intracellular pH determined at the start of each experiment in 0.01 increments. Responses from cells in each pH bin were averaged and the averages were paired across treatment groups for analysis using a paired t-test. Western blots were repeated at least 3 times and compared by a t-test.
Highlights.
Decreased MCT1 function by cAMP in brain endothelial cells involving dephosphorylation
cAMP causes internalization of plama membrane MCT1 into caveolae and early endosomes
MCT1 constitutively recycles through clathrin vesicles and recycling endosomes
Acknowledgments
The expert technical assistance of Ms. Mary Sneve is greatly appreciated.
Abbreviations
- Mct1
monocarboxylic acid transporter 1
- 8-BrcAMP
8-bromo-cyclic 3′,5′-adenosine mono phosphate
- cAMP
cyclic 3′,5′-adenosine mono phosphate
- db-cAMP
dibutyryl cyclic 3′,5′-adenosine mono phosphate
- MbCD
methyl-beta-cyclodextrin
- RBE4
rat brain endothelial-4
Footnotes
Publisher's Disclaimer: This is a PDF file of an unedited manuscript that has been accepted for publication. As a service to our customers we are providing this early version of the manuscript. The manuscript will undergo copyediting, typesetting, and review of the resulting proof before it is published in its final citable form. Please note that during the production process errors may be discovered which could affect the content, and all legal disclaimers that apply to the journal pertain.
Contributor Information
Jeffrey P. Smith, Email: jeff.smith@colostate-pueblo.edu.
Amy L. Uhernik, Email: auhernik@hotmail.com.
Lun Li, Email: lilun1204@gmail.com.
Zejian Liu, Email: liux0585@umn.edu.
Lester R. Drewes, Email: ldrewes@d.umn.edu.
References
- Aslam M, Hartel FV, Arshad M, Gunduz D, Abdallah Y, Sauer H, Piper HM, Noll T. cAMP/PKA antagonizes thrombin-induced inactivation of endothelial myosin light chain phosphatase: role of CPI-17. Cardiovascular research. 2010;87:375–84. doi: 10.1093/cvr/cvq065. [DOI] [PubMed] [Google Scholar]
- Balklava Z, Grant BD. The regulation of endocytosis by kinases: cell biology meets genomics. Genome biology. 2005;6:245. doi: 10.1186/gb-2005-6-13-245. [DOI] [PMC free article] [PubMed] [Google Scholar]
- Belanger M, Allaman I, Magistretti PJ. Brain energy metabolism: focus on astrocyte-neuron metabolic cooperation. Cell metabolism. 2011;14:724–38. doi: 10.1016/j.cmet.2011.08.016. [DOI] [PubMed] [Google Scholar]
- Bergersen L, Waerhaug O, Helm J, Thomas M, Laake P, Davies AJ, Wilson MC, Halestrap AP, Ottersen OP. A novel postsynaptic density protein: the monocarboxylate transporter MCT2 is co-localized with delta-glutamate receptors in postsynaptic densities of parallel fiber-Purkinje cell synapses. Experimental brain research. Experimentelle Hirnforschung. Experimentation cerebrale. 2001;136:523–34. doi: 10.1007/s002210000600. [DOI] [PubMed] [Google Scholar]
- Beuckmann C, Hellwig S, Galla HJ. Induction of the blood/brain-barrier-associated enzyme alkaline phosphatase in endothelial cells from cerebral capillaries is mediated via cAMP. European journal of biochemistry / FEBS. 1995;229:641–4. doi: 10.1111/j.1432-1033.1995.tb20508.x. [DOI] [PubMed] [Google Scholar]
- Carpenter L, Halestrap AP. The kinetics, substrate and inhibitor specificity of the lactate transporter of Ehrlich-Lettre tumour cells studied with the intracellular pH indicator BCECF. Biochem J. 1994;304(Pt 3):751–760. doi: 10.1042/bj3040751. [DOI] [PMC free article] [PubMed] [Google Scholar]
- Castorino JJ, Deborde S, Deora A, Schreiner R, Gallagher-Colombo SM, Rodriguez-Boulan E, Philp NJ. Basolateral sorting signals regulating tissue-specific polarity of heteromeric monocarboxylate transporters in epithelia. Traffic. 2011;12:483–98. doi: 10.1111/j.1600-0854.2010.01155.x. [DOI] [PMC free article] [PubMed] [Google Scholar]
- Ceresa BP, Schmid SL. Regulation of signal transduction by endocytosis. Current opinion in cell biology. 2000;12:204–10. doi: 10.1016/s0955-0674(99)00077-0. [DOI] [PubMed] [Google Scholar]
- Clausen T, Khaldi A, Zauner A, Reinert M, Doppenberg E, Menzel M, Soukup J, Alves OL, Bullock MR. Cerebral acid-base homeostasis after severe traumatic brain injury. Journal of neurosurgery. 2005;103:597–607. doi: 10.3171/jns.2005.103.4.0597. [DOI] [PubMed] [Google Scholar]
- Coon AL, Arias-Mendoza F, Colby GP, Cruz-Lobo J, Mocco J, Mack WJ, Komotar RJ, Brown TR, Connolly ES., Jr Correlation of cerebral metabolites with functional outcome in experimental primate stroke using in vivo 1H-magnetic resonance spectroscopy. AJNR. American journal of neuroradiology. 2006;27:1053–8. [PMC free article] [PubMed] [Google Scholar]
- Cornford EM, Hyman S. Localization of brain endothelial luminal and abluminal transporters with immunogold electron microscopy. NeuroRx : the journal of the American Society for Experimental NeuroTherapeutics. 2005;2:27–43. doi: 10.1602/neurorx.2.1.27. [DOI] [PMC free article] [PubMed] [Google Scholar]
- Dai JY, Dou KF, Wang CH, Zhao P, Lau WB, Tao L, Wu YM, Tang J, Jiang JL, Chen ZN. The interaction of HAb18G/CD147 with integrin alpha6beta1 and its implications for the invasion potential of human hepatoma cells. BMC cancer. 2009;9:337. doi: 10.1186/1471-2407-9-337. [DOI] [PMC free article] [PubMed] [Google Scholar]
- Daneman R, Zhou L, Agalliu D, Cahoy JD, Kaushal A, Barres BA. The mouse blood-brain barrier transcriptome: a new resource for understanding the development and function of brain endothelial cells. PloS one. 2010;5:e13741. doi: 10.1371/journal.pone.0013741. [DOI] [PMC free article] [PubMed] [Google Scholar]
- Dart C. Lipid microdomains and the regulation of ion channel function. The Journal of physiology. 2010;588:3169–78. doi: 10.1113/jphysiol.2010.191585. [DOI] [PMC free article] [PubMed] [Google Scholar]
- Delom F, Fessart D. Role of Phosphorylation in the Control of Clathrin-Mediated Internalization of GPCR. International journal of cell biology. 2011;2011:246954. doi: 10.1155/2011/246954. [DOI] [PMC free article] [PubMed] [Google Scholar]
- Demeule M, Jodoin J, Gingras D, Beliveau R. P-glycoprotein is localized in caveolae in resistant cells and in brain capillaries. FEBS letters. 2000;466:219–24. doi: 10.1016/s0014-5793(00)01087-5. [DOI] [PubMed] [Google Scholar]
- DeSalles AA, Kontos HA, Becker DP, Yang MS, Ward JD, Moulton R, Gruemer HD, Lutz H, Maset AL, Jenkins L, et al. Prognostic significance of ventricular CSF lactic acidosis in severe head injury. Journal of neurosurgery. 1986;65:615–24. doi: 10.3171/jns.1986.65.5.0615. [DOI] [PubMed] [Google Scholar]
- Enerson BE, Drewes LR. The rat blood-brain barrier transcriptome. J Cereb Blood Flow Metab. 2006;26:959–73. doi: 10.1038/sj.jcbfm.9600249. [DOI] [PubMed] [Google Scholar]
- Erlichman JS, Hewitt A, Damon TL, Hart M, Kurascz J, Li A, Leiter JC. Inhibition of monocarboxylate transporter 2 in the retrotrapezoid nucleus in rats: a test of the astrocyte-neuron lactate-shuttle hypothesis. The Journal of neuroscience : the official journal of the Society for Neuroscience. 2008;28:4888–96. doi: 10.1523/JNEUROSCI.5430-07.2008. [DOI] [PMC free article] [PubMed] [Google Scholar]
- Frank PG, Woodman SE, Park DS, Lisanti MP. Caveolin, caveolae, and endothelial cell function. Arteriosclerosis, thrombosis, and vascular biology. 2003;23:1161–8. doi: 10.1161/01.ATV.0000070546.16946.3A. [DOI] [PubMed] [Google Scholar]
- Frykholm P, Hillered L, Langstrom B, Persson L, Valtysson J, Enblad P. Relationship between cerebral blood flow and oxygen metabolism, and extracellular glucose and lactate concentrations during middle cerebral artery occlusion and reperfusion: a microdialysis and positron emission tomography study in nonhuman primates. Journal of neurosurgery. 2005;102:1076–84. doi: 10.3171/jns.2005.102.6.1076. [DOI] [PubMed] [Google Scholar]
- Gerhart DZ, Enerson BE, Zhdankina OY, Leino RL, Drewes LR. Expression of monocarboxylate transporter MCT1 by brain endothelium and glia in adult and suckling rats. Am J Physiol. 1997;273:E207–E213. doi: 10.1152/ajpendo.1997.273.1.E207. [DOI] [PubMed] [Google Scholar]
- Goeckeler ZM, Wysolmerski RB. Myosin phosphatase and cofilin mediate cAMP/cAMP-dependent protein kinase-induced decline in endothelial cell isometric tension and myosin II regulatory light chain phosphorylation. The Journal of biological chemistry. 2005;280:33083–95. doi: 10.1074/jbc.M503173200. [DOI] [PubMed] [Google Scholar]
- Gratton JP, Bernatchez P, Sessa WC. Caveolae and caveolins in the cardiovascular system. Circulation research. 2004;94:1408–17. doi: 10.1161/01.RES.0000129178.56294.17. [DOI] [PubMed] [Google Scholar]
- Hu W, Onuma T, Birukawa N, Abe M, Ito E, Chen Z, Urano A. Change of morphology and cytoskeletal protein gene expression during dibutyryl cAMP-induced differentiation in C6 glioma cells. Cell Molecular Neurobiology. 2008;28(4):519–28. doi: 10.1007/s10571-007-9229-y. [DOI] [PubMed] [Google Scholar]
- Huttlin EL, Jedrychowski MP, Elias JE, Goswami T, Rad R, Beausoleil SA, Villen J, Haas W, Sowa ME, Gygi SP. A tissue-specific atlas of mouse protein phosphorylation and expression. Cell. 2010;143:1174–89. doi: 10.1016/j.cell.2010.12.001. [DOI] [PMC free article] [PubMed] [Google Scholar]
- Jayanthi LD, Samuvel DJ, Ramamoorthy S. Regulated internalization and phosphorylation of the native norepinephrine transporter in response to phorbol esters. Evidence for localization in lipid rafts and lipid raft-mediated internalization. The journal of biological chemistry. 2004;279:19315–26. doi: 10.1074/jbc.M311172200. [DOI] [PubMed] [Google Scholar]
- Kempski O, Wroblewska B, Spatz M. Effects of forskolin on growth and morphology of cultured glial and cerebrovascular endothelial and smooth muscle cells. International journal of developmental neuroscince. 1987;5(5–6):435–45. doi: 10.1016/0736-5748(87)90021-9. [DOI] [PubMed] [Google Scholar]
- Lau T, Horschitz S, Bartsch D, Schloss P. Monitoring mouse serotonin transporter internalization in stem cell-derived serotonergic neurons by confocal laser scanning microscopy. Neurochemistry international. 2009;54:271–6. doi: 10.1016/j.neuint.2008.12.004. [DOI] [PubMed] [Google Scholar]
- Leino RL, Gerhart DZ, Duelli R, Enerson BE, Drewes LR. Diet-induced ketosis increases monocarboxylate transporter (MCT1) levels in rat brain. Neurochem Int. 2001;38:519–527. doi: 10.1016/s0197-0186(00)00102-9. [DOI] [PubMed] [Google Scholar]
- Lukashova V, Szabo EZ, Jinadasa T, Mokhov A, Litchfield DW, Orlowski J. CK2 phosphorylation of an acidic Ser/Thr di-isoleucine motif in the Na+/H+ exchanger NHE5 isoform promotes association with beta-arrestin2 and endocytosis. The Journal of biological chemistry. 2011;286:11456–68. doi: 10.1074/jbc.M110.182881. [DOI] [PMC free article] [PubMed] [Google Scholar]
- Martin S, Henley JM. Activity-dependent endocytic sorting of kainate receptors to recycling or degradation pathways. EMBO journal. 2004;23(24):4749–59. doi: 10.1038/sj.emboj.7600483. [DOI] [PMC free article] [PubMed] [Google Scholar]
- Melikian HE. Neurotransmitter transporter trafficking: endocytosis, recycling, and regulation. Pharmacology & therapeutics. 2004;104:17–27. doi: 10.1016/j.pharmthera.2004.07.006. [DOI] [PubMed] [Google Scholar]
- Moeller HB, Olesen ET, Fenton RA. Regulation of the water channel aquaporin-2 by posttranslational modification. American journal of physiology. Renal physiology. 2011;300:F1062–73. doi: 10.1152/ajprenal.00721.2010. [DOI] [PubMed] [Google Scholar]
- Mortensen OV, Larsen MB, Prasad BM, Amara SG. Genetic complementation screen identifies a mitogen-activated protein kinase phosphatase, MKP3, as a regulator of dopamine transporter trafficking. Molecular biology of the cell. 2008;19:2818–29. doi: 10.1091/mbc.E07-09-0980. [DOI] [PMC free article] [PubMed] [Google Scholar]
- Murray CM, Hutchinson R, Bantick JR, Belfield GP, Benjamin AD, Brazma D, Bundick RV, Cook ID, Craggs RI, Edwards S, Evans LR, Harrison R, Holness E, Jackson AP, Jackson CG, Kingston LP, Perry MW, Ross AR, Rugman PA, Sidhu SS, Sullivan M, Taylor-Fishwick DA, Walker PC, Whitehead YM, Wilkinson DJ, Wright A, Donald DK. Monocarboxylate transporter MCT1 is a target for immunosuppression. Nat Chem Biol. 2005;1:371–6. doi: 10.1038/nchembio744. [DOI] [PubMed] [Google Scholar]
- Razani B, Woodman SE, Lisanti MP. Caveolae: from cell biology to animal physiology. Pharmacological reviews. 2002;54:431–67. doi: 10.1124/pr.54.3.431. [DOI] [PubMed] [Google Scholar]
- Reinhardt J, Kosch M, Lerner M, Bertram H, Lemke D, Oberleithner H. Stimulation of protein kinase C pathway mediates endocytosis of human nongastric H+-K+-ATPase, ATP1AL1. American journal of physiology. Renal physiology. 2002;283:F335–43. doi: 10.1152/ajprenal.00226.2001. [DOI] [PubMed] [Google Scholar]
- Roth DM, Patel HH. Role of caveolae in cardiac protection. Pediatric cardiology. 2011;32:329–33. doi: 10.1007/s00246-010-9881-8. [DOI] [PMC free article] [PubMed] [Google Scholar]
- Roux F, Durieu-Trautmann O, Chaverot N, Claire M, Mailly P, Bourre JM, Strosberg AD, Couraud PO. Regulation of gamma-glutamyl transpeptidase and alkaline phosphatase activities in immortalized rat brain microvessel endothelial cells. J Cell Physiol. 1994;159:101–113. doi: 10.1002/jcp.1041590114. [DOI] [PubMed] [Google Scholar]
- Roux F, Couraud PO. Rat brain endothelial cell lines for the study of blood-brain barrier permeability and transport functions. Cellular and molecular neurobiology. 2005;25:41–58. doi: 10.1007/s10571-004-1376-9. [DOI] [PMC free article] [PubMed] [Google Scholar]
- Schnaberth G, Brunner G, Scheiber V. Lactate acidosis in the cerebrospinal fluid as a prognostic parameter of malacic cerebral insult (author’s transl) Wiener klinische Wochenschrift. 1981;93:388–93. [PubMed] [Google Scholar]
- Sidhaye V, Hoffert JD, King LS. cAMP has distinct acute and chronic effects on aquaporin-5 in lung epithelial cells. The journal of biological chemistry. 2005;280(5):3590–6. doi: 10.1074/jbc.M411038200. [DOI] [PMC free article] [PubMed] [Google Scholar]
- Siesjo BK, Katsura K, Mellergard P, Ekholm A, Lundgren J, Smith ML. Acidosis-related brain damage. Progress in brain research. 1993;96:23–48. [PubMed] [Google Scholar]
- Smith JP, Drewes LR. Modulation of monocarboxylic acid transporter-1 kinetic function by the cAMP signaling pathway in rat brain endothelial cells. J Biol Chem. 2006;281:2053–2060. doi: 10.1074/jbc.M511577200. [DOI] [PubMed] [Google Scholar]
- Sonveaux P, Vegran F, Schroeder T, Wergin MC, Verrax J, Rabbani ZN, De Saedeleer CJ, Kennedy KM, Diepart C, Jordan BF, Kelley MJ, Gallez B, Wahl ML, Feron O, Dewhirst MW. Targeting lactate-fueled respiration selectively kills hypoxic tumor cells in mice. The Journal of clinical investigation. 2008;118:3930–42. doi: 10.1172/JCI36843. [DOI] [PMC free article] [PubMed] [Google Scholar]
- Staruschenko A, Pochynyuk O, Stockand JD. Regulation of epithelial Na+ channel activity by conserved serine/threonine switches within sorting signals. The Journal of biological chemistry. 2005;280:39161–7. doi: 10.1074/jbc.M509608200. [DOI] [PubMed] [Google Scholar]
- Stewart PA. Endothelial vesicles in the blood-brain barrier: are they related to permeability? Cellular and molecular neurobiology. 2000;20:149–63. doi: 10.1023/A:1007026504843. [DOI] [PMC free article] [PubMed] [Google Scholar]
- Suzuki A, Stern SA, Bozdagi O, Huntley GW, Walker RH, Magistretti PJ, Alberini CM. Astrocyte-neuron lactate transport is required for long-term memory formation. Cell. 2011;144:810–23. doi: 10.1016/j.cell.2011.02.018. [DOI] [PMC free article] [PubMed] [Google Scholar]
- Tang W, Chang SB, Hemler ME. Links between CD147 function, glycosylation, and caveolin-1. Molecular biology of the cell. 2004;15:4043–50. doi: 10.1091/mbc.E04-05-0402. [DOI] [PMC free article] [PubMed] [Google Scholar]
- Tang W, Hemler ME. Caveolin-1 regulates matrix metalloproteinases-1 induction and CD147/EMMPRIN cell surface clustering. The Journal of biological chemistry. 2004;279:11112–8. doi: 10.1074/jbc.M312947200. [DOI] [PubMed] [Google Scholar]
- Uhernik AL, Tucker C, Smith JP. Control of MCT1 function in cerebrovascular endothelial cells by intracellular pH. Brain research. 2011;1376:10–22. doi: 10.1016/j.brainres.2010.12.060. [DOI] [PubMed] [Google Scholar]
- Unterberg AW, Stover J, Kress B, Kiening KL. Edema and brain trauma. Neuroscience. 2004;129:1021–9. doi: 10.1016/j.neuroscience.2004.06.046. [DOI] [PubMed] [Google Scholar]
- Wagner KR, Kleinholz M, de Courten-Myers GM, Myers RE. Hyperglycemic versus normoglycemic stroke: topography of brain metabolites, intracellular pH, and infarct size. Journal of cerebral blood flow and metabolism : official journal of the International Society of Cerebral Blood Flow and Metabolism. 1992;12:213–22. doi: 10.1038/jcbfm.1992.31. [DOI] [PubMed] [Google Scholar]
- Wagner M, Schmid M, Juretschko S, Trebesius KH, Bubert A, Goebel W, Schleifer KH. In situ detection of a virulence factor mRNA and 16S rRNA in Listeria monocytogenes. FEMS Microbiol Lett. 1998;160:159–168. doi: 10.1111/j.1574-6968.1998.tb12906.x. [DOI] [PubMed] [Google Scholar]
- Wass CT, Lanier WL. Glucose modulation of ischemic brain injury: review and clinical recommendations. Mayo Clinic proceedings. Mayo Clinic. 1996;71:801–12. doi: 10.1016/S0025-6196(11)64847-7. [DOI] [PubMed] [Google Scholar]
- Wei J, Cohen DM, Quast MJ. Effects of 2-deoxy-d-glucose on focal cerebral ischemia in hyperglycemic rats. Journal of cerebral blood flow and metabolism : official journal of the International Society of Cerebral Blood Flow and Metabolism. 2003;23:556–64. doi: 10.1097/01.WCB.0000056061.18772.72. [DOI] [PubMed] [Google Scholar]
- Weidle UH, Scheuer W, Eggle D, Klostermann S, Stockinger H. Cancer-related issues of CD147. Cancer genomics & proteomics. 2010;7:157–69. [PubMed] [Google Scholar]
- Wilson MC, Meredith D, Halestrap AP. Fluorescence resonance energy transfer studies on the interaction between the lactate transporter MCT1 and CD147 provide information on the topology and stoichiometry of the complex in situ. The Journal of biological chemistry. 2002;277:3666–72. doi: 10.1074/jbc.M109658200. [DOI] [PubMed] [Google Scholar]
- Yang J, Holman GD. Long-term metformin treatment stimulates cardiomyocyte glucose transport through an AMP-activated protein kinase-dependent reduction in GLUT4 endocytosis. Endocrinology. 2006;147:2728–36. doi: 10.1210/en.2005-1433. [DOI] [PubMed] [Google Scholar]
- Zinchuk V, Grossenbacher-Zinchuk O. Recent advances in quantitative colocalization analysis: focus on neuroscience. Progress in histochemistry and cytochemistry. 2009;44:125–72. doi: 10.1016/j.proghi.2009.03.001. [DOI] [PubMed] [Google Scholar]