

Abstract
Aims
Increased O-linked attachment of β-N-acetylglucosamine (O-GlcNAc) to proteins has been implicated in the adverse effects of diabetes on the heart, although this has typically been based on models of severe hyperglycemia. Diabetes has also been associated with dysregulation of autophagy, a critical cell survival process; however, little is known regarding autophagy in the diabetic heart or whether this is influenced by O-GlcNAcylation or hemodynamic stress.
Main methods
Young male rats were assigned to control (12% kcal fat/19% protein/69% carbohydrate), high fat diet (60/19/21%) and type 2 diabetic (high fat diet + low dose streptozotocin) groups for 8 weeks, followed by sham or pressure overload surgeries; animals were sacrificed 8 weeks after surgery.
Key findings
A modest increase in arterial pressure resulted in no significant effects on cardiac function in control or high fat groups, while diabetic hearts exhibited contractile dysfunction and increased apoptosis and scar formation. Immunoprecipitation studies revealed, for the first time, that Beclin-1, which plays a critical early role in autophagy, and the anti-apoptotic Bcl-2, are targets for O-GlcNAcylation. Interestingly, we also found that cardiomyocytes isolated from type 2 diabetic db/db mice exhibited a blunted autophagic response which was at least partially reversed by inhibiting glucose entry into the hexosamine biosynthesis pathway, which regulates O-GlcNAc synthesis. We also found that acutely augmenting O-GlcNAc levels in non-diabetic cardiomyocytes mimicked the effects of diabetes by blunting autophagic signaling.
Significance
These data suggest that O-GlcNAc-mediated inhibition of autophagy may contribute to the abnormal response of diabetic hearts to hemodynamic stress.
Keywords: O-GlcNAc, autophagy, apoptosis, diabetes, heart
INTRODUCTION
In light of the rapidly increasing prevalence of diabetes worldwide (particularly type 2 diabetes), there is a pressing need to better understand the mechanisms by which diabetes leads to increased risk for cardiac dysfunction and heart failure. There is a growing appreciation for the role of O-linked attachment of β-N-acetylglucosamine (O-GlcNAc) to nuclear and cytoplasmic proteins in contributing to the adverse effects of diabetes on the heart (Fulop et al. 2007a; Yokoe et al. 2010). O-GlcNAc synthesis is regulated by the hexosamine biosynthesis pathway (HBP) and attachment of the O-GlcNAc moiety to serine/threonine residues of nuclear and cytosolic proteins is a dynamic, transient and reversible regulatory mechanism that is analogous to protein phosphorylation (Wang et al. 2008). The potential mechanisms linking O-GlcNAcylation to diabetic cardiomyopathy are still unclear, although we have recently demonstrated that cardiomyocytes harvested from type 2 diabetic db/db mice exhibit impaired hypertrophic and cell signaling pathways and that this appears to be a consequence of increased O-GlcNAcylation (Marsh et al. 2011).
Autophagy is an evolutionarily conserved process that functions both to preserve cellular energy and remove and degrade pathogens, toxins or damaged organelles by sequestration of cytoplasmic components. While autophagy primarily promotes cell survival, sustained activation can induce autophagic or apoptotic cell death (Maiuri et al. 2007). Autophagy has also been linked to cardiac hypertrophy induced by pressure overload stress (Zhu et al. 2007). While diabetes has been associated with abnormal autophagic response in a number of cells and tissues including pancreatic β-cells (Gonzalez et al. 2011), the effect of diabetes on autophagy in the heart has only recently been investigated and, thus far, equivocal findings have been reported (Mellor et al. 2011; Xie et al. 2011). We recently reported that Bcl-2 levels were markedly depressed in hearts from diabetic animals (Marsh et al. 2011); since Bcl-2 is involved in regulating autophagy through its interaction with Beclin-1, which plays a critical early role in autophagy, we speculated that there could be a relationship between O-GlcNAcylation and autophagic regulation. While there have been no previous studies linking protein O-GlcNAcylation and autophagy, it is of note that acute pressure overload, which is associated with activation of autophagy (Zhu et al. 2007), also leads to increased expression of proteins involved in catalyzing O-GlcNAc formation (Lunde et al. 2011).
Therefore, the goal of this study was to examine whether, in a model of moderate hyperglycemia, the addition of a mild pressure overload would exacerbate cardiac dysfunction and induce cardiomyocyte apoptosis and autophagy. We hypothesized that diabetes would lead to impaired autophagic signaling via an O-GlcNAc-mediated mechanism, which could be a contributing factor to cardiomyocyte dysfunction and apoptosis.
METHODS
Animals
All animal experiments were approved by the University of Alabama at Birmingham (UAB) Institutional Animal Care and Use Committee and conformed to the Guide for the Care and Use of Laboratory Animals published by National Institute of Health (NIH publication no. 85-23, 1996).
In the first study, 4 week old, male Sprague-Dawley rats (Charles River Laboratories, Wilmington, MA) were housed two per cage, maintained on a 12:12 hour light:dark cycle and provided with food and tap water ad libitum. Animals were randomized to receive control (12% kcal fat/19% protein/69% carbohydrate; 3.87 kcal/g) or high fat (60/19/21%; 5.21 kcal/g) diets (TestDiet, Richmond, IN). After 2 weeks, animals were randomized to receive either vehicle (0.1 mol/l citrate buffer, pH 4.5; non-diabetic controls) or 2 × 35 mg/kg streptozotocin (STZ; Sigma, St Louis, MO) injections i.p. given 24 h apart to induce diabetes; blood glucose levels were analyzed three weeks following STZ treatment to confirm hyperglycemia and non-responders (10%) were eliminated from the study. We have demonstrated previously that this protocol yields an advanced type 2 diabetic phenotype with moderate hyperglycemia, arterial stiffness and left ventricular (LV) systolic and diastolic dysfunction (Marsh et al. 2009). Eight weeks after the induction of diabetes (or vehicle injections), pressure overload was surgically induced by a trans-aortic constriction (TAC); surgical control animals underwent a sham surgery. Briefly, rats were anesthetized with 2% isofluorane inhalation and the aorta was banded between the branches of the carotid arteries on the aortic arch with a 7–0 silk suture tied around both the aorta and a blunted 18G needle. Successful TAC placement was confirmed three days after surgery using echocardiography with increased velocity and pressure gradient across the aortic valve. Rats were sacrificed 8 weeks after the sham/TAC surgeries.
In the second study, 10 to 14 week old C57BL/KsJ-leprdb/leprdb diabetic (db/db) mice and non-diabetic littermate controls were obtained from The Jackson Laboratories (Bar Harbor, ME) and housed with ad libitum food and water. At the time of the experiments db/db mice weighed 45 ± 1 g compared to 28 ± 1 g for lean controls (P<0.05).
Blood/plasma analysis
Fasting whole blood samples were collected from the retro-orbital plexus under light isoflurane anesthesia early in the light cycle after an overnight fast. Glucose and glycated hemoglobin (HbA1c) levels were measured in whole blood using the Accu-Chek Advantage (Roche Diagnostics, Basel, Switzerland) and DCA2000+ (Bayer Healthcare, Elkhart, IN) analyzers, respectively. Blood for the remaining analyses was collected at sacrifice from the inferior vena cava and a standard biochemistry panel was analyzed in plasma using the VetScan Chemistry Analyzer (Abaxis, Union City, CA).
Hemodynamic and echocardiographic measurements
Rats were anesthetized with 2% isoflurane and echocardiography performed (Agilent Sonos 5500, Philips, Bothel, WA) as previously described (Ryan et al. 2007). A 1.4F transducer (Mikro-Tip Pressure Catheter, Millar Instruments, Houston, Texas) was then inserted into the left carotid artery and advanced to the aortic root and subsequently into the LV for measurement of high-fidelity aortic and LV pressures, respectively, and calculation of LV function.
Cardiomyocyte isolation
Adult mouse cardiomyocytes were isolated as previously described (Shan et al. 2008). The protocol is based on that originally developed by the Alliance for Cell Signalling (AfCS) for adult mouse cardiomyocyte isolation (O’Connell et al. 2003), with some minor modifications. Briefly, hearts were rapidly excised from heparinized and anesthetized mice, perfused retrogradely with Ca2+-free perfusion buffer consisting of (in mM) 0.6 KH2PO4, 0.6 Na2HPO4, 1.2 MgSO4 • 7H2O, 0.032 phenol red, 12 NaHCO3, 10 KHCO3, 10 HEPES, 30 taurine, 10 2,3-butanedione monoxime, and 5.5 glucose, pH 7.46, followed by buffer containing 12.5 μM CaCl2 and 0.4 mg/ml collagenase type 2 (Worthington). After 15–25 min perfusion with collagenase containing buffer, the ventricles were removed, finely minced; dispersed myocytes were filtered and allowed to sediment. The supernatant was centrifuged and the pellet resuspended and combined with the original sedimented myocytes in perfusion buffer containing 5% bovine calf serum and 12.5 μM CaCl2. The calcium concentration was increased gradually from 12.5 μM to 1 mM over ~20 min. Freshly isolated cardiomyocytes were kept at 37°C and all experiments were performed at least 1 h after isolation.
Cell treatments
One hour following isolation, cardiomyocytes were washed three times with phosphate buffered saline (PBS) and incubated in either complete culture medium (control; perfusion buffer containing 5% bovine calf serum and 12.5 μM CaCl2) or glucose-free medium for 3 h at 37°C to trigger autophagy (Maruyama et al. 2008). The lysosomal inhibitor, Bafilomycin A1 (Streptomyces griseus; 100 nM; EMD Millipore, Billerica, MA), was present in all treatments to prevent maturation of vacuoles and downstream clearance of autophagosomes (Yamamoto et al. 1998; Klionsky et al. 2008). All treatments were performed with 2–4 replicates.
Immunohistochemistry
To determine myocyte cross-sectional area, horizontal short-axis sections through the mid-LV were formalin-fixed then immersed in 25% sucrose, embedded in optimum cutting temperature (OCT) compound, frozen in methylbutane over liquid nitrogen, sectioned at 5 μm and probed for laminin (Abcam, Cambridge, MA). Images of tissue in cross-sectional orientation from the anterior, posterior and free walls of the LV endocardium were acquired (40x objective), total field size measured and myocytes were counted within the field to determine average area. Myocyte apoptosis was examined using terminal deoxyribonucleotide transferase-mediated dUTP nick end-labeling (TUNEL, Promega, Madison, WI) as per the manufacturer’s instructions and then probed with laminin (Abcam) to identify myocytes. Positive controls were generated using DNase I (Invitrogen, Carlsbad, CA) and negative controls used DNase I without the rTDT enzyme. All data were analyzed using epifluorescence microscopy and digital image analysis software.
Collagen analysis
Horizontal short-axis sections through the mid-LV were formalin fixed, paraffin embedded, sectioned at 3 μm thickness, and stained with picric acid Sirius Red F3BA. Sections were quantitatively evaluated with light microscopy (10x objective, 800x total magnification) and a 540 nm (green) filter to provide grayscale contrast of the collagen with the background, and images were collected with digital image analysis software. Myocardial interstitial collagen volume percent was determined in 20 randomly selected fields in each section containing cardiomyocytes in a longitudinal orientation within the LV midwall and the mean value was calculated for each animal. All morphometric measurements were performed in a blinded manner. Collagen volume percent included both interstitial and endomysial regions.
Western blotting
LV tissue was homogenized on ice and suspended in Laemmli sample buffer. Proteins were separated by SDS-PAGE and transferred to polyvinylidene difluoride (PVDF) membranes. Membranes were incubated overnight at 4°C with primary antibodies for O-GlcNAc (CTD110.6, 1:5000; a generous gift from Mary-Ann Accavitti at the University of Alabama at Birmingham), Beclin-1 (1:2000; Abcam), LAMP-1 (1:1000; Abcam), LC3 (1:2000; Cell Signaling, Danvers, MA) and Bcl-2 (1:500; Santa Cruz Biotechnology, Santa Cruz, CA) diluted in PBS/casein followed by detection with appropriate secondary antibodies conjugated to horseradish peroxidase (HRP). Membranes were then stripped and reprobed with calsequestrin (1:10000; Abcam) to ensure equal protein loading. Blots were developed using chemiluminescence (ECL) as described by the manufacturer (Thermo Scientific, Rockford, IL) and densitometry analyses were performed using ImageJ (National Institutes of Health, Bethesda, MD).
Immunoprecipitation
The O-GlcNAcylation and interaction of Beclin-1 and Bcl-2 proteins were determined by immunoprecipitation in LV homogenates. Proteins were immunoprecipitated using 500 ug total protein incubated with 5 ug Beclin-1 or Bcl-2 antibodies overnight at 4°C. Protein A/G beads were then added for 4 h, pelleted by centrifugation, washed with wash buffer, eluted by boiling for 10 min in Laemmli buffer, and subjected to Western blotting as described above.
Statistical analysis
A one- or two-way analysis of variance (ANOVA) was used to determine differences between groups; the Bonferroni post hoc analysis was used where appropriate. Data that were not normally distributed and/or of unequal variance underwent either log or rank transformations and the subsequent analyses were performed on the transformed data. Survival analysis was performed by using the Kaplan-Meier log-rank method followed by the Holm-Sidak multiple-comparison analysis. Values are presented as mean ± SEM and significance was established at P<0.05.
RESULTS
Diabetic rats exhibited a stunted growth pattern compared to their non-diabetic, age-matched controls (P<0.05; Figure 1A); this is consistent with our previous work using the high fat fed, STZ-induced model of type 2 diabetes (Marsh et al. 2009). There was no effect of pressure overload on body weight in diabetic or control groups. Mortality was highest in the pressure overload groups and there was a trend towards decreased survival in both the control (75% survival at 8 weeks; P=0.097) and diabetic pressure overload groups (71% survival at 8 weeks; P=0.066; Figure 1B). The higher survival rate in high fat fed animals following pressure overload (92% at 8 weeks) is consistent with the work of others that demonstrated a protective effect of a high fat diet in failing hearts (Berthiaume et al. 2010). Fasting blood glucose, HbA1c, triglycerides, and markers of kidney and liver dysfunction were elevated in diabetic animals with no additive effect of pressure overload on these parameters (P<0.05; Table 1).
Figure 1.

The temporal progression of body weight (A) and survival (B) following either sham or trans-aortic constriction surgery to induce a pressure overload (PO) in non-diabetic (control), high fat-fed, or high fat-fed and STZ treated type 2 diabetic rats. † P<0.05 vs respective Control group; ‡ P<0.05 vs respective High fat group.
Table 1.
Blood and plasma biochemical parameters at sacrifice
| CON+SH | CON+PO | HF+SH | HF+PO | DIA+SH | DIA+PO | |
|---|---|---|---|---|---|---|
| Glucose (mmol/l) | 3.6 ± 0.1 | 3.1 ± 0.4 | 4.0 ± 0.3 | 4.2 ± 0.2 | 10.3 ± 0.6 †‡ | 11.2 ± 1.2 †‡ |
| HbA1c (%) | 3.29 ± 0.05 | 3.30 ± 0.04 | 3.45 ± 0.05 | 3.47 ± 0.07 | 6.24 ± 0.17 †‡ | 6.33 ± 0.10 †‡ |
| Triglycerides (mg/dl) | 92 ± 14 | 83 ± 13 | 92 ± 11 | 102 ± 11 | 231 ± 44 †‡ | 311 ± 63 †‡ |
| Cholesterol (mg/dl) | 68 ± 9 | 75 ± 7 | 72 ± 9 | 90 ± 6 | 52 ± 4 | 61 ± 7 ‡ |
| Renal function | ||||||
| Kidney wt/TL (mg/mm) | 28.9 ± 1.0 | 27.7 ± 1.0 | 30.9 ± 1.2 | 29.6 ± 1.0 | 38.1 ± 1.2 †‡ | 40.4 ± 2.3 †‡ |
| Creatinine (mg/dl) | 0.42 ± 0.03 | 0.43 ± 0.03 | 0.37 ± 0.02 | 0.36 ± 0.06 | 0.48 ± 0.01 | 0.46 ± 0.02 |
| Blood urea nitrogen (mg/dl) | 13.5 ± 1.5 | 14.1 ± 0.9 | 11.2 ± 0.4 | 10.6 ± 1.7 | 21.9 ± 2.8 †‡ | 20.2 ± 1.5 †‡ |
| Pancreatic function | ||||||
| Amylase (U/l) | 477 ± 91 | 662 ± 33 * | 655 ± 78 † | 674 ± 64 | 510 ± 30 | 496 ± 18 |
| Liver function | ||||||
| Alanine aminotransferase (U/l) | 28.7 ± 6.2 | 32.6 ± 3.6 | 30.8 ± 3.2 | 34.3 ± 4.4 | 50.5 ± 3.2 †‡ | 48.8 ± 3.6 ‡ |
| Bilirubin (mg/dl) | 0.21 ± 0.01 | 0.20 ± 0.03 | 0.19 ± 0.02 | 0.31 ± 0.05 | 0.34 ± 0.04 ‡ | 0.36 ± 0.05 † |
Values are mean ± SEM. CON, control diet; HF, high fat diet; DIA, diabetic; SH, sham surgery; PO, pressure overload surgery; TL, tibia length.
P<0.05 vs respective Sham group;
P<0.05 vs respective Control group;
P<0.05 vs respective High fat group.
Surgical creation of a trans-aortic constriction in rats induced a mild pressure overload that yielded a statistically significant increase in LV end-systolic pressure in diabetic hearts (P<0.05; Figure 2A) and a trend towards a higher pressure in non-diabetic hearts (P=0.051). We also observed a trend towards higher mean arterial pressures in both diabetic (P= 0.072) and non-diabetic pressure overloaded hearts (P=0.052) compared to sham controls (Table 2). Heart rates were lower in diabetic animals which is consistent with our previous findings (Marsh et al. 2009). LV systolic (VCFr, LVESσ) and diastolic (tau) dysfunction were only evident in pressure overloaded diabetic hearts (Figure 2B–D).
Figure 2.

Analysis of systolic (left ventricular end-systolic pressure (LVESP; A) and wall stress (LVESσ; B), velocity of circumferential shortening corrected for heart rate (VCFr; C)) and diastolic (Tau, time constant of isovolumic relaxation; D) function in non-diabetic (control), high fat-fed or diabetic rats at sacrifice, 8 weeks following surgical induction of a pressure overload or sham surgery. * P<0.05 vs respective Sham group; † P<0.05 vs respective Control group; ‡ P<0.05 vs respective High fat group.
Table 2.
Cardiac function at sacrifice
| CON+SH | CON+PO | HF+SH | HF+PO | DIA+SH | DIA+PO | |
|---|---|---|---|---|---|---|
| Heart rate (bpm) | 337 ± 7 | 319 ± 10 | 333 ± 9 | 345 ± 11 | 278 ± 12 †‡ | 291 ± 15 ‡ |
| Ejection fraction (%) | 68 ± 3 | 62 ± 3 | 69 ± 2 | 60 ± 2 | 59 ± 2 † | 56 ± 2 |
| MAP (mmHg) | 112 ± 4 | 129 ± 7 | 121 ± 7 | 131 ± 6 | 106 ± 3 | 120 ± 5 |
| LVEDP (mmHg) | 9.7 ± 1.3 | 10.0 ± 1.4 | 9.5 ± 1.9 | 10.1 ± 1.8 | 3.7 ± 1.0 †‡ | 6.8 ± 1.3 |
| LVEDσ (kdyne/cm2) | 11.0 ± 1.9 | 10.0 ± 1.9 | 9.5 ± 1.7 | 10.8 ± 1.7 | 4.0 ± 1.2 † | 7.7 ± 1.6 |
| dP/dt max (mmHg/sec) | 7808 ± 327 | 7723 ± 521 | 8012 ± 640 | 8429 ± 258 | 6212 ± 227 †‡ | 6052 ± 211 †‡ |
| dP/dt min (mmHg/sec) | −7636 ± 413 | −8531 ± 547 | −8004 ± 621 | −9573 ± 821 * | −5861 ± 271 ‡ | −5857 ± 304 †‡ |
Values are mean ± SEM. CON, control diet; HF, high fat diet; DIA, diabetic; SH, sham surgery; PO, pressure overload surgery; MAP, mean arterial pressure; LVEDP, LV end-diastolic pressure; LVEDσ, diastolic wall stress; dP/dt max and dP/dt min, maximal and minimal change in pressure over time, respectively.
P<0.05 vs respective Sham group;
P<0.05 vs respective Control group;
P<0.05 vs respective High fat group.
As expected, LV weight normalized to tibia length was higher in the diabetic pressure overloaded hearts compared to the diabetic shams (P<0.05; Table 3) and there was a trend towards higher LV weight in control (P=0.088) and high fat fed (P=0.068) pressure overloaded hearts. Despite these changes, there was no evidence of left ventricular hypertrophy at the cellular level with either diabetes or pressure overload as there were no changes in posterior wall thickness (PWd) or cardiomyocyte cross sectional area (Table 3). Analysis of myocardial collagen volume percent revealed that there was no evidence of overt fibrosis although histological examination showed large focal areas of scar tissue in diabetic pressure-overloaded hearts (Figure 3A). Increased numbers of apoptotic cells, identified by positive nuclear TUNEL staining, were evident in diabetic pressure-overloaded hearts compared to non-diabetic pressure-overloaded hearts (P<0.05; Figure 3A–B) and there was a trend towards higher numbers of TUNEL-positive cells in diabetic vs control sham hearts (P=0.067). Apoptotic cells were typically located in areas of scar tissue and elevated collagen deposition.
Table 3.
Body weight and left ventricular morphology and fibrosis at sacrifice
| CON+SH | CON+PO | HF+SH | HF+PO | DIA+SH | DIA+PO | |
|---|---|---|---|---|---|---|
| Body weight (g) | 531 ± 20 | 535 ± 21 | 585 ± 19 | 649 ± 16 † | 319 ± 21 †‡ | 349 ± 16 †‡ |
| TL (mm) | 50.3 ± 0.5 | 51.3 ± 0.6 | 50.6 ± 0.5 | 50.9 ± 0.6 | 46.5 ± 0.5 †‡ | 47.3 ± 0.7 †‡ |
| LV wt/TL (mg/mm) | 19.7 ± 0.7 | 22.1 ± 1.0 | 20.0 ± 0.6 | 22.4 ± 0.9 | 17.0 ± 0.8 | 21.0 ± 1.2 * |
| PWd (mm) | 2.1 ± 0.1 | 2.2 ± 0.1 | 2.1 ± 0.1 | 2.2 ± 0.1 | 1.9 ± 0.1 | 2.0 ± 0.1 |
| LVEDD (mm) | 9.0 ± 0.4 | 8.4 ± 0.3 | 8.5 ± 0.2 | 8.7 ± 0.2 | 8.2 ± 0.2 | 8.7 ± 0.3 |
| LVEDD/PWd | 4.4 ± 0.2 | 3.9 ± 0.3 | 4.1 ± 0.2 | 4.1 ± 0.3 | 4.5 ± 0.3 | 4.4 ± 0.2 |
| Myocyte CSA (μm2) | 505 ± 53 | 414 ± 34 | 425 ± 46 | 379 ± 25 | 413 ± 40 | 490 ± 38 |
| Myocardial vol % collagen (% area) | 2.6 ± 0.1 | 3.0 ± 0.5 | 2.8 ± 0.2 | 3.0 ± 0.3 | 3.3 ± 0.5 | 3.6 ± 0.2 |
Values are mean ± SEM. CON, control diet; HF, high fat diet; DIA, diabetic; SH, sham surgery; PO, pressure overload surgery; TL, tibia length; LV, left ventricular; PWd, LV end-diastolic posterior wall thickness; LVEDD, LV end-diastolic diameter; CSA, myocyte cross-sectional area; vol % collagen, interstitial collagen volume percent.
P<0.05 vs respective Sham group;
P<0.05 vs respective Control group;
P<0.05 vs respective High fat group.
Figure 3.

Representative left ventricular cross sections demonstrating increased apoptosis (left panels), scar tissue (hemotoxylin and eosin (H&E) staining; middle panels), and focal regions of fibrosis (picric acid Sirius Red F3BA (PASR) staining; right panels) in diabetic pressure overloaded (PO) (lower panels) compared to non-diabetic (Control) sham-operated hearts (upper panels) (A). Panel B shows quantification of apoptosis in all experimental groups. † P<0.05 vs respective Control group.
Diabetic hearts exhibited a relatively subtle increase in O-GlcNAc levels of some but not all proteins compared to non-diabetic controls (data not shown); this is entirely consistent with our previous studies of O-GlcNAc levels in hearts from the type 1 STZ-induced diabetic rat, the type 2 diabetic Zucker Diabetic Fatty (ZDF) rat and the db/db mouse model of type 2 diabetes (Fulop et al. 2007a; Marsh et al. 2011). O-GlcNAc was also modestly increased in pressure overloaded hearts from non-diabetic controls, high fat-fed controls and diabetic animals (data not shown) which is consistent with the findings of others (Lunde et al. 2011; Facundo et al. 2012).
As both diabetes and pressure overload have been linked to cardiac autophagy, we examined the effect of these interventions on markers of autophagy in the intact heart. Beclin-1 is an early promoter of autophagy and we found no differences between control, high fat fed and diabetic sham operated animals (Figure 4A); however, Beclin-1 protein was significantly higher in high fat fed, pressure overloaded hearts (P<0.05) and there was a trend towards higher Beclin-1 protein levels in pressure overloaded hearts of control (P=0.095) and diabetic (P=0.098) animals compared to respective shams when normalized to the calsequestrin loading control (Figure 4A). LC3 operates downstream of Beclin-1 and, upon activation, is cleaved from LC3-I to the autophagosome-associating form, LC3-II (Kabeya et al. 2004); thus, the ratio of LC3-II:LC3-I is often used as a marker of autophagy induction. Despite increased Beclin-1 with pressure overload, there were no differences between groups in LC3-II:LC3-I (Figure 4A). Consistent with the lack of change in LC3-II:LC3-I, we also found no differences in lysosome-associated membrane protein (LAMP1), another marker of lysosomal membrane formation. These data suggest that early processes in the autophagic pathway were activated by the mild level of pressure overload present in this study, but this was not sufficient to trigger an overt increase in autophagy.
Figure 4.

Representative western blots and densitometric analyses showing left ventricular levels of Beclin-1, LC3-I, LC3-II, LAMP-1 (A); and Bcl-2 (B) in hearts collected eight weeks following either sham (SH) or pressure overload (PO) surgeries in non-diabetic (CON), high fat-fed (HF), or diabetic (DIA) rats. Calsequestrin (Csq) is included as a protein loading control.
Autophagy and apoptosis pathways are linked through the interaction of Beclin-1 and the anti-apoptotic protein, Bcl-2; these proteins interact under basal conditions and the dissociation of Bcl-2 from Beclin-1 promotes autophagy (Pattingre et al. 2005). In this study, we found that Bcl-2 was significantly lower in diabetic sham-operated hearts compared to non-diabetic controls (P<0.05; Figure 4B) with no effect of diabetes on Bcl-2 levels in pressure-overloaded hearts; these data are consistent with recent work from our lab that showed decreased Bcl-2 in the type 2 diabetic db/db mouse heart (Marsh et al. 2011). Immunoprecipitation of both proteins demonstrates that, as expected, Bcl-2 and Beclin-1 interact in the heart but that their association is unaffected by diabetes and/or pressure overload (Figure 5A–B). Bcl-2 and Beclin-1 both undergo post-translational modifications that subsequently affect activation and downstream signaling (Ito et al. 1997; Zalckvar et al. 2009a; Zalckvar et al. 2009b). Figure 5 shows, for the first time, both Bcl-2 and Beclin-1 are O-GlcNAc modified. To confirm the specificity of the anti-O-GlcNAc antibody, blots were probed with the antibody in the presence of 10 mM O-GlcNAc resulting in the complete attenuation of O-GlcNAc reactivity. We observed no systematic effect of either diabetes or pressure overload on O-GlcNAcylation of either Bcl-2 or Beclin-1.
Figure 5.
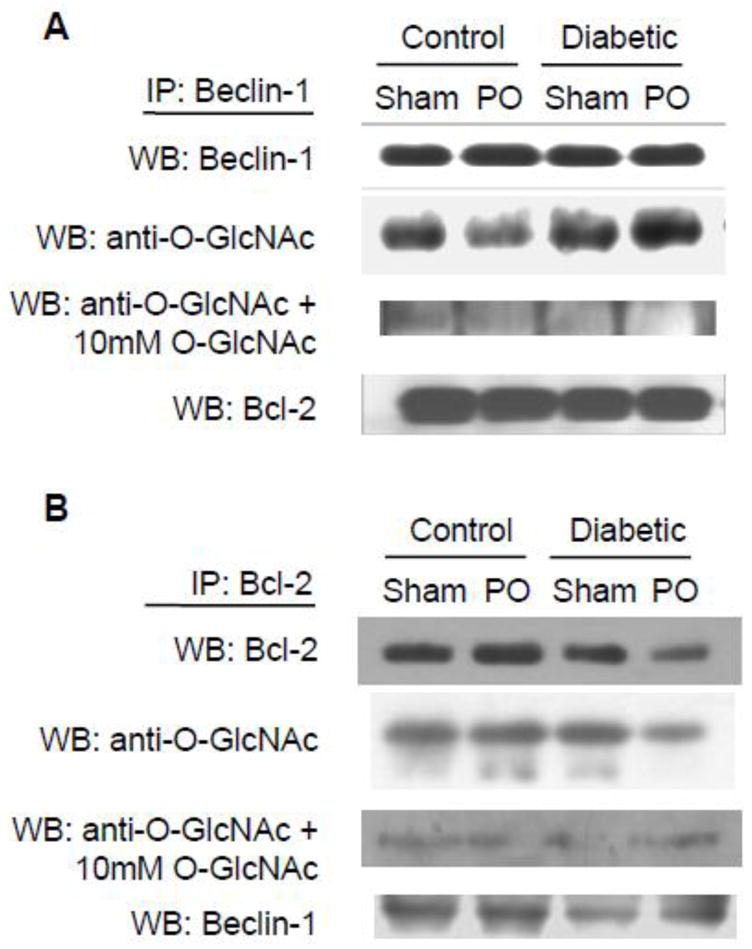
Representative western blots following immunoprecipitation with Beclin-1 (A) and Bcl-2 (B) and subsequently probed with the anti-O-GlcNAc antibody CTD110.6. To confirm the specificity of the anti-O-GlcNAc antibody, blots were also probed in the presence of 10 mM O-GlcNAc.
To confirm the blunted activation of the autophagic pathway in the diabetic heart, cardiomyocytes were isolated from another type 2 diabetic model, the db/db mouse. Consistent with the earlier results, db/db cardiomyocytes exhibited lower Beclin-1 and LC3-II levels under basal conditions compared to control cells although there were no differences in LC3-II/LC3-I ratio (Figure 6A). To determine whether diabetes affected autophagic signaling, cardiomyocytes were subjected to glucose deprivation, a classical inducer of autophagy. In non-diabetic cardiomyocytes, Beclin-1, LC3-I and LC3-II were increased with glucose deprivation which is consistent with the findings of others (Matsui et al. 2007; Maruyama et al. 2008). In diabetic cardiomyocytes, however, the responses of Beclin-1, LC3-I and LC3-II were blunted following glucose deprivation (Figure 6A). Administration of 3-methyladenine (3-MA), a broad-spectrum PI3 kinase inhibitor that is also an inhibitor of autophagy, blunted the glucose deprivation-induced increase in Beclin-1 and LC3-II protein in non-diabetic control cells (Figure 6B), confirming that glucose deprivation did indeed induce autophagy.
Figure 6.

The role of the hexosamine biosynthesis pathway (HBP) in blunting autophagic signaling. Representative western blots showing Beclin-1 and LC3 protein in cardiomyocytes from non-diabetic (Con) and type 2 diabetic (db/db) under basal conditions and in response to glucose deprivation (A) and in Con cells subjected to glucose deprivation in the presence of the autophagy inhibitor 3-methyladenine (3-MA) or glucosamine (GlcN) (B). Inhibition of the HBP by 6-diazo-5-oxo-L-norleucine (DON) in glucose deprived db/db cardiomyocytes restores Beclin-1 and LC3 signaling (C). Calsequestrin (Csq) is an internal protein loading control.
Since we have previously reported that myocardial protein O-GlcNAc levels are increased in various models of diabetes including db/db mice (Fulop et al. 2007a; Marsh et al. 2011) and, as shown in Figure 5, Beclin-1 is a target for O-GlcNAcylation, we therefore speculated that augmenting O-GlcNAc levels could be a contributing factor to the blunted autophagic response seen in db/db cardiomyocytes. We have previously shown that glucosamine increases HBP flux and O-GlcNAc levels in normal cardiomyocytes similar to that seen in diabetes (Marsh et al. 2011). Here we found that the treatment of control cardiomyocytes with glucosamine, similar to 3MA, blunted but did not completely attenuate the glucose deprivation-induced expression of Beclin-1, LC3-I and LC3-II in control, non-diabetic cells (Figure 6B). To further explore the role of the HBP in regulating autophagy in the diabetic heart, db/db cardiomyocytes were pre-treated with a GFAT inhibitor, the glutamine analog 6-diazo-5-oxo-L-norleucine (DON, 20 μM), for 18 h prior to 3 h exposure to glucose-free media. GFAT inhibition markedly enhanced the response of Beclin-1, LC3-I and LC3-II protein to glucose deprivation in diabetic cells (Figure 6C), consistent with the notion that increased activation of the HBP may contribute to the blunted autophagic response in the diabetic heart.
In Figure 7A we confirm that 5 mM glucosamine significantly increased O-GlcNAc levels in control cardiomyocytes, consistent with our earlier studies. However, in addition to increasing protein O-GlcNAcylation, flux through the HBP also increases HBP metabolites, such as UDP-N-acetylglucosamine and UDP-N-acetyl-galactosamine (Champattanachai et al. 2007; Fulop et al. 2007b). An alternative approach to manipulate O-GlcNAc levels, independent of the HBP is via inhibition of O-GlcNAcase activity, which prevents the removal of the O-GlcNAc moiety. O-(2-acetamido-2-deoxy-d-glucopyranosylidene)amino-N-phenylcarbamate (PUGNAc) is an O-GlcNAc analog that is a potent competitive inhibitor of O-GlcNAcase and has been used to increase O-GlcNAc levels (Champattanachai et al. 2007; Marsh et al. 2011). As expected, incubation of non-diabetic cardiomyocytes with 100 μM PUGNAc for 3 h resulted in marked increase in protein O-GlcNAc levels (Figure 7A). To examine the effect of increased protein O-GlcNAcylation on the response of cardiomyocytes to glucose deprivation, non-diabetic cardiomyocytes were incubated with glucose-free media for 3 h in the presence of 5 or 10 mM glucosamine or 100 μM PUGNAc. Beclin-1 protein was increased with glucose deprivation and this was blunted in cells that were incubated with either glucosamine or PUGNAc (Figure 7B). These data suggest that the increased O-GlcNAc levels seen in diabetic hearts contribute, at least in part, to the abnormal autophagic response in response to glucose deprivation.
Figure 7.

Increased O-GlcNAc levels in non-diabetic cardiomyocytes (Con) treated with glucosamine (GlcN) or O-(2-acetamido-2-deoxy-d-glucopyranosylidene)amino-N-phenylcarbamate (PUGNAc), an O-GlcNAcase inhibitor (A). Upregulation of O-GlcNAc levels using these standard approaches blunts the Beclin-1 response to glucose deprivation (B). Calsequestrin (Csq) is an internal protein loading control.
DISCUSSION
The clinical literature clearly demonstrates that patients with diabetes are at much greater risk for the subsequent development of heart failure, particularly in combination with additional hemodynamic stress such as hypertension; however, the molecular mechanisms underlying this remain poorly characterized. One limitation of many of the animal studies used to examine the adverse effects of diabetes on the heart is that they are typically severely hyperglycemic; this is true even in type 2 diabetic models such as db/db mice and ZDF rats. We recently described a rat model of diabetes, combining a high fat diet and low dose STZ treatment, which resulted in a stable, moderate hyperglycemia that was associated with evidence of diastolic dysfunction similar to that seen in patients with type 2 diabetes (Marsh et al. 2009), although we saw no evidence of increases apoptosis that had been previously reported in more severe models of diabetes. In the current study, we investigated the consequences of combining this model of diabetes with mild pressure overload induced by TAC as hemodynamic stresses such as hypertension are characteristic of most patients with type 2 diabetes. We found that, given the relatively modest increase in arterial pressure, there were no significant effects on cardiac function in either control or high fat fed animals after 8 weeks of pressure overload; however, there was evidence of significant systolic and diastolic dysfunction as well as marked increases in apoptosis and scar formation in the diabetic group. It is also of note that diabetes alone resulted in very mild changes in cardiac function, similar to, but somewhat less pronounced than our earlier report (Marsh et al. 2009). These data demonstrate that a relatively mild hyperglycemia, more typical of that seen in type 2 diabetic patients than most animal models, clearly increases the susceptibility to contractile dysfunction and cell injury when subjected to an additional, but modest increase in hemodynamic stress.
Autophagy is a highly conserved endogenous cell survival mechanism that is typically activated in response to external stressors and helps sequester, degrade and recycle damaged organelles and proteins. Diabetes has been associated with abnormal autophagy in adipocytes, pancreatic β-cells, kidney, spleen and thymus, with impaired autophagy in β-cells implicated in increased cell death (Gonzalez et al. 2011). In the heart, however, the role of autophagy in mediating stress responses is less well understood. A number of studies have shown that acute activation of autophagy is cardioprotective in the setting of ischemia/reperfusion (Hamacher-Brady et al. 2006a; Hamacher-Brady et al. 2006b) and that inhibition of autophagy promotes apoptosis (Nishida et al. 2009). Conversely, the response to pressure overload appears to be complex with decreased autophagic activity during compensated hypertrophy followed by upregulation during heart failure (Nishida et al. 2009). The impact of diabetes on autophagy in the heart is not well understood and recent studies have reported equivocal findings (Mellor et al. 2011; Xie et al. 2011).
We have previously reported that Bcl-2 levels were markedly reduced in cardiomyocytes from type 2 diabetic db/db mice and speculated that this could contribute to increased apoptosis (Marsh et al. 2011). In the current study, we found that in another model of type 2 diabetes, Bcl-2 levels were also depressed and that this was associated with increased apoptosis in response to pressure overload stress. The mechanisms involved in the decrease in Bcl-2 protein remain to be determined. In light of the role of Bcl-2 in regulation of autophagy through its interaction with Beclin-1 and given that diabetes has been implicated in abnormal autophagy, we postulate that there could be a defect in myocardial autophagic signaling with diabetes and that this could contribute to increased apoptosis. However, we did not observe any increase in either Beclin-1 or LC3-II/LC3-I in diabetic, sham-operated hearts although Beclin-1 was higher in pressure overloaded hearts. Interestingly, we did observe that both Bcl-2 and Beclin-1 appeared to be targets for O-GlcNAcylation; therefore, we hypothesized that O-GlcNAcylation could alter the acute cellular response to autophagic stimuli, which would not necessarily be evident at the whole heart level several weeks following pressure overload. Indeed, we found that, in cardiomyocytes from db/db diabetic mice, the response to glucose deprivation, a classical inducer of autophagy, was blunted and that this appears to be due, at least in part, to increased HBP flux and subsequent elevation in protein O-GlcNAcylation. We also demonstrate that increasing O-GlcNAc levels in non-diabetic cardiomyocytes, either by augmenting flux through the HBP with glucosamine or inhibiting O-GlcNAcase, also blunted the increase in Beclin-1 similar to that seen in diabetic cardiomyocytes. Further, we found that inhibition of the HBP in diabetic cardiomyocytes increased autophagic signaling. Taken together these data suggest that increased O-GlcNAcylation seen in diabetes leads to impaired autophagic response thereby contributing to the increase in apoptosis that was observed in response to pressure overload.
It should be noted that in H9c2 cardiomyoblasts high glucose levels were shown to increase autophagy and this was associated with increased cell death (Younce et al. 2010), which would appear to be contrary to the results shown here. Younce and coworkers exposed cells to 28 mM glucose and only basal levels of autophagy were assessed, whereas here we incubated cardiomyocytes at normal glucose concentrations and the response to a specific autophagic stimuli, namely glucose deprivation, was assessed. The impaired autophagic response seen in cardiomyocytes from db/db mice observed here is entirely consistent with the notion that diabetes leads to abnormal autophagy in other tissues (Zhou et al. 2010).
The sustained increase in protein O-GlcNAcylation seen in diabetes has been implicated in the abnormal signal transduction seen in various tissues, including the heart (Fulop et al. 2007a; Marsh et al. 2011). However, as far as we are aware, the notion that protein O-GlcNAcylation may be involved in regulating autophagy has not been previously demonstrated and that impairment in this regulation could be another contributing factor to the adverse effects of diabetes on the heart has also not been previously reported. The mechanism underlying regulation of cardiac autophagy is still unclear but may be due to O-GlcNAc modification of upstream signaling proteins or modification of key mediators of the autophagy pathway. Bcl-2 and Beclin-1 both undergo post-translational modifications that subsequently affect activation and downstream signaling; Bcl-2 is activated via phosphorylation (Ito et al. 1997) whereas phosphorylation of Beclin-1 weakens the Beclin-1/Bcl-2 interaction and promotes autophagy (Zalckvar et al. 2009a; Zalckvar et al. 2009b). In this study we have shown, for the first time, that in the heart, Bcl-2 and Beclin-1 appear to be targets for O-GlcNAcylation. Given that these two proteins interact to regulate both apoptosis and autophagy and that post-translational modifications modulate their activities, these findings could provide greater insight into how autophagy and apoptosis are regulated, particularly in light of our previous work that demonstrated that O-GlcNAc formation is essential for Bcl-2 translocation (Champattanachai et al. 2008). It is also important to note that Bcl-2 also interacts with other members of the Bcl-2 family such as Bad and Bcl-XL (Yang et al. 1995) and that Bad was recently reported to be O-GlcNAc-modified (Rajamani and Essop 2010). BNIP-3 is also a key mediator in regulating the balance between apoptosis and autophagy and there is some evidence that it is also a target for O-GlcNAcylation (Manka and Millhorn 2006). Clearly, further studies are warranted to better understand the mechanisms by which O-GlcNAcylation contributes to the regulation of autophagy.
CONCLUSION
In conclusion, we have shown that mild diabetes and pressure overload, which separately caused no contractile dysfunction or tissue injury, when combined resulted in both impaired diastolic and systolic dysfunction, and increased apoptosis and scarring which was associated with decreased Bcl-2 levels. We also demonstrate, for the first time, that both Bcl-2 and Beclin-1, key regulatory components of apoptosis and autophagy, respectively, are targets for O-GlcNAcylation which has been implicated in mediating the adverse effects of diabetes on the heart. Furthermore, we also found that acute activation of autophagy is impaired in cardiomyocytes from db/db mice and that this could be mimicked by acutely increasing O-GlcNAc levels in normal cardiomyocytes. When combined with earlier studies indicating that increased O-GlcNAcylation contributed to impaired hypertrophic signaling in diabetic cardiomyocytes, these data suggest that dysregulation of O-GlcNAc turnover in diabetes negatively impacts multiple cellular signaling pathways, ultimately increasing the susceptibility of cardiomyocytes to increased hemodynamic stress.
Acknowledgments
This work was supported by National Institute of Health grants (HL-77100, HL-67464). The authors gratefully acknowledge the technical assistance of Eddie Bradley, Laura Cain, Charlye Brocks and Dan Shan.
Footnotes
Publisher's Disclaimer: This is a PDF file of an unedited manuscript that has been accepted for publication. As a service to our customers we are providing this early version of the manuscript. The manuscript will undergo copyediting, typesetting, and review of the resulting proof before it is published in its final citable form. Please note that during the production process errors may be discovered which could affect the content, and all legal disclaimers that apply to the journal pertain.
References
- Berthiaume JM, Bray MS, McElfresh TA, Chen X, Azam S, Young ME, et al. The myocardial contractile response to physiological stress improves with high saturated fat feeding in heart failure. Am J Physiol Heart Circ Physiol. 2010;299:H410–21. doi: 10.1152/ajpheart.00270.2010. [DOI] [PMC free article] [PubMed] [Google Scholar]
- Champattanachai V, Marchase RB, Chatham JC. Glucosamine protects neonatal cardiomyocytes from ischemia-reperfusion injury via increased protein-associated O-GlcNAc. Am J Physiol Cell Physiol. 2007;292:C178–87. doi: 10.1152/ajpcell.00162.2006. [DOI] [PubMed] [Google Scholar]
- Champattanachai V, Marchase RB, Chatham JC. Glucosamine protects neonatal cardiomyocytes from ischemia-reperfusion injury via increased protein O-GlcNAc and increased mitochondrial Bcl-2. Am J Physiol Cell Physiol. 2008;294:C1509–20. doi: 10.1152/ajpcell.00456.2007. [DOI] [PMC free article] [PubMed] [Google Scholar]
- Facundo HT, Brainard RE, Watson LJ, Ngoh GA, Hamid T, Prabhu SD, et al. O-GlcNAc signaling is essential for NFAT-mediated transcriptional reprogramming during cardiomyocyte hypertrophy. Am J Physiol Heart Circ Physiol. 2012 doi: 10.1152/ajpheart.00775.2011. In press. [DOI] [PMC free article] [PubMed] [Google Scholar]
- Fulop N, Mason MM, Dutta K, Wang P, Davidoff AJ, Marchase RB, et al. Impact of Type 2 diabetes and aging on cardiomyocyte function and O-linked N-acetylglucosamine levels in the heart. Am J Physiol Cell Physiol. 2007a;292:C1370–8. doi: 10.1152/ajpcell.00422.2006. [DOI] [PubMed] [Google Scholar]
- Fulop N, Zhang Z, Marchase RB, Chatham JC. Glucosamine cardioprotection in perfused rat hearts associated with increased O-linked N-acetylglucosamine protein modification and altered p38 activation. Am J Physiol Heart Circ Physiol. 2007b;292:H2227–36. doi: 10.1152/ajpheart.01091.2006. [DOI] [PMC free article] [PubMed] [Google Scholar]
- Gonzalez CD, Lee MS, Marchetti P, Pietropaolo M, Towns R, Vaccaro MI, et al. The emerging role of autophagy in the pathophysiology of diabetes mellitus. Autophagy. 2011;7:2–11. doi: 10.4161/auto.7.1.13044. [DOI] [PMC free article] [PubMed] [Google Scholar]
- Hamacher-Brady A, Brady NR, Gottlieb RA. Enhancing macroautophagy protects against ischemia/reperfusion injury in cardiac myocytes. J Biol Chem. 2006a;281:29776–87. doi: 10.1074/jbc.M603783200. [DOI] [PubMed] [Google Scholar]
- Hamacher-Brady A, Brady NR, Gottlieb RA, Gustafsson AB. Autophagy as a protective response to Bnip3-mediated apoptotic signaling in the heart. Autophagy. 2006b;2:307–9. doi: 10.4161/auto.2947. [DOI] [PubMed] [Google Scholar]
- Ito T, Deng X, Carr B, May WS. Bcl-2 phosphorylation required for anti-apoptosis function. J Biol Chem. 1997;272:11671–3. doi: 10.1074/jbc.272.18.11671. [DOI] [PubMed] [Google Scholar]
- Kabeya Y, Mizushima N, Yamamoto A, Oshitani-Okamoto S, Ohsumi Y, Yoshimori T. LC3, GABARAP and GATE16 localize to autophagosomal membrane depending on form-II formation. J Cell Sci. 2004;117:2805–12. doi: 10.1242/jcs.01131. [DOI] [PubMed] [Google Scholar]
- Klionsky DJ, Abeliovich H, Agostinis P, Agrawal DK, Aliev G, Askew DS, et al. Guidelines for the use and interpretation of assays for monitoring autophagy in higher eukaryotes. Autophagy. 2008;4:151–75. doi: 10.4161/auto.5338. [DOI] [PMC free article] [PubMed] [Google Scholar]
- Lunde IG, Aronsen JM, Kvaloy H, Qvigstad E, Sjaastad I, Tonnessen T, et al. Cardiac O-GlcNAc signaling is increased in hypertrophy and heart failure. Physiol Genomics. 2011 doi: 10.1152/physiolgenomics.00016.2011. [DOI] [PubMed] [Google Scholar]
- Maiuri MC, Zalckvar E, Kimchi A, Kroemer G. Self-eating and self-killing: crosstalk between autophagy and apoptosis. Nat Rev Mol Cell Biol. 2007;8:741–52. doi: 10.1038/nrm2239. [DOI] [PubMed] [Google Scholar]
- Manka D, Millhorn DE. A potential molecular link between aerobic glycolysis and cancer. Cell Cycle. 2006;5:343–4. doi: 10.4161/cc.5.4.2474. [DOI] [PubMed] [Google Scholar]
- Marsh SA, Dell’italia LJ, Chatham JC. Interaction of diet and diabetes on cardiovascular function in rats. Am J Physiol Heart Circ Physiol. 2009;296:H282–H92. doi: 10.1152/ajpheart.00421.2008. [DOI] [PMC free article] [PubMed] [Google Scholar]
- Marsh SA, Dell’italia LJ, Chatham JC. Activation of the hexosamine biosynthesis pathway and protein O-GlcNAcylation modulate hypertrophic and cell signaling pathways in cardiomyocytes from diabetic mice. Amino Acids. 2011;40:819–28. doi: 10.1007/s00726-010-0699-8. [DOI] [PMC free article] [PubMed] [Google Scholar]
- Maruyama R, Goto K, Takemura G, Ono K, Nagao K, Horie T, et al. Morphological and biochemical characterization of basal and starvation-induced autophagy in isolated adult rat cardiomyocytes. Am J Physiol Heart Circ Physiol. 2008;295:H1599–607. doi: 10.1152/ajpheart.91449.2007. [DOI] [PubMed] [Google Scholar]
- Matsui Y, Takagi H, Qu X, Abdellatif M, Sakoda H, Asano T, et al. Distinct roles of autophagy in the heart during ischemia and reperfusion: roles of AMP-activated protein kinase and Beclin 1 in mediating autophagy. Circ Res. 2007;100:914–22. doi: 10.1161/01.RES.0000261924.76669.36. [DOI] [PubMed] [Google Scholar]
- Mellor KM, Bell JR, Young MJ, Ritchie RH, Delbridge LM. Myocardial autophagy activation and suppressed survival signaling is associated with insulin resistance in fructose-fed mice. J Mol Cell Cardiol. 2011;50:1035–43. doi: 10.1016/j.yjmcc.2011.03.002. [DOI] [PubMed] [Google Scholar]
- Nishida K, Kyoi S, Yamaguchi O, Sadoshima J, Otsu K. The role of autophagy in the heart. Cell Death Differ. 2009;16:31–8. doi: 10.1038/cdd.2008.163. [DOI] [PubMed] [Google Scholar]
- O’Connell TD, Ni YG, Lin K-M, Han H, Yan Z. Isolation and Culture of Adult Mouse Cardiac Myocytes for Signaling Studies. AfCS Research Reports. 2003;1 [Google Scholar]
- Pattingre S, Tassa A, Qu X, Garuti R, Liang XH, Mizushima N, et al. Bcl-2 antiapoptotic proteins inhibit Beclin 1-dependent autophagy. Cell. 2005;122:927–39. doi: 10.1016/j.cell.2005.07.002. [DOI] [PubMed] [Google Scholar]
- Rajamani U, Essop MF. Hyperglycemia-mediated activation of the hexosamine biosynthetic pathway results in myocardial apoptosis. Am J Physiol Cell Physiol. 2010;299:C139–47. doi: 10.1152/ajpcell.00020.2010. [DOI] [PubMed] [Google Scholar]
- Ryan TD, Rothstein EC, Aban I, Tallaj JA, Husain A, Lucchesi PA, et al. Left ventricular eccentric remodeling and matrix loss are mediated by bradykinin and precede cardiomyocyte elongation in rats with volume overload. J Am Coll Cardiol. 2007;49:811–21. doi: 10.1016/j.jacc.2006.06.083. [DOI] [PubMed] [Google Scholar]
- Shan D, Marchase RB, Chatham JC. Overexpression of TRPC3 increases apoptosis but not necrosis in response to ischemia-reperfusion in adult mouse cardiomyocytes. Am J Physiol Cell Physiol. 2008;294:C833–41. doi: 10.1152/ajpcell.00313.2007. [DOI] [PMC free article] [PubMed] [Google Scholar]
- Wang Z, Gucek M, Hart GW. Cross-talk between GlcNAcylation and phosphorylation: site-specific phosphorylation dynamics in response to globally elevated O-GlcNAc. Proc Natl Acad Sci U S A. 2008;105:13793–8. doi: 10.1073/pnas.0806216105. [DOI] [PMC free article] [PubMed] [Google Scholar]
- Xie Z, Lau K, Eby B, Lozano P, He C, Pennington B, et al. Improvement of cardiac functions by chronic metformin treatment is associated with enhanced cardiac autophagy in diabetic OVE26 mice. Diabetes. 2011;60:1770–8. doi: 10.2337/db10-0351. [DOI] [PMC free article] [PubMed] [Google Scholar]
- Yamamoto A, Tagawa Y, Yoshimori T, Moriyama Y, Masaki R, Tashiro Y. Bafilomycin A1 prevents maturation of autophagic vacuoles by inhibiting fusion between autophagosomes and lysosomes in rat hepatoma cell line, H-4-II-E cells. Cell Struct Funct. 1998;23:33–42. doi: 10.1247/csf.23.33. [DOI] [PubMed] [Google Scholar]
- Yang E, Zha J, Jockel J, Boise LH, Thompson CB, Korsmeyer SJ. Bad, a heterodimeric partner for Bcl-XL and Bcl-2, displaces Bax and promotes cell death. Cell. 1995;80:285–91. doi: 10.1016/0092-8674(95)90411-5. [DOI] [PubMed] [Google Scholar]
- Yokoe S, Asahi M, Takeda T, Otsu K, Taniguchi N, Miyoshi E, et al. Inhibition of Phospholamban Phosphorylation by O-GlcNAcylation: Implications for Diabetic Cardiomyopathy. Glycobiology. 2010;20:1217–26. doi: 10.1093/glycob/cwq071. [DOI] [PubMed] [Google Scholar]
- Younce CW, Wang K, Kolattukudy PE. Hyperglycaemia-induced cardiomyocyte death is mediated via MCP-1 production and induction of a novel zinc-finger protein MCPIP. Cardiovascular Research. 2010;87:665–74. doi: 10.1093/cvr/cvq102. [DOI] [PMC free article] [PubMed] [Google Scholar]
- Zalckvar E, Berissi H, Eisenstein M, Kimchi A. Phosphorylation of Beclin 1 by DAP-kinase promotes autophagy by weakening its interactions with Bcl-2 and Bcl-XL. Autophagy. 2009a;5:720–2. doi: 10.4161/auto.5.5.8625. [DOI] [PubMed] [Google Scholar]
- Zalckvar E, Berissi H, Mizrachy L, Idelchuk Y, Koren I, Eisenstein M, et al. DAP-kinase-mediated phosphorylation on the BH3 domain of beclin 1 promotes dissociation of beclin 1 from Bcl-XL and induction of autophagy. EMBO Rep. 2009b;10:285–92. doi: 10.1038/embor.2008.246. [DOI] [PMC free article] [PubMed] [Google Scholar]
- Zhou Z, Wu S, Li X, Xue Z, Tong J. Rapamycin induces autophagy and exacerbates metabolism associated complications in a mouse model of type 1 diabetes. Indian J Exp Biol. 2010;48:31–8. [PubMed] [Google Scholar]
- Zhu H, Tannous P, Johnstone JL, Kong Y, Shelton JM, Richardson JA, et al. Cardiac autophagy is a maladaptive response to hemodynamic stress. J Clin Invest. 2007;117:1782–93. doi: 10.1172/JCI27523. [DOI] [PMC free article] [PubMed] [Google Scholar]