

Abstract
SUMOylation, the covalent attachment of Small Ubiquitin-like MOdifier (SUMO) polypeptides to other proteins, is among the most important post-translational modifications that regulate the functional properties of a large number of proteins. SUMOylation is broadly involved in cellular processes such as gene transcription, hormone response, signal transduction, DNA repair and nuclear transport. SUMO modification has also been implicated in the pathogenesis of human diseases, such as cancer, neurodegenerative disorders and viral infection. Attachment of a SUMO protein to another protein is carried out in multiple steps catalyzed by three enzymes. This unit describes and discusses the in vitro biochemical methods used for investigating each step of the SUMOylation process. In addition, a high throughput screening protocol is included for the identification of inhibitors of SUMOylation.
Keywords: SUMOylation, SUMO, E1, E2, E3, Ubc9, SAE1, SAE2, RanGAP1, RanBP2, Sp100, HTS
INTRODUCTION
This unit provides several detailed protocols for investigating the mechanism of protein SUMOylation in vitro. The protocol for in vivo protein SUMOylation has previously been described in detail (Tatham, 2009), and therefore is not included in this unit. SUMOylation occurs in sequential enzymatic steps catalyzed by three types of enzymes generally known as E1 (heterodimer composed of SAE1 and SAE2) activating enzyme, E2 (Ubc9) conjugating enzyme, and E3 ligating enzyme (Fig. 1) (Meulmeester and Melchior, 2008; Hay, 2005). The protocols and their corresponding SUMOylation steps are outlined in Figure 1. Basic Protocols 1–3 specifically examine E1-catalyzed reactions. Basic and Alternate Protocols 1 are used to examine the first step in this reaction (eq 1) by quantitative ATP:PPi isotope exchange assay. E1 binds ATP and SUMO and catalyzes the formation of SUMO adenylate intermediate (red) with the release of inorganic pyrophosphate, PPi. This reaction is reversible.
Figure 1.

Schematic of the SUMOylation process with the protocols corresponding to the specific steps indicated. SUMOylation occurs in several steps. In the first step, SUMO (S) proteins are matured by SUMO specific proteases (SENPs). In the second step, E1 catalyzes the formation of SUMO adenylate in which the C-terminal –COOH group of SUMO is covalently linked to AMP. SUMO adenylate binds to E1 noncovalently. Then, SUMO is transferred to the active site Cys of E1, forming a thioester conjugate with E1. Both steps are reversible. In the third step, SUMO is transferred from E1 to E2, where it forms a thioester conjugate with the catalytic Cys residue of E2. This step is also reversible. In the final step, SUMO is ligated to target proteins by the formation of an isopeptide bond between its C-terminal –COOH group and the 3-amino group of a Lys residue on the target protein. This step generally requires an E3 ligase. The numbers in the yellow boxes represent the protocols outlined in this unit.
| [1] |
The assay is quantitative and yields kinetic as well as equilibrium information of SUMO-adenylate binding to E1. Basic Protocol 2 is used to determine the ATP:AMP exchange rates by thin layer chromatography which quantitatively examine both SUMO adenylation and E1•SUMO thioester (blue) formation (eq 1 and 2). Basic Protocol 3 is a gel-based assay commonly used to determine E1•SUMO thioester formation (eq 3). However, this reaction
| [2] |
occurs rapidly, it only detects dramatic differences in E1 activity.
| [3] |
Basic Protocols 4 and 5 are used to examine E2-catalyzed reactions. Basic Protocol 4 describes a gel-based assay in combination with fluorescent detection to detect the transfer of SUMO from E1 to E2 (eq 4). This method is quantitative and not affected by the E1-catalyzed steps because [4]
| [4] |
E1•SUMO thioester complex is formed first before E2 is added. Basic Protocol 5 describes the detection of E2•SUMO thioester (green) formation (eq 4) by gel-based assay. This assay is easy and convenient, but the results are dependent on all three steps of SUMOylation that lead to the E2•SUMO thioester formation.
Basic Protocols 6 and 7 are used to determine the formation of isopeptide bonds between known target proteins (i.e. RanGAP1 and Sp100) and SUMO (eq 5). Basic Protocol 6 does not require
| [5] |
an E3 ligase, but Basic Protocol 7 does require an E3 ligase. The transfer of SUMO from E2 to substrate is less efficient without an E3 ligase. These two assays can be used to conduct steady-state kinetic analysis to examine transfer of SUMO from E1 to E2 or from E2 to substrates. Basic Protocol 8 is an adaptation of the assay described in Basic Protocol 6 for high throughput screening (HTS) for SUMOylation inhibitors.
BASIC PROTOCOL 1
QUANTITATIVE EXAMINATION OF SUMO ADENYLATION BY ATP:PPi ISOTOPE EXCHANGE ASSAY
In this assay, the E1-catalyzed exchange of ATP:PPi is measured by the increase in radioactive ATP from [32P]PPi. This protocol involves two steps. First, reactions are established to allow isotope exchange. Then the reaction is quenched by TCA that contains carrier PPi. In the second step, the 32P-incorporated ATP is adsorbed by activated charcoal. The activated charcoal can be in the form of powder slurry (or charcoal paper, described in Alternate Protocol 1). The amount of radioactive ATP adsorbed is then measured by Cherenkov counting (or by PhosphorImaging, described in Alternate Protocol 1). Figure 2 outlines Basic and Alternate Protocols 1. Using these experiments, ATP:PPi exchange rates can be measured and quantitative analysis extracted. These protocols are derived from previously published procedures (Bruzzese, 2009; Haas, 1982; Wang, 2010).
Figure 2.

Outline of Basic and Alternate Protocols 1. Both assays are used to measure E1-catalyzed ATP:PPi exchange rate but the detection method for the radioactive ATP produced in the reactions are different. Steps 1–6 are the same for both protocols. In Basic Protocol 1, after the reaction is quenched, [32P]ATP is adsorbed by a charcoal slurry and detected using Cherenkov counter. In Alternate Protocol 1, the [32P]ATP is adsorbed in an activated charcoal paper and detected using a PhosphoImager.
Materials
5X Buffer A (see recipe)
50 mM ATP (Sigma)
50 mM [32P]PPi (Perkin Elmer Life Sciences)
100 μM SUMO (see Support Protocol)
10 μM E1 enzyme (see Support Protocol)
50 mM Tris-HCl (pH 7.5)
Pyrophosphate sodium salt (PPi) (Sigma)
5% Trichloroacetic acid (TCA) containing 4 mM carrier PPi
2% Trichloroacetic acid (TCA)
10% (w/v) Slurry of activated charcoal (Sigma) in 2% TCA
Milli-Q-purified water
37 ºC Heat block
1.5 ml Sterile microcentrifuge tubes
Micropipette
Ice bucket
Microcentrifuge (Eppendorf)
Cherenkov counter (Beckman LS6500 Scintillation counter)
Set up of the ATP:PPi isotope exchange assays
-
1
Equilibrate heat block to 37 ºC.
-
2
Prepare 100 μM SUMO in 50 mM Tris-HCl (pH 7.5).
-
3
Prepare 10 μM E1 in 50 mM Tris-HCl (pH 7.5).
-
4
Prepare 50 μl reactions in a 1.5 ml sterile tube on ice as follows:
10 μl of 5X Buffer A
1 μl of 50 mM ATP
1 μl of 50 mM [32P]PPi
5 μl of 100 μM SUMO
1 μl of 10 μM E1 enzyme
-
32 μl Milli-Q-purified water
SUMO concentration-dependent ATP:PPi exchange assays is necessary to extract enzyme kinetic properties (i.e., kcat and K1/2). For this assay, all conditions are the same as above except that SUMO is added at increasing concentrations (0.1–800 μM).If there are many reactions, a master mix should be prepared that lacks a key component such as SUMO in this case to minimize pipetting error and ensure uniformity in each tube. It is desirable to make a 10% larger volume of master mix than needed for the number of reactions to ensure a sufficient amount is prepared.
-
5
Gently tap the tube to mix, and transfer to a 37 ºC heat block for 20 min to start the reaction.
Preliminary experiments demonstrated that a 20 min reaction time gave a linear relationship between the ATP:PPi exchange rate versus reaction time (i.e., the ATP:PPi exchange level reflected initial exchange rates). -
6
After 20 min, transfer tube onto ice. Quench the reaction with 500 μl 5% TCA containing 4 mM carrier PPi (not radioactive).
Transfer of 32P-incorporated ATP to the activated charcoal slurry
-
7
Transfer the quenched reaction to the microcentrifuge tube containing 300 μl of 10% (w/v) slurry of activated charcoal in 2% TCA.
-
8
Briefly microcentrifuge the slurry to separate the charcoal from the reaction mixture.
-
9
Discard the supernatant.
-
10
Add 1 ml 5% TCA containing 4 mM carrier PPi.
-
11
Briefly microcentrifuge the slurry to separate the charcoal from the reaction mixture.
-
12
Repeat steps 9–11 three times.
-
13
Measure the retained radioactive [32P]ATP in the charcoal using Cherenkov counter.
Cherenkov count values are corrected from the background control counts. The counts in the absence of the substrate, SUMO, should be used as the background control. Concentration of ATP can be calibrated using [32P]PPi of a known concentration. -
14
Data analysis.
Plot the ATP:PPi exchange rate (pmole/min) against SUMO concentration before the onset of SUMO substrate inhibitory effect (Fig.3A). To determine K1/2 and Vmax before the onset of SUMO inhibition, construct a double reciprocal (Lineweaver-Burk) plot of 1/Exchange rate as a function of substrate concentration, 1/[SUMO], and fit the data to the Michaelis-Menten equation (Fig. 3B). K1/2 values extracted from the plots reflect both the internal rates and equilibrium constants for the formation of the ternary E1-AMP-SUMO complexes. kcat (kcat = Vmax/[E1]) is the turnover number and denotes the maximum number of E1 enzymatic reactions catalyzed per second.
Figure 3.

Plots of E1-catalyzed ATP:PPi isotope exchange assay at different SUMO concentrations. The plots are generated based on the assays outlined in Basic and Alternate Protocols 1. (A) Plot of rate of ATP:PPi exchange (pmole/min) versus SUMO concentration (μm). (B) Double-reciprocal (Lineweaver-Burk) plot of (A) to linearized the data and determine the kinetic constants (K1/2 and Vmax).
ALTERNATE PROTOCOL 1
DETERMINATION OF SUMO ADENYLATION BY QUANTITATIVE ATP:PPi ISOTOPE EXCHANGE ASSAY USING PHOSPHORIMAGING
In this protocol, the set up of the ATP:PPi isotope exchange assays is the same as for Basic Protocol 1. After the reaction is quenched in step 6, it is transferred to an activated charcoal paper and imaged by PhosphorImager. The protocol is adapted from a published method (Bruzzese et al., 2009).
Additional Materials
5% TCA containing 10 mM carrier PPi
B-safe activated charcoal paper (Whatman)
Multichannel pipette (Eppendorf)
Plastic wrap (Saran)
Dot/slot blotting manifold (Bio-rad Bio-Dot SF or Schleicher and Schuell Minifold-II)
Vacuum Pump (GAST Manufacturing)
Flat bottom dish (Pyrex)
Rocking shaker (Reliable Scientific, Inc.)
PhosphorImaging plate (20x25 cm) (GE Life Sciences)
Typhoon phosphorImager (GE Life Sciences)
Image Reader 1.8 and Multi Gauge 3.1 Softwares (Fuji Film Life Sciences)
Set up of the ATP:PPi isotope exchange assays
-
1
Set up reactions as in Basic Protocol 1 (steps 1 to 6).
Transfer of 32P-incorporated ATP to the activated charcoal paper
-
2
Soak the activated charcoal paper in 2% TCA containing 10 mM carrier PPi for 10 min.
The presoaking step is crucial because it not only improves spot resolution and but also reduces background counts by blocking binding of unreacted [32P]PPi in the charcoal paper. -
3
Place the charcoal paper in between the filter support and sample well plates of the dot-blot manifold. Assemble the apparatus.
-
4
Apply vacuum for a few seconds to remove excess solution from the wells.
-
5
Transfer the quenched reactions to the dot-blot wells using a multichannel pipette.
-
6
Apply vacuum gently to completely draw the samples through the wells.
If the vacuum is too strong, solution may pass through charcoal paper without proper binding of ATP. -
7
Wash the sample in situ with 1 ml 2% TCA containing 10 mM carrier PPi.
-
8
Remove charcoal paper from the manifold and place in a flat-bottom dish.
-
9
Rinse with 100 ml 2% TCA containing 10 mM carrier PPi for 5 min with agitation in the rocking shaker. Repeat six times.
-
10
After washing, briefly dry the charcoal paper.
-
11
Expose the charcoal paper to the PhosphorImaging plate for 1 h.
The exposure time can vary based on the radioactivity of the sample. -
12
After exposure, visualize and quantify the autoradiograph (spot intensities) on the PhosphorImager. Autoradiographs can be analyzed using an image quantitation software. Data analysis is the same as Basic Protocol 1 step 14.
BASIC PROTOCOL 2
DETERMINATION OF E1-CATALYZED ATP:AMP EXCHANGE RATES WITH THIN LAYER CHROMATOGRAPHY
This assay provides information on both the adenylation and thioester formation steps of the E1-catalyzed reactions. Radioactive [14C]AMP is used in the ATP:AMP exchange assay so that production of ATP from radioactive AMP can be monitored. The protocol consists of setting up the ATP:AMP exchange assay, quenching it with urea to denature the proteins present in the reaction mixture, separating the AMP from ATP by thin layer chromatography and subjecting it to PhosphorImaging analysis. The outline for this protocol is shown in Fig. 4. This protocol is derived from previously published procedures (Wang, 2009).
Figure 4.

ATP:AMP exchange assay using thin layer chromatography. This scheme illustrates the steps describes in Basic Protocol 2. The reaction mixture containing radioactive [14C]AMP was incubated at 37 ºC for 10 min and then quenched with 8 M urea. Three 4 μl aliquots were taken from the reaction mixture and loaded onto a PEI-cellulose TLC plate. The radioactive AMP and radioactive ATP were separated by a mixture of 0.5 M LiCl and 1 M formic acid (v/v) and imaged using a PhosphorImager. AMP and ATP were separated based from their retention factor (Rf). AMP has a higher Rf value compared to ATP.
Materials
5X Buffer A (see recipe)
10 mM ATP (Sigma)
1 mM AMP (Sigma)
200 μM PPi (Pyrophosphate sodium salt, not radioactive) (Sigma)
20 μM SUMO (see Support Protocol)
10 μM E1 enzyme (see Support Protocol)
[14C]AMP (Perkin Elmer Life Sciences)
50 mM Tris-HCl, pH 7.5
8 M Urea (Sigma)
0.5 M LiCl/1 M Formic acid solution (v/v) (Sigma)
Milli-Q-purified water
37 ºC Heat block
1.5 ml Sterile microcentrifuge tubes
Ice bucket
Polyethyleneimine (PEI) cellulose thin layer chromatography (TLC) plate, (10x20 cm) (Sigma)
Glass developing chamber
Fume Hood
PhosphorImaging plate (20x25 cm) (GE Life Sciences)
Typhoon phosphorImager (GE Life Sciences)
Set up of the ATP:AMP exchange assays
-
1
Equilibrate heat block to 37 ºC.
-
2
Prepare 20 μM SUMO in 50 mM Tris-HCl (pH 7.5).
-
3
Prepare 10 μM E1 in 50 mM Tris-HCl (pH 7.5).
-
4
Prepare 20 μl reactions in a 0.5 ml sterile microcentrifuge tube on ice as follows:
4 μl of 5X Buffer A
1 μl of 10 mM ATP
1 μl of 1 mM AMP
1 μl of 200 μM PPi
2 μl of 20 μM SUMO
2 μl of 10 μM E1
1 μl of 1 mM [14C]AMP
-
8 μl Milli-Q-purified water
If there are many reactions, a master mix can be prepared to minimize pipetting and ensure uniformity in each tube.
-
5
Gently tap the tube to mix, and transfer to a 37 ºC heat block for 10 min to start the reaction.
-
6
After 10 min, stop the reaction by adding 20 μL 8 M urea.
ATP and AMP separation by thin layer chromatography
-
7
Take three 4 μl aliquot from the reaction sample and load onto a PEI-cellulose TLC plate.
-
8
Place the PEI-cellulose TLC plate inside the developing chamber containing a solution of 0.5 M LiCl/1 M Formic acid (v/v) for 1 h. Do this inside the fume hood.
-
9
Air-dry the TLC plate for about 45 min inside the fume hood.
-
10
Expose the completely dried TLC plate to the PhosphorImaging plate overnight.
-
11
Document the data using a PhosphorImager.
The amount of [14C]ATP produced in the reaction is determined from the ratio of spot intensities between [14C]ATP and the unreacted [14C]AMP. The retention factor (Rf) of AMP is larger than ATP (Fig.4). The retention factor is the ratio of the distance moved by the sample (i.e. AMP or ATP) above the origin to the distance of the solvent front moved above the origin (Rf = distance AMP or ATP moved/distance of solvent).
BASIC PROTOCOL 3
DETERMINATION OF E1•SUMO CONJUGATES BY GEL-BASED ASSAY
This protocol describes a gel-based assay to detect the formation of E1•SUMO conjugates. The E1•SUMO thioester can be visualized by Coomassiebased staining and/or immunoblotting. Only the SimplyBlue/Coomassie-based assay is described in detail in this protocol. For the Western blot-based assay, anti-SAE2 and/or anti-SUMO1 antibody can be used. This protocol is derived from previously published procedures (Wang, 2007).
Materials
10X ATP regeneration system (see recipe)
100 μM SUMO (see Support Protocol)
50 μM E1 enzyme (see Support Protocol)
0.5 ml Sterile microcentrifuge tubes
50 mM Tris-HCl (pH 7.5)
Milli-Q-purified water
2X SDS sample buffer (with and without DTT) (see recipe)
4–12% Bis-Tris gradient gel (Invitrogen)
NuPAGE MOPS SDS running buffer (Invitrogen)
SimplyBlue Stain (Invitrogen) or Coomassie-based stain
37 ºC and 95 ºC Heat block
Ice bucket
20 μl Micropipette
SDS-PAGE apparatus (Invitrogen)
Rocking shaker (Reliable Scientific, Inc.)
GS-800 Densitometer (Bio-Rad)
Set up of the E1•SUMO conjugation assays
Equilibrate heat block to 37 ºC.
Prepare 100 μM SUMO in 50 mM Tris-HCl (pH 7.5).
Prepare 50 μM E1 in 50 mM Tris-HCl (pH 7.5).
-
Prepare 20 μl reactions in a 0.5 ml sterile microcentrifuge tube on ice as follows:
2 μl of 10X ATP regeneration system
4 μl of 100 μM SUMO
2 μl of 50 μM E1
-
12 μl Milli-Q-purified water
If there are many reactions, a master mix can be prepared to minimize pipetting and ensure uniformity in each tube.
Gently tap the tube to mix, and transfer to the 37 ºC heat block for 10 min to start the reaction.
After 10 min, transfer tube onto ice. Divide the reaction mixture into two aliquots.
Add 10 μl of non-reducing 2X SDS sample buffer (without DTT) to 10 μl of the reaction mix to stop the reaction.
-
Add 10 μl of reducing 2X SDS sample buffer (with DTT) to the other 10 μl of the reaction mixture to stop the reaction. Heat at 95 ºC for 5 min.
DTT reduces the thioester bond between the SAE2 subunit of E1 and SUMO (eq 6). This sample serves as a control to identify the SAE2•SUMO thioester conjugate band in the gel.
[6] Resolve the reactions in a 4–12% Bis-Tris gradient gel with equilibration at 120V for 10 min and resolving at 168V for 55 min using the SDS-PAGE apparatus.
Place gel in a plastic covered gel box and rinse for 5 min in water with gentle shaking three times.
Decant water. Stain the gel with SimplyBlue stain for 30 min at room temperature with gentle shaking.
Decant SimplyBlue stain and rinse the gel with water two to three times.
-
Scan the gel using the densitometer.
A representative result of the gel-based E1•SUMO conjugation assay is shown in Fig. 5. Because this experiment simple and quick to do, it is frequently used to detect dramatic change of enzyme activity.
Figure 5.
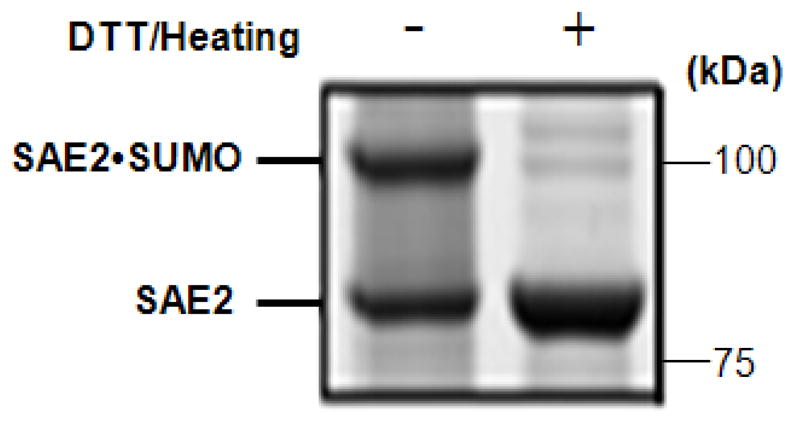
E1•SUMO thioester formation assay. Half of the reaction mixture (see Basic Protocol 3) was added to 2X SDS sample buffer containing no DTT and loaded directly onto an SDS-PAGE gel (left lane), while the other half was mixed with 2X SDS sample buffer containing 100 mM DTT and heated at 95 °C for 5 min (right lane) before loading onto the gel. The sample on the right lane is a control to identify the thioester bond between the SAE2 subunit of E1 and SUMO. This assay can quickly detect dramatic changes of E1 activity, and determine the percentage of active E1.
BASIC PROTOCOL 4
DETECTION OF SUMO THIOESTER TRANSFER FROM E1 TO E2 (UBC9)
This protocol describes a gel-based assay in combination with fluorescent detection to monitor the transfer of SUMO from E1 to E2 (Ubc9). Outline of the assay is illustrated in Fig. 6. Fluorescent-labeled SUMO is used in this assay. The first step in this protocol involves the formation of the E1•SUMO thioester conjugate, similar to Basic Protocol 3. EDTA is then added to remove Mg2+, which in turn inhibits further ATP-dependent E1 activity. Then, Ubc9 is added and samples are taken at different time points, mixed with 2X SDS buffer containing 8 M urea and resolved by SDS-PAGE gel electrophoresis. The fluorescent image of the gel is scanned using an infrared imaging system and the amount of SUMO transferred from E1 to E2 is determined by the fluorescent-labeled SUMO. Alternatively, SUMO transfer can be detected using unlabeled SUMO followed by immunoblotting with an anti-SUMO antibody or by I125-labeled SUMO followed by PhosphorImaging. This protocol is derived from previously published procedures (Wang, 2007).
Figure 6.

Detection of Alexa680-labeled SUMO transfer from E1 to E2 (Ubc9). E1•SUMO thioester is formed initially as described in Basic Protocol 4. Then the reaction is quenched with EDTA, and E2 (Ubc9) was added to a final concentration of 0.2 μM. Aliquots of the reaction mixture were withdrawn at 0, 15, 30, 45 and 60 s after E2(Ubc9) addition and mixed with 2X SDS sample buffer (containing no DTT) with 8 M urea. Steps 8 and 9 should be performed at 4 ºC. Formation of the E2•SUMO complex was resolved by gel electrophoresis and visualized with the Odyssey infrared imaging system. Quantification of the transfer assays was carried out using ImageQuant 5.2 software.
Materials
10X ATP regeneration system (see recipe)
50 μM Alexa680 fluorescent-labeled SUMO (Invitrogen)
10 μM E1 enzyme (see Support Protocol)
50 mM Tris-HCl (pH 7.5)
500 mM EDTA (pH 8.0)
10 μM E2 (Ubc9) (see Support Protocol)
Milli-Q-purified water
2X SDS sample buffer with 8 M Urea (see recipe)
4–12% Bis-Tris gradient gel (Invitrogen)
NuPAGE MOPS SDS running buffer (Invitrogen)
37 ºC heat block
Micropipette
0.5 ml Sterile microcentrifuge tubes
Ice bucket
4 °C Cold room
SDS-PAGE apparatus (Invitrogen)
Rocking shaker (Reliable Scientific, Inc.)
Odyssey infrared imaging system (Li-Cor Biosciences)
ImageQuant5.2 software (GE Life Sciences)
Set up of the E1•SUMO thioester complex formation assays
-
1
Equilibrate heat block to 37 ºC.
-
2
Prepare 50 μM Alexa680 fluorescent-labeled SUMO in 50 mM Tris-HCl (pH 7.5).
-
3
Prepare 10 μM E1 in 50 mM Tris-HCl (pH 7.5).
-
4
Prepare 50 μl reactions in a 0.5 ml sterile microcentrifuge tube on ice as follows:
5 μl of 10X ATP regeneration system
1 μl of 50 μM Alexa680 fluorescent-labeled SUMO
5 μl of 10 μM E1
-
39 μl Milli-Q-purified water
If there are many reactions, a master mix can be prepared to minimize pipetting and ensure uniformity in each tube.
-
5
Gently tap the tube to mix, and transfer to the 37 ºC heat block for 15 min to start the reaction.
-
6
After 10 min, transfer tube onto ice. Quench E1 activity by adding 3 μl of 500 mM EDTA to reach a final EDTA concentration of 30 mM.
Set up of the SUMO transfer assays from E1 to E2 (Ubc9)
The reaction rates for the transfer assays of SUMO from E1 to Ubc9 are fast. Therefore, all solutions and equipment used in the subsequent steps are cooled at 4 ºC before addition of E2 (Ubc9) to slow down the reaction. All assays are carried out in a cold room.
-
7
Prepare 10 μM Ubc9 in 50 mM Tris-HCl (pH 7.5).
-
8
Add 1 μl of 10 μM Ubc9 to the E1•SUMO/EDTA mixture to start the reaction.
-
9
Take 10 μl aliquots at different time points (0, 15, 30, 45 and 60 s). Stop the reaction at the different time points by adding an equal volume of 2X SDS sample buffer with 8 M urea.
-
10
Resolve the E2•SUMO thioester conjugate in a 4–12% Bis-Tris gradient gel with equilibration at 120V for 10 min and resolving at 168V for 55 min using the SDS-PAGE apparatus.
-
11
Briefly wash the gel with water with gently shaking prior to imaging.
-
12
Scan the gel at 680nm using the Odyssey infrared imaging system to detect the SUMO-adducts (E1•SUMO and E2•SUMO).
-
13
Data analysis.
E1•SUMO and E2•SUMO intensities are quantified using the ImageQuant 5.2 software. The percentage of SUMO transferred from E1 to E2 is calculated from the percentage of the band intensity of E1•SUMO over the sum of free SUMO and E2•SUMO. Representative data for this assay is shown in Fig. 6.
BASIC PROTOCOL 5
DETERMINATION OF E2•SUMO THIOESTER FORMATION
This protocol describes the E2•SUMO conjugation assay using SimplyBlue or Coomassie-based staining. Alternatively, Western blot can be used to detect the Ubc9•SUMO thioester conjugate using anti-SUMO or anti-Ubc9 antibody. Non-reducing sample buffer should be used to preserve the E2•SUMO thioester conjugate.
Materials
10X ATP regeneration system (see recipe)
100 μM SUMO (see Support Protocol)
1 μM E1 enzyme (see Support Protocol)
100 μM Ubc9 (see Support Protocol)
50 mM Tris-HCl (pH 7.5)
Milli-Q-purified water
2X SDS sample buffer
4–12% Bis-Tris gradient gel (Invitrogen)
NuPAGE MOPS SDS running buffer (Invitrogen)
SimplyBlue Stain (Invitrogen)
0.5 ml Sterile microcentrifuge tubes
37 ºC Heat block
Ice bucket
20 μl Micropipette
Rocking shaker (Reliable Scientific, Inc.)
SDS-PAGE apparatus (Invitrogen)
GS-800 densitometer (Bio-Rad)
Set up of the Ubs9·SUMO thioester conjugate formation assays
Equilibrate heat block to 37 ºC.
Prepare 100 μM SUMO in 50 mM Tris-HCl (pH 7.5).
Prepare 1 μM E1 in 50 mM Tris-HCl (pH 7.5).
Prepare 100 μM Ubc9 in 50 mM Tris-HCl (pH 7.5).
-
Prepare 20 μl reactions in a 0.5 ml sterile microcentrifuge tube on ice as follows:
2 μl of 10X ATP regeneration system
4 μl of 100 μM SUMO
1 μl of 1 μM E1
2 μl of 100 μM Ubc9
-
11 μl Milli-Q-purified water
If there are many reactions, a master mix can be prepared to minimize pipetting and ensure uniformity in each tube.
Gently tap the tube to mix. Take 5 μl from the reaction mixture and add 5 μl 2X SDS sample buffer to stop the reaction. This is sample for zero time point.
Transfer remaining mixture to 37 ºC heat block for 15 min to start the reaction. Take 5 μl after 2 min incubation and add equal volume 2X SDS sample buffer to stop reaction. This is sample for the 2 min time point.
After 15 min, transfer tube onto ice. Take out 5 μl and add equal volume 2X SDS sample buffer to stop the reaction. This is sample for the 15 min time point.
Resolve the reactions with a 4–12% Bis-Tris gel with equilibration at 120V for 10 min and resolving at 168V for 55 min using the SDS-PAGE apparatus.
Place gel in a plastic covered gel box and rinse for 5 min in water with gentle shaking three times.
Decant water. Stain the gel with SimplyBlue stain for 30 min at room temperature with gentle shaking.
Decant SimplyBlue stain and rinse the gel with water two to three times.
-
Scan the gel using the densitometer.
A representative result of the assay is shown in Fig. 7.
Figure 7.

E2 (Ubc9)•SUMO thioester formation assay. The reaction mixture (see Basic Protocol 5) was incubated at 37 °C for 0, 2 and 15 min. Reactions were quenched using 2X SDS buffer. The bands were resolved by SDS-gel electrophoresis and stained with SimplyBlue. This assay can provide a quick assessment of all SUMOylation steps prior to E2•SUMO thioester formation.
BASIC PROTOCOL 6
DETECTION OF SUBSTRATE- SUMO ISOPEPTIDE FORMATION
This protocol describes an immunoblot-based assay to detect substrate-SUMO isopeptide formation in the absence of an E3 ligase. In this assay, RanGAP1 is use as the substrate (target protein) because it can be efficiently modified by SUMO in the absence of an E3 ligase. Only the 418–587 fragment of RanGAP1 is used. This assay is designed to conduct steady-state kinetics to examine E1-catalyzed transthiolation. Formation of the RanGAP1-SUMO isopeptide is determined under E2-limiting conditions. This protocol is derived from previously published procedures (Wang, 2007).
Materials
10X ATP regeneration system (see recipe)
100 μM SUMO (see Support Protocol)
1 μM E1 enzyme (see Support Protocol)
250, 400, and 625 nM Ubc9 (see Support Protocol)
100 μM RanGAP1 (see Support Protocol)
50 mM Tris-HCl (pH 7.5)
Milli-Q-purified water
2XSDS sample buffer with DTT
4–12% Bis-Tris gradient gel (Invitrogen)
NuPAGE MOPS SDS running buffer
Mouse monoclonal primary antibody against SUMO-1 (Abgent)
IRDye 680-labeled secondary antibody (Li-Cor Biosciences)
Phosphate Buffered Saline (PBS) (see recipe)
Phosphate Buffered Saline Tween-20 (PBST) (see recipe)
Blocking buffer (Odyssey, Li-Cor Biosciences)
37 ºC heat block
Ice bucket
Micropipette
SDS-PAGE apparatus (Invitrogen)
Rocking shaker (Reliable Scientific, Inc.)
0.2 μM PVDF trans-blot turbo membrane (Bio-Rad)
Trans-blot turbo transfer system apparatus (Bio-Rad)
Odyssey infrared imaging system (Li-Cor Biosciences)
ImageQuant 5.2 software (GE Life Sciences)
Set up of the RanGAP1-SUMO isopeptide complex formation assays
Equilibrate heat block to 37 ºC.
Prepare 100 μM SUMO in 50 mM Tris-HCl (pH 7.5).
Prepare 1 μM E1 in 50 mM Tris-HCl (pH 7.5).
Prepare 100 μM RanGAP1 in 50 mM Tris-HCl (pH 7.5).
Prepare 250, 400 and 625 nM stock solutions of wild-type Ubc9 in 50 mM Tris-HCl (pH 7.5).
Pipet 2 μl from each Ubc9 stock solution and transfer to separate 0.5 ml sterile microcentrifuge tubes. Pipet 2 μl 50 mM Tris-HCl (pH 7.5) to another 0.5 ml sterile microcentrifuge tube (control sample without Ubc9).
-
The materials for one assay are as follows:
2 μl of 10X ATP regeneration system
1 μl of 100 μM SUMO
2 μl of 1 μM E1
2 μl of 100 μM RanGAP1
-
11 μl Milli-Q-purified water
Preliminary assays were carried out to determine the appropriate E1 concentration range used in this assay in which the rate of RanGAP1-SUMO formation is linearly dependent on the E1 concentration. The optimal incubation time for the reaction mixture was also determined for the examination of initial rates of RanGAP1-SUMO formation.
Take 18 μl aliquot from the master mix and transfer to each of the tubes with different concentrations of Ubc9 from step 6. Thus, each tube has 0, 25, 40, and 62.5 nM Ubc9 final concentration. Each assay condition is repeated three times.
Gently tap the tubes to mix, and transfer to the 37 ºC heat block for 10 min to start the reaction.
After 10 min, transfer tubes onto ice. Add 20 μl of 2X SDS sample buffer with DTT to each of the 20 μl reaction mixtures to stop the reaction.
Resolve the reactions with a 4–12% Bis-Tris gradient gel with equilibration at 120V for 10 min and resolving at 168V for 55 min using the SDS-PAGE apparatus.
Transfer proteins from the gel to the 0.2 μM PVDF Trans-blot turbo membrane using the Trans-blot turbo transfer apparatus.
After the transfer, incubate the PVDF Trans-blot turbo membrane in 10 ml of blocking buffer for 45 min at room temperature on a rocking platform.
After blocking, add the Mouse monoclonal primary antibody against SUMO-1 (dilute 1:1000) to the PVDF Trans-blot turbo membrane with blocking buffer.
Incubate for 45 min at room temperature with gentle rocking or overnight at 4 °C.
Wash the membrane three times with 10 ml PBST for 5 min each time with gentle rocking at room temperature.
Incubate the membrane with the IRDye 680-labeled secondary antibody (dilute 1:5000) in blocking buffer for 45 min at room temperature with rocking.
Gently wash the membrane three times with 10 ml PBST for 15 min each time at room temperature with rocking.
Scan the gel at 680nm with Odyssey infrared imaging system and quantify the SUMO-RanGAP1 bands using ImageQuant 5.2 software.
-
Data analysis.
The amount of RanGAP1-SUMO formed in each reaction is calculated as the percentage of the band intensity of RanGAP1-SUMO over the sum of free SUMO and RanGAP1-SUMO. Kinetic constants (Km and Vmax) are extracted from the linear fittings in the Lineweaver-Burk plot of RanGAP1-SUMO formed per minute against Ubc9 concentrations.
BASIC PROTOCOL 7
DETERMINATION OF SUBSTRATE SUMOYLATION IN THE PRESENCE OF E3
This assay describes the SUMOylation of the substrate, GST-Sp100, in the presence of an E3 ligase, RanBP2. The IR1-M domain (residues 2637–2710) of RanBP2 is used in this assay. This protocol can be modified by using different E3 ligases and target proteins of interest. When transfer of SUMO from Ubc9 to substrate is the rate-limiting step, this assay can be used to conduct steady-state kinetics to examine the transfer of SUMO from E2 to substrate. This protocol is derived from previously published procedures (Truong et al., 2011).
Materials
5X Assay buffer (see recipe)
250 μM SUMO (see Support Protocol)
8 μM E1 enzyme (see Support Protocol)
3.5 μM E2 (Ubc9) (see Support Protocol)
21, 42, 56, and 84 μM GST-Sp100 (see Support Protocol)
25μM RanBP2 (see Support Protocol)
70 mM ATP (Sigma)
50 mM Tris-HCl (pH 7.5)
Milli-Q-purified water
2X SDS sample buffer with DTT
4–12% Bis-Tris gradient gel (Invitrogen)
NuPAGE MOPS SDS running buffer (Invitrogen)
Mouse monoclonal primary antibody against SUMO-1 (Abgent)
Donkey anti-mouse secondary antibody (Abgent)
Phosphate Buffered Saline (PBS) (see recipe)
Phosphate Buffered Saline Tween-20 (PBST) (see recipe)
Blocking buffer (Odyssey, Li-Cor Biosciences)
Heat blocks 25, 28, 31 and 37 °C
0.5 and 1.0 ml Sterile microcentrifuge tubes
Ice bucket
Micropipette
Rocking shaker (Reliable Scientific, Inc.)
SDS-PAGE apparatus (Invitrogen)
0.2 μM PVDF trans-blot turbo membrane (Bio-Rad)
Trans-blot turbo transfer system apparatus (Bio-Rad)
Odyssey infrared imaging system (Li-Cor Biosciences)
ImageQuant 5.2 software (GE Life Sciences)
Set up of the GST-Sp100 SUMOylation assays
Equilibrate heat blocks to appropriate temperature (25, 28, 31 and 37 °C).
Prepare 250 μM SUMO in 50 mM Tris-HCl (pH 7.5).
Prepare 8 μM E1 in 50 mM Tris-HCl (pH 7.5).
Prepare 3.5 μM Ubc9 in 50 mM Tris-HCl (pH 7.5).
Prepare 21, 42, 56, and 84 μM GST-Sp100 stock solutions in 50 mM Tris-HCl (pH 7.5).
Prepare 25 μM RanBP2 in PBS.
-
one assay contains the following:
4 μl of 5X Assay buffer
2 μl of 250 μM SUMO
2 μl of 8 μM E1
1 μl of 3.5 μM Ubc9
2 μl of 25 μM RanBP2
1 μl of 70 mM ATP
-
6 μl Milli-Q-purified water
If there are many reactions, a master mix should be prepared containing 10% extra of the needed materials to minimize pipetting and ensure uniformity in each tube.
Add 2 μl of the desired concentrations of GST-Sp100 stock solution to each assay tube.
-
Gently tap the tubes to mix, and transfer to heat block heated at appropriate temperature (25, 28, 31 and 37 °C) for 3 min to start the reaction.
The reaction time should be chosen, so that the product formation should be linear with time in order to estimate the initial rates for steady-state kinetic analysis. Transfer tubes onto ice. Add 20 μl of 2X SDS sample buffer with DTT to 20 μl reaction mix to stop the reaction.
Resolve the reactions with a 4–12% Bis-Tris gel with equilibration at 120V for 10 min and resolving at 168V for 55 min using the SDS-PAGE apparatus.
Detect reaction products by Western blot using Li-Cor system following manufacturer’s instructions.
-
Data analysis.
The GST-Sp100-SUMO formation at different concentrations of GST-Sp100 and temperatures can be quantified from the Western blot gel. The net transfer rate constants (k = kcat/Km) for the transfer of SUMO from E2 to substrate can be measured using the plot of [E]/V0 versus the inverse of substrate concentrations, where [E] is Ubc9 concentration and V0 is the initial rate. The rate constants directly reflect the E3-dependent step when the step is rate-limiting for the overall conjugation reactions. A representative plot of the result is shown in Fig. 8.
Figure 8.

Temperature-dependent kinetic measurements of the E3 ligase (RanBP2). Assay conditions are described in Basic Protocol 7. (A) Immunoblots used to detect GST-Sp100-SUMO conjugation at four Sp100 concentrations (2.1, 4.2, 4.6 and 8.4 μM) and at different temperatures (25, 28, 31, and 373C). (B) Plots of [E]/Vo versus 1/[GST-Sp100] based on data from (A) are linear which is indicates that the conditions are appropriate for Michaelis-Menten kinetics. The Km/kcat ratios are measured from the slope of the double-reciprocal plots (Lineweaver-Burk), and correspond to the net transfer rate constant for SUMO transfer from E2 to substrates.
BASIC PROTOCOL 8
HIGH THROUGHPUT SCREENING ASSAY TO MONITOR SUMOYLATION
This protocol describes a Time-Resolved Fluorescence Resonance Energy Transfer (TR-FRET) biochemical assay to monitor protein SUMOylation using ATP, GST-SUMO and His-RanGAP1 proteins as the substrates. The outline of this assay is shown in Fig. 9. This ultra-high throughput 1536-well homogenous assay is based on detection of the covalent bond formation between GST-SUMO and His-RanGAP1 proteins by the coupled E1–E2 enzymes in an E3-independent manner.
Figure 9.

TR-FRET biochemical assay to monitor protein SUMOylation.
Materials
HTS assay buffer (see recipe)
35.5 μM E1 enzyme (see Support Protocol)
222 μM E2 (Ubc9) (see Support Protocol)
368 μM GST-SUMO (see Support Protocol)
30.8 μM His-RanGAP1 (see Support Protocol)
ATP (Sigma)
DMSO (Sigma)
20 mM test compounds in DMSO
500 mM KF
Anti-GST XL665-labeled antibody (Cis-Bio Bioassays)
Anti-His Europium-labeled antibody (Cis-Bio Bioassays)
1536-well white plate (Corning)
Multidrop Combi dispenser (Thermo Scientific)
HighRes biosolutions pintool (Thermo Scientific)
Microplate reader (BMG Labtech Pherastar)
CBIS software (ChemInnovations, Inc.)
Prepare Mixture 1
-
1
Prepare a 15 ml mixture containing 37.5 nM E1,100 nM His-RanGAP1 and 20 nM Anti-GST antibody labeled with XL665 in HTS assay buffer.
The GST antibody labeled with XL665 is a modified allophycocyanin which is the HTRF® (Homogeneous Time Resolved Fluorescence) primary acceptor fluorophore in this assay.
Prepare Mixture 2
-
2
Prepare a 15 ml mixture containing 20 mM ATP, 12.5 Ubc9 (E2), 30 nM GST-SUMO and 4 nM Anti-His Europium-labeled antibody in HTS assay buffer.
TR-FRET HTS Assay Procedure
-
3
Dispense 2 μl HTS assay buffer into columns 1 and 2, and 2 μl Mixture 1 into columns 3–48 of the 1536-well assay plate using a multidrop Combi dispenser.
-
4
Dispense 70 nl of 2 mM compounds in DMSO to columns 5–48 using a HighRes biosolutions pintool.
-
5
Dispense 70 nl of DMSO to columns 1–4, using a HighRes biosolutions pintool.
-
6
Dispense 2 μl Mixture 2 to all wells using a Multidrop Combi dispenser.
-
7
Incubate plate for 30 min at room temperature.
-
8
Add 1 μl of 500 mM KF to each well.
KF protects Europium cryptate (present in secondary antibody) by preventing the action of possible quenchers contained in the assay at the time of fluorescence measurement. It is only required during fluorescence readout; hence, it is dispensed just before counting. -
9
Read plate on a BMG Labtech PheraStar microplate reader in a homogeneous time-resolved fluorescence mode (Excitation: 337 nm; Emission 620/665 nm).
The ratio of fluorescence 665 over 620 is used as the detection readout of the assay. In HTRF® detection, emissions are measured at two different wavelengths (620nm and 665nm). This feature serves for reducing well-to-well variations and signal quenching from assay components and medium variability. Emissions at 620nm (donor fluorophore) are used as an internal reference while emissions at 665nm (acceptor fluorophore) are used as an indicator of the biological reaction being assessed. Because both the 620nm and 665nm emissions are decreased by compound interferences, the ratio remains unchanged. Thus, utilization of the ratio corrects for nonspecific signal interference effects. -
10
Data analysis can be performed using CBIS software (ChemInnovations, Inc.)
The value of fluorescence at 620 nm for each sample should be normalized to the average fluorescence value at 620 nm in the plate negative control wells to calculate the F ratio parameter. The F ratio is the average fluorescence value at 620 nm in the plate negative control wells to calculate the F ratio parameter. F ratio is the ratio of fluorescence emission at 665nm to the emission at 620nm (F = E680nm/E620nm × 104). The 104 multiplying factor is used solely for the purpose of easier data handling.
SUPPORT PROTOCOLS
All enzymes used in this unit are in recombinant forms either with His6-tag or GST-tag. Human His6-tagged proteins (SUMO, Ubc9, RanGAP1, RanBP2) were subcloned in pet28b (Novagen) and GST-tagged proteins (GST-SUMO and GST-Sp100) were subcloned in PGEXT-2T (GE Life Sciences) vectors, respectively. The SAE1 and SAE2 subunits of E1 were subcloned in pet11a (Novagen) and pet28b (Novagen), respectively. The full length E1 enzyme is used in all the assays in this unit. The recombinant plasmid harboring the gene of each enzyme is transformed in BL21-CodonPlus(DE-3) (Stratagene) to resolve codon bias problem that hinder the expression of heterologous proteins in E. coli expression host. Cell lysis was carried out using the BugBuster protein extraction reagent to gently disrupt the E. coli cell wall and liberate soluble proteins. This is a rapid and simple alternative to mechanical methods such as French press or sonication. Proteins were purified using affinity chromatography: NTA for His6-tagged proteins and glutathione sepharose for GST-tagged proteins. Protein purity was examined by SDS-PAGE electrophoresis. Pure proteins were then dialyzed against the buffer used for the assay with addition of DTT to prevent protein oxidation. Protein concentrations were determined based on the Bradford method.
Materials
Luria-Bertani (LB) broth (Sigma), (20g LB powder/1 L H2O), autoclaved
500 mg/ml Kanamycin stock solution (Fisher Scientific), 0.22 um filter-sterilized
100 mg/ml Ampicillin stock solution (Fisher Scientific), 0.22 um filter-sterilized
50 mg/ml Chloroamphenicol stock solution (Fisher Scientific) in ethanol, 0.22 um filter-sterilized
1 M Isopropyl-β-D-thiogalactopyranoside (IPTG) (Fisher Scientifics)
Milli-Q-water
Shaker Incubator (Thermo-Electron Corp.)
Ultracentrifuge (Beckman Avanti J-25I)
Spectramax M5 (Molecular Devices)
BugBuster 10X protein extraction reagent (Novagen)
Protease inhibitor cocktail (Roche)
2X Binding buffer (100 mM Tris-HCl, pH 7.5, 1 M NaCl, 10 mM Imidazole, and 0.04% NaN3)
2X GST binding buffer (100 mM Tris-HCl, pH 7.5, 1 M NaCl and 0.04% NaN3)
Benzonase (Novagen)
50 mM Phenylmethylsulfonyl fluoride (PMSF)
Dithiothreitol (DTT) (Sigma)
Chromatography column (10x100 mm) (Sigma)
Column stand with clamp
Ni-NTA resin (Qiagen)
Glutathione agarose resin (Amersham Biosciences)
Reduced glutathione (Sigma)
Wash buffer (50 mM Tris-HCl, pH 7.5, 500 mM NaCl, 20 mM Imidazole)
Elution buffer (50 mM Tris-HCl, pH 7.5, 500 mM NaCl, 300 mM Imidazole)
1X GST wash buffer (50 mM Tris, pH 7.5, 200 mM NaCl, 1 mM DTT)
GST elution buffer (50 mM Tris-HCl, pH 7.5, 1 mM DTT, 20 mM Glutathione reduced)
Dialysis buffer (50 mM Tris-HCl, pH 7.5, 5 mM DTT)
Phosphate buffered saline (PBS)
15 ml 10kD and 30kD Centricon (Millipore)
Cold room
2X SDS sample buffer with DTT
4–12% Bis-Tris gradient gel (Invitrogen)
NuPAGE MOPS SDS running buffer (Invitrogen)
SDS-PAGE apparatus (Invitrogen)
SimplyBlue Stain (Invitrogen)
1.5 ml Sterile microcentrifuge tubes
Bradford reagent (Bio-rad)
Bradford reagent (Bio-rad)
Expression and Purification of His-Tagged proteins (E1, SUMO, Ubc9, RanGAP1 and RanBP2)
-
1
Culture a single colony of freshly transformed cells in 25 ml of LB broth containing 0.5 mg/ml kanamycin and 0.05 mg/ml chloroamphenicol at 225 rpm for 12 hrs at 37 ºC. (For E1: LB broth contains 0.5 mg/ml kanamycin, 0.05 mg/ml chloroamphenicol and 0.1 mg/ml ampicillin).
-
2
Inoculate the 25 ml culture to 1 L of LB containing 0.5 mg/ml kanamycin and 0.05 mg/ml chloroamphenicol with continuous shaking at 225 rpm at 37 ºC until OD600 reach 0.6–0.7. (For E1: LB broth contains 0.5 mg/ml kanamycin, 0.05 mg/ml chloroamphenicol and 0.1 mg/ml ampicillin).
-
3
Induce the protein expression by adding 1 ml of 1 M IPTG for a final concentration of 1 mM in the culture.
-
4
Culture for another 4 hours at 225 rpm at 30 ºC. (For E1: temperature stays at 37 ºC)
-
5
Harvest the cell by centrifugation at 3000 rpm for 15 min using the ultracentrifuge. Discard the supernatant. Store the pellet at -80 ºC if lysis will be not performed on the same day.
Cell lysis
-
6
Move the bacterial pellet from step 5 to room temperature to thaw.
-
7
Prepare 20 ml lysis buffer as follows:
10 ml 2x Binding buffer
2 ml 10X Bugbuster 10X protein extraction reagent
8 ml water
2 tablets of Roche protease inhibitor cocktail
20 μl Benzonase
-
8
Resuspend the cells in the lysis buffer thoroughly. Incubate at room temperature for 10 min.
-
9
Centrifuge at 10,000 g for 30 min using the ultracentrifuge.
-
10
Separate supernatant and pellet.
Protein purification of His-Tagged proteins
The protein purification steps should be conducted at cold room.
-
11
Prepare the chromatography column:
Set up a clean column (10x100mm) on column stand.
Fill the column with Milli-Q-water and make sure the water flows smoothly.
When the column is half-full with water, shake the bottle with Ni-NTA resin thoroughly and transfer 2 ml slurry into the column for a 1 ml column volume.
After the water almost drained, slowly add 1X binding buffer (avoid disturbing the surface) up to 20 ml to equilibrate the column.
-
12
After the binding buffer drained, load the supernatant from step 10 onto the column. Avoid disturbing the surface of the column.
-
13
Collect the drain as flowthrough.
-
14
When all the supernatant is drained, wash the column with at least 20 column volume of wash buffer. Collect the flowthrough.
-
15
Elute the bound proteins using at least 5 column volumes in 2–4 fractions.
-
16
Keep all fractions. Take 10 μl fractions and add 10 μl 2X SDS buffer with DTT.
-
17
Resolve the fractions with a 4–12% Bis-Tris gel with equilibration at 120V for 10 min and resolving at 168V for 55 min using the SDS-PAGE apparatus. Molecular weights of each His-tagged protein is shown below:
H6-E1: 1065 residues, 118631 kDa H6-SUMO: 107 residues, 12,380 kDa H6-Ubc9: 164 residues, 18,830 kDa H6-RanGAP1 (418–587 fragments): 175 residues, 19,390 kDa H6-RanBP2 (IR1-M domain): 80 residues, 9340 kDa -
18
Stain gels with SimplyBlue and visualize using densitometer.
-
19
Pool fractions with highest purity and add 5 mM DTT final concentration to prevent oxidation of the Cys residues. (Add 20 mM DTT final concentration for E1).
-
20
Dialyze in dialysis buffer to remove imidazole.
-
21
Concentrate the sample. Centrifuge at 3500 g for 30 to 60 minutes. Add 5 mM DTT final concentration to the concentrated sample.
-
22
Determine the protein concentration using Bio-Rad protein assay kit.
-
23
Store proteins (SUMO, Ubc9, RanGAP1 and RanBP2) in 50 μl aliquots in sterile microcentrifuge tubes. (For E1: prepare 30 ul aliquots and purge each aliquot with Argon gas for a few minutes. This displaces the dissolve oxygen present in the sample and in the tube. ) Store protein aliquots at −80 °C.
Determination of E1 activity
E1 activity is measured by its ability to form E1•SUMO thioester bond using Basic protocol 3.
Expression and Purification of GST-Tagged proteins (GST-SUMO and GST-Sp100)
-
1
Protein expression protocol for GST-tagged proteins is the same as the His-tagged protein (steps 1–10). For steps 1 and 2, antibiotics used are 0.05 mg/ml chloroamphenicol and 0.1 mg/ml ampicillin.
-
2
Cell lysis protocol is the same as the His-tagged proteins but use 2X GST-binding buffer instead of 2X binding buffer in step 7).
Protein purification of GST-Tagged proteins
The purification steps should be conducted at cold room.
-
3
Prepare the chromatography column:
Set up a clean column (10x100mm) on column stand.
Fill the column with Milli-Q-water and make sure the water flows smoothly.
When the column is half-full with water, shake the bottle with glutathione agarose resin thoroughly and transfer 2 ml slurry into the column for a 1 ml column volume.
After the water almost drained, slowly add 1X GST binding buffer (avoid disturbing the surface) up to 20 ml to equilibrate the column.
-
4
After the 1X GST binding buffer drained, load the lysate (supernatant) onto the column. Cap the top part of the column. Incubate lysate with the GST bead slurry for 3 hr with shaking.
-
5
After 3 hr, drain the column and collect the drain as flowthrough.
-
6
When all the supernatant is drained, wash the column with at least 20 column volume of 1X GST wash buffer. Collect the flowthrough.
-
7
Elute the GST-bound proteins using at least 5 column volumes of elution buffer.
-
8
Keep all fractions. Take 10 μl fractions and add 10 μl 2X SDS buffer with DTT.
-
9
Resolve the fractions with a 4–12% Bis-Tris gel with equilibration at 120V for 10 min and resolving at 168V for 55 min using the SDS-PAGE apparatus.
GST-tag adds ~26 kDa to the protein. -
10
Stain the gel with SimplyBlue stain and scan the gel using the densitometer.
-
11
Pool fractions with highest purity and add 5 mM DTT final concentration to prevent oxidation of the Cys residues.
-
12
Buffer exchange
-
13
Check the protein concentration using Bio-Rad protein assay kit.
-
14
Store GST-tagged proteins in 100 μl aliquots in sterile microcentrifuge tubes.
REAGENTS AND SOLUTIONS
Use Milli-Q-purified water or equivalent in making solutions. All buffers are passed through a 0.2 micron filter before use.
5X Buffer A
250 mM Tris-HCl, pH 7.5
50 mM MgCl2
1 M DTT
DTT to a final concentration of 2.5 mM is added fresh each time because DTT is oxidized by dissolved oxygen in the solution.
Store at 4 ºC.
10X ATP regeneration system
500 mM Tris-HCl, pH 7.5
50 mM MgCl2 20 mM ATP (Sigma)
100 mM Creatine phosphate (Sigma)
35 U/ml Creatine kinase (Sigma)
6 U/ml Inorganic pyrophosphate (Sigma)
Prepare aliquots and store at -20 ºC.
5X Assay buffer
100 mM HEPES buffer, pH 7.5
25 mM MgCl2 250 mM NaCl
0.5% Tween-20
Prepare aliquots and store at 4 ºC.
HTS assay buffer
50 mM Tris-HCl, pH 7.4
0.3 mM DTT
10 mM MgCl2
0.005% Tween-20
Store at room temperature.
2X SDS sample buffer
125 mM Tris-HCl
20% glycerol
4% SDS
0.01% bromophenol blue (Bio-Rad)
2 M DTT (optional)
-
8 M Urea (optional)
Store in 1 ml aliquots at -20 ºC. Add 2 M DTT to a final concentration of 200 mM in 2X SDS sample buffer.Add fresh 8 M urea to a final concentration of 4 M urea for protocols asking for 2X SDS sample buffer with 4 M urea.
Phosphate-Buffered Saline (PBS)
13.7 mM NaCl
0.27 mM KCl
0.43 mM Na2HPO4
-
0.14 mM KH2PO4
Adjust pH to 7.4. Store at 4 °C to minimize bacterial growth for 1–2 yrs. A cloudy solution indicates bacterial growth.
Phosphate-Buffered Saline –Tween-20 (PBST)
Phosphate-Buffered Saline (PBS)
-
0.15% (v/v) Tween-20 (Sigma)
Store at 20 °C.
COMMENTARY
Background Information
Post-translational modifications by the SUMO family of proteins were discovered more than a decade ago, but their important functions in cellular regulation and disease pathogenesis have received broad attention only recently. SUMOylation affects cellular processes, such as transcription, replication, chromosome segregation, cell cycle control, genome stability and DNA repair (Dhananjayan et al., 2005; Hoege et al., 2002; Li et al., 2010; Montpetit et al., 2006; Wang and Dasso, 2009; Wilkinson and Henley, 2010; Xu, 2009). In addition, SUMO conjugation takes place in all tissues at all developmental stages (Howe et al., 1998; Johnson, 2004b; Kamitani et al., 1998; Kurepa et al., 2003; Shen et al., 1996). SUMO attachment adds a new docking site to target proteins to alter protein-protein interaction networks and change protein intracellular localization by enabling binding to other proteins that contain the SUMO-interacting motif (Song et al., 2004). SUMO attachment can also directly alter protein activities or prevent other modifications at the same site (Desterro et al., 1998; Tateishi et al., 2009). SUMOylation has been implicated in the pathogenesis of human disease, including cancer, Huntington’s disease, spinocerebellar ataxia 1, Parkinson’s disease amyotrophic lateral sclerosis, Alzheimer’s disease, familial dilated cardiomyopathy (Sarge, 2011; Subramaniam et al., 2010; Subramaniam et al., 2009; Subramaniam and Snyder, 2011), as well as in viral and immune response (Arriagada et al., 2011; Fu et al., 2011; Hagemeier, 2010; Murata, 2010; Pal et al., 2011; Wu et al., 2011).
In mammals, four SUMO paralogues (-1, -2, -3, and -4) have been identified (Meulmeester, 2008). SUMO-1 shares approximately 50% similarity with the other SUMO paralogues. SUMO-2 and -3 are 95% identical and SUMO-4 has 87% sequence similarity to SUMO-2 (Wilkinson and Henley, 2010). In addition, the different SUMO paralogues have different conjugation patterns. Unlike other SUMO proteins, SUMO-4 is only expressed in specific tissues. Among the SUMO paralogues expressed in mammals, one distinctive property of SUMO-2 and SUMO-3 is an internal SUMO modification site that allows for the formation of poly-SUMO chains (Tatham et al., 2001; Yang, 2006). All SUMO proteins are synthesized as precursors that are matured by sentrin-specific protease (SENP) cleavage of the C-terminal residues to expose the SUMO C-terminal di-glycine motif.
Covalent conjugation of SUMO proteins to other proteins requires multiple steps that are catalyzed by three types of enzymes, known as E1, E2 (Ubc9), and E3 ligase (Hay, 2001; Johnson, 2004a) (Fig. 1). SUMO is first activated by the E1 enzyme, which is a tight heterodimer of two proteins known as SUMO activation enzymes 1 and 2 (SAE1 and SAE2) (Desterro et al., 1999). E1 catalyzes the adenylation of the C-terminal carboxyl group of SUMO. The binding of SUMO and ATP in the E1 adenylation domain, leads to hydrolysis of ATP and the release of PPi. The C-terminal carboxyl group of SUMO is then transferred to the active site, Cys-173, of the SAE2 domain of E1 and where it forms a thioester bond with the release of the covalently bond AMP. SUMO is then transferred to the E2 conjugation enzyme, Ubc9, forming a thioester bond with the –SH group of the active Cys-93 residue of Ubc9. In the final step, SUMO is attached to target proteins by forming an isopeptide bond between its C-terminal carboxyl group and the 3-amino group of a Lys residue on the target protein. The last step generally requires an E3 ligase.
The protocols described in this chapter will facilitate the characterization of SUMO modifications, the identification of SUMOylation inhibitors, and the determination of the mechanism of action of the inhibitors.
Critical Parameters and Troubleshooting
The protocols described in this chapter will aid in characterizing the mechanism involved in each step of the SUMOylation pathway. Moreover, the protocols can be applied in screening for potential inhibitors that could block specific step in this pathway. For all assays, enzyme concentration, purity and activity are crucial. All of the enzymes used in the assays are expressed in E. coli and purified by either His- or GST-tag affinity chromatography. The E1 activating enzyme is the most sensitive of the enzymes used in the assays, and loses activity easily due to oxidation. Therefore, it should be stored at -80 oC in aliquots of a few microliters with 5 mM DTT. Note that the final DTT concentration in assays should be below 1 mM to avoid inhibition of the reactions due to hydrolysis of the thioester intermediate. In addition the sample should be purged with Argon gas to displace oxygen present in the sample. Ideally, E1 activity should be confirmed before running the assays.
In vitro assay conditions are also important. The ionic strength, pH, and magnesium, ATP, and inorganic pyrophosphate concentrations will affect SUMOylation activities. When preparing the reaction mixture, ATP should be added last to start the reaction. It is also recommended to prepare a 10% greater volume of the reaction master mix than needed to compensate for the amount lost due to pipetting errors.
Another factor to consider for optimal assay conditions is the concentration of the enzymes. It is essential to work within your detectable range. For gel-based assays, quantification of the protein band of interest should be done carefully to prevent inconsistent results. Typically, a series of known concentrations of protein is run onto the gel in parallel with the assay samples to ensure that quantification of the protein bands is in the linear range of detection. It is highly recommended that assays are done in triplicate if kinetic information is to be obtained from the experimental data.
In addition, the qualities of antibodies are crucial for gel-based assays with immunoblotting detection. This method is prone to cross-reactivity and appearance of non-specific signals thus antibodies used should be of high quality in terms of titer and specificity. It is important to be cautious in data interpretation if the antibodies used are of poor quality.
For the high throughput screening assay, the TR-FRET mix-and-read screening assay is generally robust and easy to perform, but requires an access to high throughput equipment -liquid dispensers to handle the microliter and nanoliter volumes, as well as a plate reader with TR-FRET detection capability. A fundamental variable during high throughput screening is usually the accuracy of dispensing of both test compounds and the reaction components in the wells of the microplate. Although this protocol describes the ultra-high throughput 1536-well procedure with a total of reaction volume of 4 μl, this assay can be performed manually in 384 or 96-well formats using micropipettes by increasing the dispensed volumes proportionally.
Anticipated Results
Two methods in measuring E1-catalyzed ATP:PPi isotope exchange rates (Basic and Alternate Protocols 1) (Fig. 2) are demonstrated in this unit. Both methods give the same results. Figure 3 shows hypothetical plots of ATP:PPi exchange rates versus SUMO concentrations and how kinetic constants are derived based on the plots. Representative plots and kinetic constants derived from the ATP:PPi exchange assay of wild type and several mutant E1 enzymes by charcoal slurry with Cherenkov counting detection of radioactive ATP are in previously published work (Wang, 2010). Result obtained using activated charcoal paper procedure with PhosphorImaging detection is shown by Bruzzese et al. (Bruzzese et al., 2009).
The ATP:AMP exchange assay (Basic Protocol 2) gives information on both step of the E1-catalyzed reactions. ATP and AMP separation was carried out using thin layer chromatography (Fig. 4) and their radioactivity counts were measured using PhosphorImager to determine the ATP:AMP exchange rates. Representative plots of the E1-catalyzed ATP:AMP exchange rates are shown in published work (Wang et al., 2009).
The SDS-PAGE gel from the E1•SUMO thioester formation assay (Basic Protocol 3) is shown in Fig. 5. The Cys active site of the SAE2 subunit of E1 forms a thioester bond with SUMO. The formation of the SAE2•SUMO adduct is shown on the left lane. The thioester bond between SAE2 and SUMO can be disrupted by addition of reducing agents such as DTT (right lane). Addition of DTT also serves as a control to confirm the thioester bond. Fluorescent-labeled SUMO is used as the tracer to determine the transfer rate of SUMO from E1 to E2 (Basic Protocol 4). Figure 6 shows the fluorescence image of the fluorescent-SUMO adducts of E1 and E2 and the plot of the transfer rates.
The result of the Ubc9•SUMO thioester formation (Basic Protocol 5) is shown in Fig. 7. The time-dependent formation of the Ubc9•SUMO product is illustrated in this figure. Ubc9•SUMO product formation is visualized by the increase of Ubc9•SUMO (~32 kD) band with the concomitant decrease of Ubc9 (~20 kD) and SUMO (~12kD) bands.
Isopeptide formation of substrate proteins and SUMO are determined using Basic Protocols 6 and 7. In both protocols, immunoblotting is used to detect SUMO-substrate formations using anti-SUMO1 antibody. The SUMO-substrate bands are then quantified using the ImageQuant 5.2 software. Basic Protocol 6 is designed to conduct steady-state kinetics in the absence of an E3 ligase to examine E1-catalyzed transthiolation, while Basic Protocol 7 is designed to conduct steady kinetics in the presence of an E3 ligase to examine the transfer of SUMO from E2 to substrate. Representative result of the steady-state kinetics to examine E1-catalyzed transthiolation in the overall conjugation reactions for Basic Protocol 6 is shown in published data (Wang, et al, 2007). Immunoblots and Lineweaver-Burk plots, shown in Fig. 8, were used to derive kinetics constants of the SUMO-GST-Sp100 isopeptide formation at different concentration of GST-Sp100 at different temperatures. The results are also described in detail by Truong, et al. (Truong, et al, 2011).
The high throughput screening TR-FRET assay will generally provide interpretable data on the modulation effect of the test ligands on the activity of the E1-E2 enzyme coupled SUMOylation activity. This assay is intended for the rapid high throughput screening of vast libraries of small molecule ligands to identify modulators of the SUMOylation pathway.
Time Considerations
Experimental set up for Basic Protocol 1, including the Cherenkov counting of the 32P-incorporated ATP, can be done in one day. Alternate Protocol 1 requires two days. Basic Protocol 2 assay set up, TLC and imaging is done in two days. One day for the assay set up and TLC. Then the TLC plate needs to be dried and exposed to the PhosphorImaging plate overnight. The image can be acquired the next day. Basic Protocol 3 is easy to set up and can be done in half a day, including staining with SimplyBlue. However, if immunoblotting with antibodies and visualization is preferred, another day or two is required. Basic Protocol 4, which includes set up of the E1•SUMO conjugates and transfer assays from E1 to Ubc9, and imaging of the gel, can be done in one day. Basic Protocol 5 is easy to set up and results can be obtained in half a day if SimplyBlue stain is used. Basic Protocols 6 and 7 can be done in two days; one day to run the assay and another day for immunoblotting.
For high throughput screening, set up of the reagents for the batch of several assay plates can generally be accomplished in 60 min. The time required to dispense the compounds either using a HighRes biosolutions pintool or manually will vary between 2 and 20 min per plate. Dispensing of the reaction mixtures takes 2–5 min per plate, depending on the batch size of the robotic run. Detection of the TR-FRET signal using the plate reader requires 2–5 min per plate. All together, with an average number of 1536-well plates in the range of 40–60 plates per robotic run, an average of 60,000–90,000 samples can be tested in one day.
Acknowledgments
This work was supported by grants from the NIH GM086171 and GM074748 (to Y.C.).
Literature Cited
- Arriagada G, Muntean LN, Goff SP. SUMO-interacting motifs of human TRIM5 alpha are important for antiviral activity. Plos Pathog. 2011:7. doi: 10.1371/journal.ppat.1002019. [DOI] [PMC free article] [PubMed] [Google Scholar]
- Bruzzese FJ, Tsu CA, Ma J, Loke H-K, Wu D, Li Z, Tayber O, Dick LR. Development of a charcoal paper adenosine triphosphate:pyrophosphate exchange assay: kinetic characterization of NEDD8 activating enzyme. Anal Biochem. 2009;394:24–29. doi: 10.1016/j.ab.2009.07.011. [DOI] [PubMed] [Google Scholar]
- Desterro JM, Rodriguez MS, Hay RT. SUMO-1 modification of IkappaBalpha inhibits NF-kappaB activation. Mol Cell. 1998;2:233–239. doi: 10.1016/s1097-2765(00)80133-1. [DOI] [PubMed] [Google Scholar]
- Desterro JMP, Rodriguez MS, Kemp GD, Hay RT. Identification of the enzyme required for activation of the small ubiquitin-like protein SUMO-1. J Biol Chem. 1999;274:10618–10624. doi: 10.1074/jbc.274.15.10618. [DOI] [PubMed] [Google Scholar]
- Dhananjayan SC, Ismail A, Nawaz Z. Ubiquitin and control of transcription. In: Mayer RJLR, editor. Essays Biochem, Vol 41: The Ubiquitin-Proteasome System. 2005. pp. 69–80. [DOI] [PubMed] [Google Scholar]
- Fu J, Xiong Y, Xu Y, Cheng G, Tang H. MDA5 is SUMOylated by PIAS2 beta in the upregulation of type I interferon signaling. Mol Immunol. 2011;48:415–422. doi: 10.1016/j.molimm.2010.09.003. [DOI] [PMC free article] [PubMed] [Google Scholar]
- Haas AL, Rose IA. The mechanism of ubiquitin activating enzyme. J Biol Chem. 1982;257:10329–10337. [PubMed] [Google Scholar]
- Hagemeier SR, Dickerson SJ, Meng Q, Yu X, Mertz JE, Kenney SC. SUMOylation of the Epstein-Barr virus BZLF1 protein inhibits its transcriptional activity and is regulated by the virus-encoded protein kinase. J Virol. 2010;84:4383–4394. doi: 10.1128/JVI.02369-09. [DOI] [PMC free article] [PubMed] [Google Scholar]
- Hay RT. Protein Modification by SUMO. Trends Biochem Sci. 2001;26:332–333. doi: 10.1016/s0968-0004(01)01849-7. [DOI] [PubMed] [Google Scholar]
- Hay RT. SUMO: A history of modification. Mol Cell. 2005;18:1–12. doi: 10.1016/j.molcel.2005.03.012. This review article clearly illustrates the overall picture of protein SUMOylation. [DOI] [PubMed] [Google Scholar]
- Hoege C, Pfander B, Moldovan GL, Pyrowolakis G, Jentsch S. RAD6-dependent DNA repair is linked to modification of PCNA by ubiquitin and SUMO. Nature. 2002;419:135–141. doi: 10.1038/nature00991. [DOI] [PubMed] [Google Scholar]
- Howe K, et al. The ubiquitin-homology gene PIC1: Characterization of mouse (Pic1) and human (UBL1) genes and pseudogenes. Genomics. 1998;47:92–100. doi: 10.1006/geno.1997.5091. [DOI] [PubMed] [Google Scholar]
- Johnson ES. Protein modification by SUMO. Annu Rev Biochem. 2004;73:355–82. doi: 10.1146/annurev.biochem.73.011303.074118. [DOI] [PubMed] [Google Scholar]
- Kamitani T, Kito K, Nguyen HP, Fukuda-Kamitani T, Yeh ETH. Characterization of a second member of the sentrin family of ubiquitin-like proteins. J Biol Chem. 1998;273:11349–11353. doi: 10.1074/jbc.273.18.11349. [DOI] [PubMed] [Google Scholar]
- Kurepa J, et al. The small ubiquitin-like modifier (SUMO) protein modification system in arabidopsis - accumulation of SUMO1 and -2 conjugates is increased by stress. J Biol Chem. 2003;278:6862–6872. doi: 10.1074/jbc.M209694200. [DOI] [PubMed] [Google Scholar]
- Li YJ, Stark JM, Chen DJ, Ann DK, Chen Y. Role of SUMO:SIM-mediated protein-protein interaction in non-homologous end joining. Oncogene. 2010;29:3509–3518. doi: 10.1038/onc.2010.108. [DOI] [PMC free article] [PubMed] [Google Scholar]
- Meulmeester E, Melchior F. Cell Biology: SUMO. Nature. 2008;452:708–711. doi: 10.1038/452709a. [DOI] [PubMed] [Google Scholar]
- Montpetit B, Hazbun TR, Fields S, Hieter P. Sumoylation of the budding yeast kinetochore protein Ndc10 is required for Ndc10 spindle localization and regulation of anaphase spindle elongation. J Cell Biol. 2006;174:653–663. doi: 10.1083/jcb.200605019. [DOI] [PMC free article] [PubMed] [Google Scholar]
- Murata T, Hotta N, Toyama S, Nakayama S, Chiba S, Isomura H, Ohshima T, Kanda T, Tsumura T. Transcriptional repression by SUMOylation of Epstein-Barr virus BZLF1 protein correlates with association of histone deacetylase. J Biol Chem. 2010;285:23925–23935. doi: 10.1074/jbc.M109.095356. [DOI] [PMC free article] [PubMed] [Google Scholar]
- Pal S, Santos A, Rosas JM, Ortiz-Guzman J, Rosas-Acosta G. Influenza A virus interacts extensively with the cellular SUMOylation system during infection. Virus Res. 2011;158:12–27. doi: 10.1016/j.virusres.2011.02.017. [DOI] [PubMed] [Google Scholar]
- Sarge KDaP-S, OK SUMO and its role in human diseases. Int Rev Cell Mol Biol. 2011;288:167–183. doi: 10.1016/B978-0-12-386041-5.00004-2. [DOI] [PubMed] [Google Scholar]
- Shen ZY, PardingtonPurtymun PE, Comeaux JC, Moyzis RK, Chen DJ. UBL1, a human ubiquitin-like protein associating with human RAD51/RAD52 proteins. Genomics. 1996;36:271–279. doi: 10.1006/geno.1996.0462. [DOI] [PubMed] [Google Scholar]
- Song J, Durrin LK, Wilkinson TA, Krontiris TG, Chen Y. Identification of a SUMO-binding motif that recognizes SUMO-modified proteins. Proc Natl Acad Sci USA. 2004;101:14373–14378. doi: 10.1073/pnas.0403498101. [DOI] [PMC free article] [PubMed] [Google Scholar]
- Subramaniam S, Mealer RG, Sixt KM, Barrow RK, Usiello A, Snyder SH. Rhes, a physiologic regulator of SUMOylation, enhances cross-sumoylation between the basic SUMOylation enzymes E1 and Ubc9. J Biol Chem. 2010;285:20428–20432. doi: 10.1074/jbc.C110.127191. [DOI] [PMC free article] [PubMed] [Google Scholar]
- Subramaniam S, Sixt KM, Barrow R, Snyder SH. Rhes, a striatal specific protein, mediates mutant-huntingtin cytotoxicity. Science. 2009;324:1327–1330. doi: 10.1126/science.1172871. [DOI] [PMC free article] [PubMed] [Google Scholar]
- Subramaniam S, Snyder SH. Huntington's disease is a disorder of the corpus striatum: focus on Rhes (Ras homologue enriched in the striatum) Neuropharmacology. 2011;60:1187–1192. doi: 10.1016/j.neuropharm.2010.10.025. [DOI] [PubMed] [Google Scholar]
- Tateishi Y, Ariyoshi M, Igarashi R, Hara H, Mizuguchi K, Seto A, Nakai A, Kokubo T, Tochio H, Shirakawa M. Molecular basis for SUMOylation-dependent regulation of DNA binding activity of heat shock factor 2. J Biol Chem. 2009;284:2435–47. doi: 10.1074/jbc.M806392200. [DOI] [PubMed] [Google Scholar]
- Tatham MH, Jaffray E, Vaughn OA, Desterro JMP, Botting CH, Naismith JH, Hay RT. Polymeric chains of SUMO-2 and SUMO-3 are conjugated to protein substrates by SAE1/SAE2 and Ubc9. J Biol Chem. 2001;276:35368–35374. doi: 10.1074/jbc.M104214200. [DOI] [PubMed] [Google Scholar]
- Tatham MH, Rodriguez MS, Xirodimas DP, Hay RT. Detection of protein SUMOylation in vivo. Nat Protoc. 2009;4:1363–1371. doi: 10.1038/nprot.2009.128. [DOI] [PubMed] [Google Scholar]
- Truong K, Su Y, Song J, Chen Y. Entropy-driven mechanism of an E3 ligase. Biochemistry. 2011;50:5757–5766. doi: 10.1021/bi2001856. [DOI] [PMC free article] [PubMed] [Google Scholar]
- Wang J, Chen Y. Role of the Zn2+ motif of E1 in SUMO adenylation. J Biol Chem. 2010;285:23732–23738. doi: 10.1074/jbc.M110.114660. Basic Protocol 1 (ATP:PPi exchange assay) is based from this paper. [DOI] [PMC free article] [PubMed] [Google Scholar]
- Wang J, Hu W, Cai S, Lee B, Song J, Chen Y. The intrinsic affinity between E2 and the Cys domain of E1 in ubiquitin-like modifications. Mol Cell. 2007;27:228–237. doi: 10.1016/j.molcel.2007.05.023. Basic Protocols 3 and 6 are derived from this paper. [DOI] [PMC free article] [PubMed] [Google Scholar]
- Wang J, Lee B, Cai S, Fukui L, Hu W, Chen Y. Conformational transition associated with E1–E2 interaction in small ubiquitin-like modifications. J Biol Chem. 2009;284:20340–20348. doi: 10.1074/jbc.M109.000257. Basic Protocol 2 is derived from this paper. [DOI] [PMC free article] [PubMed] [Google Scholar]
- Wang Y, Dasso M. SUMOylation and deSUMOylation at a glance. J Cell Sci. 2009;122:4249–4252. doi: 10.1242/jcs.050542. [DOI] [PMC free article] [PubMed] [Google Scholar]
- Wilkinson KA, Henley JM. Mechanisms, regulation and consequences of protein SUMOylation. Biochem J. 2010;428:133–145. doi: 10.1042/BJ20100158. [DOI] [PMC free article] [PubMed] [Google Scholar]
- Wu CY, Jeng KS, Lai MMC. The SUMOylation of matrix protein M1 modulates the assembly and morphogenesis of influenza A virus. J Virol. 2011;85:6618–6628. doi: 10.1128/JVI.02401-10. [DOI] [PMC free article] [PubMed] [Google Scholar]
- Xu Z, Chan HY, Lam WL, Lam KH, Lam LS, Ng TB, Au SW. SUMO proteases: redox regulation and biological consequences. Antioxid Redox Signal. 2009;11:1453–1484. doi: 10.1089/ars.2008.2182. [DOI] [PubMed] [Google Scholar]
- Yang M, Hsu CT, Ting CY, Liu LF, Hwang J. Assembly of polymeric chain of SUMO1 on human topoisomerase I in vitro. J Biol Chem. 2006;281:8264–8274. doi: 10.1074/jbc.M510364200. [DOI] [PubMed] [Google Scholar]