

Abstract
With Alzheimer’s disease (AD) quickly becoming the most costly disease to society, and with no disease-modifying treatment currently, prevention and early detection have become key points in AD research. Important features within this research focus on understanding disease pathology, as well as finding biomarkers that can act as early indicators and trackers of disease progression or potential treatment. With the advances in neuroimaging technology and the development of new imaging techniques, the search for cheap, noninvasive, sensitive biomarkers becomes more accessible. Modern neuroimaging techniques are able to cover most aspects of disease pathology, including visualization of senile plaques and neurofibrillary tangles, cortical atrophy, neuronal loss, vascular damage, and changes in brain biochemistry. These methods can provide complementary information, resulting in an overall picture of AD. Additionally, applying neuroimaging to animal models of AD could bring about greater understanding in disease etiology and experimental treatments whilst remaining in vivo. In this review, we present the current neuroimaging techniques used in AD research in both their human and animal applications, and discuss how this fits in to the overall goal of understanding AD.
Keywords: Alzheimer’s disease, animal models, ASL, biomarkers, MRI, MRS, neuroimaging, PET
Introduction
Alzheimer’s disease (AD) was first documented in 1907, and has since become a major medical concern, with a current estimate of approximately 33.9 million people affected worldwide [1]. AD is the most common form of dementia, a fatal neurodegenerative disease where patients suffer from severe cognitive impairments, loss of memory, and the inability to function in later stages. Clinical diagnosis is made primarily based on the presence of cognitive impairments as confirmed by standardized cognitive and neuropsychological tests with supplementary information from genetics, neuroimaging, and biomarkers [2], although definitive diagnosis can only be made post-mortem. It should be noted that biomarkers are not yet used in routine clinical settings. Nonetheless, with advances in neuroimaging and the finding of new biomarkers, differential diagnosis has become much easier in recent years [3-6]. This review aims to summarize the progress of current neuroimaging techniques in AD, as well as discuss their use in animal studies.
Neurobiology of Alzheimer’s disease
As of yet, there is no disease-modifying treatment for AD, with current approved drugs targeting the cholinergic [7-9] and glutamatergic [10-14] systems which improve symptoms but whose role in neuroprotection is still debated [15]. This is not unexpected, as the underlying cause of AD is itself unknown; there have been numerous hypotheses for its etiology, but none have been conclusive to date. The most widely accepted is the amyloid hypothesis.
The amyloid hypothesis originated from the observation that patients suffering from AD, particularly early-onset familial AD (FAD), had deposits of amyloid plaques and neurofibrillary tangles in the brain [16]. It was found that the plaques were aggregates of toxic β-amyloid (Aβ) fragments, made from amyloid precursor protein (APP) that had been cleaved abnormally. APP is a transmembrane protein of unknown function that can be cleaved by three different enzymes: α-, β-, and γ-secretase (reviewed in [17]). Normally, APP is cleaved by α-secretase, leaving a C-terminal tail C83 that can then be cleaved again by γ-secretase to form the non-toxic P3 fragment. The amyloidogenic pathway has APP cleaved by β-secretase instead of α-secretase, leaving a longer C-terminal tail C99, which when cleaved by γ-secretase forms the toxic Aβfragment found in AD (reviewed in [18]). The Aβ monomers aggregate to form dimers, trimers, oligomers, pre-fibrils and insoluble fibrils, which adhere further to form plaques in the brain; these were thought to trigger the formation of neurofibrillary tangles, ultimately leading to neuronal death and cognitive decline. However, recent studies show that it is in fact the soluble Aβ dimers, trimers, and oligomers that are neurotoxic and lead to synaptic dysfunction and poor memory consolidation, while insoluble Aβ plaques do not actually correlate well with cognitive function [19,20].
Further investigations found that the mutations seen in FAD were either gene mutations in APP or in the presenilins (PS), which are a part of the γ-secretase enzyme, resulting in higher levels of total Aβ production or a greater likelihood of creating the toxic Aβ fragment, respectively (reviewed in [21]). In late-onset sporadic AD, the genetic marker that could predict disease onset is apolipoprotein E (ApoE). ApoE is a lipid carrier protein that interacts with Aβ and APP [22]. There are three allelic variants present in ApoE, of which ApoE4 greatly increases the likelihood of developing AD, as it has been found to correlate with more Aβ deposits [23]. However, it is not the best predictor, as 30-40% of AD patients do not have the allele, whilst 30% of healthy controls do [24].
The amyloid hypothesis is the dominant theory for AD etiology as it fits in with the molecular and functional changes found in the disease, although its role is not yet fully understood. Nonetheless, there are critics to the theory. Studies have shown that the density of Aβ aggregates do not necessarily correlate with cognitive decline [25-27], and although the removal of Aβ plaques in animals has demonstrated an improvement in cognitive symptoms [28-30], human clinical trials have been prone to complications and the result has not been replicated convincingly [31,32].
An alternative hypothesis speculates that AD may occur as a result of vascular impairment. De la Torre [33] presented the critically attained threshold of cerebral hypoperfusion (CATCH) hypothesis, in which a vascular risk factor coupled with advanced age led to hypoperfusion of blood to the brain. The resulting drop in brain glucose and oxygen levels then lead to the neuronal damage, abnormalities in APP processing, tau phosphorylation, and other metabolic deficits seen in AD [33-36]. Perfusion imaging studies have provided evidence that vascular impairment and chronic brain hypoperfusion (CBH) are associated with the conversion from mild cognitive impairment (MCI) to AD [37-39], a significant finding for early diagnosis and prevention. However, the vascular hypothesis fails to explain early-onset FAD, where patients do not yet appear to have vascular impairments; it is possible that genetics play a larger role in this cohort.
It should be noted that vascular impairments leading to AD is not the same as vascular dementia (VaD), a separate subtype of dementia with different disease progression and indications; however, AD and VaD do share several aspects such as vascular risk factors [33,40-41], white matter lesions [42], and how they respond to similar treatments [42]. As such, they are difficult to diagnose differentially, and it has even been suggested that VaD is simply an extension of AD [33,43], where VaD results from spontaneous vascular insult such as stroke, and AD results from CBH. As further neuroimaging studies targeting cerebral perfusion are conducted, there may be a better understanding as to the distinction between the two dementias, as well as how relevant the vascular hypothesis is in the determination of AD etiology.
Neuroimaging in AD
Although the cause of AD remains hidden, efforts should still be made to continue improving diagnosis, disease and drug monitoring, and finding biomarkers which can predict disease onset. Neuroimaging has developed over the years to become very capable in these regards, providing high resolution images of patients’ brains that can be monitored over time, noninvasively. It is a versatile tool, allowing the analysis of grey and white matter volumes, white matter tract integrity, vasculature, and even the presence of Aβ plaques. Many studies have also shown that neuroimaging can distinguish between MCI patients likely to convert to AD and those who are not, as seen with the perfusion results [37-39]. Neuroimaging has been conducted in both human cohorts and animal cohorts, often producing complementary data; Figure 1 shows some of these results in different modalities. These techniques will be detailed in the following sections.
Figure 1.
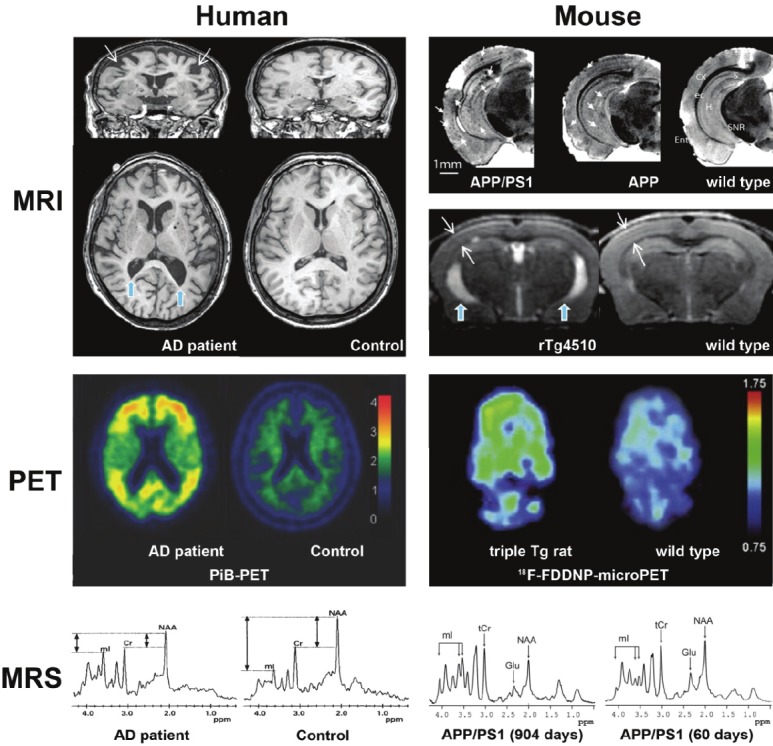
A selection of imaging results obtained via different neuroimaging techniques in human and mouse studies. Magnetic resonance imaging (MRI), positron emission tomography (PET), and magnetic resonance spectroscopy (MRS) show that the effects of Alzheimer’s disease (AD) onset can be detected in humans and transgenic (Tg) mice, although it should be noted that Pittsburgh Compound-B-PET (PiB-PET) failed to provide significant results in mouse models. Similarly, MRI in humans has not been able to detect Aβ plaques (indicated in APP and APP/PS1 mice by small white arrows), though cortical atrophy and ventricle dilation have been seen in both humans and rTg4510 mice (indicated by large white arrows and blue arrows, respectively). Multimodal studies combine the results from these techniques to acquire complementary data. Color bars for human PiB-PET indicate cortical voxel-to-cerebellar retention ratio, and standard uptake value ratio (SUVR) in rat 18F-FDDNP-microPET. Adapted from [136], [133], [109], [94], [148]. Acronyms: NAA = N-acetyl aspartate; Cr = creatine; mIns = myo-inositol; Glu = glutamate; tCr = creatine and phosphocreatine; ppm = parts per million.
Use of animal models in AD
Transgenic animal models have been particularly useful in the study of AD in all aspects, from the understanding of its molecular etiology to the development of potential drug treatments. Due to the relative lack of variation between transgenic animals, the ability to maintain controlled conditions, and the possibility of targeting specific genes, they have become a crucial tool in AD research. Several transgenic lines have been developed in fruit flies [44-46], rodents [44,47-51], dogs [52], and primates [53,54] to mimic features seen in AD. This review will focus on mice, as they are the most widely used animal model that can also be used in neuroimaging.
Neuroimaging studies in human cohorts
One of the benefits of neuroimaging is that humans can be scanned noninvasively, with essentially in vivo- data. Effects of drugs and other treatments can be monitored continuously, and the use of functional neuroimaging can provide insights as to how the brain works whilst doing tasks, and how AD compromises those functions.
Structural MRI
In the past decade, structural magnetic resonance imaging (MRI) has been increasingly used to aid in the diagnosis of AD and other forms of dementia [55]. Due to its ability to create high resolution images of brain tissue, structural MRI is able to measure cortical thickness as well as volumes of different regions. Cross-sectional MRI studies have shown that one of the brain areas most affected by AD, the medial temporal lobe and its surrounding structures, has reduced volume in patients when compared to healthy controls [39,56,57]. Hippocampal volume decrease is also a common finding in MRI studies, and is correlated well with memory impairment in AD patients [58,59]. Caroli et al. [39] also found that MCI patients who later converted to AD had hippocampal volumes smaller by about 8.5%, although the finding was not significant. In addition, several studies have found that carriers of the ApoE4 allele have smaller hippocampal volumes than non-carriers, in both AD patients and healthy volunteers [60-65]. Longitudinal studies are capable of tracking total brain and regional atrophy rates, and it has been found that this could be a predictor for disease progression in AD and MCI [66,67]. Dubois et al. [68] proposed that new research criteria for the diagnosis of probable AD should include the presence of medial temporal lobe atrophy based on qualitative ratings or quantitative volumetry of regions-of-interest from structural MRI images.
Radionuclide imaging studies
Functional brain imaging employing 18F-FDG-PET and single photon emission computed tomography (SPECT) study altered cerebral glucose metabolism and cerebral blood flow, respectively. 18F-FDG-PET studies have shown substantial reduction in glucose metabolism in the limbic structures of MCI patients [69], and predicted the decline of normal subjects to MCI and AD [70]. SPECT was able to make similar distinctions between MCI converters and non-converters [71,37-39].
New radioactive tracers have been developed that target AD in a more specific manner. As previously described, AD is characterized pathologically by neuronal loss, extracellular Aβ plaques and intracellular neurofibrillary tangles in the brain. As such, PET research on AD nowadays has focused on tracers useful in binding Aβ fragments.
The more popular tracer is Pittsburgh Compound-B (PiB) which is an Aβ-binding compound based on a series of neutral thioflavin-T derivatives [72]. In a post-mortem study, it was found that PiB selectively bound to insoluble Aβ plaques in AD brains, thus making it a valid method of in vivo plaque imaging [73]. Forsberg et al. [74] also observed that PiB retention was different for normal controls, MCI patients, and AD patients, with MCI patients retaining a PiB level between those of controls and AD subjects. MCI patients who converted to AD also displayed higher levels of PiB retention than non-converting MCI and control subjects [75,76]. The shortcoming of this agent is that it is radiolabelled with a short-lived positron emitter, 11C, which has a physical half-life of 20 minutes. A more recent tracer, 18F-AV-45, is a polyethylene glycol (2-5 units) that can be fluorinated, thus easily labeled with another positron emitter 18F that has a longer half-life of 110 minutes. Recent data have suggested that this agent has similar beta-amyloid binding capacity compared to PiB and, because of its longer physical halflife, it has better counting statistics [76].
SPECT studies conducted by Caroli et al. [39] and Johnson et al. [37] both concluded that converters from MCI to AD displayed larger degrees of hypoperfusion that non-converters, but in different regions. Caroli et al. found that more hypoperfusion in parahippocampal and inferior temporal regions correlated with AD conversion, whilst Johnson et al. found hypoperfusion in the anterior and posterior cingulate, bilateral insula, and the right prefrontal region. More recently however, Devanand et al. [77] found that regional blood flow in temporal and parietal regions, as well as those of preselected regions-of-interest (ROIs) could not predict AD conversion in MCI subjects, although global blood flow could. Blood flow in ROIs could only correlate with AD conversion after dichotomizing at the median value. Moreover, when compared with other hypothesized predictors such as hippocampal cortex volume, age, MMSE scores and ApoE4, SPECT results were unable to add any significant predictive value. This discrepancy in reported results may be due to the lack of standardization in analytical techniques.
Arterial spin labeling
Arterial spin labeling (ASL) is a quantitative MRI perfusion imaging method which has the advantage of being noninvasive, as it does not require intravenous injection of exogenous tracers [78]. ASL MRI uses electromagnetic labeling of the naturally occurring water in blood to acquire images sensitive to flow. A preliminary study by Alsop et al. evaluated the utility of ASL MRI for detection of cerebral blood flow abnormalities in AD. The study found that cognitive decline correlated with a decrease in cerebral blood flow (CBF) in the posterior parietal and posterior cingulate, but not to temporal cortices [78]. Another study showed regional perfusion in AD subject brain regions similar to those seen in 18F-FDG-PET and HMPAO SPECT studies of similar populations [79]. However, these studies calculated CBF based on the assumption that arterial blood water was exchanged with tissue water instantaneously, which may not apply to diseased populations, and therefore may be biased. The pulsatile ASL method with multiple-delay time sampling quantitative STAR labeling of arterial regions (QUASAR) pulse sequence [80] has the advantage of being model-less, and makes no assumptions regarding the water exchange mechanisms. It has been employed in recent studies [81,82] to measure hemodynamic parameters in patients with AD, but with conflicting results. Both groups found significantly lower regional CBF in AD patients (seen in Figure 2, adapted from [82]), but whilst Yoshiura et al. [81] found no significant change in regional arterial transit time (rATT), nor a significant difference in regional arterial blood volume (rABV), Mak et al. [82] saw significant prolonging in rATT in the left inferior frontal and middle cingulate gyri, as well as significant reductions in rABV for AD subjects. Possible reasons for this discrepancy may be due to differences in AD severity, as the AD cohort for Yoshiura et al. had higher MMSE scores.
Figure 2.

Between group analyses of arterial spin labeling cerebral blood flow maps of Alzheimer’s disease patients compared to controls, where hypoperfusion in patients is highlighted in red. Adapted from [82] with permission from the copyright holder.
Diffusion imaging
AD is often associated with grey matter atrophy, but its effect on white matter integrity has also been observed in various studies. It has been suggested that another underlying cause of AD could be the process of myelin breakdown with age [83]. Although that has not been proven, Aβ deposits and neurofibrillary tangles do also interact with myelin. White matter changes can also be afflicted by underlying vascular changes, with white matter hyperintensity being found in conventional structural neuroimaging [84,85] also linking it to an increased risk of developing MCI or the conversion from MCI to AD, warranting further investigation. It has also been suggested that some white matter damage is Wallerian degeneration and occurs as a consequence of neuronal loss in the cortex [86]. Regardless of cause, being able to measure white matter integrity is another useful technique in AD imaging.
Diffusion tensor imaging (DTI) is a noninvasive MRI technique capable of tracking neuronal axons by measuring the degree of anisotropy in water diffusion. White matter atrophy or lesions will affect the fractional anisotropy (FA) and the mean apparent diffusion coefficient (ADC), or mean diffusivity (MD), common quantitative measures of white matter integrity [87]. Of particular interest are the corpus callosum and temporal lobe structures, where atrophy is known to occur as AD progresses. Due to the highly structured arrangement of white matter bundles in the corpus callosum, it was possible for Hanyu et al. [88] to estimate changes in anisotropy based on the diffusivity along different axes. They found decreased FA in the splenium and genu of the corpus callosum, which also correlated with the degree of cognitive impairment. More recent studies have shown that MD is also increased in the left temporal and hippocampal regions of MCI and AD patients than normal controls [89]. However, there is conflicting evidence as to whether or not DTI can reliably detect MCI [87], and also how biologically sound the assumptions are that determine DTI measures [90].
Recently, more advanced diffusion imaging has allowed for better tissue characterization. Diffusion kurtosis imaging (DKI) addresses the problems of DTI and is more able to characterize tissue complexities [90], as seen in Figure 3 in normal cohorts. This is largely due to the different assumptions of water diffusion in the cellular environment, where DTI assumes that water molecules travel freely within and outside of cells in a Gaussian manner; this has been shown to be an invalid assumption at high b-values [91]. DKI looks at non-Gaussian properties of water diffusion, better modeling the in vivo cellular environment. As such, where DTI failed to characterize potential grey matter changes due to the limitations in its measures of diffusivity, DKI was able to find significant trends in mean kurtosis with age in both white and grey matter of the prefrontal regions [92].
Figure 3.

A comparison of results between diffusion tensor imaging (DTI) and diffusion kurtosis imaging (DKI) sequences in normal human and wild type mouse cohorts. DKI is able to show more details in white matter as well as grey matter. Adapted from [90]. Acronyms: MD = mean diffusivity; FA = fractional anisotropy; MK = mean kurtosis; FAK = fractional anisotropy of kurtosis.
Although few DKI studies have been conducted for AD, results from normal aging cohorts [92] and Parkinson’s disease [93] affirm that DKI is able to detect subtle cellular changes attributed to neuronal shrinkage, breakdown of myelin and neurofibrils, and changes in extracellular matrix complexities. These were found in both grey and white matter on a microstructural scale, something which has been lacking in conventional human neuroimaging.
Magnetic resonance spectroscopy
Proton magnetic resonance spectroscopy (1H-MRS) is another noninvasive neuroimaging technique targeting the molecular aspect of AD. It provides biochemical information about the neural environment, such as the chemical composition of cells and metabolic processes. The presence of different metabolites implicate different processes: N-acetyl aspartate (NAA) is produced by neuronal mitochondria and is only seen in neurons, creatine (Cr) marks cell energy metabolism, choline (Cho) indicates membrane integrity, and myo-inositol (mI) shows the activity and integrity of astrocytes [94,95]. The concentration of Cr is generally considered to be constant over time and across diseases, making it a reference value upon which the other values are normalized. Studies have found that NAA/Cr levels are reduced in the temporal and parietal lobes of AD patients [96-98] and are correlated with AD pathology [99], indicating neuronal damage and degeneration. These studies also found increased mI/Cr levels in the temporal, frontal and parietal lobes, suggesting that there is inflammation of glial cells and possibly demyelination.
Phosphate MRS (31P-MRS) has less sensitivity than 1H-MRS, but provides complementary data, primarily detecting metabolites involved in higher energy metabolism, such as ATP and phosphocreatine (PCr), and lipid metabolism [94]. As such, it is commonly used for imaging muscles and the liver. Nonetheless, 31P-MRS studies have found that PCr and inorganic phosphate levels increase with the degree of AD severity, seemingly correlating with the amount of Aβ plaques [100]. AD subjects were also reported to have higher levels of phosphomonoesters (PMEs) compared to age-matched controls [101]; this is in direct contrast with normal aging, where PME decreases with age and phosphodiesterases (PDEs) increase. Interestingly, as AD progresses, the same pattern is seen with PME dropping and levels of PDE growing. As PME indicates the amount of “membrane building block” available whilst PDEs indicated membrane breakdown, and consequently neuronal degeneration [101,102], Pettegrew et al. [101] proposed that this early peak in PME marked an early abnormality in membrane metabolism, followed by rapid neurodegeneration. The main drawback of 31P-MRS is its low sensitivity and consequent specificity due to the need for larger voxels, but this can be addressed with higher field scanners [94]. Mandal et al. [102] also proposed a new approach to obtain better values of 31P metabolites.
Like other neuroimaging techniques, MRS has been found to be effective in predicting MCI conversion to AD. Metastasio et al. [103] found that MCI subjects that converted to AD had a significantly lower NAA/Cr ratio than both controls and non-converting MCI subjects in the left hemisphere only. A longitudinal study [104] found decreasing levels of NAA/Cr in the posterior cingulate gyrus in AD as well as all MCI compared to normal controls, whilst Cho/Cr levels dropped for non-converting MCI compared to converting MCI and normal controls, suggesting that there may be a compensatory mechanism in non-converting MCI. Autopsy results from DeKosky et al. [105] appear to confirm this theory as they found an upregulation of choline acetyltransferase in some MCI patients compared to controls and AD subjects.
Susceptibility weighted imaging
Susceptibility weighted imaging (SWI) is a fully velocity-compensated 3D gradient-echo sequenced MRI technique that produces high contrast images of magnetically susceptible substances. Highly susceptible tissues, such as those which contain iron products, appear much darker on SWI images than conventional T2 or T2*W images, as shown in Figure 4. This allows for easier detection of iron deposition in the brain, which has long been associated with AD [89], with many potential treatments involving the chelation of iron.
Figure 4.
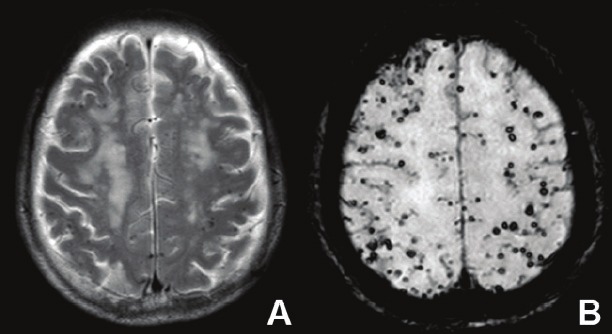
Use of A) T2-weighted and B) susceptibility weighted imaging (SWI) in the same patient with cerebral amyloid angiopathy. It can be seen that SWI is better at detecting the microhemorrhages due to the contrast provided by the phase difference of iron and other tissues.
Normal elderly controls also display increased iron deposition compared to younger controls, but mouse studies have shown that there is a difference in the pattern of the deposits; iron products were deposited diffusely for normal mice, whereas they were localized to Aβ plaques in AD model mice [106]. These results have not yet been replicated in humans; however, microscopy using SWI techniques have been able to clearly visualize Aβ plaques ex vivo, suggesting that the higher susceptibility associated with the plaques may be due to localized iron deposition [107]. Chamberlain et al. [108] stated that SWI produced the greatest contrast in ex vivo APP/PS1 mice for Aβ plaques, although it was not particularly effective in vivo as the small size of the brain introduced too many susceptibility interfaces. It is also because of these susceptibility interfaces that the temporal lobe and cortical areas in humans are difficult to analyze using SWI. One of the other issues with SWI is that there is no current method of quantitatively analyzing the images. All analysis at present is qualitative, and measures such as size of iron deposit are difficult to determine.
Multimodality studies
Each of the neuroimaging methods described thus far have been successful in differentiating MCI or AD patients from normal controls to a certain extent, but until recently, relatively few studies had been conducted combining these modalities. This appears to be unjustified, as Jack Jr et al. [109] combined the use of structural MRI and PiB-PET, and found that the two modalities provided complementary data which improved clinical classification such that it was superior to using either modality individually. In recent years, however, large scale multimodal studies using MRI, PET, DTI and SWI such as the Alzheimer’s Disease Neuroimaging Initiative (ADNI) and the Australian Imaging Biomarkers & Lifestyle Flagship Study of Aging (AIBL) have become increasingly popular, with participation from institutions around the world.
Neuroimaging studies in animal cohorts
Mouse models of AD
Mouse models are an ideal mammalian model for transgenic studies as they are inexpensive, convenient to rear and handle, have a known genome, and have a short lifespan. For AD, the transgenic lines produced in mice mainly target APP, and PS1 and 2 [48,49,110-115]. Transgenic mice are produced by either inserting mutant transgenes observed in human AD patients, or by performing gene knockouts using the homologous recombination technique. The first transgenic mice were single transgenic animals, with either APP or PS1/2 as a target [111,112]. APP knockout, PS1 knockout and transgenic lines with human mutant forms inserted were developed rapidly in the last two decades, such as PDAPP [110], Tg2576 [113], APP23 [114], and APPSwDI [115], all of which carry a human APP mutation.
Different mouse models have different levels of gene expression, amyloid deposition, and neuronal loss, making them perfect for targeting a specific feature of AD and deriving its function. APP knockouts demonstrated neuronal deficits in the form of lower motor activity, spatial learning deficits and decreased synaptic plasticity in the hippocampus [111,116]. PDAPP mice, which overexpress the human FAD mutant APP, show similar behaviour [110], suggesting that APP may be important in neuronal development, though this was seen only in a subpopulation. Other APP transgenic mice have also displayed behavioural and hippocampal deficits, as well as Aβ deposits, unlike APP knockout mice [113-115]. Of these, however, only APP23 showed severe neuronal loss [114], similar to human patients. PS1 knockout mice are not viable [117], but PS1 transgenic mice using human mutant PS1 transgenes are successful and have demonstrated an increase in Aβ production [118-120], indicating that PS1 plays a role in APP cleavage.
Whilst these single transgenic mouse models are useful, some consider the onset of pathology to occur too late, so double transgenic mice have been developed, where two mutations are included in a single mouse model. These mice also display a more AD-like phenotype [119-122], with large amounts of Aβ plaques deposited earlier than single transgenic mice.
Critics of transgenic animal models argue that whilst specific aspects of AD can be targeted, this does not replicate the full AD neuropathology seen in humans [123,124]. This has been somewhat rectified by Colton et al. [125], who developed two new models that are APPSwDI and APPSw on a nitric oxide synthase 2 (NOS2) background. They found that these mice showed a pathological progression very similar to that of AD in humans, starting with Aβ deposition and developing into neurofibrillary tangles, neuronal death and behavioural deficits. NO is therefore suggested to be a protective agent against AD pathology, particularly neuroinflammation, though the mechanism is not yet identified.
Another criticism of transgenic animal models is that they are derived from mutations mostly found in patients with FAD. No transgenic mouse model has been developed to replicate the progression of late-onset sporadic AD, which is far more prevalent than FAD. However, there are non-transgenic mouse models, such as the senescence-accelerated prone mouse strain 8 (SAMP8), which show cognitive deficits as a result of age, similar to late-onset sporadic AD [126]. These mice display the same Aβ pathologies, as well as the formation of neurofibrillary tangles and subsequent damage to the hippocampus [126,127], and are arguably better models for AD.
Neuroimaging studies have been conducted on many of these mouse models, using similar techniques as those used in human studies. As mouse brains are smaller than human brains, some studies require higher powered MRI machines, such as 7T instead of 1.5 or 3T commonly used for human cohorts. Nevertheless, the results produced are comparable.
Structural MRI
The challenge of using structural MRI in mouse models is the high resolution required, particularly for finding Aβ plaques, which require slice thicknesses of less than 100μm; human MRI scans usually have a slice thickness of 1mm. It has been attempted by various groups [128,129], but problems with long scan times or low signal intensity have rendered the techniques impractical for in vivo use. Some studies have reported success [130,131] with imaging Aβ plaques in vivo in the APP/PS1 mouse model, with Braakman et al. performing scans at two month intervals, one of the only longitudinal neuroimaging studies in mice [131]. Chamberlain et al. [108] attempted to optimize the process using ex vivo procedures to find the best scanning protocol. They found that average multiple echoes were better than fast spin echo techniques, and that any movement or blurring would greatly deteriorate plaque imaging as the plaques are smaller than the voxel size. In contrast, plaques in mouse thalami can be imaged with faster, lower resolution sequences, as thalamic plaques are larger than cortical and hippocampal plaques [132].
Most other studies using MRI in mouse models are ex vivo. Fixed slices of APP/PS1 mouse brain were scanned using a T2W protocol in a 7T scanner [133-135]. It was found that areas of hypointensity matched the areas of Aβ deposits found in histologically stained mouse brains, and that neuroimaging was a viable method for monitoring treatment efficacy.
Yang et al. [136] looked at morphometry in rTg4510, a tau transgenic mouse model, and wild type mice. They found that the transgenic mice had severe atrophy in the neocortex and hippocampus, as well as enlarged ventricles. They concluded that MRI was a useful tool for comparing treatment responses between humans and mice.
PET studies
PET studies in mice have yielded disappointing results, due to the small size of mouse brains. 18F-FDG and 18F-FDDNP, another Aβ probe, were found to be no different between Tg2576 mice and wild type mice [137]. They concluded that this was due to the limited spatial resolution of PET, as well as partial volume effects made worse by the small subject. On the other hand, microPET scanners have been found to be effective in imaging rat and mouse brains [138]. Kepe et al. scanned a triple transgenic rat model with Aβ deposition using 18F-FDDNP and found that there was Aβ binding in the frontal cortex and hippocampus [138], although other studies still reported no significant binding effect seen in mouse models with PiB [139]. Toyama et al. concluded that although there was good uptake of PiB, there was little to no Aβ plaque binding seen, and that this may be due to smaller amounts of Aβ binding sites compared to human subjects [139].
Although Aβ probes show conflicting results, other tracers may still be used to test other processes. One such tracer, 11C-PK11195, binds to activated microglia, which was shown to surround extracellular amyloid in histological studies [140]. However, the role of activated microglia is under dispute, with some stating that they trigger cell death [141] and others suggesting that they actually clear the brain of amyloid [142,143]. Due to its association with AD, as well as its unknown function within AD pathology, using a microglia tracer can provide further insight into its role in addition to using it as a potential AD biomarker in mice where Aβ probes have failed. Venneti et al. [144] found that 11C-PK11195 binding in both human and transgenic APP/PS1 mice matched the presence of activated microglia seen in immunohistolochemical results. However, they raise the concern that transgenic models of AD are not representative enough of AD, as different degrees of binding to astrocytes were seen in their results.
DTI
As in human studies, DTI has been found to be effective in monitoring white matter disintegration and the loss of myelin in transgenic mice. Song et al. [145] described their findings of lower relative anisotrophy in old PDAPP mice compared with old wild type mice, whilst there was no change between young PDAPP mice and young wild type mice. They concluded that myelin damage occurs later in AD progression, after Aβ deposition.
As mentioned before, DKI has been shown to characterize microstructural changes in grey and white matter. Initial testing of the technique was conducted on normal rats and mice. Wu et al. [90] documented several studies they conducted on rats using DKI to assess the clinical applications. They concluded that DKI is indeed able to better describe water diffusion in complex living cell environments, with much greater sensitivity than traditional DTI. Future studies could use DKI in various transgenic mouse models to provide more insight on the cellular changes in AD.
MRS
MRS findings in mouse models, specifically APP/PS1 and Tg2576 mice, were similar to those found in human studies [146-148], where NAA/Cr levels were lower in afflicted mice compared to wild type, and mI/Cr increased over age for APP/PS1 mice which was not seen in wild type mice. Like structural MRI, the main drawback for using mouse models in MRS is the requirement for high resolution scanning to reduce the signal-to-noise ratio; Jack Jr et al. [148] used a 9.4T scanner for their MR ‘microimaging’ and 1H-MRS of their mouse subjects. However, the benefits of using mouse models in MRS are that their results strongly match those seen in humans and can be used for longitudinal studies that are considerably shorter than those in human cohorts. As a result, drug development studies would benefit highly from using mouse models and MRS as they are faster, cheaper, and model human metabolic processes well.
Conclusion
AD is a complex and mysterious disease that is already becoming a cause for concern globally due to its lack of cure and the specialized care required to help patients maintain a functional lifestyle. Research efforts are highly varied; from looking into the molecular basis to understand its mechanisms and develop drugs based on these findings, to looking for macroscopic signs in diagnosis and disease progression. The use of neuroimaging with AD animal models provides a way to combine these efforts.
The use of neuroimaging in humans is very different from that in mouse models. Tables 1 and 2 provide a summary of current neuroimaging techniques used to detect various AD pathologies in humans and mouse models, respectively. As previously described, human MRI studies tend to use lower resolution and field of view to encompass the entire brain. This is also done in order to reduce scanning times of patients. In mouse models, the mice are anesthetized, and can be scanned for far longer than would be practical for humans, up to 24hrs. The scope of human studies in structural MRI is to look for macroscopic changes, such as cortical atrophy, to act as biomarkers and measures with which to monitor disease progression and drug efficacy. In mouse models, we look for microscopic features, particularly Aβ plaques, for similar effect but with more emphasis on the molecular mechanisms that cause AD. This is not to say that looking for Aβ plaques in humans is not of interest; PiB-PET and 18F-AV-45-PET were made to look for Aβ in human brains. However, due to the size of Aβ deposits, it is not yet practical to use structural MRI to visualize them in human cohorts. In this sense, mouse models can provide the necessary data, as their Aβ deposits can be monitored over time using MRI. With a mouse model that adequately simulates AD pathology, MRI can then be used to determine the effects of treatment on Aβ plaques, within mice.
Table 1.
Current uses of neuroimaging techniques for imaging AD pathology in vivo in human cohorts (√ indicates successful visualization of pathology, X indicates unsuccessful)
| Alzheimer’s disease pathology | ||||||||
|---|---|---|---|---|---|---|---|---|
|
| ||||||||
| Aβ plaques | NFT | WM defects | GM defects | Metabolic changes | Vascular impairment | Atrophy | ||
|
| ||||||||
| Iron Deposition | Flow | |||||||
| Structural MRI | X | √ | √ | |||||
| 18F-FDG-PET | √ | |||||||
| PiB-PET | √ | |||||||
| Other PET | √ (18F-FDDNP, 18F-AV45) | √ (18F-FDDNP) | ||||||
| HMPAO SPECT ASL | √ | |||||||
| DTI | √ | √ | ||||||
| DKI | √ | √ | ||||||
| MRS | √ | |||||||
| SWI | X | √ | ||||||
Acronyms: MRI = magnetic resonance imaging; FDG = fluorodeoxyglucose; PET = positron emission tomography; PiB = Pittsburgh compound-B; HMPAO = Tc-exametazime; SPECT = single photon emission computed tomography; ASL = arterial spin labeling; DTI = diffusion tensor imaging; DKI = diffusion kurtosis imaging; MRS = magnetic resonance spectroscopy; SWI = susceptibility weighted imaging; Aβ = beta-amyloid; NFT = neurofibrillary tangles; WM = white matter; GM = grey matter.
Table 2.
Use of various neuroimaging techniques for imaging AD pathology in vivo and in vitro in mouse models (mouse model name indicates successful visualization of pathology within that model, X indicates unsuccessful)
| Alzheimer’s disease pathology | |||||||
|---|---|---|---|---|---|---|---|
|
| |||||||
| Aβ plaques | Neurofibrillary tangles | WM defects | GM defects | Metabolic changes | Vascular impairment(Flow) | Atrophy | |
| Structural MRI | APP/PS1 | rTg4510 | |||||
| 18F-FDG-PET | X | ||||||
| PiB-PET | X | ||||||
| 18F-FDDNP-PET | Triple transgenic rat | Triple transgenic rat | |||||
| SPECT | |||||||
| ASL | Tg2576 | ||||||
| DTI | PDAPP | ||||||
| DKI | Normal mouse | Normal mouse | |||||
| MRS | rTg4510 | ||||||
| SWI | APP/PS1 | ||||||
Acronyms: MRI = magnetic resonance imaging; FDG = fluorodeoxyglucose; PET = positron emission tomography; PiB = Pittsburgh compound-B; SPECT = single photon emission computed tomography; ASL = arterial spin labeling; DTI = diffusion tensor imaging; DKI = diffusion kurtosis imaging; MRS = magnetic resonance spectroscopy; SWI = susceptibility weighted imaging; Aβ = beta-amyloid; WM = white matter; GM = grey matter.
Unfortunately, microPET results have been largely unsuccessful in finding a tracer that binds to Aβ plaques in mice as effectively as in humans. Perhaps more distressing is the implication that this may be due to an inherent difference between human AD and mouse models of AD. As discussed before, most transgenic mouse models are derived from FAD mutations and may not be applicable to late-onset AD. An example of this can be seen in amyloid vaccination studies, where no serious adverse effects were seen in mouse models, but which resulted in meningoencephalitis for humans [149-152]. In light of this, naturally aged non-human primates are being used as a better model of human AD, both to determine the mechanism of these complications and to test other treatments [153].
Overall, the main disadvantages of using mouse models in AD research and neuroimaging are that they are sometimes too small to scan properly, as seen in the PET studies, and that the findings obtained from mice are not necessarily transferrable to humans. The definitive cause of AD has yet to be found, but it is clear that it involves interactions between several components, not the single aspect that many transgenic mouse models provide. The question remains as to whether or not mouse models can completely replicate the neuropathological progression of AD. However, these are issues for all animal models, even non-human primates.
Despite the disadvantages, animal models can still be useful in determining the mechanism of AD pathogenesis. Indeed, de la Torre’s CATCH hypothesis [33] was derived from their studies of mice undergoing chronic brain hypoperfusion. Testing MRI protocols on mouse models can also help develop these concepts for human scanning later on, as demonstrated by Chamberlain et al. [108]. They were able to determine that fast spin echo techniques were not as good as average multiple echoes and that SWI provided the best contrast for visualizing Aβ plaques in mouse models. In fact, they believe that SWI may be implemented more effectively in human cohorts as the larger brain size reduces the amount of susceptibility interfaces that interfere with the image, as well as the fact that human Aβ plaques contain more iron than APP/PS1 mice [120], creating even greater contrast.
To conclude, the use of mouse models is still beneficial in AD research, particularly for neuroimaging. They are cheap to maintain, have short lifespans so symptoms appear faster, are much more consistent than humans, and can target a single aspect of AD. Even if this aspect may not be transferrable to humans, it is still useful to form a hypothesis first, based on cellular and molecular findings, before expanding and testing it on more complicated models. They can also be used to test new treatments, using similar neuroimaging techniques that could be transferred to human studies in future.
Neuroimaging is a versatile tool in itself for detecting macroscopic, and potentially microscopic, changes in diseased brains. With the increase in longitudinal, large-scale, multimodal initiatives such as ADNI and AIBL, the search for a new biomarker that can be monitored noninvasively is only just beginning in earnest. This search can be aided when combined with the molecular knowledge obtained from animal studies, as well as complementary neuroimaging information that cannot be tested in humans.
Acknowledgements
We would like to thank the HKU Alzheimer’s Disease Research Network under Strategic Research Theme of Healthy Aging for their input in this review.
References
- 1.Barnes DE, Yaffe K. The projected effect of risk factor reduction on Alzheimer’s disease prevalence. Lancet Neurol. 2011;10:819–828. doi: 10.1016/S1474-4422(11)70072-2. [DOI] [PMC free article] [PubMed] [Google Scholar]
- 2.McKhann GM, Knopman DS, Chertkow H, Hyman BT, Jack CR Jr, Kawas CH, Klunk WE, Koroshetz WJ, Manly JJ, Mayeux R, Mohs RC, Morris JC, Rossor MN, Scheltens P, Carrillo MC, Thies B, Weintraub S, Phelps CH. The diagnosis of dementia due to Alzheimer's disease: Recommendations from the National Institute on Aging-Alzheimer’s Association workgroups on diagnostic guidelines for Alzheimer’s disease. Alzheimers Dement. 2011;7:263–269. doi: 10.1016/j.jalz.2011.03.005. [DOI] [PMC free article] [PubMed] [Google Scholar]
- 3.Mosconi L, Tsui WH, Herholz K, Pupi A, Drzezga A, Lucignani G, Reiman EM, Holthoff V, Kalbe E, Sorbi S, Diehl-Schmid J, Perneczky R, Clerici F, Caselli R, Beuthien-Baumann B, Kurz A, Minoshima S, de Leon MJ. Multicenter standardised 18F-FDG PET diagnosis of mild cognitive impairment, Alzheimer’s disease, and other dementias. J Nucl Med. 2008;49:390–398. doi: 10.2967/jnumed.107.045385. [DOI] [PMC free article] [PubMed] [Google Scholar]
- 4.de Souza LC, Lamari F, Belliard S, Jardel C, Houillier C, de Paz R, Dubois B, Sarazin M. Cerebrospinal fluid biomarkers in the differential diagnosis of Alzheimer’s disease from other cortical dementias. J Neurol Neurosurg Psychiatry. 2011;82:240–246. doi: 10.1136/jnnp.2010.207183. [DOI] [PubMed] [Google Scholar]
- 5.Parente DB, Gasparetto EL, da Cruz LCH Jr, Domingues RC, Baptista AC, Carvalho ACP, Domingues RC. Potential role of diffusion tensor MRI in the differential diagnosis of mild cognitive impairment and Alzheimer’s disease. AJR Am J Roentgenol. 2008;190:1369–1374. doi: 10.2214/AJR.07.2617. [DOI] [PubMed] [Google Scholar]
- 6.Rabinovici GD, Rosen HJ, Alkalay A, Kornak J, Furst AJ, Agarwal N, Mormino EC, O’Neil JP, Janabi M, Karydas A, Growdon ME, Jang JY, Huang EJ, DeArmond SJ, Trojanowski JQ, Grinberg LT, Gorno-Tempini ML, Seeley WW, Miller BL, Jagust WJ. Amyloid vs FDG-PET in the differential diagnosis of AD and FTLD. Neurology. 2011;77:2034–2042. doi: 10.1212/WNL.0b013e31823b9c5e. [DOI] [PMC free article] [PubMed] [Google Scholar]
- 7.Birks J. Cholinesterase inhibitors for Alzheimer’s disease. Cochrane Database Syst. 2006;Rev 1:Art. No. CD005593. doi: 10.1002/14651858.CD005593. [DOI] [PMC free article] [PubMed] [Google Scholar]
- 8.Winblad B. Donepezil in severe Alzheimer’s disease. AM J Alzheimers Dis Other Demen. 2009;24:185–192. doi: 10.1177/1533317509332094. [DOI] [PMC free article] [PubMed] [Google Scholar]
- 9.Winblad B, Kilander L, Eriksson S, Minthon L, Batsman S, Wetterholm AL, Jansson-Blixt C, Haglund A. Donepezil in patients with severe Alzheimer’s disease: Double-blind, parallel-group, placebo-controlled study. Lancet. 2006;367:1057–1065. doi: 10.1016/S0140-6736(06)68350-5. [DOI] [PubMed] [Google Scholar]
- 10.Reisberg B, Doody R, Stoffler A, Schmitt F, Ferris S, Mobius HJ. Memantine in moderate-to-severe Alzheimer’s disease. N Engl J Med. 2003;348:1333–1341. doi: 10.1056/NEJMoa013128. [DOI] [PubMed] [Google Scholar]
- 11.Mecocci P, Bladstrom A, Stender K. Effects of memantine on cognition in patients with moderate to severe Alzheimer’s disease: Post-hoc analyses of ADAS-cog and SIB total and single-item scores from six randomised, double-blind, placebo-controlled studies. Int J Geriatr Psychiatry. 2009;24:532–538. doi: 10.1002/gps.2226. [DOI] [PubMed] [Google Scholar]
- 12.Winblad B, Jones RW, Wirth Y, Stoffler A, Mobius JH. Memantine in moderate to severe Alzheimer’s disease: A meta-analysis of randomised clinical trials. Dement Geriatr Cogn Disord. 2007;24:20–27. doi: 10.1159/000102568. [DOI] [PubMed] [Google Scholar]
- 13.Tariot PN, Farlow MR, Grossberg GT, Graham SM, McDonald S, Gergel I. Memantine treatment in patients with moderate to severe Alzheimer’s disease already receiving donepezil: A randomised controlled trial. JAMA. 2004;291:317–324. doi: 10.1001/jama.291.3.317. [DOI] [PubMed] [Google Scholar]
- 14.Atri A, Shaughnessy LW, Locascio JJ, Growdon JH. Long-term course and effectiveness of combination therapy in Alzheimer’s disease. Alzheimer Dis Assoc Disord. 2008;22:209–221. doi: 10.1097/WAD.0b013e31816653bc. [DOI] [PMC free article] [PubMed] [Google Scholar]
- 15.Mangialasche F, Solomon A, Winblad B, Mecocci P, Kivipelto M. Alzheimer’s disease: Clinical trials and drug development. Lancet Neurol. 2010;9:702–716. doi: 10.1016/S1474-4422(10)70119-8. [DOI] [PubMed] [Google Scholar]
- 16.Hardy J, Allsop D. Amyloid deposition as the central event in the aetiology of Alzheimer’s disease. Trends Pharmacol Sci. 1991;12:383–388. doi: 10.1016/0165-6147(91)90609-v. [DOI] [PubMed] [Google Scholar]
- 17.Wilcock DM, Colton CA. Anti-amyloid-β immunotherapy in Alzheimer’s disease: Relevance of transgenic mouse studies to clinical trials. J Alzheimers Dis. 2008;15:555–569. doi: 10.3233/jad-2008-15404. [DOI] [PMC free article] [PubMed] [Google Scholar]
- 18.Masters CL, Cappai R, Barnham KJ, Villemagne VL. Molecular mechanisms for Alzheimer’s disease: Implications for neuroimaging and therapeutics. J Neurochem. 2006;97:1700–1725. doi: 10.1111/j.1471-4159.2006.03989.x. [DOI] [PubMed] [Google Scholar]
- 19.Shankar GM, Li S, Mehta TH, Garcia-Munoz A, Shepardson NE, Smith I, Brett FM, Farrell MA, Rowan MJ, Lemere CA, Regan CM, Walsh DM, Sabatini BL, Selkoe DJ. Amyloid-beta protein dimers isolated directly from Alzheimer’s brains impair synaptic plasticity and memory. Nat Med. 2008;14:837–842. doi: 10.1038/nm1782. [DOI] [PMC free article] [PubMed] [Google Scholar]
- 20.Freir DB, Fedriani R, Scully D, Smith IM, Selkoe DJ, Walsh DM, Regan CM. Aβ oligomers inhibit synapse remodelling necessary for memory consolidation. Neurobiol Aging. 2011;32:2211–2218. doi: 10.1016/j.neurobiolaging.2010.01.001. [DOI] [PMC free article] [PubMed] [Google Scholar]
- 21.Tanzi RE, Kovacs DM, Kim TW, Moir RD, Guenette SY, Wasco W. The gene defects responsible for familial Alzheimer’s disease. Neurobiol Dis. 1996;3:159–168. doi: 10.1006/nbdi.1996.0016. [DOI] [PubMed] [Google Scholar]
- 22.Lee Y, Aono M, Laskowitz D, Warner DS, Pearlstein RD. Apolipoprotein E protects against oxidative stress in mixed neuronal-glial cell cultures by reducing glutamate toxicity. Neurochem Int. 2004;44:107–118. doi: 10.1016/s0197-0186(03)00112-8. [DOI] [PubMed] [Google Scholar]
- 23.Holtzman DM, Fagan AM, Mackey B, Tenkova T, Sartorius L, Paul SM, Bales K, Ashe KH, Irizarry MC, Hyman BT. Apolipoprotein E facilitates neuritic and cerebrovascular plaque formation in an Alzheimer’s disease model. Ann Neurol. 2000;47:739–747. [PubMed] [Google Scholar]
- 24.Mayeux R, Saunders AM, Shea S, Mirra S, Evans D, Roses AD, Hyman BT, Crain B, Tang MX, Phelps CH. Utility of the apolipoprotein E genotype in the diagnosis of Alzheimer’s disease. N Engl J Med. 1998;338:506–511. doi: 10.1056/NEJM199802193380804. [DOI] [PubMed] [Google Scholar]
- 25.Terry RD, Masliah E, Salmon DP, Butters N, DeTeresa R, Hill R, Hansen LA, Katzman R. Physical basis of cognitive alterations in Alzheimer’s disease: synapse loss is the major correlate of cognitive impairment. Ann Neurol. 1991;4:572–580. doi: 10.1002/ana.410300410. [DOI] [PubMed] [Google Scholar]
- 26.Hatanpaa K, Brady DR, Stoll J, Rapoport SI, Chandrasekaran K. Neuronal activity and early neurofibrillary tangles in Alzheimer’s disease. Ann Neurol. 1996;40:411–420. doi: 10.1002/ana.410400310. [DOI] [PubMed] [Google Scholar]
- 27.DeCarli C. Post-mortem regional neurofibrillary tangle densities, but not senile plaque densities are related to regional cerebral metabolic rates for glucose during life in Alzheimer disease patients. Neurodegeneration. 1992;1:11–20. [Google Scholar]
- 28.Janus C, Pearson J, McLaurin J, Mathews PM, Jiang Y, Schmidt SD, Chishti MA, Horne P, Heslin D, French J, Mount HTJ, Nixon RA, Mercken M, Bergeron C, Fraser PE, St George-Hyslop P, Westaway D. Aβ peptide immunisation reduces behavioural impairment and plaques in a model of Alzheimer’s disease. Nature. 2000;408:979–982. doi: 10.1038/35050110. [DOI] [PubMed] [Google Scholar]
- 29.Morgan D, Diamond DM, Gottschall PE, Ugen KE, Dickey C, Hardy J, Duff K, Jantzen P, DiCarlo G, Wilcock D, Connor K, Hatcher J, Hope C, Gordon M, Arendash GW. Aβ peptide vaccination prevents memory loss in an animal model of Alzheimer’s disease. Nature. 2000;408:982–985. doi: 10.1038/35050116. [DOI] [PubMed] [Google Scholar]
- 30.Dodart JC, Bales KR, Gannon KS, Greene SJ, DeMattos RB, Mathis C, DeLong CA, Wu S, Wu X, Holtzman DM, Paul SM. Immunisation reverses memory deficits without reducing brain Aβ burden in Alzheimer’s disease model. Nat Neurosci. 2002;5:452–457. doi: 10.1038/nn842. [DOI] [PubMed] [Google Scholar]
- 31.Atwood CS, Bishop GM, Perry G, Smith MA. Amyloid-beta, a vascular sealant that protects against hemorrhage? J Neurosci Res. 2002;70:356. doi: 10.1002/jnr.10388. [DOI] [PubMed] [Google Scholar]
- 32.Schenk D. Hopes remain for an Alzheimer’s vaccine. Nature. 2004;431:398. doi: 10.1038/431398b. [DOI] [PubMed] [Google Scholar]
- 33.de la Torre JC. Critically attained threshold of cerebral hypoperfusion: The CATCH hypothesis of Alzheimer’s pathogenesis. Neurobiol Aging. 2000;21:331–342. doi: 10.1016/s0197-4580(00)00111-1. [DOI] [PubMed] [Google Scholar]
- 34.de la Torre JC. Alzheimer’s disease as a vascular disorder: Nosological evidence. Stroke. 2002;33:1152–1162. doi: 10.1161/01.str.0000014421.15948.67. [DOI] [PubMed] [Google Scholar]
- 35.de la Torre JC. The vascular hypothesis of Alzheimer’s disease: Bench to bedside and beyond. Neurodeg Dis. 2010;7:116–121. doi: 10.1159/000285520. [DOI] [PubMed] [Google Scholar]
- 36.de la Torre JC. Is Alzheimer’s a neurodegenerative or a vascular disorder? Data dogma and dialectics. Lancet Neurol. 2004;3:184–190. doi: 10.1016/S1474-4422(04)00683-0. [DOI] [PubMed] [Google Scholar]
- 37.Johnson KA, Moran EK, Becker JA, Blacker D, Fischman AJ, Albert MS. Single photon emission computed tomography perfusion differences in mild cognitive impairment. J Neurol Neurosurg Psychiatry. 2007;78:240–247. doi: 10.1136/jnnp.2006.096800. [DOI] [PMC free article] [PubMed] [Google Scholar]
- 38.Huang C, Wahlund LO, Svensson L. Cingulate cortex hypoperfusion predicts Alzheimer’s disease in mild cognitive impairment. BMC Neurol. 2002;12:9. doi: 10.1186/1471-2377-2-9. [DOI] [PMC free article] [PubMed] [Google Scholar]
- 39.Caroli A, Testa C, Geroldi C, Nobili F, Barnden LR, Guerra U, Bonetti M, Frisoni GB. Cerebral perfusion correlates of conversion to Alzheimer’s disease in amnestic mild cognitive impairment. J Neurol. 2007;254:1698–1707. doi: 10.1007/s00415-007-0631-7. [DOI] [PubMed] [Google Scholar]
- 40.Meyer JS, Rauch G, Rauch RA, Haque A. Risk factors for cerebral hypoperfusion, mild cognitive impairment and dementia. Neurobiol Aging. 2000;21:161–169. doi: 10.1016/s0197-4580(00)00136-6. [DOI] [PubMed] [Google Scholar]
- 41.Breteler MM. Vascular involvement in cognitive decline and dementia: Epidemiologic evidence from the Rotterdam Study and the Rotterdam Scan Study. Ann NY Acad Sci. 2000;903:457–465. doi: 10.1111/j.1749-6632.2000.tb06399.x. [DOI] [PubMed] [Google Scholar]
- 42.de la Torre JC. Alzheimer’s disease: How does it start? J Alzheimers Dis. 2002;4:497–512. doi: 10.3233/jad-2002-4606. [DOI] [PubMed] [Google Scholar]
- 43.de la Torre JC. Vascular risk factor detection and control may prevent Alzheimer’s disease. Aging Res Rev. 2010;9:218–225. doi: 10.1016/j.arr.2010.04.002. [DOI] [PubMed] [Google Scholar]
- 44.Woodruff-Pak DS. Animal models of Alzheimer’s disease: Therapeutic implications. J Alzheimers Dis. 2008;15:507–521. doi: 10.3233/jad-2008-15401. [DOI] [PubMed] [Google Scholar]
- 45.Driscoll M, Gerstbrein B. Dying for a cause: Invertebrate genetics takes on human neurodegeneration. Nat Rev Genet. 2003;4:181–194. doi: 10.1038/nrg1018. [DOI] [PubMed] [Google Scholar]
- 46.Khurana V. Modeling taupathology in the fruit fly Drosophila melanogaster. J Alzheimers Dis. 2008;15:541–553. doi: 10.3233/jad-2008-15403. [DOI] [PubMed] [Google Scholar]
- 47.Frautschy SA, Baird A, Cole GM. Effects of injected Alzheimer beta-amyloid cores in rat brain. Proc Natl Acad Sci USA. 1991;88:8362–8366. doi: 10.1073/pnas.88.19.8362. [DOI] [PMC free article] [PubMed] [Google Scholar]
- 48.Seabrook GR, Rosahl TW. Transgenic animals relevant to Alzheimer’s disease. Neuropharmacology. 1999;38:1–17. doi: 10.1016/s0028-3908(98)00170-1. [DOI] [PubMed] [Google Scholar]
- 49.Arendash GW, King DL, Gordon MN, Morgan D, Hatcher JM, Hope CE, Diamond DM. Progressive, age-related behavioural impairments in transgenic mice carrying both mutant amyloid precursor protein and presenilin-1 transgenes. Brain Res. 2001;891:42–53. doi: 10.1016/s0006-8993(00)03186-3. [DOI] [PubMed] [Google Scholar]
- 50.Frautschy SA, Baird A, Cole GM. Effects of injected Alzheimer beta-amyloid cores in rat brain. Proc Natl Acad Sci USA. 1991;88:8362–8366. doi: 10.1073/pnas.88.19.8362. [DOI] [PMC free article] [PubMed] [Google Scholar]
- 51.Frautschy SA, Yang F, Calderon L, Cole GM. Rodent models of Alzheimer’s disease: Rat Aβ infusion approaches to amyloid deposits. Neurobiol Aging. 1996;17:311–321. doi: 10.1016/0197-4580(95)02073-x. [DOI] [PubMed] [Google Scholar]
- 52.Cotman CW, Head E. The canine (dog) model of human aging and disease: Dietary environmental and immunotherapy approaches. J Alzheimers Dis. 2008;15:685–707. doi: 10.3233/jad-2008-15413. [DOI] [PubMed] [Google Scholar]
- 53.Irle E, Kessler J, Markowitz HJ, Hofmann W. Primate learning tasks reveal strong impairments in patients with presenile or senile dementia of the Alzheimer’s type. Brain Cogn. 1987;6:429–449. doi: 10.1016/0278-2626(87)90138-2. [DOI] [PubMed] [Google Scholar]
- 54.Buccafusco JJ. Estimation of working memory in macaques for studying drugs for the treatment of cognitive disorders. J Alzheimers Dis. 2008;15:709–720. doi: 10.3233/jad-2008-15414. [DOI] [PubMed] [Google Scholar]
- 55.DeKosky ST, Marek K. Looking backward to move forward: Early detection of neurodegenerative disorders. Science. 2003;302:830–834. doi: 10.1126/science.1090349. [DOI] [PubMed] [Google Scholar]
- 56.Scheltens P, Fox N, Barkhof F, De Carli C. Structural magnetic resonance imaging in the practical assessment of dementia: Beyond exclusion. Lancet Neurol. 2002;1:13–21. doi: 10.1016/s1474-4422(02)00002-9. [DOI] [PubMed] [Google Scholar]
- 57.Glodzik-Sobanska L, Rusinek H, Mosconi L, Li Y, Zhan J, de Santi S, Convit A, Rich K, Brys M, de Leon MJ. The role of quantitative structural imaging in the early diagnosis of Alzheimer’s disease. Neuroimag Clin N Am. 2005;15:803–826. doi: 10.1016/j.nic.2005.09.004. [DOI] [PubMed] [Google Scholar]
- 58.Mori E, Yoneda Y, Yamashita H, Hirono N, Ikeda M, Yamadori A. Medial temporal structures relate to memory impairment in Alzheimer’s disease: An MRI volumetric study. J Neurol Neurosug Psychiatry. 1997;63:214–221. doi: 10.1136/jnnp.63.2.214. [DOI] [PMC free article] [PubMed] [Google Scholar]
- 59.Thompson PM, Hayashi KM, de Zubicaray G, Janke AL, Rose SE, Semple J, Herman D, Hong MS, Dittmer SS, Doddrell DM, Toga AW. Dynamics of gray matter loss in Alzheimer’s disease. J Neurosci. 2003;23:994–1005. doi: 10.1523/JNEUROSCI.23-03-00994.2003. [DOI] [PMC free article] [PubMed] [Google Scholar]
- 60.Lehtovirta M, Laakso MP, Soininen H, Helisalmi S, Mannermaa A, Helkala EL, Partanen K, Ryynanen M, Vainio P, Hartikainen P, Riekkinen PJ Sr. Volumes of hippocampus, amygdala and frontal lobe in Alzheimer patients with different apolipoprotein E genotypes. Neuroscience. 1995;67:65–72. doi: 10.1016/0306-4522(95)00014-a. [DOI] [PubMed] [Google Scholar]
- 61.Juottonen K, Lehtovirta M, Helisalmi S, Riekkinen PJ Sr, Soininen H. Major decrease in the volume of the entorhinal cortex in patients with Alzheimer’s disease carrying the apolipoprotein E e4 allele. J Neurol Neurosurg Psychiatry. 1998;65:322–327. doi: 10.1136/jnnp.65.3.322. [DOI] [PMC free article] [PubMed] [Google Scholar]
- 62.Lehtovirta M, Soininen H, Laakso MP, Partanen K, Helisalmi S, Mannermaa A, Ryynanen M, Kuikka J, Hartikainen P, Riekkinen PJ Sr. SPECT and MRI analysis in Alzheimer’s disease: Relation to apolipoprotein E e4 allele. J Neurol Neurosurg Psychiatry. 1996;60:644–649. doi: 10.1136/jnnp.60.6.644. [DOI] [PMC free article] [PubMed] [Google Scholar]
- 63.Schmidt H, Schmidt R, Fazekas F, Semmler J, Kapeller P, Reinhart B, Kostner GM. Apolipoprotein E e4 allele in the normal elderly: Neuropsychologic and brain MRI correlates. Clin Genet. 1996;50:293–299. doi: 10.1111/j.1399-0004.1996.tb02377.x. [DOI] [PubMed] [Google Scholar]
- 64.Reiman EM, Uecker A, Caselli RJ, Lewis S, Bandy D, de Leon MJ, De Santi S, Convit A, Osborne D, Weaver A, Thibodeau SN. Hippocampal volumes in cognitively normal persons at genetic risk for Alzheimer’s disease. Ann Neurol. 1998;44:288–291. doi: 10.1002/ana.410440226. [DOI] [PubMed] [Google Scholar]
- 65.Tohgi H, Takahashi S, Kato E, Homma A, Niina R, Sasaki K, Yonezawa H, Sasaki M. Reduced size of right hippocampus in 39- to 80-year-old normal subjects carrying the apolipoprotein E e4 allele. Neurosci Lett. 1997;236:21–24. doi: 10.1016/s0304-3940(97)00743-x. [DOI] [PubMed] [Google Scholar]
- 66.Whitwell JL, Shiung MM, Przybelski SA, Weigand SD, Knopman DS, Boeve BF, Petersen RC, Jack CR Jr. MRI patterns of atrophy associated with progression to AD in amnestic mild cognitive impairment. Neurology. 2008;70:512–520. doi: 10.1212/01.wnl.0000280575.77437.a2. [DOI] [PMC free article] [PubMed] [Google Scholar]
- 67.Sluimer JD, Vrenken H, Blankenstein MA, Fox NC, Scheltens P, Barkhof F, van der Flier WM. Whole-brain atrophy rate in Alzheimer disease: Identifying fast progressors. Neurology. 2008;70:1836–1841. doi: 10.1212/01.wnl.0000311446.61861.e3. [DOI] [PubMed] [Google Scholar]
- 68.Dubois B, Feldman HH, Jacova C, DeKosky ST, Barberger-Gateau P, Cummings J, Delacourte A, Galasko D, Gauthier S, Jicha G, Meguro K, O’Brien J, Pasquier F, Robert P, Rossor M, Salloway S, Stern Y, Visser PJ, Scheltens P. Research criteria for the diagnosis of Alzheimer’s disease: revising the NINCDS-ADRDA criteria. Lancet Neurol. 2007;6:734–746. doi: 10.1016/S1474-4422(07)70178-3. [DOI] [PubMed] [Google Scholar]
- 69.Nestor PJ, Fryer TD, Smielewski P, Hodges JR. Limbic hypometabolism in Alzheimer’s disease and mild cognitive impairment. Ann Neurol. 2003;54:343–351. doi: 10.1002/ana.10669. [DOI] [PubMed] [Google Scholar]
- 70.Chetelat G, Desgranges B, de la Sayette V, Viader F, Eustache F, Baron JC. Mild cognitive impairment: can FDG-PET predict who is to rapidly convert to Alzheimer’s disease. Neurology. 2003;60:1374–1377. doi: 10.1212/01.wnl.0000055847.17752.e6. [DOI] [PubMed] [Google Scholar]
- 71.Huang C, Eidelberg D, Habeck C, Moeller J, Svensson L, Tarabula T, Julin P. Imaging markers of mild cognitive impairment: multivariate analysis of CBF SPECT. Neurobiol Aging. 2007;28:1062–1069. doi: 10.1016/j.neurobiolaging.2006.05.017. [DOI] [PubMed] [Google Scholar]
- 72.Klunk WE, Engler H, Nordberg A, Wang Y, Blomqvist G, Holt DP, Bergstrom M, Savitcheva I, Huang GF, Estrada S, Ausen B, Debnath ML, Barletta J, Price JC, Sandell J, Lopresti BJ, Wall A, Koivisto P, Antoni G, Mathis CA, Langstrom B. Imaging brain amyloid in Alzheimer’s disease with Pittsburgh compound-B. Ann Neurol. 2004;55:306–319. doi: 10.1002/ana.20009. [DOI] [PubMed] [Google Scholar]
- 73.Ikonomovic MD, Klunk WE, Abrahamson EE, Mathis CA, Price JC, Tsopelas ND, Lopresti BJ, Ziolko S, Bi W, Paljug WR, Debnath ML, Hope CE, Isanski BA, Hamilton RL, DeKosky ST. Post-mortem correlates of in vivo PiB-PET amyloid imaging in a typical case of Alzheimer’s disease. Brain. 2008;131:1630–1645. doi: 10.1093/brain/awn016. [DOI] [PMC free article] [PubMed] [Google Scholar]
- 74.Forsberg A, Engler H, Almkvist O, Blomquist G, Hagman G, Wall A, Ringheim A, Langstrom B, Nordberg A. PET imaging of amyloid deposition in patients with mild cognitive impairment. Neurobiol Aging. 2008;29:1456–1465. doi: 10.1016/j.neurobiolaging.2007.03.029. [DOI] [PubMed] [Google Scholar]
- 75.Okello A, Koivunen J, Edison P, Archer HA, Turkheimer FE, Nagren K, Bullock R, Walker Z, Kennedy A, Fox NC, Rossor MN, Rinne JO, Brooks DJ. Conversion of amyloid positive and negative MCI to AD over 3 years: An 11C-PIB PET study. Neurology. 2009;73:754–760. doi: 10.1212/WNL.0b013e3181b23564. [DOI] [PMC free article] [PubMed] [Google Scholar]
- 76.Choi SR, Golding G, Zhuang Z, Zhang W, Lim N, Hefti F, Benedum TE, Kilbourn MR, Skovronsky D, Kung HF. Preclinical properties of 18F-AV-45: A PET agent for Aβ plaques in the brain. J Nucl Med. 2009;50:1887–1894. doi: 10.2967/jnumed.109.065284. [DOI] [PMC free article] [PubMed] [Google Scholar]
- 77.Devanand DP, Van Heertum RL, Kegeles LS, Liu X, Jin ZH, Pradhaban G, Rusinek H, Pratap M, Pelton GH, Prohovnik I, Stern Y, Mann JJ, Parsey R. 99mTc HMPAO SPECT prediction of conversion from mild cognitive impairment to Alzheimer disease. Am J Geriatr Psychiatry. 2010;18:959–972. doi: 10.1097/JGP.0b013e3181ec8696. [DOI] [PMC free article] [PubMed] [Google Scholar]
- 78.Alsop DC, Detre JA, Grossman M. Assessment of cerebral blood flow in Alzheimer’s disease by spin-labeled magnetic resonance imaging. Ann Neurol. 2000;47:93–100. [PubMed] [Google Scholar]
- 79.Johnson NA, Jahng GH, Weiner MW, Miller BL, Chui HC, Jagust WJ, Gorno-Tempini ML, Schuff N. Pattern of cerebral hypoperfusion in Alzheimer disease and mild cognitive impairment measured with arterial spin-labeling MR imaging: initial experience. Radiology. 2005;234:851–859. doi: 10.1148/radiol.2343040197. [DOI] [PMC free article] [PubMed] [Google Scholar]
- 80.Petersen ET, Lim T, Golay X. Model-free arterial spin labelling quantification approach for perfusion MRI. Magn Reson Med. 2006;55:219–232. doi: 10.1002/mrm.20784. [DOI] [PubMed] [Google Scholar]
- 81.Yoshiura T, Hiwatashi A, Yamashita K, Ohyagi Y, Monji A, Takayama Y, Nagao E, Kamano H, Noguchi T, Honda H. Simultaneous measurement of arterial transit time, arterial blood volume, and cerebral blood flow using arterial spin-labeling in patients with Alzheimer’s disease. Am J Neuroradiol. 2009;30:1388–1393. doi: 10.3174/ajnr.A1562. [DOI] [PMC free article] [PubMed] [Google Scholar]
- 82.Mak HKF, Chan Q, Zhang Z, Petersen ET, Qiu D, Zhang L, Yau KKW, Chu LW, Golay X. Quantitative assessment of cerebral hemodynamic parameters by QUASAR arterial spin labelling in Alzheimer’1(1):s disease and cognitively normal elderly adults at 3-Tesla. J Alzheimer’s Dis. 2012 doi: 10.3233/JAD-2012-111877. (in press) [DOI] [PubMed] [Google Scholar]
- 83.Bartzokis G. Age-related myelin breakdown: A developmental model of cognitive decline and Alzheimer’s disease. Neurobiol Aging. 2004;25:5–18. doi: 10.1016/j.neurobiolaging.2003.03.001. [DOI] [PubMed] [Google Scholar]
- 84.Decarli C, Miller BL, Swn GE, Reed T, Wolf PA, Carmelli D. Cerebrovascular and brain morphologic correlates of mild cognitive impairment in the National Heart, Lung, and Blood Institute twin study. Arch Neurol. 2001;58:643–647. doi: 10.1001/archneur.58.4.643. [DOI] [PubMed] [Google Scholar]
- 85.Wolf H, Ecke GM, Bettin S, Dietrich J, Gertz HJ. Do white matter changes contribute to the subsequent development of dementia in patients with mild cognitive impairment? A longitudinal study. Int J Geriatr Psychiatry. 2000;15:803–812. doi: 10.1002/1099-1166(200009)15:9<803::aid-gps190>3.0.co;2-w. [DOI] [PubMed] [Google Scholar]
- 86.Bozzali M, Falini A, Franceschi M, Cercignani M, Zuffi M, Scotti G, Comi G, Filippi M. White matter damage in Alzheimer’s disease assessed in vivo using diffusion tensor magnetic resonance imaging. J Neurol Neurosurg Psychiatry. 2002;72:742–746. doi: 10.1136/jnnp.72.6.742. [DOI] [PMC free article] [PubMed] [Google Scholar]
- 87.Stahl R, Dietrich O, Teipel SJ, Hampel H, Reiser MF, Schoenberg SO. White matter damage in Alzheimer disease and mild cognitive impairment: Assessment with diffusion-tensor MR imaging and parallel imaging techniques. Radiology. 2007;243:483–492. doi: 10.1148/radiol.2432051714. [DOI] [PubMed] [Google Scholar]
- 88.Hanyu H, Asano T, Sakurai H, Imon Y, Iwamoto T, Takasaki M, Shindo H, Abe K. Diffusion-weighted and magnetisation transfer imaging of the corpus callosum in Alzheimer’s disease. J Neurol Sci. 1999;167:37–44. doi: 10.1016/s0022-510x(99)00135-5. [DOI] [PubMed] [Google Scholar]
- 89.Fellgiebel A, Wille P, Muller MJ, Winterer G, Scheurich A, Vucurevic G, Schmidt LG, Stoeter P. Ultrastructural hippocampal and white matter alterations in mild cognitive impairment: A diffusion tensor imaging study. Dement Geriatr Cogn Disord. 2004;18:101–108. doi: 10.1159/000077817. [DOI] [PubMed] [Google Scholar]
- 90.Wu EX, Cheung MM. MR diffusion kurtosis imaging for neural tissue characterisation. NMR Biomed. 2010;23:836–848. doi: 10.1002/nbm.1506. [DOI] [PubMed] [Google Scholar]
- 91.Assaf Y, Cohen Y. Non-mono-exponential attenuation of water and N-acetyl aspartate signals due to diffusion in brain tissue. J Magn Reson. 1998;131:69–85. doi: 10.1006/jmre.1997.1313. [DOI] [PubMed] [Google Scholar]
- 92.Falangola MF, Jensen JH, Babb JS, Hu C, Castellanos FX, Di Martino A, Ferris SH, Helpern JA. Age-related non-Gaussian diffusion patterns in the prefrontal brain. J Magn Reson Imaging. 2008;28:1345–1350. doi: 10.1002/jmri.21604. [DOI] [PMC free article] [PubMed] [Google Scholar]
- 93.Wang JJ, Lin WY, Lu CS, Weng YH, Ng SH, Wang CH, Liu HL, Hsieh RH, Wan YL, Wai YY. Parkinson disease: Diagnostic utility of diffusion kurtosis imaging. Radiology. 2011;261:210–217. doi: 10.1148/radiol.11102277. [DOI] [PubMed] [Google Scholar]
- 94.Mandal PK. Magnetic resonance spectroscopy (MRS) and its application in Alzheimer’s disease. Concepts Magn Reson. 2007;30A:40–64. [Google Scholar]
- 95.Soares DP, Law M. Magnetic resonance spectroscopy of the brain: Review of metabolites and clinical applications. Clin Radiol. 2009;64:12–21. doi: 10.1016/j.crad.2008.07.002. [DOI] [PubMed] [Google Scholar]
- 96.Parnetti L, Tarducci R, Presciutti O, Lowenthal DT, Pippi M, Palumbo B, Gobbi G, Pelliccioli GP, Senin U. Proton magnetic resonance spectroscopy can differentiate Alzheimer’s disease from normal aging. Mech Aging Dev. 1997;97:9–14. doi: 10.1016/s0047-6374(97)01877-0. [DOI] [PubMed] [Google Scholar]
- 97.Kantarci K, Jack CR, Xu YC, Campeau NG, O’Brien PC, Smith GE, Ivnik RJ, Boeve BF, Kokmen E, Tangalos EG, Petersen RC. Regional metabolic patterns in mild cognitive impairment and Alzheimer’s disease: A 1H MRS study. Neurology. 2000;55:210–217. doi: 10.1212/wnl.55.2.210. [DOI] [PMC free article] [PubMed] [Google Scholar]
- 98.Wang Z, Zhao C, Yu L, Zhou W, Li K. Regional metabolic changes in the hippocampus and posterior cingulate area detected with 3-Tesla magnetic resonance spectroscopy in patients with mild cognitive impairment and Alzheimer disease. Acta Radiol. 2009;50:312–319. doi: 10.1080/02841850802709219. [DOI] [PubMed] [Google Scholar]
- 99.Klunk WE, Xu C, Panchalingam K, McClure RJ, Pettegrew JW. Quantitative 1H and 31P MRS of PCA extracts of post-mortem Alzheimer’s disease brain. Neurobiol Aging. 1996;17:349–357. doi: 10.1016/0197-4580(96)00035-8. [DOI] [PubMed] [Google Scholar]
- 100.Pettegrew JW, Panchalingam K, Moossy J, Martinez J, Rao G, Boller F. Correlation of phosphorus-31 magnetic resonance spectroscopy and morphologic findings in Alzheimer’s disease. Arch Neurol. 1988;45:1093–1096. doi: 10.1001/archneur.1988.00520340047010. [DOI] [PubMed] [Google Scholar]
- 101.Pettegrew JW, Withers G, Panchalingam K, Post JF. 31P nuclear magnetic resonance (NMR) spectroscopy of brain in aging and Alzheimer’s disease. J Neural Transm. 1987;24:261–268. [PubMed] [Google Scholar]
- 102.Mandal PK, Akolkar H. A new experimental approach and signal processing scheme for the detection and quantitation of 31P brain neurochemicals from in vivo MRS studies using dual tuned (1H/31P) head coil. Biochem Biophys Res Commun. 2011;412:302–306. doi: 10.1016/j.bbrc.2011.07.088. [DOI] [PubMed] [Google Scholar]
- 103.Metastasio A, Rinaldi P, Tarducci R, Mariani E, Feliziani FT, Cherubini A, Pelliccioli GP, Gobbi G, Senin U, Mecocci P. Conversion of MCI to dementia: Role of proton magnetic resonance spectroscopy. Neurobiol Aging. 2006;27:926–932. doi: 10.1016/j.neurobiolaging.2005.05.002. [DOI] [PubMed] [Google Scholar]
- 104.Kantarci K, Weigand SD, Petersen RC, Boeve BF, Knopman DS, Gunter J, Reyes D, Shiung M, O’Brien PC, Smith GE, Ivnik RJ, Tangalos EG, Jack CR Jr. Longitudinal 1H MRS changes in mild cognitive impairment and Alzheimer’s disease. Neurobiol Aging. 2007;28:1330–1339. doi: 10.1016/j.neurobiolaging.2006.06.018. [DOI] [PMC free article] [PubMed] [Google Scholar]
- 105.DeKosky ST, Ikonomovic MD, Styren SD, Beckett L, Wisniewski S, Bennett DA, Cochran EJ, Kordower JH, Mufson EJ. Upregulation of choline acetyltransferase activity in hippocampus and frontal cortex of elderly subjects with mild cognitive impairment. Ann Neurol. 2002;51:145–155. doi: 10.1002/ana.10069. [DOI] [PubMed] [Google Scholar]
- 106.Jellinger K, Paulus W, Grundke-Igbal I, Riederer P, Youdim MB. Brain iron and ferritin in Parkinson’s and Alzheimer’s diseases. J Neural Transm Park Dis Dement Sect. 1990;2:327–340. doi: 10.1007/BF02252926. [DOI] [PubMed] [Google Scholar]
- 107.Lee SP, Falangola MF, Nixon RA, Duff K, Helpern JA. Visualisation of β-amyloid plaques in a transgenic mouse model of Alzheimer’s disease using MR microscopy without contrast reagents. Magn Reson Med. 2004;52:538–544. doi: 10.1002/mrm.20196. [DOI] [PMC free article] [PubMed] [Google Scholar]
- 108.Chamberlain R, Wengenack TM, Poduslo JF, Garwood M, Jack CR Jr. Magnetic resonance imaging of amyloid plaques in transgenic mouse models of Alzheimer’s disease. Curr Med Imaging Rev. 2011;7:3–7. doi: 10.2174/157340511794653522. [DOI] [PMC free article] [PubMed] [Google Scholar]
- 109.Jack CR Jr, Lowe VJ, Senjem ML, Weigand SD, Kemp BJ, Shiung MM, Knopman DS, Boeve BF, Klunk WE, Mathis CA, Petersen RC. 11C PiB and structural MRI provide complementary information in imaging of Alzheimer’s disease and amnestic mild cognitive impairment. Brain. 2008;131:665–680. doi: 10.1093/brain/awm336. [DOI] [PMC free article] [PubMed] [Google Scholar]
- 110.Games D, Adams D, Alessandrini R, Barbour R, Berthelette P, Blackwell C, Carr T, Clemens J, Donaldson T, Gillespie F, Guido T, Hagopian S, Johnson-Wood K, Khan K, Lee M, Leibowitz P, Lieberburg I, Little S, Masliah E, McConlogue L, Montoya-Zavala M, Mucke L, Paganini L, Penniman E, Power M, Schenk D, Seubert P, Snyder B, Soriano F, Tan H, Vitale J, Wadsworth S, Wolozin B, Zhao J. Alzheimer-type neuropathology in transgenic mice overexpressing V717F beta-amyloid precursor protein. Nature. 1995;373:523–527. doi: 10.1038/373523a0. [DOI] [PubMed] [Google Scholar]
- 111.Zheng H, Jiang M, Trumbauer ME, Sirinathsinghji DJS, Hopkins R, Smith DW, Heavens RP, Dawson GR, Boyce S, Conner MW, Stevens KA, Slunt HH, Sisodia SS, Chen HY, Van der Ploeg LHT. β-amyloid precursor protein-deficient mice show reactive gliosis and decreased locomotor activity. Cell. 1995;81:525–531. doi: 10.1016/0092-8674(95)90073-x. [DOI] [PubMed] [Google Scholar]
- 112.Wong PC, Zheng H, Chen H, Becher MW, Sirinathsinghji DJ, Trumbauer ME, Chen HY, Price DL, Van der Ploeg LHT, Sisodia SS. Presenilin 1 is required for Notch1 and DII1 expression in the paraxial mesoderm. Nature. 1997;387:288–292. doi: 10.1038/387288a0. [DOI] [PubMed] [Google Scholar]
- 113.Hsiao K, Chapman P, Nilsen S, Eckman C, Harigaya Y, Younkin S, Yang F, Cole G. Correlative memory deficits, Aβ elevation, and amyloid plaques in transgenic mice. Science. 1996;274:99–102. doi: 10.1126/science.274.5284.99. [DOI] [PubMed] [Google Scholar]
- 114.Sturchler-Pierrat C, Abramowski D, Duke M, Wiederhold KH, Mistl C, Rothacher S, Ledermann B, Burki K, Frey P, Paganetti PA, Waridel C, Calhoun ME, Jucker M, Probst A, Staufenbiel M, Sommer B. Two amyloid precursor protein transgenic mouse models with Alzheimer disease-like pathology. Proc Natl Acad Sci USA. 1997;94:13287–13292. doi: 10.1073/pnas.94.24.13287. [DOI] [PMC free article] [PubMed] [Google Scholar]
- 115.Davis J, Xu F, Deane R, Romanov G, Previti ML, Zeigler K, Zlokovic BV, Van Nostrand WE. Early-onset and robust cerebral microvascular accumulation of amyloid beta-protein in transgenic mice expressing low levels of a vasculotropic Dutch/Iowa mutant form of amyloid beta-protein precursor. J Biol Chem. 2004;279:20296–20306. doi: 10.1074/jbc.M312946200. [DOI] [PubMed] [Google Scholar]
- 116.Seabrook GR, Smith DW, Bowery BJ, Easter A, Reynolds T, Fitzjohn SM, Morton RA, Zheng H, Dawson GR, Sirinathsinghji DJ, Davies CH, Collingridge GL, Hill RG. Mechanisms contributing to the deficits in hippocampal synaptic plasticity in mice lacking amyloid precursor protein. Neuropharmacology. 1999;38:349–359. doi: 10.1016/s0028-3908(98)00204-4. [DOI] [PubMed] [Google Scholar]
- 117.Shen J, Bronson RT, Chen DF, Xia W, Selkoe DJ, Tonegawa S. Skeletal and CNS defects in Presenilin-1-deficient mice. Cell. 1997;89:629–639. doi: 10.1016/s0092-8674(00)80244-5. [DOI] [PubMed] [Google Scholar]
- 118.Duff K, Eckman C, Zehr C, Yu X, Prada CM, Perez-tur J, Hutton M, Buee L, Harigaya Y, Yager D, Morgan D, Gordon MN, Holcomb L, Refolo L, Zenk B, Hardy J, Younkin S. Increased amyloid-beta42(43) in brains of mice expressing mutant presenilin 1. Nature. 1996;383:710–713. doi: 10.1038/383710a0. [DOI] [PubMed] [Google Scholar]
- 119.Borchelt DR, Thinakaran G, Eckman CB, Lee MK, Davenport F, Ratovitsky T, Prada CM, Kim G, Seekins S, Yager D, Slunt HH, Wang R, Seeger M, Levey Al, Gandy SE, Copeland NG, Jenkins NA, Price DL, Younkin SG, Sisodia SS. Familial Alzheimer’s disease-linked presenilin 1 variants elevate Aβ1-42/1-40 ratio in vitro and in vivo. Neuron. 1996;17:1005–1013. doi: 10.1016/s0896-6273(00)80230-5. [DOI] [PubMed] [Google Scholar]
- 120.Citron M, Westway D, Xia W, Carlson G, Diehl T, Levesque G, Johnson-Wood K, Lee M, Seubert P, Davis A, Kholodenko D, Motter R, Sherrington R, Perry B, Yao H, Strome R, Lieberburg I, Rommens J, Kim S, Schenk D, Fraser P, St George Hyslop P, Selkoe DJ. Mutant presenilins of Alzheimer’s disease increase production of 42-residue amyloid beta-protein in both transfected cells and transgenic mice. Nat Med. 1997;3:67–72. doi: 10.1038/nm0197-67. [DOI] [PubMed] [Google Scholar]
- 121.Borchelt DR, Ratovitski T, van Lare J, Lee MK, Gonzales V, Jenkins NA, Copeland NG, Price DL, Sisodia SS. Accelerated amyloid deposition in the brains of transgenic mice coexpressing mutant presenilin 1 and amyloid precursor proteins. Neuron. 1997;19:939–945. doi: 10.1016/s0896-6273(00)80974-5. [DOI] [PubMed] [Google Scholar]
- 122.Holcomb L, Gordon MN, McGowan E, Yu X, Benkovic S, Jantzen P, Wright K, Saad I, Mueller R, Morgan D, Sanders S, Zehr C, O’Campo K, Hardy J, Prada CM, Eckman C, Younkin S, Hsiao K, Duff K. Accelerated Alzheimer-type phenotype in transgenic mice carrying both mutant amyloid precursor protein and presenilin 1 transgenes. Nat Med. 1998;4:97–100. doi: 10.1038/nm0198-097. [DOI] [PubMed] [Google Scholar]
- 123.Radde R, Duma C, Goedert M, Jucker M. The value of incomplete mouse models of Alzheimer’s disease. Eur J Nucl Med Mol Imaging. 2008;35:S70–74. doi: 10.1007/s00259-007-0704-y. [DOI] [PubMed] [Google Scholar]
- 124.Schwab C, Hosokawa H, McGeer PL. Transgenic mice overexpressing amyloid beta protein are an incomplete model of Alzheimer’s disease. Exp Neurol. 2004;188:52–64. doi: 10.1016/j.expneurol.2004.03.016. [DOI] [PubMed] [Google Scholar]
- 125.Colton CA, Wilcock DM, Wink DA, Davis J, Van Nostrand WE, Vitek MP. The effects of NOS2 gene deletion on mice expressing mutated human AβPP. J Alzheimers Dis. 2008;15:571–587. doi: 10.3233/jad-2008-15405. [DOI] [PMC free article] [PubMed] [Google Scholar]
- 126.Nabeshi H, Oikawa S, Inoue S, Nishino K, Kawanishi S. Proteomic analysis for protein carbonyl as an indicator of oxidative damage in senescence-accelerated mice. Free Radic Res. 2006;40:1173–1181. doi: 10.1080/10715760600847580. [DOI] [PubMed] [Google Scholar]
- 127.Morley JE, Farr SA, Kumar VB, Banks WA. Alzheimer’s disease through the eye of a mouse. Peptide. 2002;23:289–299. doi: 10.1016/s0196-9781(01)00630-1. [DOI] [PubMed] [Google Scholar]
- 128.Borthakur A, Gur T, Wheaton AJ, Corbo M, Trojanowski JQ, Lee VM, Reddy R. In vivo measurement of plaque burden in a mouse model of Alzheimer’s disease. J Magn Reson Imaging. 2006;24:1011–1017. doi: 10.1002/jmri.20751. [DOI] [PMC free article] [PubMed] [Google Scholar]
- 129.Jack CR Jr, Garwood M, Wengenack TM, Borowski B, Curran GL, Lin J, Adriany G Grohn OHJ, Grimm R, Poduslo JF. In vivo visualisation of Alzheimer’s amyloid plaques by magnetic resonance imaging in transgenic mice without a contrast agent. Magn Reson Med. 2004;52:1263–1271. doi: 10.1002/mrm.20266. [DOI] [PMC free article] [PubMed] [Google Scholar]
- 130.Vanhoutte G, Dewachter I, Borghgraef P, Van Leuven F, Van der Linden A. Noninvasive in vivo MRI detection of neuritic plaques associated with iron in APP[V7171] transgenic mice, a model for Alzheimer’s disease. Magn Reson Med. 2005;53:607–613. doi: 10.1002/mrm.20385. [DOI] [PubMed] [Google Scholar]
- 131.Braakman N, Matysik J, van Duinen SG, Verbeek F, Schliebs R, de Groot HJ, Alia A. Longitudinal assessment of Alzheimer’s β-amyloid plaque development in transgenic mice monitored by in vivo magnetic resonance microimaging. J Magn Reson Imaging. 2006;24:530–536. doi: 10.1002/jmri.20675. [DOI] [PubMed] [Google Scholar]
- 132.Dhenain M, El Tannir El Tayara N, Wu TD, Guegan M, Volk A, Quintana C, Delatour B. Characterisation of in vivo MRI detectable thalamic amyloid plaques from APP/PS1 mice. Neurobiol Aging. 2009;30:41–53. doi: 10.1016/j.neurobiolaging.2007.05.018. [DOI] [PubMed] [Google Scholar]
- 133.Zhang J, Yarowsky P, Gordon MN, Di Carlo G, Munireddy S, van Zijl PCM, Mori S. Detection of amyloid plaques in mouse models of Alzheimer’s disease by magnetic resonance imaging. Magn Reson Med. 2004;51(3):452–457. doi: 10.1002/mrm.10730. [DOI] [PubMed] [Google Scholar]
- 134.Benveniste H, Einstein G, Kim KR, Hulette C, Johnson GA. Detection of neuritic plaques in Alzheimer’s disease by magnetic resonance microscopy. Proc Natl Acad Sci USA. 1999;96:14079–14084. doi: 10.1073/pnas.96.24.14079. [DOI] [PMC free article] [PubMed] [Google Scholar]
- 135.Meadowcroft MD, Connor JR, Smith MB, Yang QX. MRI and histological analysis of beta-amyloid plaques in both human Alzheimer’s disease and APP/PS1 transgenic mice. J Magn Reson Imaging. 2009;29:997–1007. doi: 10.1002/jmri.21731. [DOI] [PMC free article] [PubMed] [Google Scholar]
- 136.Yang D, Xie Z, Stephenson D, Morton D, Hicks CD, Brown TM, Sriram R, O’Neill S, Raunig D, Bocan T. Volumetric MRI and MRS provide sensitive measures of Alzheimer’s disease neuropathology in inducible Tau transgenic mice (rTg4510) NeuroImage. 2011;54:2652–2658. doi: 10.1016/j.neuroimage.2010.10.067. [DOI] [PubMed] [Google Scholar]
- 137.Kuntner C, Kesner AL, Bauer M, Kremslehner R, Wanek T, Mandler M, Karch R, Stanek J, Wolf T, Muller M, Langer O. Limitations of small animal PET imaging with [18F] FDDNP and FDG for quantitative studies in a transgenic mouse model of Alzheimer’s disease. Mol Imaging Biol. 2009;11:236–240. doi: 10.1007/s11307-009-0198-z. [DOI] [PubMed] [Google Scholar]
- 138.Kepe V, Cole GM, Liu J, Shoghi-Jadid K, Flood DG, Trusko SP, Satyamurthy N, Huang SC, Small GW, Petric A, Phelps ME, Barrio JR. [F-18] microPET imaging of β-amyloid deposits in the living brain of triple transgenic rat model of β-amyloid deposition. Mol Imaging Biol. 2005;7:105. [Google Scholar]
- 139.Toyama H, Ye D, Ichise M, Liow JS, Cai L, Jacobowitz D, Musachio JL, Hong J, Crescenzo M, Tipre D, Lu JQ, Zoghbi S, Vines DC, Seidel J, Katada K, Green MV, Pike VW, Cohen RM, Innis RB. Pet imaging of brain with β-amyloid probe, [11C] 6-OH-BTA-1, in a transgenic mouse model of Alzheimer’s disease. Eur J Nucl Med Mol Imaging. 2005;32:593–600. doi: 10.1007/s00259-005-1780-5. [DOI] [PubMed] [Google Scholar]
- 140.McGeer PL, Itagaki S, Boyes BE, McGeer EG. Reactive microglia are positive for HLA-DR in the substantia nigra of Parkinson’s and Alzheimer’s disease brains. Neurology. 1988;38:1285–1291. doi: 10.1212/wnl.38.8.1285. [DOI] [PubMed] [Google Scholar]
- 141.Tan J, Town T, Paris D, Mori T, Suo Z, Crawford F, Mattson MP, Flavell RA, Mullan M. Microglial activation resulting from CD40-CD40L interaction after beta-amyloid stimulation. Science. 1999;286:2352–2355. doi: 10.1126/science.286.5448.2352. [DOI] [PubMed] [Google Scholar]
- 142.Wilcock DM, Rojiani A, Rosenthal A, Levkowitz G, Subbarao S, Alamed J, Wilson D, Wilson N, Freeman MJ, Gordon MN, Morgan D. Passive amyloid immunotherapy clears amyloid and transiently activates microglia in a transgenic mouse model of amyloid deposition. J Neurosci. 2004;24:6144–6151. doi: 10.1523/JNEUROSCI.1090-04.2004. [DOI] [PMC free article] [PubMed] [Google Scholar]
- 143.Bard F, Cannon C, Barbour R, Burke RL, Games D, Grajeda H, Guido T, Hu K, Huang J, Johnson-Wood K, Khan K, Kholodenko D, Lee M, Lieberburg I, Motter R, Nguyen M, Soriano F, Vasquez N, Weiss K, Welch B, Seubert P, Schenk D, Yednock T. Peripherally administered antibodies against amyloid beta-peptide enter the central nervous system and reduce pathology in a mouse model of Alzheimer disease. Nat Med. 2000;6:916–919. doi: 10.1038/78682. [DOI] [PubMed] [Google Scholar]
- 144.Venneti S, Lopresti BJ, Wang G, Hamilton RL, Mathis CA, Klunk WE, Apte UM, Wiley CA. PK11195 labels activated microglia in Alzheimer’s disease and in vivo in a mouse model using PET. Neurobiol Aging. 2009;30:1217–1226. doi: 10.1016/j.neurobiolaging.2007.11.005. [DOI] [PMC free article] [PubMed] [Google Scholar]
- 145.Song SK, Kim JH, Lin SJ, Brendza RP, Holtzman DM. Diffusion tensor imaging detects age-dependent white matter changes in a transgenic mouse model with amyloid deposition. Neurobiol Dis. 2004;15:640–647. doi: 10.1016/j.nbd.2003.12.003. [DOI] [PubMed] [Google Scholar]
- 146.Marjanska M, Curran GL, Wengenack TM, Henry PG, Bliss RL, Poduslo JF, Jack CR Jr, Ugurbil K, Garwood M. Monitoring disease progression in transgenic mouse models of Alzheimer’s disease with proton magnetic resonance spectroscopy. Proc Natl Acad Sci USA. 2005;102:11906–11910. doi: 10.1073/pnas.0505513102. [DOI] [PMC free article] [PubMed] [Google Scholar]
- 147.Dedeoglu A, Choi JK, Cormier K, Kowall NW, Jenkins BG. Magnetic resonance spectroscopic analysis of Alzheimer’s disease mouse brain that express mutant human APP shows altered neurochemical profile. Brain Res. 2004;1012:60–65. doi: 10.1016/j.brainres.2004.02.079. [DOI] [PubMed] [Google Scholar]
- 148.Jack CR Jr, Marjanska M, Wengenack TM, Reyes DA, Curran GL, Lin J, Preboske GM, Poduslo JF, Garwood M. Magnetic resonance imaging of Alzheimer’s pathology in the brains of living transgenic mice: A new tool in Alzheimer’s disease research. Neuroscientist. 2007;13:38–48. doi: 10.1177/1073858406295610. [DOI] [PubMed] [Google Scholar]
- 149.Schenk D, Barbour R, Dunn W, Gordon G, Grajeda H, Guido T, Hu k, Huang J, Johnson-Wood K, Khan K, Kholodenko D, Lee M, Liao Z, Lieberburg I, Motter R, Mutter L, Soriano F, Shopp G, Vasquez N, Vandevert C, Walker S, Wogulis M, Yednock T, Games D, Seubert P. Immunisation with amyloid-β attenuates Alzheimer-disease-like pathology in the PDAPP mouse. Nature. 1999;400:173–177. doi: 10.1038/22124. [DOI] [PubMed] [Google Scholar]
- 150.DeMattos RB, Bales KR, Cummins DJ, Dodart JC, Paul SM, Holtzman DM. Peripheral anti-Aβ antibody alters CNS and plasma Aβ clearance and decreases brain Aβ burden in a mouse model of Alzheimer’s disease. Proc Natl Acad Sci USA. 2001;98:8850–8855. doi: 10.1073/pnas.151261398. [DOI] [PMC free article] [PubMed] [Google Scholar]
- 151.Orgogozo JM, Gilman S, Dartigues JF, Laurent B, Puel M, Kirby LC, Jouanny P, Dubois B, Eisner L, Flitman S, Michel BF, Boada M, Frank A, Hock C. Subacute meningoencephalitis in a subset of patients with AD after Aβ42 immunisation. Neurology. 2003;61:46–54. doi: 10.1212/01.wnl.0000073623.84147.a8. [DOI] [PubMed] [Google Scholar]
- 152.Senior K. Dosing in phase II trial of Alzheimer’s vaccine suspended. Lancet Neurol. 2002;1:3. doi: 10.1016/s1474-4422(02)00023-6. [DOI] [PubMed] [Google Scholar]
- 153.Gandy S, Walker L. Toward modeling hemorrhagic and encephalitic complications of Alzheimer amyloid-β vaccination in nonhuman primates. Curr Opin Immunol. 2004;16:607–615. doi: 10.1016/j.coi.2004.08.002. [DOI] [PubMed] [Google Scholar]