

Abstract
Sarcoplasmic reticulum (SR) Ca2+ release mediates excitation–contraction coupling (ECC) in cardiac myocytes. It is triggered upon membrane depolarization by entry of Ca2+ via L-type Ca2+ channels (LTCCs), which undergo both voltage- and Ca2+-dependent inactivation (VDI and CDI, respectively). We developed improved models of L-type Ca2+ current and SR Ca2+ release within the framework of the Shannon–Bers rabbit ventricular action potential (AP) model. The formulation of SR Ca2+ release was modified to reproduce high ECC gain at negative membrane voltages. An existing LTCC model was extended to reflect more faithfully contributions of CDI and VDI to total inactivation. Ba2+ current inactivation included an ion-dependent component (albeit small compared with CDI), in addition to pure VDI. Under physiological conditions (during an AP) LTCC inactivates predominantly via CDI, which is controlled mostly by SR Ca2+ release during the initial AP phase, but by Ca2+ through LTCCs for the remaining part. Simulations of decreased CDI or K+ channel block predicted the occurrence of early and delayed afterdepolarizations. Our model accurately describes ECC and allows dissection of the relative contributions of different Ca2+ sources to total CDI, and the relative roles of CDI and VDI, during normal and abnormal repolarization.
Key points
The L-type Ca2+ current (ICa) plays an important role in regulation of excitation–contraction coupling and development of cardiac arrhythmias.
We studied theoretically ICa inactivation and the relative contributions of voltage-dependent inactivation (VDI) and Ca2+-dependent inactivation (CDI) to total inactivation, and we present an improved mathematical model of rabbit ventricular ICa.
The model proposes that inactivation observed when Ba2+ is the charge carrier includes a small contribution from ion-dependent inactivation (in addition to pure VDI), usually neglected by other modelling studies.
The model, identified and validated against a broad set of experimental data, is applied to study the relative roles of VDI and CDI (and the relative contributions of different Ca2+ sources to total CDI) during normal and abnormal repolarization.
The model predicts that CDI is crucial for repolarization, and that impairment of CDI may be arrhythmogenic by affecting intracellular Ca2+ cycling, through its effect on the ICa time course and Na+–Ca2+ exchanger activity.
Introduction
The L-type Ca2+ current (ICa) critically regulates excitation–contraction coupling (ECC) (Bers, 2001) by triggering sarcoplasmic reticulum (SR) Ca2+ release, and modulating action potential (AP) shape and duration (APD), i.e. maintaining the long AP plateau.
ICa plays an important role in the development of cardiac arrhythmias. Indeed, at the single myocyte level it has been implicated in the development of early afterdepolarizations (EADs) in classical studies by January and colleagues (January et al. 1988; January & Riddle, 1989), who presented evidence linking EADs in Purkinje fibres with reactivation of Ca2+ current during the AP plateau. Several modelling studies have highlighted the importance of ICa in EAD formation in different animal species and cardiac cell types (Zeng & Rudy, 1995; Tanskanen et al. 2005; Corrias et al. 2011). Under a number of pathophysiological conditions that tend to prolong APD (as in hypertrophic and failing hearts), ICa may become arrhythmogenic (Benitah et al. 2010), even in the absence of disease-induced alteration of the current itself, as the longer AP plateau provides more time for Ca2+ channel reactivation and facilitates the occurrence of EADs.
L-type Ca2+ channels (LTCCs) are activated by membrane depolarization and provide the main source of Ca2+ influx. The decay of ICa during depolarization due to current inactivation is both Ca2+ and voltage dependent (Lee et al. 1985). Intracellular Ca2+-dependent inactivation (CDI) is mediated by Ca2+ binding to calmodulin (CaM) tethered to the C-terminus of the channel (Peterson et al. 1999; Zuhlke et al. 1999). Current decay through LTCCs is markedly prolonged when Ba2+ is the charge carrier (Peterson et al. 2000; Bers, 2001). Ba2+ current inactivation has been considered widely to be purely voltage dependent (VDI) in both experimental and theoretical studies (Peterson et al. 2000; Findlay, 2002b; Faber et al. 2007; Mahajan et al. 2008b). However, a residual ion-dependent inactivation (IDI) does influence Ba2+ current (IBa) decay (Brunet et al. 2009; Grandi et al. 2010), given the ability of Ba2+ to bind CaM weakly (Ferreira et al. 1997). This has been neglected by previous studies and incorporated here. CDI is an important negative feedback mechanism that limits Ca2+ influx during APs, and may constitute a physiological safety mechanism against harmful Ca2+ overload (Benitah et al. 2010). Elimination of CDI in guinea pig ventricular myocytes via expression of Ca2+-insensitive CaM (CaM1234) produced ‘ultralong’ APs, and suggested a paradigm of AP control, whereby LTCCs attain dominance in controlling APD due to the faster kinetics of CDI compared with ongoing K+ channel activation during the plateau (Alseikhan et al. 2002).
We present here an improved theoretical model of LTCC kinetics that accounts for the weak Ba2+-dependent inactivation and the greater efficacy of ICa to trigger SR Ca2+ release at negative potentials. The model was validated extensively and recapitulates faithfully the relative importance of VDI and CDI in ICa inactivation. The model includes a small contribution of Ba2+-dependent inactivation that is observed when Ba2+ is the charge carrier, in addition to pure VDI. Thus the overall contribution of VDI to ICa inactivation is somewhat reduced compared to previous models. We incorporated this ICa model within the framework of the Shannon–Bers rabbit ventricular ECC model (Shannon et al. 2004). The formulation of SR Ca2+ release was modified to reproduce the experimentally measured membrane potential (Em) dependence of ECC gain. With this updated myocyte model, which was validated against a broad range of experimental data, we showed that CDI, dominated by SR Ca2+ release at the beginning of the AP and by Ca2+ via LTCCs for the remaining part, outweighs VDI in physiological conditions. Impairment of CDI is predicted to cause AP prolongation and triggered activity depending on its degree of reduction. New insights into EAD formation were obtained using the model, and ICa kinetics was analysed during these abnormal APs.
Methods
The Shannon–Bers model of a rabbit ventricular myocyte (Shannon et al. 2004) provided the computational framework for this study, where the only changes are on the ICa and ryanodine receptor (RyR) properties (Fig. 1), as described here and in the Supplemental Material.
Figure 1. RyR and ICa models.

A, schematic diagram of dyadic cleft fluxes of the rabbit ventricular myocyte AP model of Shannon et al. (2004). Voltage dependence of SR Ca2+ release was introduced as in inset. B, structure of the Mahajan et al. (2008b) LTCC model as modified for this study.
We modified the SR Ca2+ release formulation by adding an Em-dependent factor that reduces RyR Ca2+ flux at positive Em (Fig. 1A, inset). This is not meant to imply that RyR has intrinsic Em dependence, but this phenomenological adjustment allows our common pool model to recapitulate experiments showing lower efficacy of macroscopic ICa to trigger SR Ca2+ release at more positive Em (Supplemental Fig. S1A) (Beuckelmann & Wier, 1988; Bers, 2001; Altamirano & Bers, 2007). At more negative Em, fewer Ca2+ channels open, but the unitary flux is larger (due to larger driving force), causing more efficient Ca2+-induced Ca2+ release and higher ECC gain (measured as the ratio of Ca2+ transient, CaT, amplitude to peak ICa in Fig. S1B). Gain at negative Em is high, in part, because a single Ca2+ channel opening may trigger junctional release but as more channels are recruited (e.g. approaching 0 mV) there is more trigger redundancy of LTCC opening per release unit (and a consequently smaller denominator in the gain equation) (Altamirano & Bers, 2007). At increasingly positive Em (where unitary currents are small), multiple openings are needed to assure RyR opening, which results in lower gain. This circumvents the need here for local stochastic interactions between LTCCs and RyRs in thousands of Ca2+ release units (Restrepo et al. 2008; Lee et al. 2011). The modified formulation predicted higher CaT amplitude for a given ICa at negative Em and lower amplitude at positive Em (Fig. S1C) and the expected decreasing ECC gain with stronger depolarization (Fig. S1D).
The seven-state ICa model (Fig. 1B) by Mahajan et al. (2008b) was incorporated into the ECC model and parameters were constrained to match experimental data obtained under various Ba2+/Ca2+ homeostasis conditions. IBa was simulated by replacing Ca2+ with Ba2+ in the extracellular solution composition, and Ba2+ entering the cell via LTCC was assumed to affect local [Ba2+] (i.e. sub-sarcolemmal and cleft) without altering bulk [Ba2+] or triggering SR Ca2+ release (Fig. 1A) (Ferreira et al. 1997). With Ba2+ as the charge carrier, Mahajan et al. (2008b) modelled inactivation to occur only via the VDI pathway. That is, during IBa the two upper states in Fig. 1B (CDI) are never visited, and the model is effectively reduced to the lower five states. In contrast, we obtained our IBa model parameters by fitting the voltage and Ba2+ dependence of VDI and CDI rate constants to the measured IBa with 8-fold weaker apparent affinity of Ba2+ vs. Ca2+ for CaM (Grandi et al. 2010). These parameters were also constrained to fit ICa data (with Ca2+ as the charge carrier) with normal CaT, or without SR Ca2+ release and with the Ca2+ buffers EGTA or BAPTA. We made simplifying assumptions that, in the absence of release and presence of Ca2+ buffers, Ca2+ entering the cell via LTCC affects sub-sarcolemmal and cleft [Ca2+] without altering bulk [Ca2+] (for EGTA), or [Ca2+] is clamped at diastolic values in all compartments (for BAPTA).
LTCC permeability values for Ba2+ and Ca2+ were set to reproduce the experimental peak current values measured by Mahajan et al. (2008b) at physiological temperature. Model rate parameters were chosen to reproduce kinetics at 37°C, and a Q10 of 2 (Faber et al. 2007) was used to scale the duration of voltage pulses of experimental data obtained at room temperature. The full list of model equations and parameters can be found in the Supplemental Material (Tables S1, showing the expressions of the transition rates in Fig. 1B, and S2 respectively).
CaM1234 expression was simulated by assuming that the overexpressed CaM1234 displaced the wild-type (WT) CaM in a fraction α of LTCCs in the cell, such that this population of channels exhibited VDI but not CDI (i.e. ICa,VDI with the reduced 5-state model), as done previously by Mahajan et al. (2008a). Thus, total ICa,CaM1234 is given by:
Ionic concentrations were set to the following values (in mm): [Cl−]i 5, [Cl−]o 146, [K+]i 140, [K+]o 5.4, [Na+]o 135, [Ca2+]o 2 (or [Ba2+]o 1.8), as in Mahajan et al. (2008b). During EAD-like AP-clamp, the following values were changed: [Cl−]i 15, [Cl−]o 150, [K+]i 135, [Na+]o 140, [Ca2+]o 1.8, as in Shannon et al. (2004). The reduced Cl− driving force diminished background Cl− currents, thus reducing the repolarization reserve.
Model equations were implemented in Simulink (The Mathworks Inc., Natick, MA, USA) and solved numerically with a stiff variable order solver (ode15s) based on the numerical differentiation formulas (NDFs) with an adaptive time step ranging from 1 ms to 1 ps. The digital cell was stimulated in voltage- or AP-clamp to replicate experimental protocols. AP-clamp simulations were performed with a command AP simulated by pacing the cell in current-clamp (15 A F−1 current stimulus lasting 3 ms) at 0.33 Hz to steady-state with normal CaT. APs showing EADs were also used as a command voltage.
A gapped double-pulse (GD-P) protocol was implemented in which the AP-clamp was interrupted at defined potentials. Em was then stepped back to −40 mV for 2 ms, followed by a 200 ms rectangular test pulse to 5 mV. The fraction of available channels at each time during the AP was calculated by normalizing peak ICa evoked by the corresponding test pulse to the peak ICa elicited by a rectangular clamp step from −80 to 5 mV (when the channels are fully available). Inactivation (i.e. 1-availability) was plotted against the time elapsed between AP upstroke and interruption.
Results
ICa model parameterization
The ICa model was parameterized using voltage-clamp data from previous studies in isolated ventricular myocytes from rabbit (Yuan et al. 1996; Linz & Meyer, 2000; Mahajan et al. 2008b), guinea pig (Hadley & Hume, 1987; Zhong et al. 1997; Sonoda & Ochi, 2001), rat (Sun et al. 2000) and mouse (Sako et al. 1998). Results are shown for Ba2+ current, and for Ca2+ currents with and without SR Ca2+ release.
Current–voltage relationship
Dependence of (normalized) current on Em is depicted in Fig. 2A–C. Simulated IBa and ICa (lower panels) peak at +5 mV, independent of charge carrier and SR function. At 5 mV, peak IBa equals −2.00 nA, peak ICa equals −2.14 nA and −2.17 nA with and without SR Ca2+ release, respectively (vs.−2.06 nA at 0 mV, −1.98 nA at 0 mV, and −2.14 nA at +10 mV, in experiments by Mahajan et al. (2008b)). Normalized experimental current–voltage (I–V) curves are shown for comparison (upper panels) and exhibit some variability, possibly due to differences in species, intra- and extracellular solution compositions, and experimental protocols. Details on the experimental data used in the development and validation of the model are provided in the Supplemental Table S3. As a guideline, we favoured experiments obtained in rabbit at physiological temperature and solutions vs other species and less physiological conditions.
Figure 2. Experimental (top) and simulated (bottom) I–V relationships and quasi-steady-state inactivation (SSI) for IBa (A and D), ICa without SR Ca2+ release (B and E), and ICa with CaT (C and F).

I–V curves were obtained by stimulating the cell with voltage steps from a resting potential of −80 mV to various test potentials. Quasi-SSI curves were obtained by measuring the available current after inactivation prepulses of various (indicated) durations. Results for simulated IBa with a reduced 5-state model (only VDI) are also shown (dashed lines).
Quasi-steady-state inactivation
Simulated current availability curves (Fig. 2D–F) indicate that inactivation is more complete the longer the inactivating prepulse, in agreement with experimental data (upper panels). A slightly U-shaped curve is obtained for IBa (Fig. 2D), with the largest inactivation corresponding to the largest Ba2+ influx, near +5 mV, consistent with modest Ba2+-dependent inactivation (Brunet et al. 2009). Moreover, this U-shaped region is not seen with the reduced five-state model lacking IDI (dashed lines). Inactivation is more markedly U-shaped when simulating ICa (Fig. 2E and F), and is especially pronounced with SR function intact (compare Fig. 2E vs. 2F) as seen experimentally.
Kinetics of inactivation
The kinetics of IBa and ICa inactivation can be assessed by the ratio of pedestal to peak current (IPed/IPeak) at different times after depolarization to different Em for experimental (Mahajan et al. 2008b) and simulated traces (Fig. 3C). Pedestal currents (and IPed/IPeak) decrease with longer pulses and inactivation is faster and deeper for ICa vs. IBa, and with larger ion influx and/or Ca2+ release, in agreement with experiments (left panel). Again, the dependence of IPed/IPeak on Em is U-shaped (Fig. 3C) around the peak potential of 0 to +10 mV (Fig. 2A and C) for both IBa and ICa. In contrast, simulated IBa curves with the five-state model (VDI) are relatively flat (dashed lines at right). Previous results have shown that IBa inactivation depends on Ba2+ influx (Brunet et al. 2009; Grandi et al. 2010). For a given peak current at different Em, the kinetics of IBa inactivation are comparable. For example, experimental (Mahajan et al. 2008b) and simulated IBa at −10 and +20 mV reach similar peak values (simulated: −8.75 and −9.12 A F−1) and inactivate similarly (Fig. 3A). On the other hand, when SR Ca2+ release occurs, for a given peak ICa, inactivation is faster at negative Em, where ECC gain and release are larger. For example, experimental (Mahajan et al. 2008b) and simulated ICa at −10 and +20 mV reach similar peak values (simulated: −9.58 and −10.1 A F−1) but inactivation is much faster at −10 mV (Fig. 3B). This is further illustrated in Supplemental Fig. S2, where Em values are chosen symmetrically with respect to peak current, such that the currents reach the same peak value and inactivation kinetics are easily compared.
Figure 3. Kinetics of LTCC current inactivation.

Experimental (top) (Mahajan et al. 2008b) and simulated (bottom) IBa (A) and ICa (B) traces evoked by voltage pulses from −80 mV to −10 mV (left) and +20 mV (right). C, experimental (left) (Mahajan et al. 2008b) and simulated (right) ratios of pedestal to peak current (IPed/IPeak) at varying times (indicated) during voltage pulses from −80 mV to various test potentials for ICa and IBa. Results for simulated IBa with a reduced 5-state model (only VDI) are also shown.
Recovery from inactivation
Time constants of recovery from inactivation were assessed for IBa and ICa at various holding potentials, and are depicted in Fig. 4 with experimental results (Mahajan et al. 2008b). Recovery is faster at more negative Em, with no differences between ICa and IBa.
Figure 4. Experimental (symbols) and simulated (lines) time constants of IBa and ICa recovery from inactivation obtained at varying holding potentials.

Recovery from inactivation assessed using a 250 ms long voltage-clamp pulse to +10 mV (P1) followed by repolarization to the various holding potentials for a variable time interval and a second pulse to 0 mV (P2). The time constant was estimated by fitting the recovery curve (ratio of the peak P2/P1 currents plotted as a function of recovery interval) to a monoexponential function.
ICa model validation
In Fig. 5 we assessed the robustness of the model by validating it in more physiological settings against experimental AP-clamp data from isolated ventricular myocytes from rabbit (Yuan et al. 1996; Puglisi et al. 1999; Linz & Meyer, 2000) and guinea pig (Linz & Meyer, 1998). Ca2+ influx via LTCC during an AP differs notably from that evoked by a square voltage pulse (Yuan et al. 1996), and our simulations confirm this (left vs. right). ICa peaks and inactivates more slowly during an AP (Fig. 5B), but the current integral is larger at the end of the AP command pulse (Fig. 5C). Supplemental Fig. S3 shows comparable simulated and experimental ICa (Linz & Meyer, 1998) (Fig. S3B) elicited by APs with different amplitudes (Fig. S3A). ICa peak decreases as AP amplitude (and upstroke potential) increases. The reduced influx also causes slower inactivation in each case.
Figure 5. Differences between step and AP-clamp.

Simulated (left) and experimental (right) (Yuan et al. 1996) Em (A), ICa (B), and running integral of Ca2+ influx via LTCC (C). Simulated voltage step was from −80 mV to 5 mV, and AP waveform was obtained by pacing the virtual cell at 0.33 Hz to steady-state (with normal CaT).
The time courses of IBa and ICa during an AP (Fig. 6A) are depicted in Fig. 6B. When SR Ca2+ release is prevented, ICa inactivates more slowly (Fig. 6B), and the integral of Ca2+ influx through the channel is augmented (Fig. 6C). Furthermore, when addition of BAPTA is simulated, CDI is nearly absent, and ICa exhibits a prominent plateau and causes a much larger Ca2+ influx (Fig. 6B and C). Model predictions agree well with experimental results (Linz & Meyer, 1998) reported in Fig. 6A–C, right panels. In Fig. 6B and C, left, IBa is simulated with either the seven-state or the non-IDI five-state LTCC model.
Figure 6. Influence of Ca2+ homeostasis on ICa during AP-clamp.

AP waveform was obtained by pacing the virtual cell at 0.33 Hz to steady-state (with normal CaT). Simulated (left) and experimental (right) (reproduced from Linz & Meyer (1998) with permission) command AP (A), evoked current (B), and running flux integral (C) with normal CaT, without SR Ca2+ release, and BAPTA. IBa was also simulated with the baseline model and a reduced 5-state (VDI only) model. Experimental (top) (Linz & Meyer, 1998) and simulated (bottom) time course of current inactivation (E–G) during an AP was obtained with the GD-P protocol depicted in D. E, inactivation of ICa with CaT, ICa without SR Ca2+ release, INS, and IBa. F, experimental and simulated VDI, and CDI. G, experimental and simulated CDISR and CDILTCC.
Cell model validation
We also validated the comprehensive cellular AP and CaT model. To allow a direct comparison with existing rabbit models, time courses of AP and CaT (Fig. S4A), APD restitution properties (Fig. S4B), APD rate-adaptation (Fig. S4C) after sudden changes in cycle length, and frequency-dependent increase of systolic [Ca2+]i and [Na+]i (Fig. S4D) obtained with our model are superimposed to those obtained with the Shannon et al. (2004) and the Mahajan et al. (2008b) models as compared by Romero et al. (2011). Our model performs well when comparing simulated values of cardiac biomarkers (APD90, APD triangulation, slow time constant of the temporal APD90 adaptation to the accelerating rate, and maximal slopes of S1S2 and dynamic restitution curves) to the experimental range reported by Romero et al. (2011) (Table S4). Alternans developed in our model at a pacing cycle length ≤180 ms (Fig. S4E).
Analysis of inactivation mechanisms and sources of CDI
To estimate the contribution of VDI and CDI to total inactivation and further validate the model, we reproduced the experimental GD-P protocol designed by Linz & Meyer (1998) and illustrated in Figs 6D and S3B, inset. This protocol, by interrupting the AP at different times (see Methods), reveals the fraction of channels inactivated during an AP (1-availability; see Fig. S3C–E). Figure 6E–G show the progression of Ca2+ channel inactivation during the AP and how VDI and CDI contribute to it (experiments at top and simulations at bottom).
The time course of inactivation (Fig. 6E, lower panel) was assessed using this protocol for simulated ICa with and without SR Ca2+ release and IBa. Figure 6F shows the accumulation of CDI and VDI, estimated assuming that LTCC availability is the product of Ca2+- and voltage-dependent availability, as in (Linz & Meyer, 1998). The contribution of Ca2+ released from the SR to ICa inactivation (CDISR) was calculated as the difference between availabilities measured with and without SR Ca2+ release (Fig. 6G). Finally, the contribution of Ca2+ entry via ICa to inactivation (CDILTCC) was calculated by subtracting CDISR from CDI (Fig. 6G). We infer that SR Ca2+ release accounts for most of CDI during the initial AP phase, whereas Ca2+ through LTCC controls CDI later during the AP. Experimental results (Linz & Meyer, 1998) are shown in the upper panels of Fig. 6E–G. Non-specific monovalent current (INS, carried by Na+ and Cs+) via LTCC was used experimentally to assess VDI, rather than using our five-state VDI model (Fig. 1B).
The importance of SR Ca2+ release for CDI was also highlighted in AP-clamp experiments in rabbit ventricular myocytes at 35°C (Puglisi et al. 1999). Analogous to experiments, ICa traces evoked by APs subsequent to an initial SR depletion show increasingly faster inactivation (Supplemental Fig. S5A and B) as the SR is replenished and SR Ca2+ release increases (Fig. S5C). Normalized integrals of ICa during each pulse reveal that inactivation due to SR Ca2+ release decreases net Ca2+ influx by about 40%, similar to experimental data (Fig. S5D).
Effects of reduced VDI
Changes in the VDI transitions (as described in the Supplemental Material) caused a striking reduction in the steady-state inactivation curve (Fig. 7A), and led to AP prolongation (Fig. 7B). Notably, this reduced VDI did not modify ICa during the early repolarization and initial plateau phase, but rather during late AP phase 2 and 3 (Fig. 7C). Indeed, VDI monotonically increases during the AP and makes a larger contribution during repolarization (Fig. 6F vs. 7E). The time courses of CDISR and CDILTCC do not appear appreciably modified by removal of VDI (Fig. 7F).
Figure 7. Effects of reduced VDI.

A, quasi-SSI curves depict the available IBa (5-state model) after 1000 ms-long inactivation prepulses to the indicated voltages in control and reduced VDI conditions. Action potentials (B) and ICa (C) with normal CaT in control and reduced VDI conditions. D, simulated time course of current inactivation during an AP with reduced VDI for ICa with CaT, ICa without SR Ca2+ release, and IBa. E, simulated VDI and CDI. F, simulated CDI, CDISR and CDILTCC.
Effects of reduced CDI
We assessed the effects of impaired CDI on the cardiac AP by simulating the expression of CaM1234, which eliminates CDI of native LTCCs by displacing WT CaM that is otherwise normally prebound to the channels. LTCC inactivation slowed with increasing expression of CaM1234 (Fig. 8A and B) (Alseikhan et al. 2002; Mahajan et al. 2008a), which caused significant AP prolongation (Fig. 8C), as reported experimentally (Alseikhan et al. 2002), e.g. larger than that produced by comparable reduction of VDI in Fig. 7.
Figure 8. Effects of Ca2+-insensitive CaM overexpression.

A, experimental (reproduced from Mahajan et al. (2008a) with permission of Elsevier) normalized currents evoked by a voltage step from −80 mV to +10 mV for ICa without SR Ca2+ release (WT and CaM1234) and IBa. B, simulated normalized ICa without SR Ca2+ release (baseline, and with various degrees of impaired CDI). IBa traces are shown with the baseline model and a reduced 5-state model. C, simulated AP obtained when pacing the digital myocyte at a basic cycle length of 3 s in baseline conditions and with various degrees (indicated) of impaired CDI. D–S, simulated AP, ICa, INaCa, CaT, [Ca2+] in sub-sarcolemmal and cleft compartments, free SR Ca2+ content and SR Ca2+ release obtained when pacing the digital myocyte at a basic cycle length of 3 s in baseline conditions and with reduced CDI (20% reduction in D–K, and 50% in L–S). Insets in panels D and F show results obtained for the mutant condition by reducing instantaneously NCX density by 10% and 30%.
When 20% of the channels have Ca2+-insensitive CaM prebound, the model predicts the occurrence of EADs, as shown in Fig. 8D and 9A. We monitored the time courses of LTCC open probability, the opening rate (dO/dt), and contributions to dO/dt of transitions between open and closed states (activation/deactivation) or open and inactivated states (inactivation/recovery) during a control AP (Supplemental Fig. S6) and during the CaM1234-induced EAD (Fig. 10, left). Insets show enlargement of AP plateau near the EAD takeoff (i.e. when dEm/dt became positive during AP plateau). This phenomenon does not depend on ICa reactivation (Figs 9A and B and 10B–D, left). In fact, LTCC open probability progressively declines (dO/dt is always negative) during the entire AP plateau and EAD (Fig. 10D, left, inset); channels are leaving the open state. Instead, these EADs are likely to be due to enhanced Ca2+ extrusion via inward Na+/Ca2+ exchange (NCX) current (INaCa, Fig. 8F). This INaCa is due to enhanced SR Ca2+ loading and spontaneous SR Ca2+ release (Fig. 8J) and elevated subsarcolemmal [Ca2+] ([Ca]SL; Fig. 8H). We tested the role of INaCa by reducing NCX density instantaneously during the arrhythmogenic AP just before EAD takeoff. When INaCa was reduced by 10%, EAD amplitude was reduced (Fig. 8D and F, inset), whereas a 30% NCX reduction completely eliminated the EAD (Fig. 8D and F, inset).
Figure 9. Kinetics of ICa (B, F and J) during AP-clamp with EAD-like stimuli (A, E and I) assessed with the GD-P protocol.

Total ICa (with and without release) inactivation (C, G and K), VDI, CDI (D, H and L), and CDISR and CDILTCC were computed with 20% expression of CaM1234 (A–D), and block of IKr and IKs (E–H, simulations vs. experiments (reproduced from Yamada et al. (2008) with permission from Springer), I–L).
Figure 10. Time course of Em (A), ICa (B), LTCC open probability (C) and its rate of changes (D), and contributions to dO/dt of channel transitions between open and closed (O-C), open and CD-inactivated (O-CDI), open and VD-inactivated (O-VDI), and open and inactivated (O-VDI and CDI) during an EAD caused by either CaM1234 overexpression (left) or K+ current blockade (right).
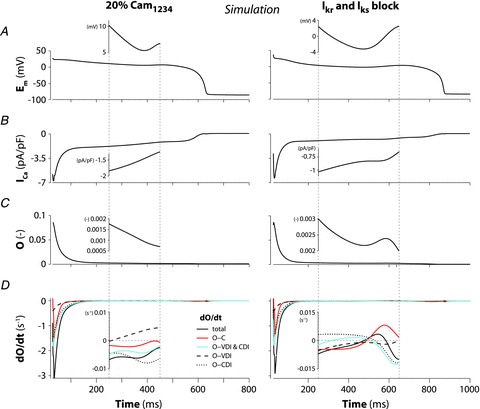
Insets show the time window corresponding to EAD takeoff (x axis limits are indicated with dotted lines in the main panels).
As CDI reduction increased to 40%, APD was futher prolonged, but no EADs occurred (Fig. 8C). Our explanation for the disappearance of EADs is that as CDI decreases the AP plateau potential becomes more depolarized, thus opposing inward INCX (the more depolarized Em the less inward INCX), which is not large enough to cause membrane after-depolarization.
When the fraction of Ca2+/CaM-insensitive channels was increased to 50%, the AP prolonged further (Fig. 8L) due to the increased depolarizing ICa (Fig. 8M), which also further loaded the SR with Ca2+ (Fig. 8R). The high [Ca2+]SR causes a large spontaneous Ca2+ release (Fig. 8R-S) which activates a large inward INaCa (Fig. 8N), sufficient to cause a delayed afterdepolarization (DAD) and triggered AP (Fig. 8L). A second DAD occurs after the first triggered AP, but the spontaneous SR Ca2+ release is slightly smaller, and fails to trigger an AP.
Effects of IKr and IKs block
We also examined AP prolongation due to complete block of both rapid and slow components of delayed-rectifier K+ current (IKr and IKs, Fig. 9E). As with the CaM1234-modified AP, we monitored the time courses of LTCC open probability and state transitions (Fig. 10B-D, right). In contrast with CaM1234 expression, under IKr and IKs block we clearly detected LTCC reactivation during EAD takeoff. In this case dO/dt turned positive (Fig. 10D, right, inset), indicating that more channels entered the open state (unlike the CaM1234 case). Further, this ICa reactivation during the EAD was not due to recovery from inactivation, but rather to reopening from the closed state. While the transition between inactivated and open states in Fig. 10D, right, inset, moved negative, indicating inactivation did increase (negative dO/dt), that between closed and open states moved more strongly positive, indicating a more than compensatory reactivation (resulting in dO/dt > 0).
ICa inactivation kinetics during EADs
We next evaluated ICa inactivation during APs that showed EADs. We used GD-P protocols based on the two types of exemplar APs described above, obtained at 0.33 Hz, one with 20% expression of CaM1234 (Fig. 9A) and the other with complete block of IKr and IKs (Fig. 9E).
As originally found by January & Riddle (1989), in our simulations EAD amplitude inversely correlated with takeoff potential (the more negative the takeoff potential the larger the EAD amplitude, as indicated in Fig. 9A and E). ICa decayed smoothly throughout the CaM1234-induced EAD (Fig. 9B), whereas it exhibited a notch upon EAD initiation (Fig. 9F) with inhibition of K+ currents. Notably, a similar hump in ICa was detected experimentally during the same type of protocol in guinea pig ventricular myocytes (Fig. 9I and J) (Yamada et al. 2008). ICa inactivation increased monotonically during the CaM1234-induced EAD (Fig. 9C), and so did its Em- and Ca2+-dependent components (Fig. 9C and D respectively). On the other hand, with the EAD induced by K+ current block, ICa inactivation increased during the AP plateau, decreased slightly just before EAD takeoff, and increased again thereafter (Fig. 9G), as observed experimentally (Fig. 9K) (Yamada et al. 2008). In both simulations and experiments, VDI did not display any clear notch (Fig. 9G and K), whereas CDI showed a notch before EAD takeoff (Fig. 9H and L). Both CDILTCC and CDISR (defined as described in Methods) exhibited a hump prior to EAD initiation (Fig. 9H). However, we observed only a modest recovery of LTCCs from CDI before EAD takeoff.
Discussion
In the present study we developed improved LTCC and SR Ca2+ release models within the framework of the rabbit ventricular ECC model of Shannon et al. (2004). A recent paper investigated the differences between the Shannon et al. (2004) and Mahajan et al. (2008b) models of the rabbit ventricular AP, and showed that the former performs better at slow rates, the latter at fast rates (Romero et al. 2011). We conducted a model evaluation taking into consideration frequency-dependency mechanisms, and showed that steady-state APD and Ca2+ rate dependence (Fig. S4) are similar to those predicted by the parent Shannon et al. (2004) model, in good agreement with experimental data. Although we did not perform a systematic sensitivity analysis, we also expect the ionic mechanisms modulating electrophysiological properties to be similar.
Our main goal was to dissect the relative importance of VDI and CDI to total ICa inactivation during normal and abnormally prolonged APs. The AP model reproduces faithfully experimental properties of ventricular myocytes, including (1) the higher ECC gain at negative Em, (2) the kinetics of LTCC inactivation (measured with both voltage steps and AP-clamps) under different Ca2+ homeostasis conditions and during EADs, (3) the SR Ca2+ release contribution to ICa inactivation during an AP, (4) the effects of Ca2+-insensitive CaM expression, and (5) the effects of delayed-rectifier K+ current inhibition. We used this improved model (1) to predict the effects of removal of VDI, (2) to study arrhythmogenic mechanisms in the presence of impaired CDI, and (3) to assess the involvement of ICa in EADs.
To differentiate VDI from CDI of macroscopic ICa, replacement of Ca2+ by other charge carriers (e.g. Ba2+, (Zhong et al. 1997; Sako et al. 1998; Sun et al. 2000; Sonoda & Ochi, 2001; Mahajan et al. 2008b) or Na+ and Cs+ (Hadley & Hume, 1987; Hryshko & Bers, 1992; Yuan et al. 1996)) has been widely used. In these studies, inactivation of IBa or INS has been assumed to reflect purely VDI. It is well known that Ba2+ can weakly mimic Ca2+ (Ferreira et al. 1997), and it seems clear now that Ba2+ can recapitulate a weak version of CDI. Indeed, IBa inactivation depends on Ba2+ influx, while it has been shown that INS inactivation is independent of the triggering current peak (see Fig. 1 in Brunet et al. (2009)). However, in a previous study (Grandi et al. 2010), we found that INS inactivation at physiological temperature is faster (vs. IBa) and complete, perhaps reflecting some intrinsic difference vs. VDI occurring during ICa or IBa. We concluded that both approaches lead to an overestimation of VDI. Here, we constrained our LTCC model parameters by accounting for reduced, but not eliminated, IDI when Ba2+ is the charge carrier, and adopted the reduced IBa model (5 lower states in Fig. 1B) to represent pure VDI.
We simulated the GD-P protocol to quantify the contributions of CDI and VDI to total inactivation, and to study the importance of different Ca2+ sources involved in this process (Fig. 6D–G), as in Linz & Meyer (1998). We found that ICa inactivation during an AP is predominantly CDI, which is mostly controlled by SR Ca2+ release during the initial AP phase, but mainly by Ca2+ entering through LTCCs for the remaining part. Linz & Meyer (1998) showed similar results in guinea pig cells, although they estimated a smaller contribution of the SR to CDI. Discrepancies between simulated and experimental results in Linz & Meyer (1998) may be explained by the authors’ choice of measuring INS to assess pure VDI, since we have shown this assumption leads to overestimation of VDI (Grandi et al. 2010). Furthermore, there may be differences in LTCC control by Ca2+ in guinea pig vs. rabbit myocytes. In fact, we found that ICa inactivation due to SR Ca2+ release decreases net Ca2+ influx by about 40%, which is just a little less than that which Puglisi et al. (1999) showed in rabbit myocytes (Fig. S5).
We based our analysis of CDI and VDI on the classic Hodgkin–Huxley formulation, where the activation and inactivation gating parameters do not represent specific kinetic states of ion channels and are independent, and their product modulates the current (as ICa in the original Shannon et al. (2004) model, inherited from the Luo–Rudy model (Luo & Rudy, 1994a)). However, the structure of the Mahajan et al. (2008b) Markovian model here adopted allowed us to discriminate the contributions of CDI and VDI by monitoring transitions from the open state to closed and inactivated states (Figs 10 and S6), as further discussed below.
Several computational studies have acknowledged the importance of developing a detailed kinetic model of LTCC (Imredy & Yue, 1994; Jafri et al. 1998; Sun et al. 2000; Findlay, 2002a,b; Faber et al. 2007; Mahajan et al. 2008b; Hashambhoy et al. 2009), due to its fundamental role in ECC in cardiac myocytes (Bers, 2001). Imredy & Yue (1994) first introduced a Ca2+-dependent mode (‘Ca2+ mode’) to separate CDI and VDI in a rat LTCC model, which was extended by Jafri et al. (1998) with two mirroring ‘normal’ structures and a ‘Ca2+’ gating mode structure. Faber et al. (2007) conserved the two-mode ‘mirror’ structure with a more complex description of the inactivation pathways, whereas Mahajan et al. (2008b) proposed the minimal Markovian LTCC formulation that is extended in the present paper. The latter models were accompanied by improved formulations of SR Ca2+ release and integrated into existing AP models (respectively, guinea pig (Luo & Rudy, 1994a) and rabbit (Shannon et al. 2004)). In both models IBa was used for fitting of VDI. Faber et al. (2007) and Mahajan et al. (2008b) found that CDI plays a greater role at negative Em during voltage pulses, due to higher ECC gain. In fact, Mahajan et al. (2008b) indicated that CDISR is more important at negative voltages, while Ca2+ entering the cell dominates CDI at positive Em. As for the time course of inactivation, Faber et al. (2007) reported an early dominance of SR Ca2+ release in controlling CDI, and a late dominance of sarcolemmal Ca2+ influx, in agreement with our findings with AP-clamp.
The need for a faithful characterization of the roles of VDI and CDI has been underlined by experimental studies showing the deleterious effects of inhibiting one of the two mechanisms. Alseikhan et al. (2002) showed the effects of CaM1234 expression, which inhibits CDI and produces dramatic AP prolongation, whereas Splawski et al. (2004) showed the effects of the G406R mutation that removes VDI and is linked to the Timothy syndrome. The effects of Timothy syndrome have been investigated in simulation studies (Sung et al. 2010; Faber et al. 2007; Zhu & Clancy, 2007; Thiel et al. 2008). The notion that gene mutations linked to disease may interfere both with VDI and CDI is intriguing (Yarotskyy et al. 2009), although not yet fully understood. Also, shifts in VDI could alter intracellular Ca2+ handling and signalling, which could in turn contribute to the Timothy syndrome phenotype (Thiel et al. 2008). In this study, removing VDI, while retaining CDI, caused AP prolongation (Fig. 7). Notably, when simulating the expression of CaM1234, which removes CDI without affecting VDI (Alseikhan et al. 2002), we predicted a much more marked APD prolongation (Fig. 8), confirming previously observed experimental (Alseikhan et al. 2002) and simulation (Mahajan et al. 2008a) results.
We predicted the occurrence of EADs when CDI was reduced, or with further CDI reduction, DADs. The latter occurred when residual CDI was small enough so that added Ca2+ influx caused SR Ca2+ overload and spontaneous release, with consequent activation of enough transient inward NCX current (Iti) to depolarize the membrane beyond threshold (Priori & Corr, 1990). With a smaller reduction in CDI, not sufficient to harmfully overload the cell, EADs occurred during the AP plateau (phase 2). Depolarization during phase 2 EADs has been attributed to reactivation of ICa (January & Riddle, 1989; Luo & Rudy, 1994b; Zeng & Rudy, 1995; Yamada et al. 2008). However, in our simulation of CaM1234 overexpression, ICa did not reactivate, but rather continued to inactivate (Fig. 10B–D, left). NCX is typically considered responsible for EADs occurring in AP phase 3 (Luo & Rudy, 1994b; Milberg et al. 2008), where the more negative Em and increased [Ca2+]i due to spontaneous Ca2+ release both favour inward exchange current. Here, we predicted that changes in Ca2+ cycling due to reduced CDI caused greater Ca2+ extrusion, spontaneous SR Ca2+ release (relying on the modified description of RyR gating), and sufficient inward NCX current to cause frank depolarization (Fig. 8). In support of this, when reduced NCX activity was imposed in the simulation, the EAD disappeared (Fig. 8D and F, insets). Indeed, Priori & Corr (1990) proposed that EADs and DADs might share the same mechanism, with NCX-mediated inward current being involved also in the genesis of EADs, as proposed for example in cardiac hypertrophy (Sipido et al. 2000).
Phase 2 EADs most typically occur when repolarization is prolonged due to alterations in K+ or Na+ currents. We obtained a phase 2 EAD due to ICa reactivation by blocking IKr and IKs (Fig. 9), and used this AP waveform to analyse the kinetics of ICa during abnormal repolarization, as done experimentally by Yamada et al. (2008). They have suggested that EADs occur because ICa fails to completely deactivate, as opposed to significantly recovering from CDI. Indeed, EADs we obtained with IKr and IKs blocked were driven by LTCCs reactivating from the closed state (Em-independent transition, see Fig. 1B) and not by recovery from either inactivated state (Fig. 10D, right). This would be hard to test unequivocally in experiments, but if stable EADs (in current clamp) could be interrupted by a voltage clamp step one could assess ICa availability and distinguish between the two. However, since the model fits the experimental kinetics of recovery from inactivation and of activation/deactivation, this interpretation seems most likely. In our simulations with the GD-P protocol we found that ICa inactivation exhibited a notch before EAD takeoff, whereas VDI did not (Fig. 9G), as was also found experimentally by Yamada et al. (2008). Despite the fact that CDI (including both CDISR and CDILTCC components) had a notch, the net recovery afterward near the time of takeoff was at best modest (Fig. 9H). Thus both the state analysis and the GD-P assay call into questions the importance of recovery from inactivation for EAD initiation (Yamada et al. 2008).
Conclusion
Our ICa model allowed us to investigate realistically the effects of CDI changes in normal and prolonged APs. We predicted that CDI is crucial for AP repolarization (while VDI is less so), and showed that impairment of ICa CDI may be arrhythmogenic by affecting intracellular Ca2+ cycling, through its effect on the time course of LTCC Ca2+ fluxes and thus NCX. We conclude that our improved model is a useful tool to study the role of ICa kinetics during normal and altered repolarization at the single cell level, and given its computational tractability it could be incorporated in tissue-scale/whole heart models to test how these cellular instabilities can induce arrhythmias. Further work will be required to incorporate modulation of ICa gating by other molecules involved in its regulation, such as PKA and CaMKII, as has been described in previous studies (Findlay, 2002a; Saucerman et al. 2003; Hashambhoy et al. 2009, 2010; Soltis & Saucerman, 2010).
Acknowledgments
We wish to thank Dr S. Severi for his valuable contribution to the initial stages of this work, and Drs J. N. Weiss, A. Mahajan and D. Sato for providing mean data and individual current traces for IBa and ICa. This research was supported by NHLBI Grants P01-HL080101 and R37-HL30077 (to D.M.B.), the Marco Polo Outgoing International Fellowship from the University of Bologna, and the First Contact Initiative Grant from the European Society of Cardiology (to S.M.).
Glossary
- AP
action potential
- APD
action potential duration
- CaM
calmodulin
- CaT
Ca2+ transient
- CDI
Ca2+-dependent inactivation
- CDILTCC
LTCC-mediated CDI
- CDISR
SR Ca2+ release-mediated CDI
- DAD
delayed afterdepolarization
- dO/dt
rate of changes of LTCC open probability
- EAD
early afterdepolarization
- ECC
excitation–contraction coupling
- Em
membrane potential
- GD-P
gapped double-pulse
- IBa
barium current
- ICa
calcium current
- IDI
ion-dependent inactivation
- IKr
rapid delayed-rectifier K+ current
- IKs
slow delayed-rectifier K+ current
- INaCa
Na+/Ca2+ exchange current
- INS
non-specific monovalent current
- IPeak
peak current
- IPed
pedestal current
- Iti
transient inward current
- LTCC
L-type Ca2+ channel
- NCX
Na+/Ca2+ exchanger
- RyR
ryanodine receptor
- SR
sarcoplasmic reticulum
- SSI
steady-state inactivation
- VDI
voltage-dependent inactivation
- WT
wild type
Author contributions
E.G. and D.M.B. conceived and designed the study, S.M., E.G., A.S., K.S.G. and D.M.B. collected, analysed and interpreted the data, S.M. and E.G. drafted the article, K.S.G. and D.M.B. revised the article critically for important intellectual content. All authors have approved the final version. The study was performed at the Department of Pharmacology, University of California Davis, and at the Department of Electronics, Computer Science and Systems, University of Bologna, Cesena.
Supplemental Data
Table S1
Table S2
Table S3
Table S4
Figure S1
Figure S2
Figure S3
Figure S4
Figure S5
Figure S6
References
- Alseikhan BA, DeMaria CD, Colecraft HM, Yue DT. Engineered calmodulins reveal the unexpected eminence of Ca2+ channel inactivation in controlling heart excitation. Proc Natl Acad Sci U S A. 2002;99:17185–17190. doi: 10.1073/pnas.262372999. [DOI] [PMC free article] [PubMed] [Google Scholar]
- Altamirano J, Bers DM. Voltage dependence of cardiac excitation−contraction coupling: unitary Ca2+ current amplitude and open channel probability. Circ Res. 2007;101:590–597. doi: 10.1161/CIRCRESAHA.107.152322. [DOI] [PubMed] [Google Scholar]
- Benitah JP, Alvarez JL, Gomez AM. L-type Ca2+ current in ventricular cardiomyocytes. J Mol Cell Cardiol. 2010;48:26–36. doi: 10.1016/j.yjmcc.2009.07.026. [DOI] [PubMed] [Google Scholar]
- Bers DM. Excitation-Contraction Coupling and Cardiac Contractile Force. Dordrecht, The Netherlands: Kluwer Academic Press; 2001. [Google Scholar]
- Beuckelmann DJ, Wier WG. Mechanism of release of calcium from sarcoplasmic reticulum of guinea-pig cardiac cells. J Physiol. 1988;405:233–255. doi: 10.1113/jphysiol.1988.sp017331. [DOI] [PMC free article] [PubMed] [Google Scholar]
- Brunet S, Scheuer T, Catterall WA. Cooperative regulation of Cav1.2 channels by intracellular Mg2+, the proximal C-terminal EF-hand, and the distal C-terminal domain. J Gen Physiol. 2009;134:81–94. doi: 10.1085/jgp.200910209. [DOI] [PMC free article] [PubMed] [Google Scholar]
- Corrias A, Giles W, Rodriguez B. Ionic mechanisms of electrophysiological properties and repolarization abnormalities in rabbit Purkinje fibers. Am J Physiol Heart Circ Physiol. 2011;300:H1806–1813. doi: 10.1152/ajpheart.01170.2010. [DOI] [PubMed] [Google Scholar]
- Faber GM, Silva J, Livshitz L, Rudy Y. Kinetic properties of the cardiac L-type Ca2+ channel and its role in myocyte electrophysiology: a theoretical investigation. Biophys J. 2007;92:1522–1543. doi: 10.1529/biophysj.106.088807. [DOI] [PMC free article] [PubMed] [Google Scholar]
- Ferreira G, Yi J, Rios E, Shirokov R. Ion-dependent inactivation of barium current through L-type calcium channels. J Gen Physiol. 1997;109:449–461. doi: 10.1085/jgp.109.4.449. [DOI] [PMC free article] [PubMed] [Google Scholar]
- Findlay I. β-Adrenergic stimulation modulates Ca2+- and voltage-dependent inactivation of L-type Ca2+ channel currents in guinea-pig ventricular myocytes. J Physiol. 2002a;541:741–751. doi: 10.1113/jphysiol.2002.019737. [DOI] [PMC free article] [PubMed] [Google Scholar]
- Findlay I. Voltage- and cation-dependent inactivation of L-type Ca2+ channel currents in guinea-pig ventricular myocytes. J Physiol. 2002b;541:731–740. doi: 10.1113/jphysiol.2002.019729. [DOI] [PMC free article] [PubMed] [Google Scholar]
- Grandi E, Morotti S, Ginsburg KS, Severi S, Bers DM. Interplay of voltage and Ca-dependent inactivation of L-type Ca current. Prog Biophys Mol Biol. 2010;103:44–50. doi: 10.1016/j.pbiomolbio.2010.02.001. [DOI] [PMC free article] [PubMed] [Google Scholar]
- Hadley RW, Hume JR. An intrinsic potential-dependent inactivation mechanism associated with calcium channels in guinea-pig myocytes. J Physiol. 1987;389:205–222. doi: 10.1113/jphysiol.1987.sp016654. [DOI] [PMC free article] [PubMed] [Google Scholar]
- Hashambhoy YL, Greenstein JL, Winslow RL. Role of CaMKII in RyR leak, EC coupling and action potential duration: a computational model. J Mol Cell Cardiol. 2010;49:617–624. doi: 10.1016/j.yjmcc.2010.07.011. [DOI] [PMC free article] [PubMed] [Google Scholar]
- Hashambhoy YL, Winslow RL, Greenstein JL. CaMKII-induced shift in modal gating explains L-type Ca2+ current facilitation: a modelling study. Biophys J. 2009;96:1770–1785. doi: 10.1016/j.bpj.2008.11.055. [DOI] [PMC free article] [PubMed] [Google Scholar]
- Hryshko LV, Bers DM. Citrate alters Ca channel gating and selectivity in rabbit ventricular myocytes. Am J Physiol Cell Physiol. 1992;262:C191–198. doi: 10.1152/ajpcell.1992.262.1.C191. [DOI] [PubMed] [Google Scholar]
- Imredy JP, Yue DT. Mechanism of Ca2+-sensitive inactivation of L-type Ca2+ channels. Neuron. 1994;12:1301–1318. doi: 10.1016/0896-6273(94)90446-4. [DOI] [PubMed] [Google Scholar]
- Jafri MS, Rice JJ, Winslow RL. Cardiac Ca2+ dynamics: the roles of ryanodine receptor adaptation and sarcoplasmic reticulum load. Biophys J. 1998;74:1149–1168. doi: 10.1016/S0006-3495(98)77832-4. [DOI] [PMC free article] [PubMed] [Google Scholar]
- January CT, Riddle JM. Early afterdepolarizations: mechanism of induction and block. A role for L-type Ca2+ current. Circ Res. 1989;64:977–990. doi: 10.1161/01.res.64.5.977. [DOI] [PubMed] [Google Scholar]
- January CT, Riddle JM, Salata JJ. A model for early afterdepolarizations: induction with the Ca2+ channel agonist Bay K 8644. Circ Res. 1988;62:563–571. doi: 10.1161/01.res.62.3.563. [DOI] [PubMed] [Google Scholar]
- Lee KS, Marban E, Tsien RW. Inactivation of calcium channels in mammalian heart cells: joint dependence on membrane potential and intracellular calcium. J Physiol. 1985;364:395–411. doi: 10.1113/jphysiol.1985.sp015752. [DOI] [PMC free article] [PubMed] [Google Scholar]
- Lee YS, Dun W, Boyden PA, Sobie EA. Complex and rate-dependent beat-to-beat variations in Ca2+ transients of canine Purkinje cells. J Mol Cell Cardiol. 2011;50:662–669. doi: 10.1016/j.yjmcc.2010.12.023. [DOI] [PMC free article] [PubMed] [Google Scholar]
- Linz KW, Meyer R. Control of L-type calcium current during the action potential of guinea-pig ventricular myocytes. J Physiol. 1998;513:425–442. doi: 10.1111/j.1469-7793.1998.425bb.x. [DOI] [PMC free article] [PubMed] [Google Scholar]
- Linz KW, Meyer R. Profile and kinetics of L-type calcium current during the cardiac ventricular action potential compared in guinea-pigs, rats and rabbits. Pflugers Arch. 2000;439:588–599. doi: 10.1007/s004249900212. [DOI] [PubMed] [Google Scholar]
- Luo CH, Rudy Y. A dynamic model of the cardiac ventricular action potential. I. Simulations of ionic currents and concentration changes. Circ Res. 1994a;74:1071–1096. doi: 10.1161/01.res.74.6.1071. [DOI] [PubMed] [Google Scholar]
- Luo CH, Rudy Y. A dynamic model of the cardiac ventricular action potential. II. Afterdepolarizations, triggered activity, and potentiation. Circ Res. 1994b;74:1097–1113. doi: 10.1161/01.res.74.6.1097. [DOI] [PubMed] [Google Scholar]
- Mahajan A, Sato D, Shiferaw Y, Baher A, Xie LH, Peralta R, Olcese R, Garfinkel A, Qu Z, Weiss JN. Modifying L-type calcium current kinetics: consequences for cardiac excitation and arrhythmia dynamics. Biophys J. 2008a;94:411–423. doi: 10.1529/biophysj.106.98590. [DOI] [PMC free article] [PubMed] [Google Scholar]
- Mahajan A, Shiferaw Y, Sato D, Baher A, Olcese R, Xie L-H, Yang M-J, Chen P-S, Restrepo JG, Karma A, Garfinkel A, Qu Z, Weiss JN. A rabbit ventricular action potential model replicating cardiac dynamics at rapid heart rates. Biophys J. 2008b;94:392–410. doi: 10.1529/biophysj.106.98160. [DOI] [PMC free article] [PubMed] [Google Scholar]
- Milberg P, Pott C, Fink M, Frommeyer G, Matsuda T, Baba A, Osada N, Breithardt G, Noble D, Eckardt L. Inhibition of the Na+/Ca2+ exchanger suppresses torsades de pointes in an intact heart model of long QT syndrome-2 and long QT syndrome-3. Heart Rhythm. 2008;5:1444–1452. doi: 10.1016/j.hrthm.2008.06.017. [DOI] [PubMed] [Google Scholar]
- Peterson BZ, DeMaria CD, Adelman JP, Yue DT. Calmodulin is the Ca2+ sensor for Ca2+-dependent inactivation of L-type calcium channels. Neuron. 1999;22:549–558. doi: 10.1016/s0896-6273(00)80709-6. [DOI] [PubMed] [Google Scholar]
- Peterson BZ, Lee JS, Mulle JG, Wang Y, de Leon M, Yue DT. Critical determinants of Ca2+-dependent inactivation within an EF-hand motif of L-type Ca2+ channels. Biophys J. 2000;78:1906–1920. doi: 10.1016/S0006-3495(00)76739-7. [DOI] [PMC free article] [PubMed] [Google Scholar]
- Priori SG, Corr PB. Mechanisms underlying early and delayed afterdepolarizations induced by catecholamines. Am J Physiol Heart Circ Physiol. 1990;258:H1796–1805. doi: 10.1152/ajpheart.1990.258.6.H1796. [DOI] [PubMed] [Google Scholar]
- Puglisi JL, Yuan W, Bassani JW, Bers DM. Ca2+ influx through Ca2+ channels in rabbit ventricular myocytes during action potential clamp: influence of temperature. Circ Res. 1999;85:e7–e16. doi: 10.1161/01.res.85.6.e7. [DOI] [PubMed] [Google Scholar]
- Restrepo JG, Weiss JN, Karma A. Calsequestrin-mediated mechanism for cellular calcium transient alternans. Biophys J. 2008;95:3767–3789. doi: 10.1529/biophysj.108.130419. [DOI] [PMC free article] [PubMed] [Google Scholar]
- Romero L, Carbonell B, Trenor B, Rodriguez B, Saiz J, Ferrero JM. Systematic characterization of the ionic basis of rabbit cellular electrophysiology using two ventricular models. Prog Biophys Mol Biol. 2011;107:60–73. doi: 10.1016/j.pbiomolbio.2011.06.012. [DOI] [PubMed] [Google Scholar]
- Sako H, Sperelakis N, Yatani A. Ca2+ entry through cardiac L-type Ca2+ channels modulates beta-adrenergic stimulation in mouse ventricular myocytes. Pflugers Arch. 1998;435:749–752. doi: 10.1007/s004240050579. [DOI] [PubMed] [Google Scholar]
- Saucerman JJ, Brunton LL, Michailova AP, McCulloch AD. Modeling beta-adrenergic control of cardiac myocyte contractility in silico. J Biol Chem. 2003;278:47997–48003. doi: 10.1074/jbc.M308362200. [DOI] [PubMed] [Google Scholar]
- Shannon TR, Wang F, Puglisi J, Weber C, Bers DM. A mathematical treatment of integrated Ca dynamics within the ventricular myocyte. Biophys J. 2004;87:3351–3371. doi: 10.1529/biophysj.104.047449. [DOI] [PMC free article] [PubMed] [Google Scholar]
- Sipido KR, Volders PG, de Groot SH, Verdonck F, Van de Werf F, Wellens HJ, Vos MA. Enhanced Ca2+ release and Na/Ca exchange activity in hypertrophied canine ventricular myocytes: potential link between contractile adaptation and arrhythmogenesis. Circulation. 2000;102:2137–2144. doi: 10.1161/01.cir.102.17.2137. [DOI] [PubMed] [Google Scholar]
- Soltis AR, Saucerman JJ. Synergy between CaMKII substrates and beta-adrenergic signalling in regulation of cardiac myocyte Ca2+ handling. Biophys J. 2010;99:2038–2047. doi: 10.1016/j.bpj.2010.08.016. [DOI] [PMC free article] [PubMed] [Google Scholar]
- Sonoda S, Ochi R. Independent modulation of L-type Ca2+ channel in guinea pig ventricular cells by nitrendipine and isoproterenol. Jpn Heart J. 2001;42:771–780. doi: 10.1536/jhj.42.771. [DOI] [PubMed] [Google Scholar]
- Splawski I, Timothy KW, Sharpe LM, Decher N, Kumar P, Bloise R, Napolitano C, Schwartz PJ, Joseph RM, Condouris K, Tager-Flusberg H, Priori SG, Sanguinetti MC, Keating MT. CaV1.2 calcium channel dysfunction causes a multisystem disorder including arrhythmia and autism. Cell. 2004;119:19–31. doi: 10.1016/j.cell.2004.09.011. [DOI] [PubMed] [Google Scholar]
- Sun L, Fan J, Clark J, Palade P. A model of the L-type Ca2+ channel in rat ventricular myocytes: ion selectivity and inactivation mechanisms. J Physiol. 2000;529:139–158. doi: 10.1111/j.1469-7793.2000.00139.x. [DOI] [PMC free article] [PubMed] [Google Scholar]
- Sung RJ, Wu YH, Lai NH, Teng CH, Luo CH, Tien HC, Lo CP, Wu SN. β-Adrenergic modulation of arrhythmogenesis and identification of targeted sites of antiarrhythmic therapy in Timothy (LQT8) syndrome: a theoretical study. Am J Physiol Heart Circ Physiol. 2010;298:H33–44. doi: 10.1152/ajpheart.00232.2009. [DOI] [PubMed] [Google Scholar]
- Tanskanen AJ, Greenstein JL, O’Rourke B, Winslow RL. The role of stochastic and modal gating of cardiac L-type Ca2+ channels on early after-depolarizations. Biophys J. 2005;88:85–95. doi: 10.1529/biophysj.104.051508. [DOI] [PMC free article] [PubMed] [Google Scholar]
- Thiel WH, Chen B, Hund TJ, Koval OM, Purohit A, Song LS, Mohler PJ, Anderson ME. Proarrhythmic defects in Timothy syndrome require calmodulin kinase II. Circulation. 2008;118:2225–2234. doi: 10.1161/CIRCULATIONAHA.108.788067. [DOI] [PMC free article] [PubMed] [Google Scholar]
- Yamada M, Ohta K, Niwa A, Tsujino N, Nakada T, Hirose M. Contribution of L-type Ca2+ channels to early afterdepolarizations induced by IKr and IKs channel suppression in guinea pig ventricular myocytes. J Membr Biol. 2008;222:151–166. doi: 10.1007/s00232-008-9113-9. [DOI] [PubMed] [Google Scholar]
- Yarotskyy V, Gao G, Peterson BZ, Elmslie KS. The Timothy syndrome mutation of cardiac CaV1.2 (L-type) channels: multiple altered gating mechanisms and pharmacological restoration of inactivation. J Physiol. 2009;587:551–565. doi: 10.1113/jphysiol.2008.161737. [DOI] [PMC free article] [PubMed] [Google Scholar]
- Yuan W, Ginsburg KS, Bers DM. Comparison of sarcolemmal calcium channel current in rabbit and rat ventricular myocytes. J Physiol. 1996;493:733–746. doi: 10.1113/jphysiol.1996.sp021418. [DOI] [PMC free article] [PubMed] [Google Scholar]
- Zeng J, Rudy Y. Early afterdepolarizations in cardiac myocytes: mechanism and rate dependence. Biophys J. 1995;68:949–964. doi: 10.1016/S0006-3495(95)80271-7. [DOI] [PMC free article] [PubMed] [Google Scholar]
- Zhong J, Hwang TC, Adams HR, Rubin LJ. Reduced L-type calcium current in ventricular myocytes from endotoxemic guinea pigs. Am J Physiol Heart Circ Physiol. 1997;273:H2312–2324. doi: 10.1152/ajpheart.1997.273.5.H2312. [DOI] [PubMed] [Google Scholar]
- Zhu ZI, Clancy CE. L-type Ca2+ channel mutations and T-wave alternans: a model study. Am J Physiol Heart Circ Physiol. 2007;293:H3480–3489. doi: 10.1152/ajpheart.00476.2007. [DOI] [PubMed] [Google Scholar]
- Zuhlke RD, Pitt GS, Deisseroth K, Tsien RW, Reuter H. Calmodulin supports both inactivation and facilitation of L-type calcium channels. Nature. 1999;399:159–162. doi: 10.1038/20200. [DOI] [PubMed] [Google Scholar]
Associated Data
This section collects any data citations, data availability statements, or supplementary materials included in this article.