

Abstract
The cellular basis of cardiac pacemaking is still debated. Reliable computational models of the sinoatrial node (SAN) action potential (AP) may help gain a deeper understanding of the phenomenon. Recently, novel models incorporating detailed Ca2+-handling dynamics have been proposed, but they fail to reproduce a number of experimental data, and more specifically effects of ‘funny’ (If) current modifications. We therefore developed a SAN AP model, based on available experimental data, in an attempt to reproduce physiological and pharmacological heart rate modulation. Cell compartmentalization and intracellular Ca2+-handling mechanisms were formulated as in the Maltsev–Lakatta model, focusing on Ca2+-cycling processes. Membrane current equations were revised on the basis of published experimental data. Modifications of the formulation of currents/pumps/exchangers to simulate If blockers, autonomic modulators and Ca2+-dependent mechanisms (ivabradine, caesium, acetylcholine, isoprenaline, BAPTA) were derived from experimental data. The model generates AP waveforms typical of rabbit SAN cells, whose parameters fall within the experimental ranges: 352 ms cycle length, 80 mV AP amplitude, −58 mV maximum diastolic potential (MDP), 108 ms APD50, and 7.1 V s−1 maximum upstroke velocity. Rate modulation by If-blocking drugs agrees with experimental findings: 20% and 22% caesium-induced (5 mm) and ivabradine-induced (3 μm) rate reductions, respectively, due to changes in diastolic depolarization (DD) slope, with no changes in either MDP or take-off potential (TOP). The model consistently reproduces the effects of autonomic modulation: 20% rate decrease with 10 nm acetylcholine and 28% increase with 1 μm isoprenaline, again entirely due to increase in the DD slope, with no changes in either MDP or TOP. Model testing of BAPTA effects showed slowing of rate, −26%, without cessation of beating. Our up-to-date model describes satisfactorily experimental data concerning autonomic stimulation, funny-channel blockade and inhibition of the Ca2+-related system by BAPTA, making it a useful tool for further investigation. Simulation results suggest that a detailed description of the intracellular Ca2+ fluxes is fully compatible with the observation that If is a major component of pacemaking and rate modulation.
Key points
Computational models of the electrical activity of sinoatrial cells (SANCs) have been proposed to gain a deeper understanding of the cellular basis of cardiac pacemaking.
However, they fail to reproduce a number of experimental data, among which are effects measured after modifications of the ‘funny’ (If) current.
We developed a novel SANC mathematical model by updating the description of membrane currents and intracellular mechanisms on the basis of experimental acquisitions, in an attempt to reproduce pacemaker activity and its physiological and pharmacological modulation.
Our model describes satisfactorily experimental data on pacemaking regulation due to neural modulation, If block and inhibition of the intracellular Ca2+ handling.
Computer simulation results suggest that a detailed description of the intracellular Ca2+ fluxes is fully compatible with the observation that If is a major component of pacemaking and heart rate modulation.
Introduction
The cellular basis of the pacemaker activity of the sinoatrial node (SAN), and specifically the degree of contribution of the different mechanisms involved, is still debated (Lakatta & DiFrancesco, 2009; DiFrancesco, 2010; Lakatta et al. 2010; Noble et al. 2010; Verkerk & Wilders, 2010; Rosen et al. 2012; DiFrancesco & Noble, 2012; Maltsev & Lakatta, 2012).
Reliable mathematical models of the SAN action potential (AP) may help gain a deeper understanding of the phenomenon. Indeed, many models of SAN AP have been developed (see Wilders (2007) for a review) since the first mathematical models reproducing pacemaker activity were created (McAllister et al. 1975; DiFrancesco & Noble, 1982; Noble & Noble, 1984; DiFrancesco & Noble, 1985).
More recently, two novel SAN AP models incorporating detailed calcium-handling dynamics have been proposed. Himeno et al. (2008) updated the Sarai et al. (2003) model by incorporating the β1-adrenergic signalling cascade in a guinea pig SAN model (referred throughout the paper as the HSMN model) in order to investigate the ionic mechanisms underlying the positive chronotropy. Maltsev & Lakatta (2009) proposed a rabbit SAN model (referred to throughout the paper as the ML model), mainly based on the Kurata model (Kurata et al. 2002) (referred to throughout the paper as the KHIS model) more specifically addressing the interactions between intracellular calcium handling and membrane currents. The HSMN and ML models have been also recently compared (Himeno et al. 2011) in order to analyse the extent to which cytosolic Ca2+ affects SAN pacemaker activity.
However, it is worth noting that despite the significant improvements introduced by such models in the description of SAN cell electrophysiology, neither the HSMN nor the ML model reproduces the experimental effects of ‘funny’ current (If) reduction. In fact, a large amount of data coming from different laboratories (Table 1) shows that the use of drugs at concentrations known to produce only partial block of If leads to significant AP rate decrease. On the contrary, simulation of complete block of If produces only minor rate reduction in the HSMN and ML models (about 1% and 5%, respectively). This limitation of present models seems particularly important when considering that most of the debate about the genesis of pacemaking is focused on the role of If current versus calcium oscillations (Lakatta & DiFrancesco, 2009) and significantly weakens the usefulness of numerical simulation in the investigation of the mechanisms of physiological and pharmacological pacemaking modulation.
Table 1.
Effects of If blockade
| Blocker | Dose | Expected percentage block | AP rate decrease |
|---|---|---|---|
| Caesium | 2 mm | <69% at −50 mV | 20.3 ± 3.6% |
| (DiFrancesco et al. 1986) | (Nikmaram et al. 1997) | ||
| 30% | |||
| (Denyer & Brown, 1990) | |||
| 5.2 ± 0.3% | |||
| (Vinogradova et al. 2002) | |||
| 6 mm | ∼69% at −50 mV | 23.9% | |
| (DiFrancesco et al. 1986) | (Choi et al. 1999) | ||
| Ivabradine | 3 μm | 78% at −70 mV | 16.2 ± 1.5% |
| 66% at −100 mV | (Bucchi et al. 2007) | ||
| (Bucchi et al. 2002) | 23.8 ± 3.9% | ||
| 58% at −100 mV | (Thollon et al. 1994) | ||
| (Bois et al. 1996) | |||
| 1 μm | 42% at −100 mV | 12.3 ± 5.2% | |
| (Bucchi et al. 2002) | (Thollon et al. 1994) | ||
| 32% at −100 mV | |||
| (Bois et al. 1996) |
AP rate reduction due to different levels of If block measured experimentally.
Moreover, from simulation results an open question arises: is the lack of effects of If block in the current models a direct consequence of the improved description of calcium handling? If this is the case, the role of If would have been previously overestimated because of the lack of detailed knowledge on calcium handling. Or is the lack of sensitivity to If block a consequence of an inaccurate description of the membrane currents? In the latter case an improvement of their mathematical formulation is needed in order to profitably use the computational approach to help understand the subtle mechanisms underlying pacemaking modulation.
Our main aim was to develop a SAN AP model rigorously based on available experimental data, and to compare the predictions of numerical analysis with the experimental rate modulation induced by autonomic stimulation, by If blockers and by changes in the Ca2+ transients. More specifically, we tested the hypothesis that a quantitatively important role of If in pacemaking and rate modulation is fully compatible with the recently proposed description of intracellular calcium handling. We selected the rabbit SAN as a basis for our model, and aimed at using species-specific data whenever possible for improved consistency. The model was constructed based on the mathematical formulation of rigorously selected ionic currents and pump/exchange mechanisms derived from relevant published experimental data, mostly obtained in voltage clamp experiments. The model was then validated by simulating the action of pharmacological and autonomic agents that modulate SAN rate and comparing numerical reconstructions with experimental results from the literature.
Methods
SAN AP model approach and development strategy
The specific aim of our study was to develop a new computational rabbit SAN AP model able to reproduce existing experimental data on pacemaker rate generation and modulation, with a specific focus on data concerning experimental effects of If modulation. The framework of the model and the computational strategy were the same as in previously published work (e.g. DiFrancesco & Noble, 1985).
The general approach was not to incorporate in the model new assumptions leading to modifications in the model structure, but rather to critically review the formulations of membrane currents, pumps and exchangers in light of experimental results requiring a more accurate description.
Figure 1 shows a schematic diagram of our model. Since the major new feature of the ML model was a more advanced and tuned formulation of the sarcoplasmic reticulum (SR) function, we kept all the intracellular Ca2+ handling (cell structure/compartmentalization, SR Ca2+ release and SR Ca2+ pump) unchanged with respect to the ML formulation. However, we only retained the membrane mechanisms for which clear experimental evidence is available for a quantitative relevant contribution to rabbit SAN activity. Moreover, several membrane currents/pumps/exchangers were reformulated based on a critical review of published rabbit experiments. Only minor parameter tuning was performed, as indicated in the subsections below, in order to improve the overall features of the simulated action potential.
Figure 1. Diagram of the model.
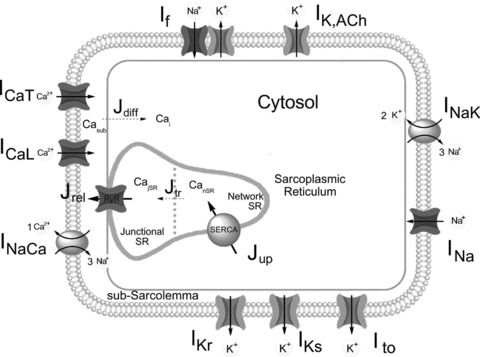
Schematic diagram of the model depicting cell compartments and major functional components. Fluid compartments include cytosol, subsarcolemmal space and sarcoplasmic reticulum (network and junctional SR). Membrane currents are shown with associated ion selectivities (see Supplemental Material for abbreviations). The Ca2+-handling system comprises Ca2+ diffusion from submembrane space to myoplasm (Jdiff), Ca2+ uptake by SR (Jup), Ca2+ pump (SERCA), transfer between network and junctional SR (Jtr), and release (Jrel) by ryanodine receptors (RyRs).
The model was implemented following the classical Hodgkin–Huxley formulation. Details for each current are described below. All model equations and parameter values are provided as Supplemental Material.
Identification of simulated currents
Funny current (If)
If is described as composed of two relatively independent Na+ and K+ components, IfNa and IfK, whose contributions to the total conductance at normal Na+ and K+ concentrations are similar, as according to the original description (DiFrancesco & Noble, 1982), If is also modulated by the extracellular potassium concentration Ko. We assumed as in the DiFrancesco–Noble model (DiFrancesco & Noble, 1985) that this dependence is a first order binding process. At the concentration of 5.4 mm, the maximal conductances gf,Na and gf,K have the same value of about 3.2 nS.
For the gating mechanism, we adopted Hodgkin–Huxley second order kinetics as in Noble et al. (1989). More recent models also adopted a similar description (Wilders et al. (1991); KHIS; ML). Our formulation of the steady-state activation curve fits the experimental results of Altomare et al. (2003) and Barbuti et al. (2007) and describes an activation curve positioned around a half-activation potential of −64 mV; notice that the previous KHIS and ML SAN models, based on data from Van Ginneken & Giles (1991), assumed a much more negative activation curve (Fig. 2A).
Figure 2. Funny current.
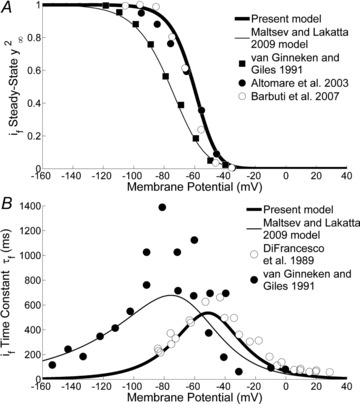
A, If activation curve. Plotted are the curve used in our model (thick line), based on data from Altomare et al. (2003) and Barbuti et al. (2007) (filled and open circles, respectively) and the curve used in the ML model (thin line), based on data from van Ginneken & Giles (1991) (filled squares). Fitting is performed using the second power of the gating variable y, as formulated in the two models. B, If time constant curve. Comparison between our curve (thick line) based on the square kinetics assumption of Noble et al.'s (1989) experimental data (open circles) and the ML model curve (thin line) based on van Ginneken & Giles (1991) data (filled circles).
The time constant curve (τf) was formulated on the basis of data from Noble et al. (1989) (Fig. 2B). Here too, our τf curve is shifted to more depolarized voltages relative to that of other models.
L-type calcium current (ICaL)
The kinetics of ICa,L are described by voltage-dependent activation (dL), voltage-dependent inactivation (fL), and Ca2+-dependent inactivation (fCa) gating variables.
The voltage dependences of the steady-state activation and inactivation curves (dL∞ and fL∞) are shown in Fig. 3. Their formulations were based on data from Fermini & Nathan (1991).
Figure 3. ICaL current.
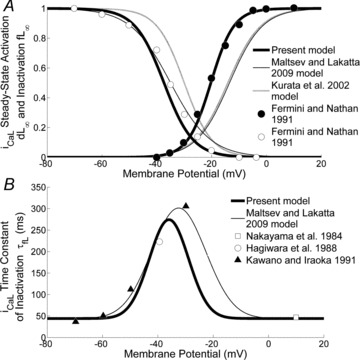
A, ICa,L activation and deactivation curves. Our activation and deactivation curves (thick lines), based on Fermini & Nathan's (1991) data (filled and open circles, respectively), are compared with those of the KHIS (grey line) and ML models (thin line). B, time constant of ICa,L inactivation. The plot shows our curve (thick line), the curve of the ML model (thin line) and experimental data from Nakayama et al. (1984) (open squares), Hagiwara et al. 1988 (open circles) and Kawano & Hiraoka (1991) (filled triangles).
Previous models (Demir et al. (1994); KHIS; ML) quoted the same experimental data as the basis for their description of ICa,L, though with additional adjustments, included to improve the fitting of action potential data, that make their activation curve formulation significantly different from experimental results (Fig. 3).
Expression of the activation time constant dL was based, as already done for the above models, on the whole cell data of Nilius (1986) (guinea pig SAN myocytes at 25°C), because specific data on rabbit SAN are not available. According to Demir et al. (1994), a Q10 factor of 2.3 was applied to scale these data up to a temperature of 37°C. We formulated the inactivation time constant from the data of Nakayama et al. (1984), Hagiwara et al. (1988) and Kawano & Hiraoka (1991).
Formulas for the Ca2+-dependent inactivation fCa were adopted from the KHIS model, as in the ML model.
We adopted the constant-field formulation to describe the conductance property of ICa,L, which is also known to have small but not negligible components carried by Na+ and K+ ions. The relative permeabilities of these components were set as in the model by Sarai et al. (2003). The calcium permeability was set to 0.2 nA mm−1 to provide a ICa,L density of 7 pA pF−1, within the experimental range (7.7 ± 2.3 pA pF−1) reported by Honjo et al. (1996) in rabbit SAN cells.
T-type calcium current (ICa,T)
As in the case with ICa,L, the steady state activation and inactivation curves (Fig. 4A), dt∞ and ft∞ respectively, are the Boltzmann curves fitting the data of Fermini & Nathan (1991). The ML, KHIS and Demir et al. (1994) models also referred to data from Hagiwara et al. (1988).
Figure 4. ICaT current.
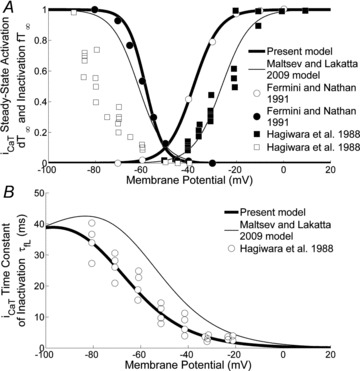
A, ICa,T activation and deactivation curves. Our activation and deactivation curves (thick lines), based on Fermini & Nathan's (1991) data (filled and open circles, respectively), are plotted along with the curves of the ML model (thin lines) and Hagiwara et al.'s (1988) data (filled and open squares, respectively). B, time constant of ICa,T inactivation. Compared are our curve (thick line), based on Hagiwara et al. (1988) (open circles) and the ML model curve (thin line).
The expression for the time constant of inactivation was obtained by fitting data from the study of Hagiwara et al. (1988), through a least square procedure. As done with ICa,L, to describe the ICa,T conductance we opted for the constant-field equation, setting the Ca2+ permeability to 0.02 nA mm−1, which allowed to maintain a stable total current during diastolic depolarization (DD).
Rapid and slow delayed rectifier K+ currents (IKr, IKs)
Extensive studies have shown that the total delayed rectifier potassium current can be separated into a rapidly activating IKr and a slowly activating IKs component (Sanguinetti & Jurkiewicz, 1990). The expression of these components in SAN cells are species dependent; in rabbit SAN, both currents are present, but IKr is the predominant component. Although the contribution of IKs to beating rate is small under control conditions, it becomes significant during β-adrenergic stimulation (Lei et al. 2002).
To describe the gating mechanism of IKr, previous models (such as Demir et al. (1994) and Dokos et al. (1996)) used equations provided by Shibasaki (1987) for rabbit node cells. Later models such as ML and its parent model KHIS based the formulation of the kinetics of IKr on the work of Ono & Ito (1995) on rabbit SAN cells at ∼33°C, reporting a complete set of quantitative data on current activation. According to their study, activation and deactivation of IKr are well modelled by two activation variables: a fast activation variable (paf) and a slow one (pas). The general activation variable (pa) is a convex linear combination of paf and pas.
We based the mathematical description of the activation and inactivation kinetics of IKr mainly on that of Ono & Ito (1995). In order to improve the overall AP morphology, the time constant of fast activation τaf was slightly modified, while the steady state activation variable (pa∞) was based on data by Lei & Brown (1996), from rabbit SAN cells at 37°C. Activation and inactivation curves and activation time constant curves are shown in Fig. 5. Since no detailed experimental data were reported by Ono & Ito (1995) on the voltage dependence of the time constant of inactivation, for this variable we used the expression provided by Shibasaki (1987), as in the ML model.
Figure 5. IKr current.
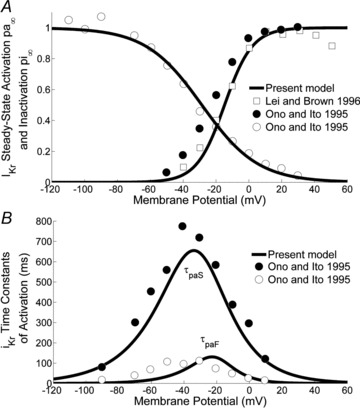
A, IKr activation and deactivation curves together with Ono & Ito's (1995) (open and filled circles) and Lei & Brown's (1996) (open squares) data. B, time constant for fast and slow IKr activation and Ono & Ito's (1995) data.
We described the slow activation of IKs (gate n) according to the formulation of Zhang et al. (2000), previously adopted also by the KHIS and ML models, in which current kinetics are modelled using second order Hodgkin–Huxley equations. The expression of the steady-state variable was from data in Lei & Brown (1996).
There are limited experimental data for the voltage dependence of the IKs time constant, τn, in rabbit SAN cells. The Zhang et al. (2000) model used a formulation from Heath & Terrar (1996), based on their data from guinea-pig ventricular cells. We modified the formulation of the time constant curve (Fig. S1A Supplemental Material) and set the conductance gKs to 1.7 nS in order to reproduce the AP-clamp results from rabbit SAN cells of Lei et al. (2002) (Fig. S1B and C, Supplemental Material).
Sodium-potassium pump (INaK)
INaK was described as according to the original description in KHIS, based on experimental data of Sakai et al. (1996) from rabbit SAN cells at 37°C. In models preceding the KHIS model, the expression of INaK was not based on data from SAN cells (KHIS). The voltage-dependent factor in the equation controlling the pump activity at diastolic voltages was steeper in our formulation than in the ML formulation (Fig. S2, Supplemental Material); we verified that this voltage dependence is associated with a range of calculated MDP values closer to values experimentally measured (Table 2).
Table 2.
Comparison of characteristics of simulated and experimental APs
| Characteristics | KHIS model (Kurata et al. 2002) | ML model (Maltsev & Lakatta, 2009) | Present model | Experimental values (mean ± SD (range)) |
|---|---|---|---|---|
| CL (ms) | 380 | 333 | 352 | 325 ± 42 (247÷389) |
| MDP (mV) | −59 | −63 | −58 | −56 ± 6 (−66÷−52) |
| APA (mV) | 79 | 76 | 80 | 87 ± 6 (78÷98) |
| POP (mV) | 20 | 16 | 22 | 27 ± 5(20÷32) |
| APD50 (ms) | 120 | 101 | 108 | 93 ± 12 (73÷111) |
| dV/dtmax (V s−1) | 7.6 | 4.8 | 7.1 | 11.3 ± 6.5 (4.8÷27) |
Simulation data from different models compared with experimental AP characteristics from 12 studies at physiological temperatures (Table 1 in Kurata et al. (2002)). CL, cycle length; MDP, maximum diastolic potential; APA, action potential amplitude; POP, peak overshoot potential; APD50, AP duration at its half-amplitude; dV/dtmax, maximum rate of rise of membrane potential during AP upstroke.
Transient outward (Ito) K+ current
We adopted the same set of equations as in the ML model, as modified from KHIS.
Acetylcholine-dependent (IK,ACh) K+ current
The starting formulation for the IK,ACh current was provided by the HSMN model, in turn derived from the Sarai et al. (2003) model, where the gating variables of IK,ACh (αa and βa) both depend upon membrane potential and ACh concentration.
The work by DiFrancesco et al. (1989) in rabbit SAN cells at 35–36°C includes measurement of IK,ACh at the holding potential of −40 mV in the presence of different ACh concentrations. By fitting these experimental data we obtained an updated formulation for the ACh-dependence of the gating variable.
Sodium current (INa)
In SAN cells, INa is a very small current. For its formulation we used the equations from Noble et al. (1989).
Sodium-calcium exchanger (INaCa) and sarcoplasmic reticulum (SR) currents
We used the same set of equations as in the ML and KHIS models.
Ion concentrations
The mass balance equations were used to describe the Ca2+ dynamics in the intracellular compartments. Even though the internal Na+ compartmentation is still incompletely understood, we also included the temporal variations in intracellular Na+ concentration.
Cell capacitance and dimensions
We used the same parameters as in the ML model.
Hardware and software
For simulations we used Cellular Open Resource (COR) (Garny et al. 2009) on a Windows 7 PC with an Intel Core 2 Quad processor. Integration was performed by CVODE algorithm, using Backward Differentiation Formula (BDF) together with a Newton iteration. All simulations were run until steady state (assessed by observation of intracellular sodium concentration) unless otherwise noted.
Model code can be requested from the authors and will be published in the CellML repository.
Identification of individual model components (i.e. steady state curves, time constants, etc.) was performed by custom code written in Matlab 2009a (The Mathworks, Inc., Natick, MA, USA), with a least squares approach, or through manual parameter estimation, where minimization was by simple guess and check.
Results
Features of simulated rabbit san cell action potential
AP waveforms generated by the model (Fig. 6A) mimic closely those recorded in rabbit SAN cells in normal Tyrode solution at a temperature of 34–37°C. The main AP parameters measured in the standard model configuration are reported in Table 2. All values fall within published experimental ranges and are similar to those of previous SAN AP models (see for example the KHIS and ML models in Table 2).
Figure 6. Simulation of 700 ms of spontaneous electrical activity in the rabbit SA node.
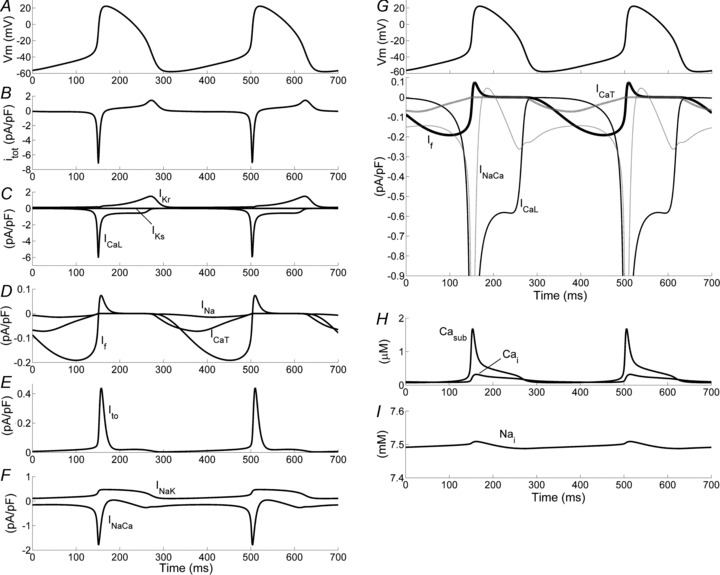
A–F, action potential, total ionic current and individual currents, pump and exchanger components are plotted as indicated. G, superimposition of inward membrane currents relevant to DD. H and I, Ca2+ transients and intracellular Na+ concentration.
In order to quantitatively describe the specific properties of DD, we tested the model with the method proposed and applied by Bogdanov et al. (2006) to characterize the different DD components in rabbit SAN AP. The DD is divided in two phases: the linear DD component (LDCC) and the non-linear one (NDDC). As reported in Table 3, our model correctly reproduces the subdivision of DD in the two phases, with a LDDC duration (NDCC delay in Table 3, according to Bogdanov et al. (2006)) lasting 78% of the total DD duration. However, a steeper mean slope of the linear component (MDD slope) was measured in the simulated APs. Notably Bucchi et al. (2007) found a basal value for MDD slope (called EDD in their paper) of 101 mV ms−1 at 2.9 Hz, which is very similar to the values of our model (101 mV ms−1 at 2.8 Hz).
Table 3.
Comparison of simulated and experimental features of diastolic depolarization (DD)
| Characteristics | KHIS model (Kurata et al. 2002) | ML model (Maltsev & Lakatta, 2009) | Present model | Experimental values (Bogdanov et al. 2006) |
|---|---|---|---|---|
| TOP (mV) | −40 | −39 | −41 | −46 ± 1 |
| DD duration (ms) (percentage of CL) | 123 (32%) | 168 (50%) | 185 (52%) | 194 ± 9 (56%) |
| MDD slope (mV s−1) | 168 | 153 | 101 | 57 ± 4 |
| NDDC amplitude (mV) | 18 | 18 | 21 | 20 ± 1 |
| NDDCτ (ms) | 15 | 23 | 13 | 17 ± 1 |
| NDDC delay (ms) (percentage of DD duration) | 78 (63%) | 99 (59%) | 145 (78%) | 145 ± 8 (75%) |
TOP, take-off potential; MDD slope, mean DD slope measured during the first two-thirds of the DD; NDDC, non-linear DD component; NDDCτ, time constant of exponential fitting of non-linear component; NDDC delay, time interval between time when MDP is reached and when NDDC reaches 5% of its amplitude.
The validity of the model was further assessed by reconstructing a classical voltage clamp experiment by which activation of If is elicited on hyperpolarization and both IK and ICaL are activated upon depolarization. As shown in Fig. S4, model voltage clamp results agree with typical experimental results.
In Fig. 6B–F and H–I the time course of ionic currents and intracellular ion concentrations under AP (Fig. 6A) are plotted. Inward components during DD are also plotted together in Fig. 6G to highlight their relative contributions. It can be seen that If slowly increases during DD, reaching its maximum in the second half of DD, whereas INaCa has a biphasic time course, decreasing in the first half of DD and then increasing (thus contributing to depolarization) in the second half. The contribution of ICa,T is minor, whereas ICa,L increases rapidly at the end of DD thus promoting the AP upstroke.
Effects of If blockade
The action of ivabradine was simulated by a partial block of funny channels (66% reduction of If conductance, as reported with a 3 μm concentration by Bucchi et al. (2002), Table 1). The assumption of a constant block during pacemaking activity was considered to be a good approximation because of the extremely slow block kinetics of ivabradine (Bucchi et al. 2002). During an activation/deactivation protocol (or during action potentials), ivabradine block develops very slowly, and attains eventually a steady-state level that can be assumed to remain constant during the protocol itself (or during activity), essentially independently of the kinetics of channel opening/closing.
The model predicts a reduction of spontaneous rate (Fig. 7B) of 22% in agreement with experimental findings (Table 1). The model also predicts a reduction of the LDDC slope from 101 to 72 mV s−1 (−29%) in accordance with the reported experimental value of −31.9 ± 4.5% (Bucchi et al. 2007). At the same time, neither the TOP (−42 vs.−41 mV) nor the MDP (−59 vs.−58 mV) is altered by the drug, as also verified experimentally (Bucchi et al. 2007). The overall time course of AP after ivabradine application is very similar to the experimental one (e.g. compare Fig. 7B and D). On the other hand, simulation of ivabradine effects, with the same percentage of If block, in the ML model leads to negligible effects (Fig. 7E).
Figure 7. Effects of ivabradine and caesium on pacing.
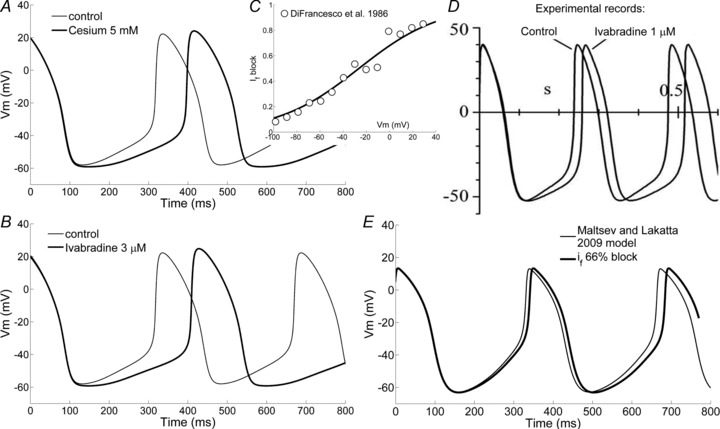
A and B, simulation of the action of 5 mm caesium and 3 μm ivabradine according to our SAN cell model. C, voltage dependence of If block by 5 mm Cs+ used in our model to simulate the action of Cs+, as based on DiFrancesco et al.'s (1986) data (open circles). D, experimental result with 1 μm ivabradine from DiFrancesco (2010). E, simulated effect of 66% block of If current in the ML model.
The action of caesium was simulated by the voltage-dependent partial block of funny channels (Fig. 7C), as reported from experimental analysis with a 5 mm concentration (DiFrancesco et al. 1986).
The model predicts a reduction of spontaneous rate (Fig. 7A) of 20%, which agrees well with experimental findings with 2–6 mm of caesium (Table 1). The model also predicts a reduction of the LDDC slope from 101 to 68 mV s−1 (−33%) in agreement with the reported experimental value of −26% (Nikmaram et al. 1997). Also in this case, the TOP (−44 vs.−41 mV) and the MDP (−59 vs.−58 mV) are not significantly affected.
Since a concurrent modulation of K+ channels by 5 mm Cs+ cannot be excluded, the implementation of the voltage-dependent block of K+ currents, as reported in Quayle et al. (1988), was also tested. The reduction in K+ currents led to a slight depolarization of the MDP but did not affect the overall rate reduction obtained by acting on If only (data not shown). For simplicity we decided not to include the action of Cs+ on K+ currents in our model.
Autonomic modulation of rate
Acetylcholine (ACh)- and isoprenaline (Iso)-induced variations in beating rate were reproduced by the model in a way that is quantitatively consistent with experimental data.
The action of ACh (Fig. S3) was simulated by block of the ICa,L current and SR Ca2+ uptake as in Maltsev & Lakatta (2010), by shifting the If activation curve with the relation used by Zaza et al. (1996) and based on the fitting of several sets of experimental data (DiFrancesco & Tromba, 1988; Dokos et al. 1996; Renaudon et al. 1997), and by activating IK,Ach according to data from DiFrancesco et al. (1989) (see also Supplemental Material).
The model predicts a reduction of spontaneous rate (Fig. 8A) of 19.6%, for 10 nm ACh, similar to the reported experimental value of 20.8 ± 3.2% (Bucchi et al. 2007). The model also predicts a reduction of the LDDC slope from 101 to 76 mV s−1 (−25%) to be compared with the reported experimental value of −29.3 ± 4.4% (Bucchi et al. 2007). At the same time, neither the TOP (−40 vs.−41 mV) nor the MDP (−59 vs.−58 mV) is altered by the drug, as verified experimentally (Bucchi et al. 2007).
Figure 8. Action of acetylcholine and isoprenaline.
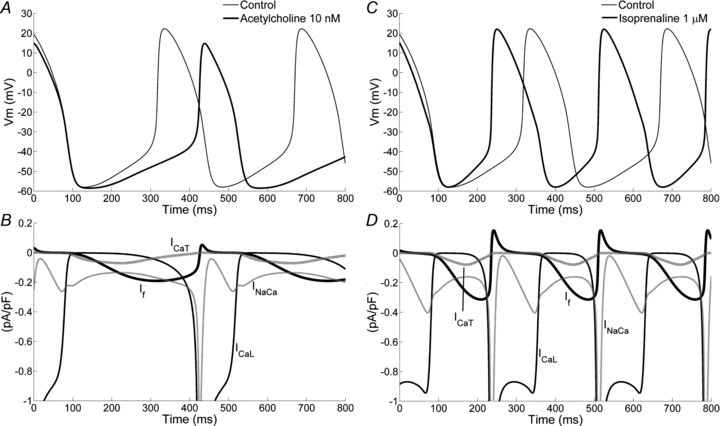
A and C, simulation of the action of 10 nm ACh and 1 μm Iso on spontaneous activity. B and D, contribution of individual ion currents to the ACh- and Iso-dependent rate modulation, respectively.
In order to gain additional mechanistic insight, we determined the contribution of individual ion currents to the ACh-dependent rate decrease (i.e. by specifically applying the phenomenological ACh effect on each current individually). The results show that changes in If are dominant. Indeed If modification alone leads to a 13% rate decrease whereas a minor effect is obtained when simulating exposure of only Jup to ACh concentration (1.1% rate decrease); further modulation of ICa,L and IK,Ach does not affect at all the pacemaking rate. Similar results were obtained by simulating ACh effects on all targets but one: when If was the only unchanged current, the rate reduction was only 1.4%, suggesting that If alone contributes more than 18%. In the same way, the residual contributions of IK,Ach and Jup were calculated as 5.2% and 2.8%, respectively. No contribution of ICa,L to rate reduction was seen.
Isoprenaline-induced rate acceleration, especially at low-to-moderate doses, is attributable mostly to the shortening of DD associated with a faster slope of DD, while action potential duration and shape vary minimally (Bucchi et al. 2007; DiFrancesco, 2010). The positive chronotropic effects of Iso 1 μm (Fig. 8C) were simulated by shifting the If activation gating variables by 7.5 mV to more positive voltages (Zaza et al. 1996) and by modulating ICa,L, IKs, INaK and the Ca2+ release uptake rate Pup. Specifically, 1 μm Iso increases the amplitude of ICa,L by 75% (Vinogradova et al. 2002); this enhancement was reconstructed by shifting the activation curves (Nagykaldi et al. 1999; Ke et al. 2007) to more negative values (−8 mV), by decreasing the inverse of slope factor of the activation variable dL∞ (−31%) (Antoons et al. 2007), and by increasing the maximal conductance (+23%). Similarly, IKs maximal conductance was increased by 20% and its activation curves were shifted by 14 mV to more negative potentials in order to increase the current amplitude (Severi et al. 2009; Wilders et al. 2010). A 20% increase of the maximal conductance of INaK was also introduced, according to Zeng & Rudy (1995). Finally, since the presence of a β-adrenergic agonist affects the SR Ca2+ pump (Vinogradova et al. 2006), but no quantitative data are available, following the same approach as in Maltsev & Lakatta (2010), we estimated an increase of Pup of 25% of its control value.
The overall simulated effect of 1 μm Iso was a 28.2% rate increase, in good agreement with the reported experimental value of 26.3 ± 5.4% for the same Iso concentration (Bucchi et al. 2007). The rate increase was entirely due to increase in the DD slope, with only minor changes in MDP and TOP (Fig. 8C).
The assessement of the contribution of each individual ion current to the Iso-dependent rate increase showed that changes in If are dominant, but the other contributions are not negligible. Indeed, when simulating exposure of only one of the Iso targets, the following rate changes were obtained: If+26.7%, IKs+3.8%, Jup+4.5%, INaK−2.9%, ICa,L+0.1%. Based on the simulation of Iso affecting all the targets but one the following residual contribution were obtained: If+17.2%, IKs+11.8%, Jup+1.1%, INaK−2.7%, ICa,L+1.2%.
Simulation of rapid cytosolic and sub-sarcolemmal Ca2+ chelation by acute BAPTA application
Ca2+ buffering by BAPTA was simulated according to the KHIS model in both the cytoplasm and subsarcolemmal space (see Supplemental Material), in an attempt to reproduce Himeno et al.'s (2011) experiments. Model testing of BAPTA effects showed slowing of rate without cessation of beating (Fig. 9A) as reported by Himeno et al. (2011) in guinea pig SAN cells (Fig. 9B); this result could not be reproduced by the ML model (Fig. 9C). In our simulation the spontaneous CL was increased up to 443 ms (−26% rate) and the AP amplitude was also significantly decreased.
Figure 9. Action internal BAPTA.
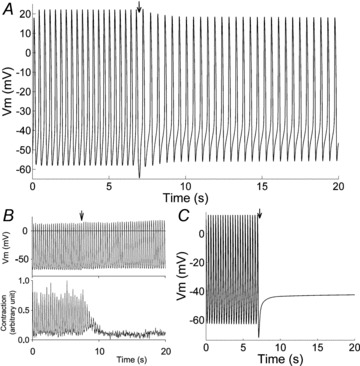
A, simulation of the effects of 10 mm BAPTA internal perfusion. B, spontaneous AP activity and cell contractions recorded experimentally upon perfusion with 10 mm BAPTA in guinea pig SAN cell (from Himeno et al. 2011, with permission of the American Physiological Society). C, same simulation in the ML model. Arrows in A and C indicate the beginning of the perfusion.
Model-based analysis of the effects on AP of If and Ca2+ handling modulation
The effects of If block is shown in Fig. 10A. Increasing levels of current block lead to progressive prolongation of the CL, up to complete cessation of pacemaking only when If is fully blocked.
Figure 10. Effects of If and INaCa blockade and Ca2+ handling modulation.
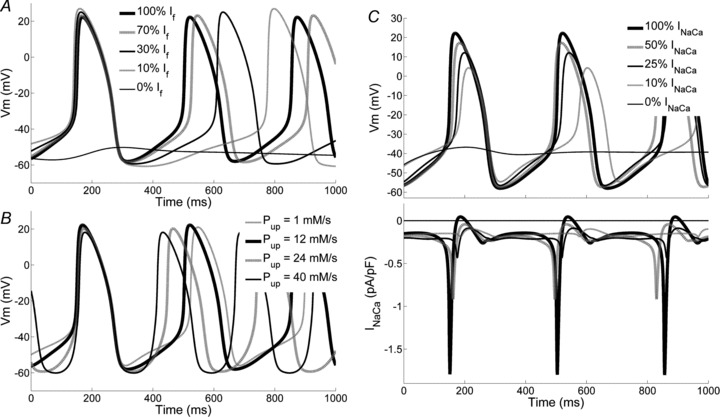
A, simulation of the effects of increasing level of If blockade (0, 30, 70, 90% and 100% conductance reduction) on spontaneous activity. Note that cessation of pacemaking occurs with full If block. B, effects of changes in Ca2+ uptake by SR Jup (Pup= 1, 12, 24, 40 mm s−1) on simulated activity. C, effects of gradual inhibition of Na+/Ca2+ exchange current (100, 50, 25, 10% and 0% residual current) on simulated activity (top); corresponding INaCa plotted in the bottom panel.
Full removal of INaCa also leads to cessation of pacemaking (Fig. 10C, upper panel) but the effect of partial current block is completely different from that due to If blockade. In this case almost no modulation of the CL occurs upon block of up to 75% of the maximal INaCa current. The lack of effects on CL is due to a physiological compensatory effect: the decrease of INaCa tends to cause Ca2+ accumulation in the subsarcolemmal space, which in turn increases the outward INaCa current. As a result, even in the presence of a massive reduction of the maximal INaCa current, the size of the actual INaCa current flowing during DD remains almost constant (Fig. 10C, lower panel). Partial INaCa block also leads to only minor alterations in intracellular Na+: from 7.5 to 7.35 mm and to 6.9 mm with a 75% and 90% blockade, respectively.
Modulation of Ca2+ handling processes through modification of the maximal SERCA pump current can also modulate pacemaking rate (Fig. 10B). Grading Pup from 1 to 40 mm s−1 increases the AP firing rate from 2.7 to 3.9 Hz. Notably, changes in CL are accompanied by changes in the morphology of DD, which becomes less linear (see Fig. 10B).
The presence in the model of the ‘isolated Ca2+ oscillator’ was tested by reproducing the simulations in which all membrane currents are set to 0 (see Fig. S5). As expected, the results are similar to those of Fig. 5C of Maltsev & Lakatta (2009). Moreover, we investigated the capability of the model to generate damped Ca2+ oscillations within the cell when the membrane potential is clamped at its maximum diastolic value (Fig. 11). Whereas an almost negligible oscillation in Ca2+ concentration is present in control conditions (Pup= 12 mm s−1), oscillations are clearly seen when Pup is increased up to 40 mm s−1 (Fig. 11B). Notably, at this high value of the SERCA pump activity, the morphology of membrane potential is altered and there is no linear phase of DD (Fig. 11A).
Figure 11. Effects of membrane potential clamp on SR Ca2+ release.
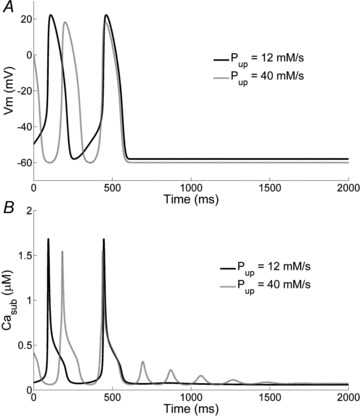
Simulation of subsarcolemmal Ca2+ (Casub) concentration dynamics (B) when the membrane potential is clamped at MDP (A) for Pup= 12 mm s−1 (continuous line) and 40 mm s−1 (dashed line). For high values of Pup damped Ca2+ oscillations are observed.
The contribution of the different pathways to pacemaking was further investigated by performing a model-based analysis in which the contributions of single membrane currents and subsarcolemmal Ca2+ concentration are dissected (Fig. 12). If block leads to stop of pacemaking if performed at either the time of MDP or at the beginning of the non-linear phase of DD. Clamping the Ca2+ concentration at the MDP value does not affect the early diastole but prolongs the late phase, without stopping pacemaking. When only the Ca2+ concentration ‘sensed’ by INaCa is clamped, such effects are enhanced, which is due to a lack of compensatory increase in ICaL driving force when Ca2+ concentration is low.
Figure 12. Effects of If block or subsarcolemmal Ca2+ (Casub) clamp during diastolic depolarization (DD).
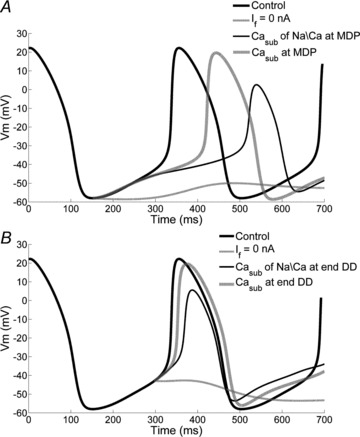
A, simulations of the effects on membrane potential of If block, clamping of Casub and clamping of the Ca2+ concentration ‘sensed’ by INaCa (i.e. the Ca2+ term in the INaCa equations). B, the same as in A, applied at the beginning of the nonlinear phase of DD.
To test if the contribution of If to pacemaking results directly from the specific choice of If formulation (see Fig. 1), we performed additional simulations. When the present model was run with a formulation of If kinetics based on van Ginneken & Giles's (1991) data, in basal conditions the CL was 386 ms (vs. 352 ms of the present model); thus, the decrease in If, as expected, leads to slowing of rate. When the action of 3 μm ivabradine was simulated we obtained a CL of 532 ms, that is rate was decreased by −27% (−22% in the present model).
When the present model was run with a formulation of If kinetics based on van Ginneken & Giles (1991) and the maximal conductance used in the ML model (that is, with the maximal conductance reduced by a factor of 2.375 with respect to van Ginneken & Giles's (1991) data), in basal conditions the CL was 505 ms. Simulation of the action of ivabradine led to 762 ms CL. Therefore, a strong sensitivity to If block was indicated by our model also when incorporating the If formulation used in previous models in which such sensitivity was not reproduced.
Discussion
We developed a novel computational model of physiological cardiac cell pacemaker function with the aim of reproducing a set of recent and less recent experimental data relevant to generation and control of pacemaker activity, and more specifically the changes of pacemaking function associated with changes in If current and Ca2+ handling as experimentally observed.
Our model describes satisfactorily the electrical activity of rabbit SAN cells and reproduces quantitatively experimental data on the action of autonomic rate modulation, f-channel blockade and inhibition of the Ca2+ transients by BAPTA, and can thus provide a basis for a more extended investigation.
A main assumption of this model, based on a wealth of experimental data (DiFrancesco, 2010), is that If is the major inward ionic current until late DD. This assumption differs substantially from those of previous recent SAN models such as the HSMN and ML models. Simulation results indicate that the above assumption of If being the major inward diastolic ionic current can be successfully integrated with a detailed description of the intracellular Ca2+ fluxes such as the one treated in the ML model, and is at the same time able to reproduce previously unexplained experimental results involving the modulation of both If and Ca2+ cycling.
A correct evaluation of the If activation curve is crucial to define the extent of the If contribution to pacemaking depolarization. Some discrepancies between different experimental data have long been reported and discussed (see e.g. DiFrancesco 1993). Current run-down, incomplete series resistance compensation, incomplete current activation at depolarized voltages, together with natural cell heterogeneity may have contributed to the underestimation of the size of If in previous reports. In building our model we decided to base the If formulation on data from rabbit SAN cells obtained in our laboratory, from experiments in which we were confident that all the possible confounding/altering factors had been carefully controlled.
Before validating our model against specific rate modulating agents, we assessed the basic AP characteristics. We compared the simulated AP features with the same set of experimental data used for validation of the KHIS and ML rabbit SAN models. As shown in Table 2, each of the basic characteristics of our model is within the range of experimental measurements.
One aspect of membrane potential morphology that is particularly relevant for SAN function is the profile of the slow diastolic depolarization (DD). It is well known that a distinctive feature of rabbit SAN AP is the linear increase of membrane potential during the early DD phase, followed by an exponential-like increase in the late DD phase. The latter is mainly driven by Ca2+ fluxes due to ICa,L early activation and to Ca2+ extrusion from the cell by INaCa. As apparent in Table 3 the duration of the linear early DD phase is shorter in the KHIS model than in real SAN cells. The recent inclusion in the ML SAN AP model of the phenomenon of spontaneous diastolic local Ca2+ release (LCR) has further exhacerbated this aspect, leading to an unbalanced description of DD, with a non-physiological predominance of the non-linear late phase. In our formulation a more realistic balance was achieved in which a linear early DD phase is clearly evident and lasts about 78% of total DD duration as also reported in experiments (Bogdanov et al. 2006). It is worth noting that this is fully compatible with the presence of a Ca2+-driven non-linear late DD phase and with the LCR phenomenon, as shown by the presence of a diastolic Ca2+ release whose amplitude is modulated by the SERCA pump activity. Our model confirms the ML model prediction that the SERCA pump can modulate pacemaking rate, but within a narrower range than that from their results: grading Pup from 1 to 40 mm s−1 increased the AP firing rate of our model from 2.7 to 3.9 Hz (Fig. 10B), compared to 1.8–4.2 Hz in the ML model. The relevance of INaCa to late DD and AP upstroke is also confirmed by the stop of pacemaker activity when a substantial INaCa block was simulated. This result is in line with experiments showing an inhibitory effect of Na+ replacement by Li+ on spontaneous beating in SAN cells (Bogdanov et al. 2001).
A novel feature of the proposed model is its capability to accurately reproduce the effects of If blockade. The most recent SAN models (HSMN and ML) show almost negligible effects of If block, although in previous models the increase in cycle length upon block of If ranges from 0.9% (Sarai et al. (2003)) to 30% (Zhang et al. (2000), peripheral cell). Nevertheless all such models, even if useful for theoretical analysis, are now outdated because of lack of species specificity or of detailed description of Ca2+ handling, or because they do not take into account more recent experimental data on membrane currents and other mechanisms. Even more importantly, simulations of the effects of If block have been often performed in these models by complete abolishment of the current. Again, this can be interesting for theoretical analysis, but it turns out not to be correct for validation purposes. In order to validate the computational model, a stringent comparison needs to be made with experimental conditions that have to be reproduced. In particular the specific pharmacological agent used in experiments and its dose–response characteristic has to be considered. This observation, which is obviously valid for any current or mechanism under study, indicates that the weight of If has been significantly underestimated in previous models, since the expected amount of If block from available experimental data is only partial (see Table 1). Our results demonstrate that it is possible to reproduce realistic If rate modulation properties without dramatically change other model components, in particular without modifying the Ca2+ handling description. The lack of sensitivity to If block in previous models can therefore be a consequence of incorrect estimation of membrane currents during diastolic depolarization, but not only of the If current (see results with the Van Ginneken & Giles (1991) kinetics). For example, the sensitivity to If block may be ‘masked’ in previous models by the overestimation of other inward currents such as the sodium background current or the sustained sodium current.
Block of Ca2+ transients (in both the cytosol and subsarcolemmal region) in our model reproduces the experimental finding by Himeno et al. (2011) that internal BAPTA perfusion, while completely abolishing contractions, maintains rhythmic electrical activity. In our computations the cycle is prolonged during block of Ca2+ transients, a result apparent in experimental prolonged perfusion with BAPTA (Himeno et al. 2011).
The present model is based on the assumption that the process underlying generation of the early fraction of the DD depends crucially on activation of If. The model reproduces the fact that the If-dependent early fraction of DD is linear and covers some three-quarters of the entire DD duration (Table 3). The way If contributes to determination of pacemaker rate is thus by controlling the slope of early DD. This process is economical, since during early DD the total membrane current is small and a little change in current can alter the steepness substantially, and is efficient, since a small change in steepness results in a substantial alteration of AP rate, obviously under condition of a constant AP threshold.
Contrary to previous SAN models, ours indicates that abolishment of If is associated with block of pacemaker activity and stabilization of the membrane potential to a resting level of about −50 mV (Fig. 10A). To compare this result with in vitro data one would need a fully specific f-channel blocker able to block 100% of the current, a condition which, as discussed above, cannot be achieved at present. A better solution to obtain full If block is the use of an animal model where conditional, cardiac-specific knockout of HCN4 is performed (Baruscotti et al. 2011). Even in this case, the condition of full If block is not attained because KO animals die before this occurs; however, the evidence that telemetric in vivo rate, spontaneous rate of isolated SAN cells, and If conductance decrease in parallel during the KO process (Figs 4 and 5; Baruscotti et al. 2011) rules in favour of a strict correlation between the simultaneous presence of If and spontaneous activity.
Our computational results do not in any way exclude, and actually support, the idea that changes in the Ca2+ transients affect rate. In the late part of DD, a chain of processes takes place which, as in a sort of ‘domino effect’, makes subsarcolemmal Ca2+ elevation activate INaCa and accelerate depolarization, which effectively ‘boosts’ the mechanism of ICa,L-triggered AP ignition. This chain of events contributes to determine the total duration of DD, and provides one of the mechanisms participating in the positive chronotropic response to sympathetic stimulation.
The model reproduces the effects of ACh and Iso on rate (Fig. 8). The Iso effect was obtained by shifting the If activation curve and modifying other components (ICa,L, IKs and Na+/K+ pump) in accordance with available experimental data; in addition, to mimic sympathetic stimulation the SERCA pump activity was augmented by 25%. This increase is much more modest than that assumed for example in the ML model (100%) based on a parametric analysis aimed to reproduce isoprenaline-induced rate changes, which could not be modified substantially by changes of membrane processes only (Maltsev & Lakatta, 2010). Computational separation of the effects allowed to point out that If is the dominant mechanism for Iso induced rate increase in the range up to 30%. It is also worth noting that an Iso-induced increase of the SERCA pump activity larger than that assumed in our simulation can be considered as a functional reserve, still available to reach greater rate increases.
The ACh-induced slowing was obtained by introducing a negative shift of the If activation curve and by applying expected changes in ICa,L, IK,ACh and the SERCA pump activity. All the latter changes affected only slightly the rate that was decreased almost entirely because of If reduction. As well as reproducing the expected rate changes, our computations show that neither Iso nor ACh modify substantially the TOP, in accordance with experimental data (Bucchi et al. 2007).
Limitations
Each numerical model is an imperfect representation of reality, and its limited function is that of verifying the consistency among input data, theoretical assumptions and experimental findings. As with any other model, ours has limitations which restrict its applicability. For example, the Ca2+ handling system is likely to be more complex than in our model. We did not include changes due specifically to the activity of the calmodulin kinase II and its dependence upon sympathetic stimulation. However, we used a phenomenological approach and included all Iso-induced changes of elements affecting membrane voltage, thus indirectly integrating also CaMKII-dependent processes.
Clearly, application of this model to a more complete set of experimental conditions will require deeper knowledge and more detailed formulation of these and other mechanisms. Moreover, although the validation using a consistent rabbit SAN-specific data-set strengthens the confidence in the model, it may limit its application in the study of human pathologies.
Conclusion
In conclusion, we developed a novel computational model of physiological cardiac cell pacemaker function able to reproduce a set of recent and less recent experimental data relevant to generation and control of pacemaker activity, and more specifically the changes of pacemaking function associated with changes in If current and Ca2+ handling as experimentally observed.
Acknowledgments
The authors would like to thank Ivan Cenci and Enrico Ravagli for their contribution in the initial stage of this work. Part of this work was supported by the Ministry of Education, University and Research grant PRIN 2008ETWBTW to DD.
Glossary
- AP
action potential
- APA
action potential amplitude
- APD
action potential duration
- APD50
action potential duration at its half-amplitude
- CL
cycle length
- DD
diastolic depolarization
- HCN4
hyperpolarization-activated cyclic nucleotide-gated channel 4
- HSMN
Himeno et al. (2008)
- ISO
isoprenaline
- KO
knockout
- KHIS
Kurata et al. (2002)
- LCR
local Ca2+ release
- LDDC
linear diastolic depolarization component
- MDD slope
mean DD slope
- MDP
maximum diastolic potential
- NDDC
non-linear diastolic depolarization component
- POP
peak overshoot potential
- SAN
sinoatrial node
- SERCA
sarco-endoplasmic reticulum Ca2+-ATPase
- SR
sarcoplasmic reticulum
- TOP
take-off potential
Author contributions
S.S.: conception and design, data analysis and interpretation, manuscript writing, final approval of manuscript. M.F.: data analysis and interpretation, manuscript writing, final approval of manuscript. L.A.C.: data analysis and interpretation, manuscript writing, final approval of manuscript. D.DiF.: conception and design, data analysis and interpretation, manuscript writing, final approval of manuscript.
Supplemental Data
Figure S1
Figure S2
Figure S3
Figure S4
References
- Altomare C, Terragni B, Brioschi C, Milanesi R, Pagliuca C, Viscomi C, Moroni A, Baruscotti M, DiFrancesco D. Heteromeric HCN1-HCN4 channels: a comparison with native pacemaker channels from the rabbit sinoatrial node. J Physiol. 2003;549:347–359. doi: 10.1113/jphysiol.2002.027698. [DOI] [PMC free article] [PubMed] [Google Scholar]
- Antoons G, Volders PGA, Stankovicova T, Bito V, Stengl M, Vos MA, Sipido KR. Window Ca2+ current and its modulation by Ca2+ release in hypertrophied cardiac myocytes from dogs with chronic atrioventricular block. J Physiol. 2007;579:147–160. doi: 10.1113/jphysiol.2006.124222. [DOI] [PMC free article] [PubMed] [Google Scholar]
- Barbuti A, Baruscotti M, DiFrancesco D. The pacemaker current: from basics to the clinics. J Cardiovasc Electrophysiol. 2007;18:342–347. doi: 10.1111/j.1540-8167.2006.00736.x. [DOI] [PubMed] [Google Scholar]
- Baruscotti M, Bucchi A, Viscomi C, Mandelli G, Consalez G, Gnecchi-Rusconi T, Montano N, Casali KR, Micheloni S, Barbuti A, DiFrancesco D. Deep bradycardia and heart block caused by inducible cardiac-specific knockout of the pacemaker channel gene Hcn4. Proc Natl Acad Sci U S A. 2011;108:1705–1710. doi: 10.1073/pnas.1010122108. [DOI] [PMC free article] [PubMed] [Google Scholar]
- Bogdanov KY, Maltsev VA, Vinogradova TM, Lyashkov AE, Spurgeon HA, Stern MD, Lakatta EG. Membrane potential fluctuations resulting from submembrane Ca2+ releases in rabbit sinoatrial nodal cells impart an exponential phase to the late diastolic depolarization that controls their chronotropic state. Circ Res. 2006;99:979–987. doi: 10.1161/01.RES.0000247933.66532.0b. [DOI] [PubMed] [Google Scholar]
- Bogdanov KY, Vinogradova TM, Lakatta EG. Sinoatrial nodal cell ryanodine receptor and Na+-Ca2+ exchanger : molecular partners in pacemaker regulation. Circ Res. 2001;88:1254–1258. doi: 10.1161/hh1201.092095. [DOI] [PubMed] [Google Scholar]
- Bois P, Bescond J, Renaudon B, Lenfant J. Mode of action of bradycardic agent, S 16257, on ionic currents of rabbit sinoatrial node cells. Br J Pharmacol. 1996;118:1051–1057. doi: 10.1111/j.1476-5381.1996.tb15505.x. [DOI] [PMC free article] [PubMed] [Google Scholar]
- Bucchi A, Baruscotti M, DiFrancesco D. Current-dependent block of rabbit sino-atrial node If channels by ivabradine. J Gen Physiol. 2002;120:1–13. doi: 10.1085/jgp.20028593. [DOI] [PMC free article] [PubMed] [Google Scholar]
- Bucchi A, Baruscotti M, Robinson RB, DiFrancesco D. Modulation of rate by autonomic agonists in SAN cells involves changes in diastolic depolarization and the pacemaker current. J Mol Cell Cardiol. 2007;43:39–48. doi: 10.1016/j.yjmcc.2007.04.017. [DOI] [PubMed] [Google Scholar]
- Choi HS, Wang DY, Noble D, Lee CO. Effect of isoprenaline, carbachol, and Cs+ on Na+ activity and pacemaker potential in rabbit SA node cells. Am J Physiol Heart Circ Physiol. 1999;276:H205–H214. doi: 10.1152/ajpheart.1999.276.1.H205. [DOI] [PubMed] [Google Scholar]
- Demir SS, Clark JW, Murphey CR, Giles WR. A mathematical model of a rabbit sinoatrial node cell. Am J physiol Cell Physiol. 1994;266:C832–C852. doi: 10.1152/ajpcell.1994.266.3.C832. [DOI] [PubMed] [Google Scholar]
- Denyer JC, Brown HF. Pacemaking in rabbit isolated sino-atrial node cells during Cs+ block of the hyperpolarization-activated current if. J Physiol. 1990;429:401–409. doi: 10.1113/jphysiol.1990.sp018264. [DOI] [PMC free article] [PubMed] [Google Scholar]
- DiFrancesco D. Pacemaker mechanisms in cardiac tissue. Annu Rev Physiol. 1993;55:455–472. doi: 10.1146/annurev.ph.55.030193.002323. [DOI] [PubMed] [Google Scholar]
- DiFrancesco D. The role of the funny current in pacemaker activity. Circ Res. 2010;106:434–446. doi: 10.1161/CIRCRESAHA.109.208041. [DOI] [PubMed] [Google Scholar]
- DiFrancesco D, Ducouret P, Robinson RB. Muscarinic modulation of cardiac rate at low acetylcholine concentrations. Science. 1989;243:669–671. doi: 10.1126/science.2916119. [DOI] [PubMed] [Google Scholar]
- DiFrancesco D, Ferroni A, Mazzanti M, Tromba C. Properties of the hyperpolarizing-activated current (if) in cells isolated from the rabbit sino-atrial node. J Physiol. 1986;377:61–88. doi: 10.1113/jphysiol.1986.sp016177. [DOI] [PMC free article] [PubMed] [Google Scholar]
- DiFrancesco D, Noble D. Implications of the reinterpretation of iK2 for the modelling of the electrical activity of the pacemaker tissues in the heart. In: Boumann LN, Jongsma HJ, editors. Cardiac Rate and Rhythm: Physiological, Morphological and Developmental Aspects. Martinus Nijhoff: TheHague; 1982. pp. 93–128. [Google Scholar]
- DiFrancesco D, Noble D. A model of cardiac electrical activity incorporating ionic pumps and concentration changes. Philos Trans R Soc Lond B Biol Sci. 1985;307:353–398. doi: 10.1098/rstb.1985.0001. [DOI] [PubMed] [Google Scholar]
- DiFrancesco D, Noble D. The funny current has a major pacemaking role in the sinus node. Heart Rhythm. 2012;9:299–301. doi: 10.1016/j.hrthm.2011.09.021. [DOI] [PubMed] [Google Scholar]
- DiFrancesco D, Tromba C. Inhibition of the hyperpolarization-activated current (if) induced by acetylcholine in rabbit sino-atrial node myocytes. J Physiol. 1988;405:477–491. doi: 10.1113/jphysiol.1988.sp017343. [DOI] [PMC free article] [PubMed] [Google Scholar]
- Dokos S, Celler B, Lovell N. Vagal control of sinoatrial rhythm: a mathematical model. J Theor Biol. 1996;182:21–44. doi: 10.1006/jtbi.1996.0141. [DOI] [PubMed] [Google Scholar]
- Fermini B, Nathan RD. Removal of sialic acid alters both T- and L-type calcium currents in cardiac myocytes. Am J Physiol Heart Circ Physiol. 1991;260:H735–H743. doi: 10.1152/ajpheart.1991.260.3.H735. [DOI] [PubMed] [Google Scholar]
- Garny A, Noble D, Hunter PJ, Kohl P. Cellular Open Resource (COR): current status and future directions. Philos Transact A Math Phys Eng Sci. 2009;367:1885–1905. doi: 10.1098/rsta.2008.0289. [DOI] [PubMed] [Google Scholar]
- Hagiwara N, Irisawa H, Kameyama M. Contribution of two types of calcium currents to the pacemaker potentials of rabbit sino-atrial node cells. J Physiol. 1988;395:233–253. doi: 10.1113/jphysiol.1988.sp016916. [DOI] [PMC free article] [PubMed] [Google Scholar]
- Heath BM, Terrar DA. Separation of the components of the delayed rectifier potassium current using selective blockers of IKr and IKs in guinea-pig isolated ventricular myocytes. Exp Physiol. 1996;81:587–603. doi: 10.1113/expphysiol.1996.sp003961. [DOI] [PubMed] [Google Scholar]
- Himeno Y, Sarai N, Matsuoka S, Noma A. Ionic mechanisms underlying the positive chronotropy induced by beta1-adrenergic stimulation in guinea pig sinoatrial node cells: a simulation study. J Physiol Sci. 2008;58:53–65. doi: 10.2170/physiolsci.RP015207. [DOI] [PubMed] [Google Scholar]
- Himeno Y, Toyoda F, Satoh H, Amano A, Cha CY, Matsuura H, Noma A. Minor contribution of cytosolic Ca2+ transients to the pacemaker rhythm in guinea pig sinoatrial node cells. Am J Physiol Heart Circ Physiol. 2011;300:H251–H261. doi: 10.1152/ajpheart.00764.2010. [DOI] [PubMed] [Google Scholar]
- Honjo H, Boyett MR, Kodama I, Toyama J. Correlation between electrical activity and the size of rabbit sino-atrial node cells. J Physiol. 1996;496:795–808. doi: 10.1113/jphysiol.1996.sp021728. [DOI] [PMC free article] [PubMed] [Google Scholar]
- Kawano S, Hiraoka M. Transient outward currents and action potential alterations in rabbit ventricular myocytes. J Mol Cell Cardiol. 1991;23:681–693. doi: 10.1016/0022-2828(91)90978-u. [DOI] [PubMed] [Google Scholar]
- Ke Y, Lei M, Collins TP, Rakovic S, Mattick PAD, Yamasaki M, Brodie MS, Terrar DA, Solaro RJ. Regulation of L-Type calcium channel and delayed rectifier potassium channel activity by p21-activated kinase-1 in guinea pig sinoatrial node pacemaker cells. Circ Res. 2007;100:1317–1327. doi: 10.1161/01.RES.0000266742.51389.a4. [DOI] [PubMed] [Google Scholar]
- Kurata Y, Hisatome I, Imanishi S, Shibamoto T. Dynamical description of sinoatrial node pacemaking: improved mathematical model for primary pacemaker cell. Am J Physiol Heart Circ Physiol. 2002;283:H2074–H2101. doi: 10.1152/ajpheart.00900.2001. [DOI] [PubMed] [Google Scholar]
- Lakatta EG, DiFrancesco D. What keeps us ticking: a funny current, a calcium clock, or both? J Mol Cell Cardiol. 2009;47:157–170. doi: 10.1016/j.yjmcc.2009.03.022. [DOI] [PMC free article] [PubMed] [Google Scholar]
- Lakatta EG, Maltsev VA, Vinogradova TM. A coupled SYSTEM of intracellular Ca2+ clocks and surface membrane voltage clocks controls the timekeeping mechanism of the heart's pacemaker. Circ Res. 2010;106:659–673. doi: 10.1161/CIRCRESAHA.109.206078. [DOI] [PMC free article] [PubMed] [Google Scholar]
- Lei M, Brown HF. Two components of the delayed rectifier potassium current, IK, in rabbit sino-atrial node cells. Exp Physiol. 1996;81:725–741. doi: 10.1113/expphysiol.1996.sp003972. [DOI] [PubMed] [Google Scholar]
- Lei M, Cooper PJ, Camelliti P, Kohl P. Role of the 293b-sensitive, slowly activating delayed rectifier potassium current, iKs, in pacemaker activity of rabbit isolated sino-atrial node cells. Cardiovasc Res. 2002;53:68–79. doi: 10.1016/s0008-6363(01)00459-x. [DOI] [PubMed] [Google Scholar]
- Maltsev VA, Lakatta EG. Synergism of coupled subsarcolemmal Ca2+ clocks and sarcolemmal voltage clocks confers robust and flexible pacemaker function in a novel pacemaker cell model. Am J Physiol Heart Circ Physiol. 2009;296:H594–H615. doi: 10.1152/ajpheart.01118.2008. [DOI] [PMC free article] [PubMed] [Google Scholar]
- Maltsev VA, Lakatta EG. A novel quantitative explanation for the autonomic modulation of cardiac pacemaker cell automaticity via a dynamic system of sarcolemmal and intracellular proteins. Am J Physiol Heart Circ Physiol. 2010;298:H2010–H2023. doi: 10.1152/ajpheart.00783.2009. [DOI] [PMC free article] [PubMed] [Google Scholar]
- Maltsev VA, Lakatta EG. The funny current in the context of the coupled-clock pacemaker cell system. Heart Rhythm. 2012;9:302–307. doi: 10.1016/j.hrthm.2011.09.022. [DOI] [PMC free article] [PubMed] [Google Scholar]
- McAllister RE, Noble D, Tsien RW. Reconstruction of the electrical activity of cardiac Purkinje fibres. J Physiol. 1975;251:1–59. doi: 10.1113/jphysiol.1975.sp011080. [DOI] [PMC free article] [PubMed] [Google Scholar]
- Nagykaldi Z, Kem D, Lazzara R, Szabo B. Canine ventricular myocyte β2-adrenoceptors are not functionally coupled to L-type calcium current. J Cardiovasc Electrophysiol. 1999;10:1240–1251. doi: 10.1111/j.1540-8167.1999.tb00302.x. [DOI] [PubMed] [Google Scholar]
- Nakayama T, Kurachi Y, Noma A, Irisawa H. Action potential and membrane currents of single pacemaker cells of the rabbit heart. Pflugers Arch. 1984;402:248–257. doi: 10.1007/BF00585507. [DOI] [PubMed] [Google Scholar]
- Nikmaram MR, Boyett MR, Kodama I, Suzuki R, Honjo H. Variation in effects of Cs+, UL-FS-49, and ZD-7288 within sinoatrial node. Am j Physiol Heart Circ Physiol. 1997;272:H2782–H2792. doi: 10.1152/ajpheart.1997.272.6.H2782. [DOI] [PubMed] [Google Scholar]
- Nilius B. Possible functional significance of a novel type of cardiac Ca channel. Biomed Biochim Acta. 1986;45:K37–K45. [PubMed] [Google Scholar]
- Noble D, DiFrancesco D, Denyer JC. Ionic mechanisms in normal and abnormal cardiac pacemaker activity. In: Jacklet JW, editor. Neuronal and Cellular Oscillators. 1989. pp. 59–85. [Google Scholar]
- Noble D, Noble PJ, Fink M. Competing oscillators in cardiac pacemaking. Circ Res. 2010;106:1791–1797. doi: 10.1161/CIRCRESAHA.110.218875. [DOI] [PubMed] [Google Scholar]
- Noble D, Noble SJ. A model of sino-atrial node electrical activity based on a modification of the DiFrancesco-Noble (1984) equations. Proc R Soc Lond B Biol Sci. 1984;222:295–304. doi: 10.1098/rspb.1984.0065. [DOI] [PubMed] [Google Scholar]
- Ono K, Ito H. Role of rapidly activating delayed rectifier K+ current in sinoatrial node pacemaker activity. Am J Physiol Heart Circ Physiol. 1995;269:H453–H462. doi: 10.1152/ajpheart.1995.269.2.H453. [DOI] [PubMed] [Google Scholar]
- Quayle JM, Standen NB, Stanfield PR. The voltage-dependent block of ATP-sensitive potassium channels of frog skeletal muscle by caesium and barium ions. J Physiol. 1988;405:677–697. doi: 10.1113/jphysiol.1988.sp017355. [DOI] [PMC free article] [PubMed] [Google Scholar]
- Rosen MR, Nargeot J, Salama G. The case for the funny current and the calcium clock. Heart Rhythm. 2012;9:616–618. doi: 10.1016/j.hrthm.2011.10.008. [DOI] [PubMed] [Google Scholar]
- Renaudon B, Bois P, Bescond J, Lenfant J. Acetylcholine modulates If and IK(ACh)via different pathways in rabbit sino-atrial node cells. J Mol Cell Cardiol. 1997;29:969–975. doi: 10.1006/jmcc.1996.0340. [DOI] [PubMed] [Google Scholar]
- Sakai R, Hagiwara N, Matsuda N, Kassanuki H, Hosoda S. Sodium–potassium pump current in rabbit sino-atrial node cells. J Physiol. 1996;490:51–62. doi: 10.1113/jphysiol.1996.sp021126. [DOI] [PMC free article] [PubMed] [Google Scholar]
- Sanguinetti MC, Jurkiewicz NK. Two components of cardiac delayed rectifier K+ current. Differential sensitivity to block by class III antiarrhythmic agents. J Gen Physiol. 1990;96:195–215. doi: 10.1085/jgp.96.1.195. [DOI] [PMC free article] [PubMed] [Google Scholar]
- Sarai N, Matsuoka S, Kuratomi S, Ono K, Noma A. Role of individual ionic current systems in the SA node hypothesized by a model study. Jpn J Physiol. 2003;53:125–134. doi: 10.2170/jjphysiol.53.125. [DOI] [PubMed] [Google Scholar]
- Severi S, Corsi C, Rocchetti M, Zaza A. Mechanisms of β-adrenergic modulation of IKs in the guinea-pig ventricle: insights from experimental and model-based analysis. Biophys J. 2009;96:3862–3872. doi: 10.1016/j.bpj.2009.02.017. [DOI] [PMC free article] [PubMed] [Google Scholar]
- Shibasaki T. Conductance and kinetics of delayed rectifier potassium channels in nodal cells of the rabbit heart. J Physiol. 1987;387:227–250. doi: 10.1113/jphysiol.1987.sp016571. [DOI] [PMC free article] [PubMed] [Google Scholar]
- Thollon C, Cambarrat C, Vian J, Prost JF, Peglion JL, Vilaine JP. Electrophysiological effects of S 16257, a novel sino-atrial node modulator, on rabbit and guinea-pig cardiac preparations: comparison with UL-FS 49. Br J Pharmacol. 1994;112:37–42. doi: 10.1111/j.1476-5381.1994.tb13025.x. [DOI] [PMC free article] [PubMed] [Google Scholar]
- van Ginneken AC, Giles W. Voltage clamp measurements of the hyperpolarization-activated inward current If in single cells from rabbit sino-atrial node. J Physiol. 1991;434:57–83. doi: 10.1113/jphysiol.1991.sp018459. [DOI] [PMC free article] [PubMed] [Google Scholar]
- Verkerk AO, Wilders R. Relative importance of funny current in human versus rabbit sinoatrial node. J Mol Cell Cardiol. 2010;48:799–801. doi: 10.1016/j.yjmcc.2009.09.020. [DOI] [PubMed] [Google Scholar]
- Vinogradova TM, Bogdanov KY, Lakatta EG. β-Adrenergic stimulation modulates ryanodine receptor Ca2+ release during diastolic depolarization to accelerate pacemaker activity in rabbit sinoatrial nodal cells. Circ Res. 2002;90:73–79. doi: 10.1161/hh0102.102271. [DOI] [PubMed] [Google Scholar]
- Vinogradova TM, Lyashkov AE, Zhu W, Ruknudin AM, Sirenko S, Yang D, Deo S, Barlow M, Johnson S, Caffrey JL, Zhou YY, Xiao RP, Cheng H, Stern MD, Maltsev VA, Lakatta EG. High basal protein kinase a-dependent phosphorylation drives rhythmic internal Ca2+ store oscillations and spontaneous beating of cardiac pacemaker cells. Circ Res. 2006;98:505–514. doi: 10.1161/01.RES.0000204575.94040.d1. [DOI] [PubMed] [Google Scholar]
- Wilders R. Computer modelling of the sinoatrial node. Med Biol Eng Comput. 2007;45:189–207. doi: 10.1007/s11517-006-0127-0. [DOI] [PubMed] [Google Scholar]
- Wilders R, Hoekstra M, van Ginneken AC, Verkerk AO. β-Adrenergic modulation of heart rate: contribution of the slow delayed rectifier K+ current (IKs. Comput Cardiol. 2010;37:629–631. [Google Scholar]
- Wilders R, Jongsma HJ, van Ginneken AC. Pacemaker activity of the rabbit sinoatrial node. A comparison of mathematical models. Biophys J. 1991;60:1202–1216. doi: 10.1016/S0006-3495(91)82155-5. [DOI] [PMC free article] [PubMed] [Google Scholar]
- Zaza A, Robinson RB, DiFrancesco D. Basal responses of the L-type Ca2+ and hyperpolarization-activated currents to autonomic agonists in the rabbit sino-atrial node. J Physiol. 1996;491:347–355. doi: 10.1113/jphysiol.1996.sp021220. [DOI] [PMC free article] [PubMed] [Google Scholar]
- Zeng J, Rudy Y. Early afterdepolarizations in cardiac myocytes: mechanism and rate dependence. Biophys J. 1995;68:949–964. doi: 10.1016/S0006-3495(95)80271-7. [DOI] [PMC free article] [PubMed] [Google Scholar]
- Zhang H, Holden AV, Kodama I, Honjo H, Lei M, Varghese T, Boyett MR. Mathematical models of action potentials in the periphery and center of the rabbit sinoatrial node. Am J Physiol Heart Circ Physiol. 2000;279:H397–H421. doi: 10.1152/ajpheart.2000.279.1.H397. [DOI] [PubMed] [Google Scholar]
Associated Data
This section collects any data citations, data availability statements, or supplementary materials included in this article.