Abstract
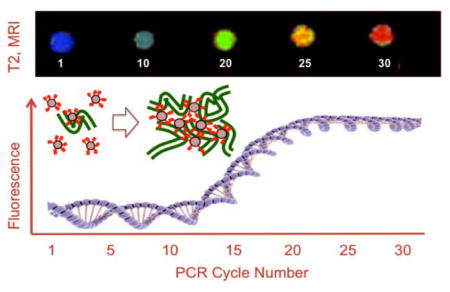
Magnetic nanoparticles bearing fluorochromes (red) that intercalate with DNA form microaggregates with PCR generated DNA, detected at low cycle numbers by MR.
Keywords: fluorescence, imaging agents, multivalency, MRI, polymerase chain reaction
PCR generated DNA is normally detected by fluorescence, however, with the development of small magnetic resonance (MR) relaxometers[1] and magnetic nanoparticle/magnetic relaxation switch assays[2], detection of the PCR reaction by MR might provide an alternative to fluorescence. We hypothesized that a magnetic nanoparticle (NP) surface functionalized with multiple DNA binding fluorochromes would react with DNA, forming multivalency driven microaggregates and allowing for a high sensitivity detection of PCR generated DNA by MR. Binding of DNA to solid phases is usually based on electrostatic interactions between a surface functionality and negatively charged phosphates on DNA[3] or by base pairing with surface oligonucleotides[2a, 4]. Surface functionalization of NP’s with DNA binding fluorochromes is a new approach for design of surfaces for DNA detection. Our study then combines three key elements: (i) the synthesis of fluorochrome mediated, DNA binding surfaces, (ii) the reaction of fluorochrome functionalized NP’s with DNA, to form microaggregates at low DNA concentrations and, (iii) the detection of microaggregates formed by the reaction of the NP with PCR-generated DNA by MR relaxometry or MRI.
We attached the DNA-binding fluorochrome TO-PRO 1 to the Feraheme (FH) NP by reacting “TO NHS” [5] with amino-Feraheme [6] (Figure 1a), to yield a NP denoted FH-TO. Approved for treating iron anemia, FH has a publically available formula (Fe5874O8752) with 414 carboxyl groups due to its carboxymethyl dextran coating (FH Package insert) with further information available[7]. The FH-TO had 9.9±2.4 TO-PRO 1’s per NP (per 5874 iron atoms) attached through a 6-carbon linker. (Values are the means ± 1 SE, n=4). FH-TO had r1 and r2 relaxivities of 23.3±2.2 and 122±12 (mM Fe x sec)−1, respectively (0.47T, 40°C), and a size of 59.8±3.4 nm (intensity weighted by dynamic light scattering). The FH had a zeta potential of −37.8±3 mV (pH 6) that was largely preserved with the attachment of 9.9 TO-PRO 1’s; FH-TO’s zeta potential was still highly negative (−28.3±0.8 mV). Preservation of a negative NP surface prevents electrostatic binding between a negatively charged DNA and a positively charged NP and insures that when FH-TO binds to DNA, it does so with an intercalation mechanism (Figure 1b) with a generation of fluorescence.
Figure 1.
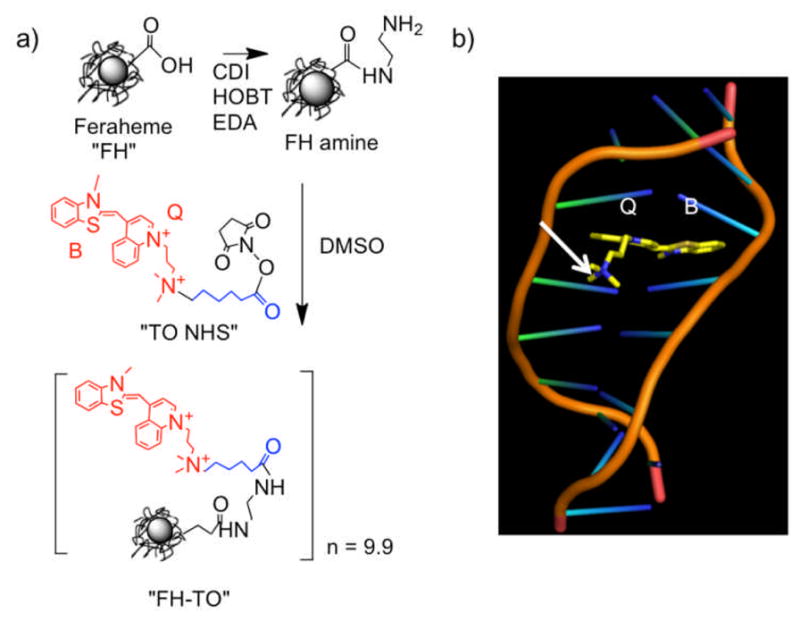
Synthesis of the FH-TO NP and TO-PRO 1 intercalation with DNA. a) An NHS ester of TO-PRO 1 (“TO NHS”) was reacted with aminated Feraheme (FH amine) to yield FH-TO with 9.9 TO’s per NP. CDI=carbodiimide, EDA=ethylene diamine, HOBT=hydroxybenzotriazole. “TO NHS” consists of TO-PRO 1 (red), a six-carbon linker (blue), and an NHS ester. b) Model showing benzathiazole (B) and quinoline (Q) rings of TO-PRO 1 (TO) intercalating into DNA. With TO NHS, a linker (not shown in (b)) maintains the quarternary positive charge (arrow) and does not interfere with the intercalation of the B and Q rings.
The interactions of the magnetofluorescent FH-TO NP with increasing concentrations of λ DNA, and two synthetic oligonucleotides (18 and 10 base pair (bp)) were examined using transverse MR relaxation times (ΔT2, Figure 2a) and fluorescence intensities (Figure 2b). Both gave hyperbolic functions with well-defined maxima, but the FH-TO/ΔT2 response occurred at far lower DNA concentrations. Our three DNA’s did not react with the control FH NP (2a), showing that the FH-TO/DNA interaction was mediated by TO-PRO 1, which fluoresces when intercalated between the bases of double stranded DNA[8]. The curves were then fit to a single site-binding model, yielding the apparent Kd’s summarized in Table 1. At concentrations between 0 and 0.25 ug/mL of λ DNA, concentrations that were at least ten-fold lower than any of the Kd’s obtained by fluorescence, FH-TO formed microaggregates evident by light scattering (2c) and TEM (2d). The formation of microaggregates of FH-TO and target DNA molecules exploits multivalent interactions between the 9.9 TO’s on the FH-TO surface and numerous intercalation sites on polymeric DNA, as shown schematically in Figure 2e. Our model proposes that FH-TO/DNA microaggregates form through TO intercalation and fluorescence (Figure 1b and above), as indicated by the failure of DNA to react with FH (Figure 2a, Figure 3a). Second, FH-TO/DNA microaggregates form with only small fraction of the TO’s on FH-TO surface involved in the DNA intercalation, which generates fluorescence (model, Figure 2e). Hence the Kd’s by ΔT2 were well below those for fluorescence with all three DNA’s examined (Table 1). Finally, since longer DNA provides more sites for intercalation, and hence for multivalent interactions with FH-TO, microaggregate-based, ΔT2 Kd’s were dependent on the size of the DNA target, decreasing (exhibiting higher affinity) as target molecular weight increased, see Table 1.
Figure 2.
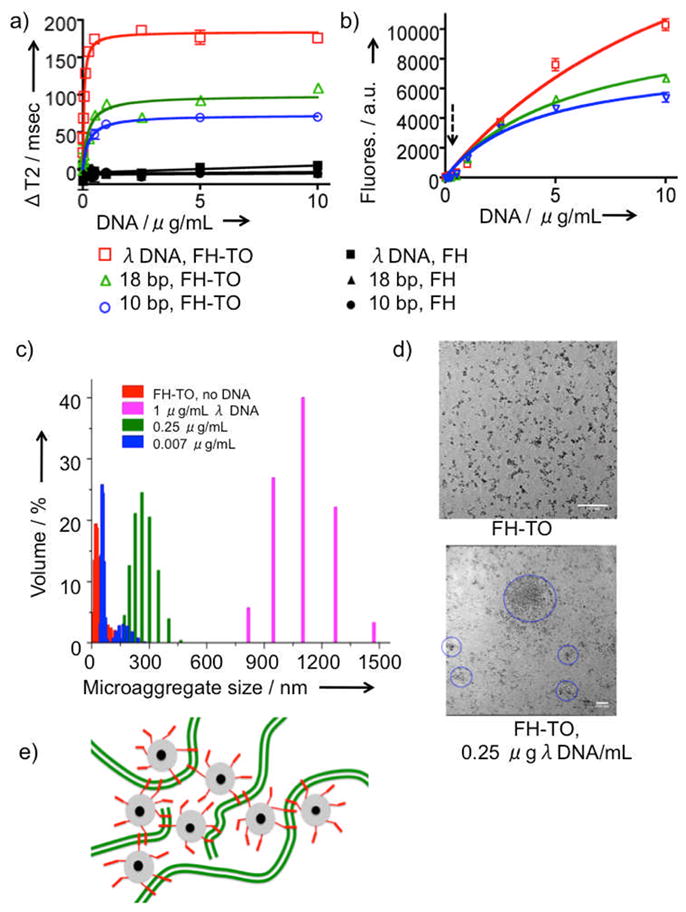
Reaction of FH-TO with DNA by T2, fluorescence, and light scattering. Changes in T2 (ΔT2, Figure 2a) or fluorescence (2b) for FH-TO with increasing concentrations of λ DNA, 18 bp, and 10 bp oligonucleotides are shown. (ΔT2 = T2 of FH & DNA minus T2 of FH-TO & DNA.) Squares (λ DNA), triangles (18bp oligo), or circles (10 bp oligo) are the same for 2a and 2b. Also shown is the lack of T2 response with FH (black symbols, Figure 2a). Data was fit to single site binding model, yielding the apparent dissociation constants (Kd’s) provided in Table 1. The dotted arrow in Figure 2b indicates a concentration of 0.25 μg/mL DNA. At this concentration microaggregates was detected by dynamic light scattering (2c) and their presence confirmed by TEM (2d) (scale marker is 100 nm). By light scattering and TEM, microaggregates formed λ DNA concentration of 0.25 μg/mL, a concentration where fluorescence was very low, see dotted arrow from (2b). (e) Model of microaggregate formation of FH-TO and DNA. Microaggregates form with very few of the TO-PRO 1’s (red) on the FH-TO NP (gray = carboxymethyl dextran coating, black = iron oxide core) intercalating with double stranded DNA (green).
Table 1.
Apparent dissociation constants for FH-TO and DNA’s By Relaxometry (Kd,ΔT2) and Fluorescence (Kd,Fl).
| DNA & MW | Compound | Kd,ΔT2 | Kd,Fl | Kd,Fl/KdΔT2 |
|---|---|---|---|---|
| λ DNA, 31,500 kDa | FH-TO | 0.050 μg/ml 1.591pM |
13.5 %μg/ml 0.429 nM |
270 |
| 18 bb 10,997 Da |
FH-TO | 0.232μg/ml 21.1 nM |
5.93 μg/ml 539 nM |
25.5 |
| 10 bp, 6,054 Da | FH-TO | 0.253μg/ml 41.8 nM |
4.19 μg/ml 692 nM |
16.6 |
| λDNA | TO-PRO 1 | 3.19 μg/ml 0.101 nM |
||
| 18bp | TO-PRO-1 | 3.29 μg/ml 0.104 nM |
||
| 10bp | TO-PRO-1 | 4.17 μg/ml 0.132 nM |
Figure 3.
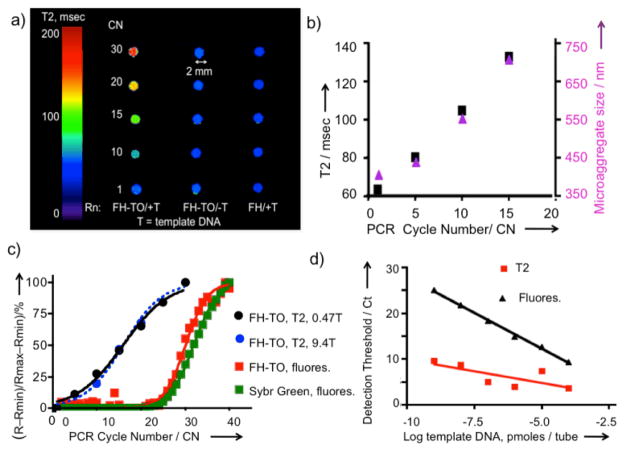
Monitoring PCR produced DNA by MR. (a) PCR reactions with FH-TO added were run in sealed PCR tubes, placed in a Gd-DTPA solution to minimize air/solution artifacts, see Figure S1, and imaged by MR at 9.4T. T= template DNA. Rn = reaction conditions. Omission of template DNA or use of Feraheme (FH), rather than FH-TO, yielded no changes in T2. (b) The PCR reaction was repeated and tubes were opened for measurements of T2 using a 0.47T relaxometer and microaggregate size (by light scattering). FH-TO (59 nm) reacted with primers to form microaggregates (402 nm) after one PCR cycle. At higher CN’s, microaggregate size and T2 increased. c) Comparison of the response by T2 and fluorescence with increasing cycle numbers. 0.47T data are from (b), while 9.4 T data are from (a). Fluorescence was determined using SybrGreen and FH-TO as fluorochromes. d) Comparison of threshold cycle (Ct) by fluorescence and T2 as a function of template DNA amounts. Ct’s by T2’s are lower than those fluorescence because microaggregate formation is being measured, which occurs with little or no fluorescence (Figure 2e).
We next examined the ability of FH-TO to detect DNA by adding the NP to a model cycling PCR reaction, and by obtaining T2 using the phantom design shown in Figure S1 and determining T2 by imaging as shown in Figure 3a. With a full complement of PCR reagents, T2 relaxation times increased with cycle number (CN), a response not seen with no DNA template (FH-TO/-T), or with PCR reagents and template but with a NP lacking TO-PRO 1 (FH/+T). Since the change in MR signal was dependent on the presence of DNA template and the TO-PRO 1 surface functionalization of FH, FH-TO reacts with the DNA produced by the PCR reaction and that reaction permits DNA to be imaged by MR. The reaction of FH-TO with PCR generated DNA at 1–15 cycles was then examined by microaggregate formation (light scattering) and T2 changes by relaxometry as shown in Figure 3b. After a single cycle, FH-TO reacted with PCR primers to form microaggregates (microaggregates = 402 nm, FH-TO= 59 nm), and these grew in size with increasing cycle numbers. Thus PCR generated DNA and FH-TO formed microaggregates, with changes in T2 by MRI (9.4T, Figure 3a) or relaxometry (Figure 3b). The responses to PCR generated DNA by MRI (9.4T, Figure 3a), relaxometry (0.47T, Figure 3b) were compared with responses obtained with SybrGreen of FH-TO fluorescence as shown using the logit equation (Figure 3c) with raw data provided in Table S1. Fluorescence was far less sensitive at detecting the PCR reaction than T2 by MRI (Figure 3a) or relaxometry (Figure 3b). Finally, we determined the sensitivity of detection of PCR generated DNA by T2 relaxometry and fluorescence, using PCR reactions run with variable template DNA template amounts (Figure 3d). Over a wide range of DNA template amounts, the detection thresholds (Ct’s) determined using FH-TO and T2 were substantially lower than Ct’s determined by SybrGreen fluorescence. (Ct = 20% of maximum signal change for fluorescence or MR.) The lower Ct’s by T2 result from a multivalent reaction between the surface of FH-TO (9.9 TO’s/NP) and PCR generated DNA, which forms microaggregates, a reaction that occurs at cycle numbers where fluorescence has not yet changed (CN = 1 to 15), see microaggregate size from Figure 3b.
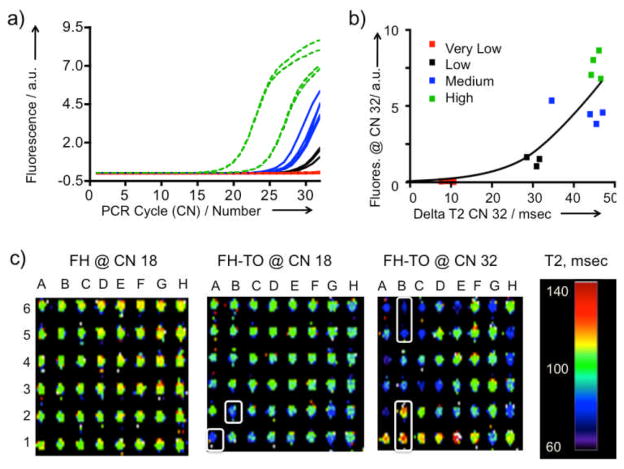
To determine whether FH-TO and MR could be used in a widely employed PCR application, cDNA from apoptotic Jurkat T cells was added to a commercially available, RT-PCR apoptosis-related gene expression array. At cycle 32, tubes with widely varying fluorescences from Figure 4a were selected, split into two portions with FH-TO or FH added, and the difference in T2 values determined by relaxometer; the correspondence between fluorescence and delta T2 obtained is shown in Figure 4b. The correspondence is only approximate reflecting, for example, the fact that PCR generated DNA can have variable molecular weights, and form microaggregates in a manner that does not completely parallel fluorochrome intercalation and fluorescence. (Note the dependence of Kd’s on DNA molecular weight, Table 1.)
Figure 4.
Detection of apoptosis related gene expression by RT-PCR using FH-TO and MR. a) The RT-PCR reaction was monitored by fluorescence. Gene expression was classified as high (green), medium (blue), low (black) or very low (red). Reaction was stopped at 32 cycles to maximize the differences in fluorescence. The fluorescence response for all genes and over the entire cycle range is shown as Figure S2). FH-TO or FH was then added at CN =32 and delta T2 values determined by relaxometry. b) Comparison of fluorescence from a) with delta T2 values by relaxometry. Data fit the hyperbolic equation y = 0.2551 0.07007x, r2 = 0.76. c) MRI of the apoptosis related gene expression with FH-TO (or FH control). At CN=18 and FH addition, all wells were between 100 and 140 msec. At CN= 18, FH-TO the A1 and B2 wells had lower T2’s (more bluish) indicating PCR DNA production. At CN=32 some FH-TO wells have lower (B5, B6) and have higher T2’s than the FH control, (B1,B2), see text. FH-TO, and not FH, reacts with products of the RT-PCR reaction in a cycle dependent fashion.
Finally, we added FH-TO or FH to apoptosis expression arrays which were stopped first at CN=18, a point where there the fluorescent response was initiated (Figure 4a), and then at 32 cycles, a point where there was high and variable fluorescence. (Figure S2 shows fluorescence data for the full array.) MR images of the plates were made, as a function of cycle number and NP (FH vs. FH-TO), see Figure 4c. With the non-DNA binding FH at CN=18 (or CN =32, not shown) all wells had T2’s of about 110–120 msec (orange to yellow) indicating no reaction with the non-fluorochrome bearing control NP. On the other hand, at CN=18 and with the DNA binding FH-TO, the T2’s of some wells (A1, B2) were lower (e.g. more bluish) than those with FH. With FH-TO and at CN=32, T2 changes were greater; some wells had lower (B5, B6) and some higher T2 values than the FH control, (B1, B2). FH-TO, and not FH, reacted with products of a RT-PCR reaction in a cycle dependent fashion. The detection of FH-TO/DNA microaggregates by MR has been achieved in a simple mix and read format (Figure 2), with a model PCR reaction (Figure 3), and with a commercial RT-PCR array for determing mRNA levels of apoptosis related genes (Figure 4).
When FH-TO reacts with DNA, T2 can decrease (Figure 2a) or increase (Figure 3a) or can vary from well to well, as in the array (Figure 4c, CN=32 B1, B2, T2 increase; B5, B6 T2 decrease.) The differing effects of magnetic NP aggregation on T2 has been observed before [9] and are explained by magnetic sphere relaxation theory. When small dispersed NP’s like FH-TO form microaggregates, larger magnetic field inhomogeneities are produced; these are more efficient dephasers of the T2 relaxation process and T2 decreases with microaggregate formation. When very large micron-sized aggregates are formed, a diffusion-limited condition results and T2 increases with further aggregation[10]. With PCR arrays T2 readings at multiple cycle numbers might therefore be needed to yield unambigious values of the relative mRNA’s determined by the RT-PCR metod.
Surface functionalization with nucleic acid binding fluorochromes offers a potentially general strategy for the design of nucleic acid binding nanoparticles. Elements of our strategy are: i) select a nucleic acid binding fluorochrome and synthesize its NHS ester with a linker placed so as not to impair DNA binding. (Impaired DNA binding can be assessed with an in vitro DNA binding fluorescence assay.), (ii) synthesize a surface functionalized, multivalent nanoparticle and, (iii) employ the multivalent NP in a solution phase, multivalent reaction where it forms microaggregates with a target DNA, a formation which can be monitored by T2, light scattering or other microaggregate detection techniques.
Further improvements in sensitivity of T2 based detection may be possible through the use of larger magnetic particles or magnetic field assisted NP aggregation, techniques that have resulted in substantial improvements in sensitivity with the detection of antibodies by relaxometry[9]. A higher sensitivity of DNA detection can reduce the number of PCR cycles used to detect templates, reducing amplification related errors, while the ability to measure T2 within enclosed reaction tubes can eliminate post amplification contamination. When combined with recent advances in miniature relaxometers noted above, the detection of PCR generated DNA in sealed reaction tubes (Figure 3b), and at high sensitivity (Table 1, Figures 2a, 3d), may permit the use of the PCR method in settings where it is not now possible.
Materials and Methods are in Supplementary Material.
Supplementary Material
Acknowledgments
This work was funded by R01’s from the NIH: EB 011996, EB 009691 and by P41RR14075, S10RR025563. The RT-PCR core was supported in part by a grant from the NINDS (P30-NS045776). D. Alcantara is a recipient of a Marie Curie Fellowship (EOI, MRI Nanobiosensor).
Contributor Information
Dr. David Alcantara, Center for Translational Nuclear Medicine and Molecular Imaging, Massachusetts General Hospital, 149 13th Street, Charlestown, MA 02129, Fax: (+)617-643-7212. Instituto de Nanociencia de Aragon, Universidad de Zaragoza, 50018 Zaragoza, Spain
Dr. Yanyan Guo, Center for Translational Nuclear Medicine and Molecular Imaging, Massachusetts General Hospital, 149 13th Street, Charlestown, MA 02129, Fax: (+)617-643-7212
Dr. Hushan Yuan, Center for Translational Nuclear Medicine and Molecular Imaging, Massachusetts General Hospital, 149 13th Street, Charlestown, MA 02129, Fax: (+)617-643-7212
Dr. Craig J. Goergen, Martinos Center for Biomedical Imaging, Massachusetts General Hospital, 149 13th Street, Charlestown, MA 02129
Dr. Howard H. Chen, Martinos Center for Biomedical Imaging Massachusetts General Hospital 149 13th Street, Charlestown, MA 02129
Dr. Hoonsung Cho, Center for Translational Nuclear Medicine and Molecular Imaging, Massachusetts General Hospital, 149 13th Street, Charlestown, MA 02129, Fax: (+)617-643-7212
Prof. Dr. David E. Sosnovik, Center for Translational Nuclear Medicine and Molecular Imaging, Massachusetts General Hospital, 149 13th Street, Charlestown, MA 02129, Fax: (+)617-643-7212. Martinos Center for Biomedical Imaging Massachusetts General Hospital 149 13th Street, Charlestown, MA 02129
Prof. Dr. Lee Josephson, Email: ljosephson@mgh.harvard.edu, Center for Translational Nuclear Medicine and Molecular Imaging, Massachusetts General Hospital, 149 13th Street, Charlestown, MA 02129, Fax: (+)617-643-7212. Martinos Center for Biomedical Imaging Massachusetts General Hospital 149 13th Street, Charlestown, MA 02129
References
- 1.a) Haun JB, Yoon TJ, Lee H, Weissleder R. Methods Mol Biol. 2011;726:33–49. doi: 10.1007/978-1-61779-052-2_3. [DOI] [PubMed] [Google Scholar]; b) Lee H, Sun E, Ham D, Weissleder R. Nat Med. 2008;14:869–874. doi: 10.1038/nm.1711. [DOI] [PMC free article] [PubMed] [Google Scholar]; c) Bart J, Janssen JW, van Bentum PJ, Kentgens AP, Gardeniers JG. J Magn Reson. 2009;201:175–185. doi: 10.1016/j.jmr.2009.09.007. [DOI] [PubMed] [Google Scholar]; d) Wensink H, Benito-Lopez F, Hermes DC, Verboom W, Gardeniers HJ, Reinhoudt DN, van den Berg A. Lab Chip. 2005;5:280–284. doi: 10.1039/b414832k. [DOI] [PubMed] [Google Scholar]
- 2.a) Josephson L, Perez JM, Weissleder RW. Angnew Chem Int Ed. 2001;40:3204–3207. doi: 10.1002/1521-3773(20010903)40:17<3204::AID-ANIE3204>3.0.CO;2-H. [DOI] [PubMed] [Google Scholar]; b) Perez JM, Josephson L, Weissleder R. Chembiochem. 2004;5:261–4. doi: 10.1002/cbic.200300730. [DOI] [PubMed] [Google Scholar]; c) Haun JB, Yoon TJ, Lee H, Weissleder R. Wiley Interdiscip Rev Nanomed Nanobiotechnol. 2010;2:291–304. doi: 10.1002/wnan.84. [DOI] [PubMed] [Google Scholar]
- 3.a) Marko MA, Chipperfield R, Birnboim HC. Anal Biochem. 1982;121:382–387. doi: 10.1016/0003-2697(82)90497-3. [DOI] [PubMed] [Google Scholar]; b) Boom R, Sol CJ, Salimans MM, Jansen CL, Wertheimvan Dillen PM, van der Noordaa J. J Clin Microbiol. 1990;28:495–503. doi: 10.1128/jcm.28.3.495-503.1990. [DOI] [PMC free article] [PubMed] [Google Scholar]
- 4.a) Maruyama T, Hosogi T, Goto M. Chem Commun (Camb) 2007:4450–4452. doi: 10.1039/b708082d. [DOI] [PubMed] [Google Scholar]; b) Ito T, Smith CL, Cantor CR. Proc Natl Acad Sci U S A. 1992;89:495–498. doi: 10.1073/pnas.89.2.495. [DOI] [PMC free article] [PubMed] [Google Scholar]; c) Rosi NL, Giljohann DA, Thaxton CS, Lytton-Jean AK, Han MS, Mirkin CA. Science. 2006;312:1027. doi: 10.1126/science.1125559. [DOI] [PubMed] [Google Scholar]; d) Perez JM, Josephson L, O’Loughlin T, Hogemann D, Weissleder R. Nat Biotechnol. 2002;20:816–820. doi: 10.1038/nbt720. [DOI] [PubMed] [Google Scholar]
- 5.a) Garanger E, Hilderbrand SA, Blois JT, Sosnovik DE, Weissleder R, Josephson L. Chem Commun (Camb) 2009:4444–4446. doi: 10.1039/b907375b. [DOI] [PMC free article] [PubMed] [Google Scholar]; b) Huang S, Chen HH, Yuan H, Dai G, Schuhle DT, Mekkaoui C, Ngoy S, Liao R, Caravan P, Josephson L, Sosnovik DE. Circ Cardiovasc Imaging. 2011;4:729–737. doi: 10.1161/CIRCIMAGING.111.966374. [DOI] [PMC free article] [PubMed] [Google Scholar]
- 6.Chen S, Alcantara D, Josephson L. J Nanosci Nanotechnol. 2011;11:3058–64. doi: 10.1166/jnn.2011.4164. [DOI] [PubMed] [Google Scholar]
- 7.a) Li W, Tutton S, Vu AT, Pierchala L, Li BS, Lewis JM, Prasad PV, Edelman RR. J Magn Reson Imaging. 2005;21:46–51. doi: 10.1002/jmri.20235. [DOI] [PubMed] [Google Scholar]; b) Balakrishnan VS, Rao M, Kausz AT, Brenner L, Pereira BJ, Frigo TB, Lewis JM. Eur J Clin Invest. 2009;39:489–496. doi: 10.1111/j.1365-2362.2009.02130.x. [DOI] [PubMed] [Google Scholar]
- 8.a) Van Hove L, Goossens W, Van Duppen V, Verwilghen RL. Clin Lab Haematol. 1990;12:287–289. doi: 10.1111/j.1365-2257.1990.tb00039.x. [DOI] [PubMed] [Google Scholar]; b) Nygren J, Svanvik N, Kubista M. Biopolymers. 1998;46:39–51. doi: 10.1002/(SICI)1097-0282(199807)46:1<39::AID-BIP4>3.0.CO;2-Z. [DOI] [PubMed] [Google Scholar]; c) Glazer AN, Rye HS. Nature. 1992;359:859–861. doi: 10.1038/359859a0. [DOI] [PubMed] [Google Scholar]; d) Prodhomme S, Demaret JP, Vinogradov S, Asseline U, Morin-Allory L, Vigny P. J Photochem Photobiol B. 1999;53:60–69. doi: 10.1016/s1011-1344(99)00127-x. [DOI] [PubMed] [Google Scholar]
- 9.a) Hong R, Cima MJ, Weissleder R, Josephson L. Magn Reson Med. 2008;59:515–520. doi: 10.1002/mrm.21526. [DOI] [PMC free article] [PubMed] [Google Scholar]; b) Koh I, Hong R, Weissleder R, Josephson L. Angew Chem Int Ed Engl. 2008;47:4119–4121. doi: 10.1002/anie.200800069. [DOI] [PMC free article] [PubMed] [Google Scholar]; c) Koh I, Hong R, Weissleder R, Josephson L. Anal Chem. 2009;81:3618–3622. doi: 10.1021/ac802717c. [DOI] [PMC free article] [PubMed] [Google Scholar]
- 10.a) Muller RN, Gillis P, Moiny F, Roch A. Magn Reson Med. 1991;22:178–182. doi: 10.1002/mrm.1910220203. [DOI] [PubMed] [Google Scholar]; b) Brooks RA, Moiny F, Gillis P. Magn Reson Med. 2001;45:1014–1020. doi: 10.1002/mrm.1135. [DOI] [PubMed] [Google Scholar]
Associated Data
This section collects any data citations, data availability statements, or supplementary materials included in this article.


