

Abstract
Background and Aims
Lolium perenne (perennial ryegrass) is the most important forage grass species of temperate regions. We have previously released the chloroplast genome sequence of L. perenne ‘Cashel’. Here nine chloroplast microsatellite markers are published, which were designed based on knowledge about genetically variable regions within the L. perenne chloroplast genome. These markers were successfully used for characterizing the genetic diversity in Lolium and different grass species.
Methods
Chloroplast genomes of 14 Poaceae taxa were screened for mononucleotide microsatellite repeat regions and primers designed for their amplification from nine loci. The potential of these markers to assess genetic diversity was evaluated on a set of 16 Irish and 15 European L. perenne ecotypes, nine L. perenne cultivars, other Lolium taxa and other grass species.
Key Results
All analysed Poaceae chloroplast genomes contained more than 200 mononucleotide repeats (chloroplast simple sequence repeats, cpSSRs) of at least 7 bp in length, concentrated mainly in the large single copy region of the genome. Nucleotide composition varied considerably among subfamilies (with Pooideae biased towards poly A repeats). The nine new markers distinguish L. perenne from all non-Lolium taxa. TeaCpSSR28 was able to distinguish between all Lolium species and Lolium multiflorum due to an elongation of an A8 mononucleotide repeat in L. multiflorum. TeaCpSSR31 detected a considerable degree of microsatellite length variation and single nucleotide polymorphism. TeaCpSSR27 revealed variation within some L. perenne accessions due to a 44-bp indel and was hence readily detected by simple agarose gel electrophoresis. Smaller insertion/deletion events or single nucleotide polymorphisms detected by these new markers could be visualized by polyacrylamide gel electrophoresis or DNA sequencing, respectively.
Conclusions
The new markers are a valuable tool for plant breeding companies, seed testing agencies and the wider scientific community due to their ability to monitor genetic diversity within breeding pools, to trace maternal inheritance and to distinguish closely related species.
Keywords: Lolium perenne, perennial ryegrass, Poaceae, chloroplast microsatellite markers, chloroplast genome, genetic diversity
INTRODUCTION
Lolium perenne (perennial ryegrass) is the most important forage grass species of temperate regions. Consequently, genomic sequence data and markers to study its variation are required by several end-users such as plant breeders, biotechnologists and population geneticists who are developing new varieties for the agricultural sector or studying its evolution. The complete nuclear and mitochondrial genomes of Lolium have not been determined but the complete chloroplast (plastid) genome of one of its cultivars, Lolium perenne ‘Cashel’, has been sequenced by our research group (Diekmann et al., 2008, 2009). Despite this advance, only a few studies have analysed the variability of the chloroplast genome in Lolium (e.g. Balfourier et al., 2000). However, the L. perenne chloroplast genome was sequenced using plant material from a population and, therefore, several single nucleotide polymorphisms (SNPs) were detected during chloroplast genome assembly. Such polymorphisms clearly offer great potential to develop markers for the study of genetic variation within and among populations of L. perenne and its close relatives.
We based our study on Irish L. perenne ecotypes that were mostly sampled from old pasture ecosystems. Old permanent grasslands often contain a large reservoir of genetic diversity in comparison with highly managed, fertilized and reseeded grasslands. To preserve this diversity, an extensive ex situ programme of collection and seed storage was undertaken between 1979 and 1983 by Teagasc (Irish Agriculture and Food Development Authority). A total of 534 sites were sampled and these ecotypes were then propagated under isolation. In 1994 the European Lolium core collection programme was started and 163 different accessions from different gene banks were included in this programme to assess genetic diversity within this species (Connolly, 2000). These two collections formed the plant material source for the present study.
We mainly focused our search for highly variable chloroplast genome markers on chloroplast microsatellite regions (chloroplast simple sequence repeats, cpSSRs) because they are known to be highly variable in comparison with other classes of DNA in the chloroplast genome due to slipped strand mispairing that occurs during replication of these regions (reviewed in Kelchner, 2000). These mutations usually result in small insertion/deletion events and are highly suitable as molecular markers (Taberlet et al., 1991; Powell et al., 1995a; Dumolin-Lapegue et al., 1997) that are commonly detected either by direct sequencing or sizing PCR amplicons (genotyping). Due to the overall high conservation of chloroplast DNA sequences among species (Olmstead and Palmer, 1994), primers have been designed to amplify cpSSRs based on sequences of related species if sequence information from the target species is missing. Some universal cpSSR markers have also been developed for angiosperms but these are not always sufficiently variable for chloroplast DNA characterization in Lolium (McGrath et al., 2007). The most productive approach is often to develop markers from genome information sequenced from the target species or at least from closely related taxa. McGrath et al. (2007) showed that plastid SSRs designed specifically from genome data of grasses can be highly variable and can detect genetic variability within populations. Furthermore, publication of the Lolium chloroplast genome (Diekmann et al., 2008, 2009) has provided new sequence information to allow the design of markers specifically for Lolium. As chloroplast genomes show uniparental inheritance and do not recombine during sexual reproduction, different microsatellite loci are linked together and individual haplotypes can be easily detected by applying a set of different chloroplast microsatellite markers (Bryan et al., 1999a).
There are many significant applications for chloroplast microsatellite markers in breeding schemes. cpSSRs enable the monitoring of seed-mediated gene flow in angiosperms where the chloroplast genome is generally maternally inherited (Corriveau and Coleman, 1988) and pollen flow in gymnosperms where the chloroplast genome is paternally inherited (Powell et al., 1995a). Thus, cpSSRs in combination with nuclear DNA markers can be used to assess the relative contribution of seed- vs. pollen-mediated gene flow. This is valuable for several applications including risk assessment of transferring transgenes into wild populations (Ryan et al., 2006) or for the detection of parentage in hybrids (Akkak et al., 2007; Atienza et al., 2007), allopolyploids (Hodkinson et al., 2002) and somatic hybrids (Bastia et al., 2001; Bryan et al., 1999b). Powell et al. (1995b) reported that intraspecific chloroplast variation is not random with regard to geographical localization, and thus chloroplast microsatellites are able to determine phylogeographical population structure (Balfourier et al., 2000; McGrath et al., 2007). Furthermore, cpSSRs are well suited to detect population genetic bottlenecks in natural populations and to assess the cytoplasmic diversity and genetic variation that exists in plant breeding material (Provan et al., 2001; Grau Nersting et al., 2006; Fjellheim et al., 2006).
Here we aimed to: (1) develop markers for chloroplast genome characterization of L. perenne and investigate their nature and distribution in the genome, (2) test their transferability to other closely related species, and (3) use the markers in studies of interspecific and intraspecific characterization of Lolium and its close relatives. Our search for variable sites within the chloroplast genome of L. perenne resulted in the design of nine new chloroplast markers applicable to a broad range of grass species. Some of them have potential for seed certification institutes because they enable the differentiation of L. perenne and Lolium mutliflorum. Others can be applied for genotyping wild and breeding populations via simple agarose gel electrophoresis without the need for sequencing or automated polyacrylamide gel genotyping systems.
MATERIALS AND METHODS
Fourteen Poaceae chloroplast genomes (Table 1) were searched for chloroplast microsatellites using the microsatellite finder tool find_microsat_Win32 (N Salamin, Université de Lausanne, Lausanne, Switzerland, unpubl. res.). The search focused on mononucleotide repeats of seven and more nucleotides that had to be interrupted from each other by at least one nucleotide.
Table 1.
List of Poaceae species that were used in the present studies and their corresponding GenBank accession numbers
| Poaceae species | Accession no. |
|---|---|
| Agrostis stolonifera | EF115543 |
| Bambusa oldhamii | FJ970915 |
| Brachypodium distachyon | EU325680 |
| Dendrocalamus latiflorus | FJ970916 |
| Festuca arundinacea | FJ466687 |
| Hordeum vulgare | EF115541 |
| Lolium perenne | AM777385 |
| Oryza nivara | AP006728 |
| Oryza sativa ‘japonica group’ | X15901 |
| Oryza sativa ‘indica group’ | AY522329 |
| Saccharum officinarum | AP006714 |
| Sorghum bicolor | EF115542 |
| Triticum aestivum | AB042240 |
| Zea mays | X86563 |
The mutation rate of microsatellite regions increases with an increasing number of repeat units (Ellegren, 2004). Therefore, from these data, only mononucleotide repeats of more than 10 bp length were considered for primer design. We preferentially chose microsatellite regions with high variation among species in the alignment. Furthermore, we designed primers so that they would also bind to non-L. perenne chloroplast DNA to enable their application in studies across different grass species. Thus, 14 regions consisting of 17 microsatellites were found (data not shown). Primer sets were then designed for nine regions, amplifying 12 microsatellites (Table 2), using the Primer3 software (http://frodo.wi.mit.edu/). Six primer sets amplified repeats in non-coding regions, three amplified repeats within genes of which only one amplified exclusively a gene region. The amplicon lengths varied from 195 to 658 bp depending on the primer set used. The amplicons were thus considerably longer than the microsatellite repeat of interest. This provided potential for recording other polymorphisms outside the SSR repeat and would allow them to be more broadly applied (e.g. for phylogenetic studies).
Table 2.
Poaceae universal chloroplast microsatellite primers
| Primer* | Sequence | Amplicon length (bp) | cpSSR | cpSSR position | Amplified genome region | NCBI accession nos. |
|---|---|---|---|---|---|---|
| TeaCpSSR27: | FP: AATGCCGAATCGACGACCTA | 390 | (A)7g(A)7 | 33357 | atpF intron | HM 172869–HM 172889 |
| RP: CAATGGTCCCTCTACGCAAT | ||||||
| TeaCpSSR28: | FP: TGCAATTTTTCTCGCATTTTC | 419 | (A)7c(A)8 | 36489 | rps14-psaB | HM 173009– HM 173027 |
| RP: TTTCCATTGTGCAAGCAAGA | ||||||
| TeaCpSSR29: | FP: GGTACCAATCCATAACGATC | 415 | (T)12 | 49337 | ndhK-ndhC | HM 172936–HM 172954 |
| RP: GCGCTAGTTTTTGTTGTTTT | ||||||
| TeaCpSSR30: | FP: GGATTAAGAATTGGTGGAATACC | 570 | (T)10 | 58739 | cemA | HM 172890–HM 172912 |
| RP: AAATGACTACAAGCGAAGGAGA | ||||||
| TeaCpSSR31: | FP: GGTCGTGGAATGCTTTTCTT | 658 | (T)11 | 62836 | psbE-petL | |
| RP: TCCACGAATCTCAATGACCA | (T)10 | 63032 | HM 172955–HM 172983 | |||
| (A)10 | 63108 | |||||
| TeaCpSSR32: | FP: ACGTCCCTTGCTTGAATCAT | 386 | (T)10 | 76076 | infA-rps8 | HM 172913–HM 172935 |
| RP: TCGAGGGATAATGACAGATCG | (T)10 | 76094 | ||||
| TeaCpSSR33: | FP: TGTCGCAAAGTTGAAACCAA | 482 | (T)11 | 76655 | rps8-rpl14 | HM 172984–HM 173008 |
| RP: AATCCACTGCCTTGATCCAC | ||||||
| TeaCpSSR34: | FP: CCCAATTTGCGACCTACCAT | 382 | (T)11 | 80296 | rps19-trnH | HM 173028–HM 173057 |
| RP: AATCCACTGCCTTGATCCAC | ||||||
| TeaCpSSR35: | FP: GGAGGCCTGCTACGCC | 195 | (C)10 | 93162 | rrn16- trnI | HM 173058–HM 173079 |
| RP: TGGAAGTCTTCTTTCGTTTAGGGT |
*FP, forward primer; RP, reverse primer.
DNA from 16 Irish L. perenne ecotypes, 15 European L. perenne ecotypes, nine L. perenne cultivars, six different Lolium species and 14 other grass species were analysed (Table 3) with up to 15 individuals per population. Total DNA from these individuals was extracted during an earlier project by McGrath et al. (2006, 2007).
Table 3.
Names of accessions, their origin, numbers of individuals used in the Lolium perenne diversity study and haplotypes found among Lolium and Festuca populations
| Species | Accession number | Individuals | Country of origin | County | Seed source | Haplotypes* |
||||||
|---|---|---|---|---|---|---|---|---|---|---|---|---|
| Total | Unique | Name | ||||||||||
| Lolium perenne– Irish ecotypes | ||||||||||||
| Lolium perenne | IRL-OP-02007 | 8 | Ireland | Cork | Teagasc Oak Park | 2 | 1 | 2 | ||||
| Lolium perenne | IRL-OP-02018 | 2 | Ireland | Wicklow | Teagasc Oak Park | – | – | – | – | – | – | – |
| Lolium perenne | IRL-OP-02059 | 8 | Ireland | Clare | Teagasc Oak Park | 3 | 1 | 2 | 3 | |||
| Lolium perenne | IRL-OP-02078 | 12 | Ireland | Galway | Teagasc Oak Park | 5 | 1 | 2 | 3 | 4 | 50 | |
| Lolium perenne | IRL-OP-02128 | 15 | Ireland | Kerry | Teagasc Oak Park | 4 | 2 | 1 | 2 | 7 | 8 | |
| Lolium perenne | IRL-OP-02173 | 15 | Ireland | Waterford | Teagasc Oak Park | 3 | 1 | 2 | 9 | |||
| Lolium perenne | IRL-OP-02192 | 7 | Ireland | Cork | Teagasc Oak Park | 1 | 1 | |||||
| Lolium perenne | IRL-OP-02230 | 2 | Ireland | Galway | Teagasc Oak Park | 2 | 1 | 2 | ||||
| Lolium perenne | IRL-OP-02267 | 7 | Ireland | Tipperary | Teagasc Oak Park | 3 | 1 | 1 | 10 | 11 | ||
| Lolium perenne | IRL-OP-02269 | 8 | Ireland | Tipperary | Teagasc Oak Park | 3 | 1 | 1 | 2 | 12 | ||
| Lolium perenne | IRL-OP-02274 | 2 | Ireland | Limerick | Teagasc Oak Park | 1 | 2 | |||||
| Lolium perenne | IRL-OP-02312 | 9 | Ireland | Cork | Teagasc Oak Park | 3 | 1 | 2 | 13 | |||
| Lolium perenne | IRL-OP-02337 | 3 | Ireland | Carlow | Teagasc Oak Park | 3 | 1 | 2 | 14 | |||
| Lolium perenne | IRL-OP-02419 | 8 | Ireland | Roscommon | Teagasc Oak Park | 3 | 1 | 2 | 3 | |||
| Lolium perenne | IRL-OP-02442 | 6 | Ireland | Mayo | Teagasc Oak Park | 4 | 1 | 2 | 3 | 4 | ||
| Lolium perenne | IRL-OP-02491 | 8 | Ireland | Wexford | Teagasc Oak Park | 3 | 1 | 2 | 14 | |||
| Lolium perenne– European ecotypes | ||||||||||||
| Lolium perenne | 21806 | 6 | Ukraine | N/A | 3 | 1 | 4 | 10 | ||||
| Lolium perenne | 16-7-62-2Nordic | 8 | Norway | Teagasc Oak Park | 3 | 1 | 2 | 13 | ||||
| Lolium perenne | 3013 Romania | 2 | Romania | Teagasc Oak Park | 1 | 2 | ||||||
| Lolium perenne | 3199 Romania | 5 | Romania | Teagasc Oak Park | 2 | 1 | 2 | |||||
| Lolium perenne | ABY-Ba 11478 | 7 | Greece | IBERS | 2 | 1 | 4 | |||||
| Lolium perenne | ABY-Ba 12896 | 6 | Denmark | IBERS | 2 | 1 | 2 | |||||
| Lolium perenne | IV-51-161 Hungary | 9 | Hungary | Teagasc Oak Park | 2 | 1 | 2 | |||||
| Lolium perenne | NGB 14250 | 4 | Sweden | Nordic Gene Bank | 1 | 1 | ||||||
| Lolium perenne | PI 267059 | 8 | Poland | GRIN | 3 | 1 | 3 | 9 | 15 | |||
| Lolium perenne | PI 321397 | 7 | Czech Republic | GRIN | 2 | 1 | 2 | |||||
| Lolium perenne | PI 547390 | 1 | Iran | GRIN | – | – | – | – | – | – | – | |
| Lolium perenne | PI 598445 | 8 | Netherlands | GRIN | 5 | 1 | 2 | 4 | 13 | 60 | ||
| Lolium perenne | W6 11325 | 8 | Turkey | GRIN | 4 | 1 | 2 | 4 | 14 | |||
| Lolium perenne | W6 9286 | 8 | France | GRIN | 1 | 2 | ||||||
| Lolium perenne | W6 9339 | 8 | Wales | GRIN | 4 | 1 | 2 | 4 | 10 | |||
| Lolium perenne– cultivars | ||||||||||||
| Lolium perenne | ‘Aurora’ | 8 | N/A | IBERS | 2 | 1 | 2 | |||||
| Lolium perenne | ‘Barlenna’ | 5 | N/A | Barenbrug Holland BV | 3 | 1 | 2 | 10 | ||||
| Lolium perenne | ‘Cashel’ | 5 | N/A | Teagasc Oak Park | 3 | 1 | 2 | 3 | ||||
| Lolium perenne | ‘Greengold’ | 8 | N/A | Teagasc Oak Park | 2 | 1 | 2 | |||||
| Lolium perenne | ‘Magician’ | 2 | N/A | Teagasc Oak Park | 1 | 1 | ||||||
| Lolium perenne | ‘Manhattan’ | 8 | N/A | Alan Stewart NZ | 3 | 1 | 3 | 14 | ||||
| Lolium perenne | ‘Navan’ | 2 | N/A | DARDNI | 1 | 2 | ||||||
| Lolium perenne | ‘Odenwaelder’ | 2 | N/A | IPK Gatersleben | 1 | 1 | ||||||
| Lolium perenne | ‘Portstewart’ | 6 | N/A | DARDNI | 2 | 1 | 2 | 17 | ||||
| Lolium spp. | ||||||||||||
| Lolium hybridum | GR 11849/49 | 5 | N/A | IPK Gatersleben | 3 | 1 | 3 | 25 | 60 | |||
| Lolium multiflorum | ‘Multimo’ | 8 | N/A | N/A | 3 | 20 | 21 | 22 | ||||
| Lolium multiflorum | ‘Nivack’ | 7 | N/A | N/A | 3 | 20 | 21 | 22 | ||||
| Lolium persicum | PI 229764 | 6 | Iran | GRIN | 3 | 1 | 50 | 27 | 50 | |||
| Lolium remotum | GR 11839/99a | 3 | Germany | IPK Gatersleben | 1 | 1 | 23 | |||||
| Lolium subulatum | PI 197310 | 7 | Argentina | GRIN | 4 | 50 | 9 | 60 | 50 | |||
| Lolium temulentum | ABY-Ba 8917 | 3 | Iran | IBERS | 1 | 9 | ||||||
| Lolium temulentum | ABY-Ba 13643 | 7 | Morocco | IBERS | 2 | 2 | 18 | 19 | ||||
| Other species | ||||||||||||
| Agrostis stolonifera | PI 439027 | 8 | Uzbekhistan | GRIN | – | – | – | – | – | – | – | |
| Avena sativa | ‘Evita’ | 1 | N/A | Lochow-Petkus | – | – | – | – | – | – | – | |
| Bromus erectus | PI 619490 | 4 | Hungary | GRIN | – | – | – | – | – | – | – | |
| Cynosurus cristatus | PI 509441 | 2 | Romania | GRIN | – | – | – | – | – | – | – | |
| Festuca arundinacea | ‘Dovey’ | 1 | N/A | Barenbrug Holland BV | – | – | – | – | – | – | – | |
| Festuca ovina | PI 634304 | 6 | China | GRIN | 5 | 4 | 28 | 33 | 34 | 35 | 36 | |
| Festuca pratensis | ‘Wendelmold’ | 1 | N/A | N/A | – | – | – | – | – | – | – | |
| Festuca pratensis | ‘Northland’ | 8 | N/A | PGG-Wrightson | 1 | 1 | 32 | |||||
| Festuca rubra | IRL-OP-02174 | 5 | Ireland | Teagasc Oak Park | 4 | 4 | 37 | 38 | 39 | 40 | ||
| Festuca vivipara | PI 251118 | 8 | Yugoslavia | GRIN | 4 | 3 | 28 | 29 | 30 | 31 | ||
| Hordeum vulgare | ‘Regina’ | 1 | N/A | Cebeco Zaden BV | – | – | – | – | – | – | – | |
| Poa pratensis | PI 539060 | 4 | Siberia | GRIN | – | – | – | – | – | – | – | |
| Secale cereale | ‘Protector’ | 1 | N/A | Cebeco Zaden BV | – | – | – | – | – | – | – | |
| Triticum aestivum | ‘Robicum’ | 1 | N/A | CPB Twyford UK | – | – | – | – | – | – | – | |
| ×Triticosecale | ‘Lupus’ | 1 | N/A | Nordsaat Saatzucht GmbH | – | – | – | – | – | – | – | |
* – indicates amplification/sequencing failed due to low quality of DNA.
Thirty-microlitre PCR reactions were set up using 3 µL DNA template, 6 µL 5× Phusion™ HF Buffer (New England Biolabs, Inc., Ipswich, MA, USA), 0·6 µL forward primer (10 mm), 0·6 µL reverse primer (10 mm), 0·6 µL dNTPs (Metabion International AG, Martinsried, Germany) (10 mm), 18·96 µL ddH2O and 0·24 µL Phusion™ Hot Start High-Fidelity DNA Polymerase (New England Biolabs, Inc.). The microsatellite lengths required the application of a polymerase with proofreading ability to avoid potential genotyping errors caused by replication slippage. The PCR programme settings were 98 °C for 5 min, 35 cycles of 98 °C for 1 min, 60 °C for 1 min and 72 °C for 1 min, and finally 72 °C for 10 min. Three microlitres of each PCR product was checked for amplification using 2·5 % MetaPhor® Agarose (Lonza, Rockland, ME, USA) gels. Amplified PCR products were sequenced once using forward primers. Sequencing was outsourced to LGC Genomics (Berlin, Germany) or GATC Biotech AG (Konstanz, Germany).
Sequences from each of the different loci were first aligned in MEGA 3·1 (Kumar et al., 2004). To avoid an overestimation of evolutionary events, indels and gaps were replaced by nucleotides that did not appear at that specific position in the other individuals. Missing data were included by coding each absent nucleotide with a question mark. Sequences from the different primer sets were combined in MEGA 3·1 (Kumar et al., 2004). Haplotypes of the data set were distinguished using the software Arlequin 3·11 (Excoffier et al., 2005) and manually corrected to prevent an overestimation of haplotype number due to missing information. The resulting haplotype sequences were used as an input file for phylogenetic analysis using Bayesian inference with the software MrBayes {settings: nst = 6 and rates = invgamma [= GTR + G + I-model (General Time Reversible model + Gamma-distributed rate)]; ngen (generations) = 1000 000; samplefreq (samplefrequency) = 100; burnin = 1000} (Huelsenbeck and Ronquist, 2001; Ronquist and Huelsenbeck, 2003). Maximum-parsimony bootstrapping, as implemented in PAUP* 4·0 (Swofford, 2002), was also used to test the support of clades; it included 1000 replicates of random addition sequence, TBR branch swapping, and rearrangements limited to 1000 000. The Bayesian tree was modified in FigTree v1·2.1 (Rambaut, 2007; http://tree.bio.ed.ac.uk/) for figure production and bootstrap percentages added to the tree (following Hodkinson et al., 2010).
For a locus-by-locus AMOVA, 38 L. perenne populations were included and divided into four groups: (1) L. perenne – Irish ecotypes, (2) L. perenne – European ecotypes, (3) L. perenne – cultivars and (4) Lolium species. The analysis was performed in Arlequin 3·11 (Excoffier et al., 2005) for all groups and then reduced in a stepwise manner (Table 4). The input-files had the following header: NbSamples = x [x= the amount of samples (= populations) used], DataType = DNA, GenotypicData = 0 (= haploid data), GameticPhase = 1 (= known), LocusSeparator = NONE (= each nucleotide will be counted as locus), RecessiveData = 0 (= co-dominant data), MissingData = ‘?’. For the analysis, the value for the allowed missing data was set to 0·26 to include all data.
Table 4.
Results of the locus-by-locus AMOVA
| Group composition† |
% Variation |
P |
Polymorphic loci | ||||||||||
|---|---|---|---|---|---|---|---|---|---|---|---|---|---|
| Populations | Groups | Among groups (Va) | Among populations/within groups (Vb) | Within populations (Vc) | FST‡ | FSC‡ | FCT‡ | Vc and FST | Vb and FSC | Va and FCT | |||
| 1–3 | Lolium perenne | 38 | 3 | –2·13 | 28·65 | 73·48 | 0·27 | 0·28 | –0·02 | *** | *** | n.s. | 21 |
| 1 + 2 | Lolium perenne (Irish + European ecotypes) | 29 | 2 | –1·46 | 25·14 | 76·32 | 0·24 | 0·25 | –0·01 | *** | *** | n.s. | 19 |
| 1 + 3 | Lolium perenne (Irish ecotypes + cultivars) | 24 | 2 | –1·16 | 17·34 | 83·82 | 0·16 | 0·17 | –0·01 | *** | *** | n.s. | 18 |
| 2 + 3 | Lolium perenne (European ecotypes + cultivars) | 23 | 2 | –5·93 | 54·52 | 51·41 | 0·49 | 0·51 | –0·06 | *** | *** | n.s. | 16 |
| 3 | Lolium perenne (cultivars) | 9 | 1 | 49·86 | 50·14 | 0·50 | *** | 6 | |||||
| 2 | Lolium perenne (European ecotypes) | 14 | 1 | 49·59 | 50·41 | 0·50 | *** | 15 | |||||
| 1 | Lolium perenne (Irish ecotypes) | 15 | 1 | 10·11 | 89·89 | 0·10 | *** | 16 | |||||
† 1 = Lolium perenne (Irish ecotypes), 2 = Lolium perenne (European ecotypes), 3 = Lolium perenne cultivars.
‡ Fixation indices: FST = among groups, FSC = among populations/within groups, FCT = within populations.
*** Highly significant (P < 0·001), n.s. = not significant (P > 0·05).
RESULTS
Characterization of Poaceae chloroplast microsatellites
The chloroplast genomes of 14 different grass species were searched for microsatellite regions. Although this search was limited to mononucleotide repeats with at least seven nucleotides, the number found per species was high, ranging from 241 (Dendrocalamus latiflorus) to 282 (Brachypodium distachyon) microsatellites per genome. The number of microsatellites found in the subfamilies Pooideae and Panicoideae was clearly higher than that found in Ehrhartoideae and Bambusoideae (Fig. 1). The number of microsatellites decreases with an increase of the repeat size in all genomes analysed. Thus, the highest number of microsatellites was found for repeats of seven and the lowest for repeats of more than 11 nucleotides (Fig. 1).
Fig. 1.

Number of microsatellites (more than seven nucleotides) in complete Poaceae chloroplast genomes. x = repeat length (7 to 11). GenBank accession numbers: Agrostis stolonifera (EF115543), Bambusa oldhamii (FJ970915), Brachypodium distachyon (EU325680), Dendrocalamus latiflorus (FJ970916), Festuca arundinacea (FJ466687), Hordeum vulgare (EF115541), Lolium perenne (AM777385), Oryza nivara (AP006728), Oryza sativa ‘japonica group’ (X15901), Saccharum officinarum (AP006714), Sorghum bicolor (EF115542), Triticum aestivum (AB042240), Zea mays (X86563).
Chloroplast microsatellites in Pooideae are mainly based on the nucleotide A, while for the other subfamilies they are relatively equally based on nucleotides A and T. Although the number of published chloroplast genome sequences for Bambusoideae is limited (to only two), it seems that in this subfamily the number of microsatellites based on the nucleotide C is higher than in the other species (Fig. 2).
Fig. 2.

Nucleotide usage of chloroplast microsatellites (more than seven nucleotides) in Poaceae species. GenBank accession numbers: Agrostis stolonifera (EF115543), Bambusa oldhamii (FJ970915), Brachypodium distachyon (EU325680), Dendrocalamus latiflorus (FJ970916), Festuca arundinacea (FJ466687), Hordeum vulgare (EF115541), Lolium perenne (AM777385), Oryza nivara (AP006728), Oryza sativa ‘japonica group’ (X15901), Saccharum officinarum (AP006714), Sorghum bicolor (EF115542), Triticum aestivum (AB042240), Zea mays (X86563).
In the chloroplast genome of L. perenne, 78 (33·05 %) of the microsatellites were located within genes and 158 (66·94 %) within intergenic spacers and introns (data not shown). The microsatellites were, in general, distributed over the entire genome; however, repeats with nine and more nucleotides were clearly less abundant in the inverted repeat region (Fig. 3). Furthermore, it can be seen that repeats based on ten and more nucleotides mainly cluster in four regions of the large single copy region: matK–rpoB, psaA–trnV UAC, infA–trnH GUG, and in the intergenic spacer region between psbE and petL.
Fig. 3.

Distribution of microsatellites (more than nine nucleotides) in the chloroplast genome of L. perenne. The two inverted repeat regions are identical to each other. Thus, microsatellites are only highlighted in one of the two copies.
Chloroplast microsatellite analysis
The nine newly designed primer sets detected cpSSR polymorphisms to different extents. However, all markers distinguished between L. perenne and non-Lolium taxa. Table 5 gives an overview of marker performance within and among Lolium species. The three most informative markers were TeaCpSSR27, TeaCpSSR28 and TeaCpSSR31. TeaCpSSR28 was able to distinguish between all tested Lolium species and L. multiflorum. The difference between L. multiflorum and the other Lolium species was based on an elongation of the A8 mononucleotide repeat by one nucleotide in L. multiflorum. This was detected via sequencing. TeaCpSSR31 combines a high degree of cpSSR length variation with a considerably high number of SNPs. SNPs detected by this marker happened to be in the same individuals where SNPs had been observed before by TeaCpSSR30 and TeaCpSSR33. Basic agarose gel electrophoresis of amplification products of marker TeaCpSSR27 revealed variation within some L. perenne accessions (Fig. 4) and further sequencing showed that this was due to an indel of 44 nucleotides. All the haplotypes for which SNPs had been observed in the products of TeaCpSSR30, TeaCpSSR31 and TeaCpSSR33 also showed this deletion in the sequencing results.
Table 5.
Ability of newly designed Poaceae universal primers to detect variation within the chloroplast genome of Lolium perenne and other Lolium species (L. hybridum, L. multiflorum, L. persicum, L. remotum, L. subulatum, L. temulentum)
| Primer | Lolium spp. | Lolium perenne | Form of variation |
||
|---|---|---|---|---|---|
| cpSSR | SNP | Indel | |||
| TeaCpSSR27 | ✓ | ✓ | – | – | ✓ |
| TeaCpSSR28 | ✓ | – | ✓ | – | – |
| TeaCpSSR29 | – | – | – | – | – |
| TeaCpSSR30 | ✓ | ✓ | – | ✓ | – |
| TeaCpSSR31 | ✓ | ✓ | ✓ | ✓ | – |
| TeaCpSSR32 | ✓ | – | – | ✓ | – |
| TeaCpSSR33 | ✓ | ✓ | ✓ | ✓ | – |
| TeaCpSSR34 | ✓ | ✓ | ✓ | – | – |
| TeaCpSSR35 | ✓ | ✓ | ✓ | – | – |
Fig. 4.
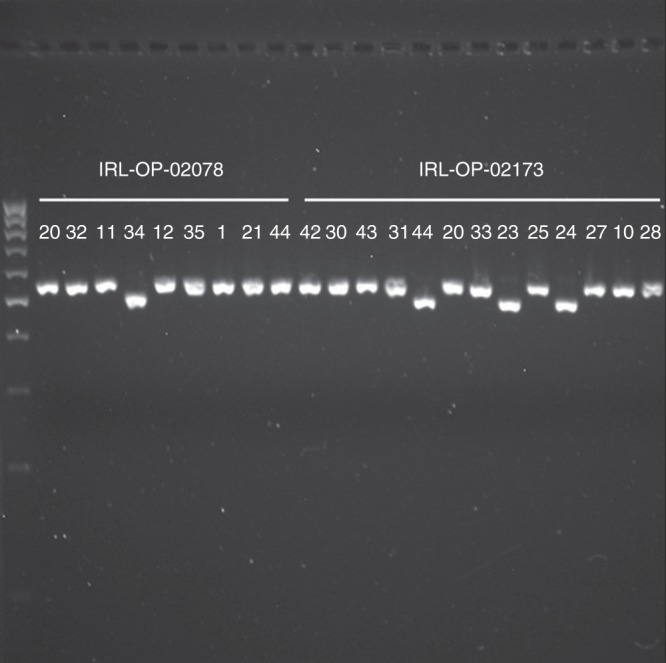
TeaCpSSR27 PCR products (5 µL per sample) from different individuals of two Lolium perenne accessions. Shorter amplicon products are due to the lack of one copy of a 44-bp repeat. A 2·0 % MetaPhor® Agarose gel (Lonza, Rockland, ME, USA) stained with 1 % ethidium bromide (10 mg mL−1). Size standard: mi-100 bp+ DNA Marker Go (Metabion International AG, Martinsried, Germany), run for approx. 3 h at 80 V.
Phylogenetic and haplotype analysis
Thirty-three haplotypes were detected with up to five haplotypes within a single accession. Few private haplotypes (unique to an accession) were detected. Haplotypes 1 and 2 were the most frequent, of which at least one was found in each L. perenne accession. Most of the non-L. perenne species showed high variation with up to four haplotypes per accession, although the sample sizes were small.
The haplotype DNA sequences as well as one sequence of Avena sativa, Triticum aestivum, Secale cereale and Hordeum vulgare were used in an input file for phylogenetic Bayesian inference and parsimony analyses. In both analyses (Fig. 5), Agrostis stolonifera and Avena sativa (tribe Aveneae) were sister to the remaining species (but were not themselves monophyletic) and hence were used as an outgroup to all other species analysed, following Grass Phylogeny Working Group (2001) and Grass Phylogeny Working Group II (2012).
Fig. 5.

Bayesian inference tree using DNA sequences from haplotypes. Haplotype names are replaced by the names of the accessions in which they were found. Posterior probability values were obtained in MrBayes and bootstrap values in PAUP* 4·0.
High posterior probability and bootstrap values were obtained for Bromus erectus as sister to the Triticeae species (Hordeum vulgare, Secale cereale, Triticum aestivum), S. cereale as sister to T. aestivum, and Poa pratensis as sister to all Festuca and Lolium species as well as to Cynosurus cristatus. High posterior probability values were only obtained for Festuca ovina as sister to a group of Festuca rubra and most Festuca vivipara individuals (but note F. vivipara was not monophyletic) and for all Festucas (except Festuca pratensis) being sister to the Lolium species (Fig. 5). F. pratensis ‘Northland’ was grouped within the L. multiflorum accessions. The haplotypes of ecotype accessions PI267059, IRL-OP-02173, IRL-OP-02078 and IRL-OP-02269, for which variation had already been observed by gel electrophoresis, grouped mainly with the other Lolium species.
Locus-by-locus AMOVA
Each accession had missing data for some of the analysed regions due to a lack of amplification or sequencing problems. A locus-by-locus AMOVA, as recommended by Excoffier et al. (2005), was used to test the assigned genetic structure across all nine regions. The number of polymorphic loci decreased from 21 (all four groups) to 16 (only the European L. perenne ecotypes and L. perenne cultivars) (data not shown). No differentiation was found among the different groups, but considerable variation was found within the populations (more than 50 %). The highest variation (83·32 %) was found within populations in the AMOVA of Irish L. perenne ecotypes and L. perenne cultivars. The fixation index, FST, was relatively small at 0·27 for L. perenne populations compared with European populations (FST = 0·49). All the comparisons were highly significant (P = 99·9 %). The AMOVA between the different L. perenne accessions revealed high partitioning of variation within populations of groups 1 and 2 at 76·32 % compared with an among-population variance of 25·14 %. For populations of groups 1 and 3, the within- and among-population variance values were 83·32 and 17·34 % respectively.
DISCUSSION
Characterization of Poaceae chloroplast microsatellites
Fourteen Poaceae chloroplast genomes were searched for mononucleotide repeat regions of more than 7 bp in length. All genomes contained more than 200 cpSSRs. However, the total number of cpSSRs varies between species, as found in comparisons made by Powell et al. (1995b). Furthermore, the results show that the number of microsatellites in the different grass subfamilies is not random. Pooideae and Panicoideae have a significantly (P = 99·99 %) higher number of cpSSRs than Ehrhartoideae and Bambusoideae. Ehrhartoideae was represented by rice (Oryza) only and Bambusoideae included two closely related bamboo taxa (Sungkaew et al., 2009). Therefore, it will be interesting to determine if this pattern holds when a more diverse range of ehrhartoids and bambusoids are included, such as taxa from the temperate bamboo tribe Arundinarieae (Hodkinson et al., 2010).
Many research groups have found a strong bias of nucleotides A and T for mononucleotide repeats (Powell et al., 1995b; Flannery et al., 2006; Rajendrakumar et al., 2006). Our analysis showed that nucleotides A and T are also favoured across all species but the nucleotide usage seems to be subfamily-specific. Pooideae favours A and Ehrhartoideae favours T (Fig. 2). This observation is, to our knowledge, the first of its kind. However, more Poaceae chloroplast genomes, especially for the subfamilies Ehrhartoideae and Bambusoideae, need to be sequenced to confirm this result. As previously observed in other species (Powell et al., 1995b; Rajendrakumar et al., 2006), the majority (67 %) of microsatellites were located in the intergenic spacer regions. Most of the cpSSRs were located in the large single copy (LSC) region, as found by Powell et al. (1995b). It is likely that long microsatellites evolve due to slipped-strand mispairing (Kelchner, 2000). The accumulation of microsatellites in the LSC is thus not surprising because a mutation correction mechanism exists in the inverted repeat (IR) region that keeps both IRs potentially identical, and thus the nucleotide substitution is much lower (Wolfe et al., 1987).
Chloroplast microsatellite analysis
Our nine newly designed cpSSR primer sets were able to detect polymorphisms across all species tested but only six sets (TeaCpSSR27, TeaCpSSR30, TeaCpSSR31, TeaCpSSR33, TeaCpSSR34, TeaCpSSR35) were able to detect variation at an intraspecific level. This is not surprising given that one objective of this analysis was to design primers that preferably amplify across a wide range of Poaceae species and thus some amount of conservation was required (Taberlet et al., 1991; Dumolin-Lapegue et al., 1997; Provan et al., 2001). However, most primers produced amplicon lengths of 380 bp or more and thus the lack of variation in some loci might be due to the location of the microsatellite rather than to the location of the primers. Very little intraspecific variation was found for marker TeaCpSSR29, which is located within the ndhK gene, TeaCpSSR32 from the infA gene and TeaCpSSR28 from the intergenic spacer rps14-psaB. This low variation in microsatellites in coding regions is expected because variation in the form of one- to two-nucleotide indels would lead to frameshifts and thus to non-functionality of the respective gene (Metzgar et al., 2000). Marker TeaCpSSR28 is based on an interrupted microsatellite and such interruption seems to have a stabilizing effect (Rolfsmeier et al., 2000).
Although primers TeaCpSSR28, TeaCpSSR29 and TeaCpSSR32 were unable to detect intraspecific variation, they were able to detect interspecific variation and will be useful in future studies at that level. TeaCpSSR28 is particularly promising due to its ability to differentiate L. multiflorum from other Lolium species. This ability could be important for seed testing agencies for testing the purity of seed lots. The polymorphism is based on a mononucleotide repeat and can be easily adopted for high-throughput genotyping applications. L. perenne is widely used as turf grass in Europe and the United States (Floyd and Barker, 2002). Contamination of seed lots with L. multiflorum, which has a brighter foliage colour, broader leaves and less tillering, is unwanted. Other markers have been developed for this purpose. For example, Warnke et al. (2002) showed that the locus of the enzyme superoxide dismutase (Sod-1) can be used for distinguishing L. perenne from L. multiflorum. Warnke et al. (2004) showed that the seedling root fluorescence locus (Pgi-2) and the 8-h flowering characteristics on chromosome 1 (morphological marker that indicates photoperiod insensitivity after vernalization) can also distinguish L. multiflorum from L. perenne and may be of wider value for species identification. Our TeaCpSSR28 marker is a valuable addition to these markers, especially because of its ease of application.
Overall, the most informative marker was TeaCpSSR31 because it revealed nearly as much haplotype information as that detectable by using a combination of the other primers. This marker is located in the psbE-petL intergenic region. The psbE-petL region has not previously been characterized in Lolium. Marker TeaCpSSR27 is also a new marker of considerable value. This marker is not variable at the microsatellite region but revealed variation at a 44-bp-long repeat that showed one and two copies, respectively, in four different accessions [IRL-OP-02078 (2× one copy/9× two copies), IRL-OP-02173 (3/12), IRL-OP-02269 (1/4) and PI267059 (1/7)]. This variation was already detectable via agarose gel electrophoresis and thus this primer set is of particular value because the sequencing step for the detection of variation can be omitted. Sequence information obtained for the chloroplast genome of different species and their individuals (when polymorphisms were observed) using the new markers was submitted to GenBank (Table 5) and is publicly available.
Phylogenetic and haplotype analysis
Thirty-three different haplotypes were detected in this study and analysed using Bayesian inference and parsimony approaches. Bromus erectus, the Triticeae cereals, Poa pratensis and Cynosurus cristatus were resolved as outlying the majority of Festuca and Lolium accessions. This tree showed high resolution and consistency with current taxonomy despite the fact that most of the variation between the different haplotypes is based on microsatellites and thus potentially influenced by size homoplasy (Hale et al., 2004; Flannery et al., 2006). There was also evidence that the inbreeding groups including L. persicum, L. remotum, L. subulatum and L. temulentum (Kubik et al., 1999; Balfourier et al., 2000) and outbreeding groups of Lolium species could be distinguished from each other. The grouping of inbreeding L. subulatum was an exception to this pattern because the majority of its individuals were positioned close to the outbreeding Lolium species. Unfortunately, six out of the seven L. subulatum individuals showed haplotypes that were not clearly distinguishable from each other, probably due to a large amount of missing data in that species.
The positions obtained for L. hybridum accessions are of note. L. hybridum is an interspecific highly fertile hybrid between L. perenne and L. multiflorum that occurs naturally very frequently. In this study, L. hybridum individuals are grouped either within or as sister to L. perenne, while the L. multiflorum individuals are grouped as sister to L. perenne. This reveals L. perenne as maternal genome donor of L. hybridum and L. multiflorum as paternal genome donor in all these analysed accessions.
Lolium perenne individuals that lacked one copy of the repeat of the TeaCpSSR27 marker had a haplotype very similar to the inbreeding Lolium species (Fig. 5). Although interspecific hybrids between the different outbreeding Lolium species are possible as mentioned above, interspecific hybrids between in- and outbreeding Lolium species are normally very rare due to post-zygotic hybridization barriers (Matzk et al., 1980). Embryo rescue techniques have to be carried out to obtain viable plants after reciprocal crosses between L. temulentum and L. perenne (Yamada, 2001). Thus, the results obtained with TeaCpSSR27 are surprising because they clearly indicate that some natural hybridization occurred between the two groups. We are investigating this possibility further.
The grouping of F. pratensis within the Lolium accessions is also of note. F. pratensis did not group with the other Festuca species. Festuca species can be grouped into two major categories – fine-leaved and broad-leaved (Torrecilla and Catalán, 2002). In phylogenetic analyses, the genus Lolium is found within the broad-leaved Festuca group (Torrecilla and Catalán, 2002; Catalán et al., 2004). F. pratensis and F. arundinacea belong to the broad-leaved category while F. ovina, F. rubra and F. vivipara belong to the fine-leaved category. This is in accordance with the extensive Lolium diversity study of McGrath et al. (2007) that grouped F. pratensis closer to the Lolium species than Festuca species and where the fine-leaved Festuca species were resolved as an outlying group. Darbyshire (1993) suggested the re-circumscription of Festuca. He considered the fine-leaved fescues to be true fescues and transferred F. pratensis and F. arundinacea to the genus Lolium (Lolium pratense and L. arundinacea).
Locus-by-locus AMOVA
The different L. perenne accessions were analysed as four different groups for the locus-by-locus AMOVA (Table 4). The combined Lolium collection showed a low fixation index of 0·27 and a high proportion of within-population variation (73·48 %). When Lolium was split in groups of two (Table 4), the highest among-group variation (76–84 %) was detected for the two groups that contained the Irish ecotype accessions. In contrast, the proportion of within-population variation for the group of European ecotypes and cultivars was only approx. 50 %. A fixation index of 0·10 and a within-population variation of approx. 90 % was found for the Irish ecotypes when the three different L. perenne groups were analysed separately from each other in additional AMOVAs. This observation is in agreement with other studies using nuclear markers on L. perenne and other outbreeding grass species. Fjellheim and Rognli (2005) analysed the genetic diversity of 13 F. pratensis cultivars from Denmark, Iceland, Norway and Sweden via amplified fragment length polymorphism markers. Cultivars were selected to represent old and new varieties from each country. The within-cultivar variation was around 80 %. Furthermore, their study showed that the level of genetic diversity was as large in new cultivars as in old ones. No decrease in genetic diversity was recorded in breeding populations of F. pratensis. Guthridge et al. (2001) analysed genetic diversity in L. perenne using two different sets of plant material. The first set, consisting of four cultivars with different breeding background in relation to their genetic base and number of parents, showed within-population variation of 89 %. The second set, based on three cultivars derived from a low number of parents, showed within-population variation of 79 %.
Surprisingly, the amount of variation found within the cultivars and European ecotypes used in this study was small compared with the results achieved by other research groups. This observation was also shown by McGrath et al. (2006, 2007) who used chloroplast microsatellite markers to assess the genetic diversity of L. perenne ecotypes and cultivars. They recorded levels of 82 and 18 % for the partitioning of variation within and among Irish populations, respectively. This compared with 61 and 39 % variation within and among European populations, respectively (McGrath et al., 2006, 2007). Although the percentages differ from the results obtained in this study, which might be due to different sample size (and different marker systems), the trend is the same. This result is not surprising as Ireland is an island and thus the possibility of pollen- and seed-mediated gene flow is limited in comparison with the larger European continent. The distance between populations is, in general, shorter and hence differentiation of populations is lower.
Only six polymorphic loci were found within the L. perenne cultivars, while there were 15 within the European ecotypes and more than 16 within the Irish ecotypes. Despite the low genetic variation among Irish ecotypes, this result highlights the value of the Irish ecotype collection for future breeding programmes.
Conclusions
The main objectives of this study were to find new Poaceae chloroplast DNA markers using information about the location of variable regions previously detected in the completely sequenced L. perenne chloroplast genome and to characterize a diverse collection using these markers. Thus, nine new primer sets were designed, all of which successfully amplified polymorphic regions either in or outside (as indels or SNPs) the target SSRs. The most informative marker was TeaCpSSR31 (psbE-petL), because it alone detected nearly all the variation otherwise found only with a combination of primers. TeaCpSSR27 was also of high value as it enabled the distinction of haplotypes solely via agarose gel electrophoresis without the need for sequencing or more accurate sizing methods. TeaCpSSR28 was also found to be particularly informative because it could detect L. multiflorum within other Lolium species. This marker, although based on a microsatellite region, might prove useful in barcoding approaches especially when commonly used universal barcoding markers (CBOL Plant Working Group, 2009), such as matK and rbcL, are unable to detect variation among species. The new markers were tested on a small set of different Lolium and Festuca accessions and were able to detect diversity within these accessions. Although the breeding history of L. perenne is rather young (approx. 90 years, Wilkins, 1991), this study shows that existing cultivars derive from a narrow genetic pool. In total, 15–16 polymorphic loci were found within the ecotype accessions, but only six were found within the cultivars. It is recommended that diversity is increased or at least monitored within breeding material. Markers TeaCpSSR27 and TeaCpSSR31 will prove particularly useful for managing this process.
ACKNOWLEDGEMENTS
We thank Choun-Sea Lin who released the two bamboo sequences to us prior to their publication. We thank Sarah McGrath for sharing DNA from L. perenne populations. This work was part of the PhD thesis of the first author (K.D.) and was supported by the Teagasc ‘Vision’ programme. K.D. was financed under the Teagasc Walsh Fellowship Scheme. Partial funding of this work was obtained from the Irish Department of Agriculture, Food and the Marine (DAFM) under the ‘Genetic Resources Fund for Food and Agriculture’.
LITERATURE CITED
- Akkak A, Boccacci P, Botta R. ‘Cardinal’ grape parentage: a case of a breeding mistake. Genome. 2007;50:325–328. doi: 10.1139/g06-145. [DOI] [PubMed] [Google Scholar]
- Atienza SG, Martín AC, Ramírez MC, Martín A, Ballesteros J. Effects of Hordeum chilense cytoplasm on agronomic traits in common wheat. Plant Breeding. 2007;126:5–8. [Google Scholar]
- Balfourier F, Imbert C, Charmet G. Evidence for phylogeographic structure in Lolium species related to the spread of agriculture in Europe. A cpDNA study. Theoretical and Applied Genetics. 2000;101:131–138. [Google Scholar]
- Bastia T, Scotti N, Cardi T. Organelle DNA analysis of Solanum and Brassica somatic hybrids by PCR with ‘universal primers. Theoretical and Applied Genetics. 2001;102:1265–1272. [Google Scholar]
- Bryan GJ, De Jong W, Provan J, et al. Potato genomics: a general strategy for the molecular genetic characterization of Solanum germplasm. 1999a Scottish Crops Research Institute Annual Report, 1998/99. http://www.scri.ac.uk/publications/1998/99annualreport. (accessed 18 December 2009) [Google Scholar]
- Bryan GJ, McNicoll J, Ramsay G, Meyer RC, De Jong WS. Polymorphic simple sequence repeat markers in chloroplast genomes of Solanaceous plants. Theoretical and Applied Genetics. 1999b;99:859–867. [Google Scholar]
- Catalán P, Torrecilla P, López Rodríguez JA, Olmstead RG. Phylogeny of the festucoid grasses of subtribe Loliinae and allies (Poeae, Pooideae) inferred from ITS and trnL-F sequences. Molecular Phylogenetics and Evolution. 2004;31:517–541. doi: 10.1016/j.ympev.2003.08.025. [DOI] [PubMed] [Google Scholar]
- CBOL Plant Working Group. A DNA barcode for land plants. Proceedings of the National Academy of Science USA. 2009;106:12794–12797. doi: 10.1073/pnas.0905845106. [DOI] [PMC free article] [PubMed] [Google Scholar]
- Connolly V. Collection and conservation of forage species from old pasture ecosystems. Irish Journal of Agricultural and Food Research. 2000;39:476. [Google Scholar]
- Corriveau JL, Coleman AW. Rapid screening method to detect potential biparental inheritance of plastid DNA and results for over 200 angiosperm species. American Journal of Botany. 1988;75:1443–1458. [Google Scholar]
- Darbyshire SJ. Realignment of Festuca subgenus schedonorus with the genus Lolium (Poaceae) Novon. 1993;3:239–243. [Google Scholar]
- Diekmann K, Hodkinson TR, Fricke E, Barth S. An optimized chloroplast DNA extraction protocol for grasses (Poaceae) proves suitable for whole plastid genome sequencing and SNP detection. PLoS ONE. 2008;3:e2813. doi: 10.1371/journal.pone.0002813. http://dx.doi.org/10.1371/journal.pone.0002813 . [DOI] [PMC free article] [PubMed] [Google Scholar]
- Diekmann K, Hodkinson TR, Wolfe KH, van den Bekerom R, Dix PJ, Barth S. Complete chloroplast genome sequence of a major allogamous forage species, perennial ryegrass (Lolium perenne L.) DNA Research. 2009;16:165–176. doi: 10.1093/dnares/dsp008. [DOI] [PMC free article] [PubMed] [Google Scholar]
- Dumolin-Lapegue S, Pemonge MH, Petit RJ. An enlarged set of consensus primers for the study of organelle DNA in plants. Molecular Ecology. 1997;6:393–397. doi: 10.1046/j.1365-294x.1997.00193.x. [DOI] [PubMed] [Google Scholar]
- Ellegren H. Microsatellites: simple sequences with complex evolution. Nature Reviews Genetics. 2004;5:435–445. doi: 10.1038/nrg1348. [DOI] [PubMed] [Google Scholar]
- Excoffier L, Laval G, Schneider S. Arlequin ver. 3·0: an integrated software package for population genetics data analysis. Evolutionary Bioinformatics Online. 2005;1:47–50. [PMC free article] [PubMed] [Google Scholar]
- Fjellheim S, Rognli OA. Molecular diversity of local Norwegian meadow fescue (Festuca pratensis Huds.) populations and Nordic cultivars – consequences for management and utilisation. Theoretical and Applied Genetics. 2005;111:640–650. doi: 10.1007/s00122-005-2006-8. [DOI] [PubMed] [Google Scholar]
- Fjellheim S, Rognli OA, Fosnes K, Brochmann C. Phylogeographical history of the widespread meadow fescue (Festuca pratensis Huds.) inferred from chloroplast DNA sequences. Journal of Biogeography. 2006;33:1470–1478. [Google Scholar]
- Flannery ML, Mitchell FJ, Coyne S, et al. Plastid genome characterisation in Brassica and Brassicaceae using a new set of nine SSRs. Theoretical and Applied Genetics. 2006;113:1221–1231. doi: 10.1007/s00122-006-0377-0. [DOI] [PubMed] [Google Scholar]
- Floyd DJ, Barker RE. Change of ryegrass seedling root fluorescence expression during three generations of seed increase. Crop Science. 2002;42:905–911. [Google Scholar]
- Grass Phylogeny Working Group. Phylogeny and subfamilial classification of the grasses (Poaceae) Annals of the Missouri Botanical Garden. 2001;88:373–457. [Google Scholar]
- Grass Phylogeny Working Group II. New grass phylogeny resolves deep evolutionary relationships and discovers C4 origins. New Phytologist. 2012;193:304–312. doi: 10.1111/j.1469-8137.2011.03972.x. [DOI] [PubMed] [Google Scholar]
- Grau Nersting L, Bode Andersen S, von Bothmer R, Gullord M, Bagger Jørgensen R. Morphological and molecular diversity of Nordic oat through one hundred years of breeding. Euphytica. 2006;150:327–337. [Google Scholar]
- Guthridge KM, Dupal MP, Kölliker R, Jones ES, Smith KF, Forster JW. AFLP analysis of genetic diversity within and between populations of perennial ryegrass (Lolium perenne L.) Euphytica. 2001;122:191–201. [Google Scholar]
- Hale ML, Borland AM, Gustafsson MH, Wolff K. Causes of size homoplasy among chloroplast microsatellites in closely related Clusia species. Journal of Molecular Evolution. 2004;58:182–190. doi: 10.1007/s00239-003-2540-4. [DOI] [PubMed] [Google Scholar]
- Hodkinson TR, Chase MW, Lledó MD, Salamin N, Renvoize SA. Phylogenetics of Miscanthus, Saccharum and related genera (Saccharinae, Andropogoneae, Poaceae) based on DNA sequences from ITS nuclear ribosomal DNA and plastid trnL intron and trnL-F intergenic spacers. Journal of Plant Research. 2002;115:381–392. doi: 10.1007/s10265-002-0049-3. [DOI] [PubMed] [Google Scholar]
- Hodkinson TR, Ní Chonghaile G, Sungkaew S, Chase MW, Salamin N, Stapleton CMA. Phylogenetic analyses of plastid and nuclear DNA sequences indicate a rapid late Miocene radiation of the temperate bamboo tribe Arundinarieae (Poaceae, Bambusoideae) Plant Ecology and Diversity. 2010;3:109–120. [Google Scholar]
- Huelsenbeck JP, Ronquist F. MRBAYES: Bayesian inference of phylogenetic trees. Bioinformatics. 2001;17:754–755. doi: 10.1093/bioinformatics/17.8.754. [DOI] [PubMed] [Google Scholar]
- Kelchner SA. The evolution of non-coding chloroplast DNA and its application in plant systematics. Annals of the Missouri Botanical Garden. 2000;87:482–498. [Google Scholar]
- Kubik C, Meyer WA, Gaut BS. Assessing the abundance and polymorphism of simple sequence repeats in perennial ryegrass. Crop Science. 1999;39:1136–1141. [Google Scholar]
- Kumar S, Tamura K, Nei M. MEGA3: integrated software for molecular evolutionary genetics analysis and sequence alignment. Briefings in Bioinformatics. 2004;5:150–163. doi: 10.1093/bib/5.2.150. [DOI] [PubMed] [Google Scholar]
- Matzk F, Gröber K, Zacharias M. Ergebnisse von Art- und Gattungskreuzungen mit Gramineen im Zusammenhang mit den natürlichen Isolationsmechanismen zwischen den Arten. Kulturpflanze. 1980;XXVIII:257–284. [Google Scholar]
- McGrath S, Hodkinson TR, Salamin N, Barth S. Development and testing of novel chloroplast microsatellite markers for Lolium perenne and other grasses (Poaceae) from de novo sequencing and in silico sequences. Molecular Ecology Notes. 2006;6:449–452. [Google Scholar]
- McGrath S, Hodkinson TR, Barth S. Extremely high cytoplasmic diversity in natural and breeding populations of Lolium (Poaceae) Heredity. 2007;99:531–544. doi: 10.1038/sj.hdy.6801030. [DOI] [PubMed] [Google Scholar]
- Metzgar D, Bytof J, Wills C. Selection against frameshift mutations limits microsatellite expansion in coding DNA. Genome Research. 2000;10:72–80. [PMC free article] [PubMed] [Google Scholar]
- Olmstead RG, Palmer JD. Chloroplast DNA systematics: a review of methods and data analysis. American Journal of Botany. 1994;81:1205–1224. [Google Scholar]
- Powell W, Morgante M, McDevitt R, Vendramin GG, Rafalski JA. Polymorphic simple sequence repeat regions in chloroplast genomes: applications to the population genetics of pines. Proceedings of the National Academy of Science USA. 1995a;92:7759–7763. doi: 10.1073/pnas.92.17.7759. [DOI] [PMC free article] [PubMed] [Google Scholar]
- Powell W, Morgante M, Andre C, et al. Hypervariable microsatellites provide a general source of polymorphic DNA markers for the chloroplast genome. Current Biology. 1995b;5:1023–1029. doi: 10.1016/s0960-9822(95)00206-5. [DOI] [PubMed] [Google Scholar]
- Provan J, Powell W, Hollingsworth PM. Chloroplast microsatellites: new tools for studies in plant ecology and evolution. Trends in Ecology and Evolution. 2001;16:142–147. doi: 10.1016/s0169-5347(00)02097-8. [DOI] [PubMed] [Google Scholar]
- Rajendrakumar P, Biswal AK, Balachandran SM, Srinivasarao K, Sundaram RM. Simple sequence repeats in organellar genomes of rice: frequency and distribution in genic and intergenic regions. Bioinformatics. 2006;23:1–4. doi: 10.1093/bioinformatics/btl547. [DOI] [PubMed] [Google Scholar]
- Rambaut A. FigTree, a graphical viewer of phylogenetic trees. 2007. http://tree.bio.ed.ac.uk/software/figtree/ (accessed 2 October 2011) [Google Scholar]
- Rolfsmeier ML, Dixon MJ, Lahue RS. Mismatch repair blocks expansions of interrupted trinucleotide repeats in yeast. Molecular Cell. 2000;6:1501–1507. doi: 10.1016/s1097-2765(00)00146-5. [DOI] [PubMed] [Google Scholar]
- Ronquist F, Huelsenbeck JP. MrBayes 3: Bayesian phylogenetic inference under mixed models. Bioinformatics. 2003;19:1572–1574. doi: 10.1093/bioinformatics/btg180. [DOI] [PubMed] [Google Scholar]
- Ryan E, Mullins E, Burke J, Downes M, Meade C. Tracing field hybridization in ryegrass species using microsatellite and morphological markers. Environmental Biosafety Research. 2006;5:111–117. doi: 10.1051/ebr:2007001. [DOI] [PubMed] [Google Scholar]
- Sungkaew S, Stapleton CMA, Salamin N, Hodkinson TR. Non-monophyly of the woody bamboos (Bambuseae; Poaceae): a multi-gene region phylogenetic analysis of Bambusoideae s.s. Journal of Plant Research. 2009;122:95–108. doi: 10.1007/s10265-008-0192-6. [DOI] [PubMed] [Google Scholar]
- Swofford DL. PAUP*. Phylogenetic analysis using parsimony (*and other methods) Sunderland, MA: Sinauer Associates; 2002. Version 4. [Google Scholar]
- Taberlet P, Gielly L, Pautou G, Bouvet J. Universal primers for amplification of three non-coding regions of chloroplast DNA. Plant Molecular Biology. 1991;17:1105–1109. doi: 10.1007/BF00037152. [DOI] [PubMed] [Google Scholar]
- Torrecilla P, Catalán P. Phylogeny of broad-leaved and fine-leaved Festuca lineages (Poaceae) based on nuclear ITS sequences. Systematic Botany. 2002;27:241–251. [Google Scholar]
- Warnke SE, Barker RE, Brilman LA, Young WC, III, Cook RL. Inheritance of superoxide dismutase (sod-1) in a perennial × annual ryegrass cross and its allelic distribution among cultivars. Theoretical and Applied Genetics. 2002;105:1146–1150. doi: 10.1007/s00122-002-1007-0. [DOI] [PubMed] [Google Scholar]
- Warnke SE, Barker RE, Jung G, et al. Genetic linkage mapping of an annual × perennial ryegrass population. Theoretical and Applied Genetics. 2004;109:294–304. doi: 10.1007/s00122-004-1647-3. [DOI] [PubMed] [Google Scholar]
- Wilkins PW. Breeding perennial ryegrass for agriculture. Euphytica. 1991;52:201–214. [Google Scholar]
- Wolfe KH, Li W-H, Sharp PM. Rates of nucleotide substitution vary greatly among plant mitochondrial, chloroplast, and nuclear DNAs. Proceedings of the National Academy of Science USA. 1987;84:9054–9058. doi: 10.1073/pnas.84.24.9054. [DOI] [PMC free article] [PubMed] [Google Scholar]
- Yamada T. Introduction of a self-compatible gene of Lolium temulentum L. to perennial ryegrass (Lolium perenne L.) for the purpose of the production of inbred lines of perennial ryegrass. Euphytica. 2001;122:213–217. [Google Scholar]