

Abstract
Background and Aims
Knowledge of those traits that vary with latitude should be helpful in predicting how they may evolve locally under climate change. In the sea beet Beta vulgaris ssp. maritima, seed dormancy largely controls the timing of germination, is highly heritable and varies geographically; it is therefore thought to be selected by climate. The aim here was to characterize the variation in seed dormancy among sea beet populations across the French distribution area, as well as the ecological factors in situ that are correlated with and that could therefore select for seed dormancy. The relative importance of genetic inheritance vs. non-genetic variation is also evaluated.
Methods
The proportions of dormant seeds from 85 natural populations encompassing different climates over the whole French distribution area were measured under controlled conditions. Germination phenology was observed in a common garden experiment. Dormancy variation of seeds collected in situ was compared with that of seeds collected on plants grown in the greenhouse.
Key Results
The proportions of dormant seeds in the greenhouse were highly variable, covering almost the entire range from 0 to 1, and followed a geographical pattern from lower dormancy at high latitudes to high dormancy at low latitudes. The distribution of dormancy was positively correlated with yearly temperatures, especially summer temperatures. Minimum temperatures in winter did not significantly explain the trait variation. The genetic component of the total variation was significant and is probably completed by an important adjustment to the local conditions brought about by maternal adaptive phenotypic plasticity.
Conclusions
Dormancy in sea beet could be interpreted as a way to limit summer germination and spread germination over the first autumn and spring or following autumns. This highly heritable trait has the potential to evolve in the relatively near future because of climate change.
Keywords: Beta vulgaris ssp. maritima, trait distribution, seed dormancy, germination phenology, life history, ecological factors, seasons, climatic factors, latitudinal gradient, climate change
INTRODUCTION
To predict how organisms can adapt to a changing environment, it is useful to study how these organisms vary in the range of environments occurring along their distribution area. A clear example is provided by the latitudinal gradient of traits and communities in relation to climatic gradients (Van Dijk et al., 1997; Van Dijk and Hautekèete, 2007), which can be compared with the latitudinal displacement of species and traits (Walther et al., 2002; Parmesan and Yohe, 2003). Seasonal timing of life-cycle events, i.e. phenology, is one obvious set of traits that are changing along latitude and that are thought to be selected by climate (Van Dijk et al., 1997; Elzinga et al., 2007; Van Dijk and Hautekèete, 2007; Risberg and Granström, 2009). Current shifts in these traits provide compelling evidence that species are being affected by current climate change (Walther et al., 2002; Menzel et al., 2006; Cleland et al., 2007; Bradshaw and Holzapfel, 2008). Knowledge about traits that vary with latitude, i.e. geographical variation pattern, genetic basis and selective environmental factors, should therefore be helpful in predicting how these traits may evolve locally under climate change.
In particular, while both phenotypic plasticity and evolutionary changes might allow such phenological change, the relative contribution of each is less well understood (Gienapp et al., 2008). The two mechanisms probably do not have the same speed or the same magnitude of response to change. Plasticity is a straightforward, although possibly restricted, way to adjust phenology to changing climate, as it is a perfect way to cope with variability between years (Mazer and Schick, 1991). Genetic evolution, by contrast, potentially allows large-magnitude changes, also to novel environments (Moyers and Kane, 2010), although slower and dependent on the available genetic variation as well as on the presence of genetic variation at gene flow distances.
Furthermore, we know little regarding the components of climate that select for the observed phenological pattern. Describing the climate-related genetic diversity for phenological traits among and within populations and understanding its causes and consequences is urgently needed (Jump and Peñuelas, 2005; Bradshaw and Holzapfel, 2008; Gienapp et al., 2008).
Here we describe the geographical variation of one particular phenological trait, seed dormancy, which directly affects the seasonal timing of germination. We provide an estimate of the genetic component of variation and compare it with the component of phenotypic plasticity and identify the climatic factors that are possibly involved.
The timing of germination is a critical moment in a plant's life, with consequences on fitness components such as age and size at first reproduction (Donohue, 2002). It is thus subject to strong natural selection (Donohue et al., 2005). Timing of germination frequently depends on seed dormancy, which is a temporary failure of a viable seed to germinate under conditions that normally favour the process (Vleeshouwers et al., 1995; Bewley, 1997; Li and Foley, 1997; Bradford, 2005). Although dormancy is a potentially costly trait (Rees, 1994; Fenner and Thompson, 2005), it may help to avoid germination in seasonally unfavourable conditions for seedling establishment (Baskin and Baskin, 1998), for example immediately before drought and frost (Allen and Meyer, 1998). Alleviation of seed dormancy requires a precise environmental stimulus, after which seeds become able to germinate in adequate conditions (Bradford, 2005). This stimulus can be related to the season of major risk for the seedlings in some species (Meyer and Monsen, 1991; Schütz and Milberg, 1997; Allen and Meyer, 1998; Pohl-Orf et al., 1999; Llorens et al., 2008). It is therefore a good candidate for latitudinal variation. Drought, cold and fire are some of the highly diverse documented stimuli alleviating dormancy (Baskin and Baskin, 1998; Finch-Savage and Leubner-Metzger, 2006).
The proportion of dormant seeds, dormancy depth and dormancy-releasing environmental cues are known to vary among individuals within species (Bewley, 1997; Andersson and Milberg, 1998; Donohue, 2005; Sautu et al., 2006), resulting in different seasonal patterns of germination. This variation has a hereditary component in many species, as reviewed by Baskin and Baskin (1998) and Meyer and Allen (1999).
In a randomly varying environment, variable seed dormancy spreads the germination and the risk over time (Cohen, 1966), which is referred to as ‘bet-hedging’ (Simons and Johnston, 2006). It is expected to be selected for in frequently disturbed environments (Rees, 1994).
Our study species, the sea beet Beta vulgaris ssp. maritima, is found widely along the coasts of Europe, North Africa and the Mediterranean. The French part of the distribution area consists of different climate zones (the Mediterranean, Atlantic and Channel coasts as well as inland populations in South-West France) over a latitudinal range from 43 to 51°N. Both flowering phenology itself and its underlying mechanisms, vernalization (Boudry et al., 2002) and daylength (Van Dijk and Hautekèete, 2007), as well as the year in which flowering starts (Hautekèete et al., 2009) showed a clear geographical differentiation and were correlated with latitude, climate and, for the last-named, disturbance level (Hautekèete et al., 2002, 2009). Climatic factors, in particular cold or drought, alleviate seed dormancy in this species (Letschert, 1993; Wagmann et al., 2010). Sea beet is known to display variable, highly heritable seed dormancy when tested under controlled conditions. Seed dormancy varies within the family and the proportion of dormant seeds varies between locations. Narrow-sense heritability (h2 ≈ 0·4 in individual populations and ≈ 0·5 at the country scale) was such that rapid evolutionary change in the seasonal timing of germination may be possible, at least at the metapopulation level or on a regional scale (Wagmann et al., 2010).
No pertinent information about the geographical distribution of dormancy in natural sea beet populations is available from the literature nor regarding the ecological factors involved. We address the following hypotheses: (1) Seed dormancy varies with latitude among sea beet populations across the French distribution area. If so, (2) latitudinal variation is correlated with environmental (climatic or disturbance) factors. Dormancy affects the seasonal timing of germination, in relation to the local environment. (3) The latitudinal variation is based partly on maternal phenotypic plasticity but also has a genetic basis.
To test these hypotheses, (1) we sampled and sowed seeds from 85 natural populations encompassing different climates over the French distribution area of our study species. We measured the proportions of dormant seeds under controlled conditions simulating one probable scenario of climatic seasonality. (2) We studied the correlation of seed dormancy distribution in France with a series of environmental factors. We observed the corresponding germination phenology in a common garden experiment. (3) We compared the dormancy variation of seeds collected in situ with seeds collected on plants from the same regions but grown in the greenhouse.
MATERIAL AND METHODS
Plant material and study area
Sea beets [Beta vulgaris ssp. maritima (L.) Thell. (Chenopodiaceae)] are found in a narrow zone along the European, North African and Middle East coasts, usually within 10–20 m of the high water mark. In the Mediterranean and Middle East regions, populations are also present in human-disturbed inland habitats (‘ruderal beets’; for more details, see Letschert, 1993; Desplanque et al., 1999; Hautekèete et al., 2002; Kadereit et al., 2003; Van Dijk and Hautekèete, 2007). ‘Ruderal’ beets are genetically closer to the coastal Mediterranean populations but are geographically closer to the Atlantic populations (Desplanque et al., 1999). Individuals are iteroparous with a variable life span (Hautekèete et al., 2002), self-incompatible (De Cauwer et al., 2010) and wind-pollinated. Seed maturation occurs from July to September depending on the region. Flowers are occasionally solitary, but usually occur in groups of two to eight flowers forming fruit clusters (seed balls) after ripening. As the number of seeds in a seed ball is variable among and within individuals and cannot be estimated without destruction, the proportion of per-seed germination cannot be estimated. However, dormancy was here measured using the proportion of total germination observed, e.g. the number of seedlings at each phase of the experiment divided by the cumulative germination following the complete series of treatments; consequently, the number of seeds per seed ball does not affect our estimate of germination proportions. After the seven drought treatments of the sequential test, germination could not be enhanced by classical treatments such as KNO3 (which improves germination after immediate germination followed by one drought treatment, data not shown; Durrant et al., 1983). We recorded germinating seeds on a weekly basis. Sowing depth, about the height of the seed ball, was chosen following literature recommendations (Letschert, 1993; Sester et al., 2006) and previous experiments. This depth ensures that all seedlings are observed.
Seed dormancy in Beta vulgaris ssp. vulgaris is non-deep-physiological (Hermann et al., 2007).
We collected seeds in 85 different populations, from along the entire French species range including coastal and inland populations [from the North: 2·34°E, 50·98°N through the mid-West: 4·58°W, 48·66°N and the South-West: 1·66°W, 43·39°N to the South-East of France: 5·61 E, 43·20°N (Supplementary Data Table S1); Fig. 1]. The sampling gap in the Normandy area was due to practical reasons (sampling date did not fit the seed ripening date in this area) and not to a lack of natural populations.
Fig. 1.
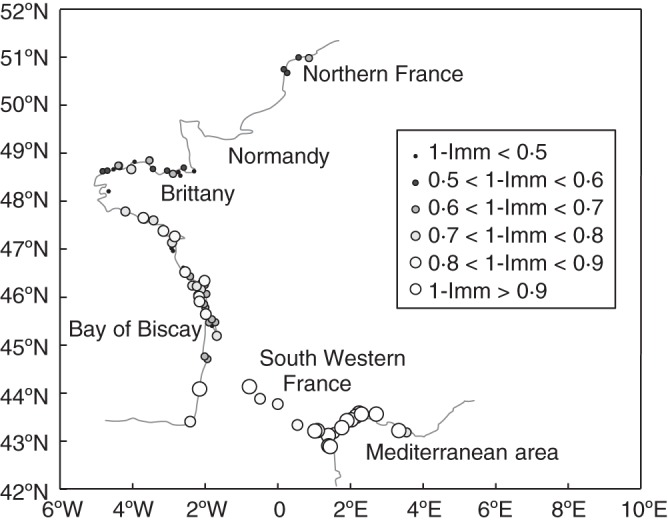
Geographical distribution of the proportion of dormant seeds (‘1-Imm’), i.e. the cumulative proportion of seeds germinating after all treatments in the 85 Beta vulgaris ssp. maritima populations.
The seed balls were collected as a bulk of different individuals in each population during summer 2005 in the Mediterranean area (14–18 July) and along the Atlantic coasts (14–26 August) according to the differences among regions in the timing of seed maturation. Sample size (number of collected seeds) and number of sampled individuals (from 10 to 200) varied according to population size. Seed balls and individuals were randomly chosen in the population, but only ripe fruits were collected.
During summer 2006 five of these populations (Supplementary Data Table S1) were sampled again in the same way to enable comparison of dormancy properties in the same population in two consecutive years. Seeds were stored at 18 °C, 64 % relative humidity.
Climate data (records from 1950–2000) were available from the Worldclim environmental database (1-km2 spatial resolution after interpolation using thin plate smoothing splines, Hijmans et al., 2005). From this database we extracted for each location monthly minimum and maximum air temperatures, monthly mean precipitation and 19 biologically meaningful climatic parameters (Table 1) by the use of DIVA-GIS version 5·2 (Hijmans et al., 2005). The 19 bioclimatic variables available in Worldclim are generated from monthly values to produce biologically meaningful variables and are often used in ecological niche modelling (range of variation, Supplementary Data Table S2). We added another bioclimatic variable (P/T mean monthly precipitation on mean temperature in the warmest quarter) to represent drought.
Table 1.
Ecological factors designated by the partial least square regression (PLS) putative selective agents for phenological traits
| Germination trait | var X* | var Y† | Ecological factors‡ |
|---|---|---|---|
| Proportion of dormant seeds | 48·83 | 46·25 | +Tmin4, 5, 6, 8, 9, +Tmax1, 2, 3, 4, +Tmax5, 6, 7, 8, 9, 10, 11, Tmax12, +bio1, +bio2, +bio4, +bio5, +bio7, +bio8, +bio9, + bio10, –P/T |
| Col | 23·86 | 8·20 | +Tmin1, 2, +Tmin3, +Tmin10, 11, +Tmin12, +Tmax1, +Tmax12, +Prec2, +Prec4, 9, 10, 11, 12, +bio6, +bio11, +bio12, +bio13, +bio15, +bio16, +habitat |
| Dro1 | 46·40 | 8·18 | +Tmin3, 4, +Tmin5, +Tmin6, +Tmin7, +Tmin8, +Tmin9, +Tmax2, +Tmax3, 4, 5, 6, +Tmax7, +Tmax8, 9, 10, +Tmax11, + bio1, +bio2, +bio3, + bio5, +bio7, +bio8, +bio9, +bio10 |
| FurtherDro | 49·04 | 30·76 | +Tmin5, 6, 7, 8, 9, +Tmax1, 2, 3, 4, 5, 6, +Tmax7, +Tmax8, 9, 10, 11, 12, –Prec7, 11, +bio1, 2, 4, +bio5, +bio7, +bio10, +bio14,+ bio18, –P/T |
* Percentage of explained variance of the explanatory variables by the corresponding PLS component.
† Percentage of explained variance of the target variables by the corresponding PLS component.
‡ Main contributing ecological factors to the corresponding PLS components. Tin-type: VIP (variable importance in projection): 1·4 > VIP > 1, bold-type: VIP > 1·4, ‘ + ’ and ‘–’ indicate a positive and negative relationship with the corresponding phenological trait, respectively.
Tested climatic variables: Tmin1 to Tmin12, minimum temperatures from January to December; Tmax1 to Tmax12, maximum temperatures from January to December; PREC1 to PREC12, precipitation from January to December; Bio 1, annual mean temperature (°C × 10); Bio 2, mean diurnal range [mean of monthly temperature range (max. temp – min. temp)]; Bio 3, isothermality (Bio 2/Bio 7) × 100; Bio 4, temperature seasonality (s.d. × 100); Bio 5, max. temperature of warmest month (°C × 10); Bio 6, min. temperature of coldest month (°C × 10); Bio 7, temperature annual range (Bio 5 – Bio 6); Bio 8, mean temperature of wettest quarter (°C × 10); Bio 9, mean temperature of driest quarter (°C × 10); Bio 10, mean temperature of warmest quarter (°C × 10); Bio 11, mean temperature of coldest quarter (°C × 10); Bio 12, annual precipitation (mm); Bio 13, precipitation of wettest month (mm); Bio 14, precipitation of driest month (mm); Bio 15, precipitation seasonality (coefficient of variation); Bio 16, precipitation of wettest quarter (mm); Bio 17, precipitation of driest quarter (mm); Bio 18, precipitation of warmest quarter (mm); Bio 19, precipitation of coldest quarter (mm). P/T, Bio12/Bio1.
To test the hypothesis of increased dormancy in disturbed environments, one of seven habitat types was attributed to each of the 85 populations (using the classification of Hautekèete et al., 2002): 1, field margins; 2, near building and roadside; 3, harbour and oyster basin; 4, beach and dune; 5, estuary and canal; 6, seawall and rocks; 7, cliff.
Greenhouse and common garden experiments
Sequential greenhouse germination test: assessment of dormancy proportions
We tested the following scenario: seed dissemination at the end of the summer followed by a wet autumn, a cold winter, a spring and another summer with dry periods, drought being very probable in the littoral draining soils and in southern France.
Fifty seed balls were randomly chosen from each of the 85 populations collected in summer 2005. They were sown in the University of Lille experimental greenhouse between 28 September and 6 October 2005. Germination was tested according to the experimental design described by Wagmann et al. (2010) but with additional consecutive drought treatments until 25 January 2007 as drought has been shown to be specifically important for dormancy alleviation and to present the highest repeatability and heritability in our study species (Wagmann et al., 2010). The germination test was thus divided into nine successive phases. In each phase germination was recorded and expressed as the proportion of cumulative germination along all nine phases:
1. Imm (immediate germination/cumulative germination along the nine phases) – seed balls were put in standardized conditions for germination, i.e. in the greenhouse at a constant temperature of 20 °C and a photoperiod of 16 h per day in trays with moist commercial soil (Neuhaus Huminsubstrat N3: 90 % peat, 10 % clay; pH 6; NPK 14 : 16 : 18, 1·3 kg m−3; conductivity 35 mS m−1). After 4 weeks, the number of seedlings was recorded.
2. Col (germination after cold treatment/cumulative germination) – the trays were transferred to a dark cold room (5 – 7 °C) keeping them moist (cold stratification; Baskin and Baskin, 1998). After these 4 weeks of cold treatment, germination was recorded after a second 4-week-period of standardized conditions to estimate dormancy release.
3. Dro1 (germination after drought treatment/cumulative germination) – trays underwent 4 weeks without watering under otherwise standardized conditions. After these 4 weekss germination was recorded after another 4-week period of standardized conditions.
4–9. Dro2 to –7 (further drought treatments/cumulative germination, also combined as FurtherDro) – six further drought treatments alternated with 4-week standardized germination periods followed by germination recording.
As a consequence, Imm + Col + Dro1 + … + Dro7 = 1.
The proportion of dormant seeds (hereafter ‘1-Imm’) is the proportion of the cumulative germination after cold and drought treatments of the cumulative germination over all nine phases. We assume that all viable seeds germinated at the end of the experiment (see Plant material).
We also use the ‘number of germinants per seed ball’ to refer to the total number of seedlings divided by the number of seed balls sown. This ratio could exceed 1 depending on the number of seeds per seed ball. The total germination test lasted 69 weeks. Seedlings were cut once recorded to avoid competition.
Control experiment: treatment vs. time effect on germination in controlled conditions
Simultaneously, a control experiment was carried out to evaluate the role of the treatments applied to alleviate dormancy by extending the 4-week period of standardized conditions to 69 weeks. We used 50 seeds from five populations chosen in our 2005 seed collection for representing all geographical areas (Supplementary Data Table S1). At the end of the 69 weeks, we performed a drought treatment on the control trays for 1 month, followed by a 4-week period of standardized conditions. Seedlings were recorded weekly during this experiment. We use the following abbreviations for the germination phases as proportions of their sum: Imm-control (the immediate germination period in the greenhouse germination test) = Germination observed during the first 4-week period/Total Germination; Time effect-control = Germination during the rest of the year (after 4 weeks but before the drought treatment)/Total Germination; Dro-control = Germination after the drought treatment/Total Germination.
Comparison between two successive years in controlled conditions: among-year variation
In September 2006, 50 seeds of each of the five populations collected in summer 2006 (Supplementary Data Table S1) were subjected to the first three phases of the ‘sequential greenhouse germination test’ as in 2005, allowing between-year comparisons for Imm, Col and Dro1.
Comparison between greenhouse and in situ seeds in controlled conditions: genetic vs. non-genetic geographical variation of the trait
The genetic component of the geographical variation was estimated by comparing two datasets: seeds collected in situ in 2005 and seeds arvested on greenhouse plants grown from seeds collected in 1989 (see Van Dijk et al., 1997; 85 populations, 50 seeds per population and 6510 germinants in total). A substantial number of populations were not available in the two datasets (the two datasets shared 51 randomly distributed populations) so we compared data grouped by regions: A, Mediterranean; B, inland South-West France; C + D, Bay of Biscay; E, West and North Brittany; F, Northern France [Fig. 1; also used by Van Dijk et al. (1997) and Van Dijk (2009)]. The comparison was limited to Imm, Col and Dro1, the proportion of dormant seeds (1-Imm) being approximated here as a proportion of the sum of these three germination numbers.
Common garden experiment: germination phenology in semi-natural conditions
We conducted a common garden experiment from 13 September 2005 to 31 October 2006 in order to observe the germination phenology and dormancy loss under natural conditions. The experimental field was situated on the sea front in Wimereux (Northern France) close to a natural sea beet population to provide optimal ecological conditions. The absence of naturally occurring sea beet plants in our experimental plots was previously verified. Each seed ball location was tagged individually to ensure that the observed seedlings came from the sown seed balls. Watering came from rain only; the first significant rain occurred on 15 September 2005. Manual weeding was performed several times during the experiment. The experimental site was enclosed to exclude rabbits and was divided into 1-m2 plots.
Sixteen populations were chosen representing the whole sample area (Supplementary Data Table S1). From each of these 16 populations 32 randomly chosen seed balls were sown in the field site in two separate 1-m2 plots (i.e. two replicates of 16 seed balls each).
Germinants, or seedling emergence, were recorded twice a month over 413 d. Unlike winter, autumn (after sea beet seed production), spring and summer are favourable seasons for plant development at this site. We pooled germination observations into five periods, corresponding to five successive seasons (the first period is autumn 2005, followed by winter 2005–2006, spring 2006, summer 2006 and the beginning of autumn 2006). Germination observations in the field were calculated for each period as proportions of the total germination over all periods. Seedlings were cut on 14 March (just before vegetation started growing) to ensure that all of the new germinants were observed.
Data analysis
Populations producing fewer than ten seedlings in a given experiment were excluded from the data set, to ensure reliable ratios were obtained. This occurred in three populations only. Statistica 7·1 or MINITAB15 was used for basic statistical analyses, and Tanagra 1·4·34 (Rakotomalala, 2005) for partial least squares (PLS) analyses and K-means. We applied an arcsine-square root transformation for all statistical tests performed on germination proportions that require a normal distribution, i.e. t-tests, Pearson correlations, one-way ANOVAs and Tukey's HSD post-hoc tests (Sokal and Rohlf, 1995).
Treatment effect
As treatments were applied successively on the same sets of seeds, we conducted a two-way mixed model ANOVA without replication to compare the different treatment effects (proc. GLM, populations: random effect; seed treatment: fixed effect, MINITAB15), followed by a Tukey's HSD test.
Control experiment: treatment vs. time effect on germination in controlled conditions
For the control experiment, pairwise Student's t-tests were used to compare the germination proportions in the greenhouse germination tests with those in the control experiment. We thus compared: (1) immediate germination in both experiments (Imm vs. Imm-control); (2) the germination proportions during the whole year with and without treatments (Col to FurtherDro vs. Time effect control); (3) the germination proportions after the first treatment (Col vs. the Dro-control); and (4) the germination proportions after the first drought treatments (Dro1 vs. Dro-control).
Comparison between two successive years in controlled conditions: among-years variation
For the comparison between two successive years, germination proportions obtained for seeds collected in 2006 (Imm, Col and Dro1) were compared with those obtained for the same population in the previous year, using pairwise Student's t-tests.
The 16 populations used in this experiment were grouped per geographical region for this analysis (six Brittany and Northern France populations, six from the Bay of Biscay and four Southern France populations). We used the mean germination proportions per geographical area observed in the 2005–2006 field experiment.
Comparison between greenhouse and in situ seeds in controlled conditions: genetic vs. non-genetic geographical variation of the trait
The genetic component of the differentiation between regions was estimated by calculating for each region the mean proportion of dormant seeds of the constituting populations both for the seeds collected from plants that flowered in the greenhouse and for the seeds collected in situ. In both cases the differences between regions were tested for significance by a one-way ANOVA followed by Tukey HSD test. Correlation of these average proportions of dormant seeds over the regions between both types of seeds was also calculated, as well as the regression coefficient (dormancy of greenhouse seeds vs. the dormancy of seeds collected in situ) to gain an impression of the magnitude of the genetic component (covariance between both types of seeds) over the total variance (genetic and environmental variance of seeds collected in the field).
Environmental factors
Germination phenology in semi-natural conditions
A principal components analysis (PCA) was conducted using R 2·13·2 (package ade4) on the transformed germination proportions in the greenhouse germination test in 2005–2006 (Imm, Col, Dro1, Dro2, etc.) and those observed in the field germination test (first autumn, winter, spring, summer and second autumn). When the PCA suggested correlations between greenhouse germination proportions and in situ germination proportions, Pearson correlations were calculated on the transformed data. Power of the correlation test was calculated following Cohen (1992) using R 2·13·2 (package pwr) and significance of the correlations was corrected for multiple hypotheses testing following Benjamini and Hochberg (1995).
Geographical distribution of dormancy proportions
To characterize the geographical variation for germination proportions, we identified two geographical clusters of populations that were similar for germination proportions (each separately). To do so, we conducted K-means with normalization on each dormancy proportion with its latitude.
PLS regression on the proportion of dormant seeds and germination proportions
We conducted PLS regressions to investigate which environmental factors might explain the observed dormancy distribution pattern. The goal of PLS regression is to predict or analyse a set of dependent variables from a set of independent variables or predictors, by extracting from the predictors a set of orthogonal factors called latent variables which explain as much as possible of the covariance between independent and dependent variables (Abdi, 2007). Hence, unlike PCA followed by regression or unlike multiple regression this technique identifies combinations of ecological variables (latent factor) that maximize the explained variation in a response variable (Carrascal et al., 2009), i.e. dormancy in this study. Moreover, it is robust in the face of missing values, model misspecification and violation of the usual statistical assumptions of latent variable modelling, e.g. multicollinearity, non-independence of observations, non-normal distribution of the variables and fewer observations than input variables (Tobias, 2003; Abdi, 2007). PLS regression is more powerful and it produces more stable results than multiple regression or PCA followed by regression with regard to the identification of the relevant variables and their magnitudes of influence independent of the sample size in the analyses (Carrascal et al., 2009). This makes PLS regression an excellent alternative in ecological studies, where predictor variables are often numerous and highly redundant, or interact (Carrascal et al., 2009).
We conducted a PLS regression on the proportion of dormant seeds or on the germination fraction of each treatment with climatic data, habitat type and altitude (a proxy for littoral influence) as input variables. Predictor variables were therefore numerous and dependent, and the use of PLS regression was preferred. We conducted the PLS analyses in Tanagra 1·4·34, an open-source data-mining software with user friendly graphic user interface designed for practitioners and for researchers (Rakotomalala, 2005). To retain the most significant latent factors, we used a cross-validation process (PLS Selection module, Tanagra 1·4·34, Rakotomalala, 2005). For interpretation of the data, we retained predictor variables with VIPs (Variable Importance Projection) above 1 and especially above 1·4, meaning that they fitted well or very well the X- and Y-scores. Except when specifically mentioned, corresponding R2 values were above 0·5 and 0·85, respectively (variables with high VIP but R2 below 0·3 were not considered as important, which occurred once).
Graphical representation
Another objective was to represent graphically the populations according to their values for the explanatory factors identified by the PLS regression, and to allow simple visual comparison with dormancy distribution, for each germination fraction. We then conducted a K-means analysis to divide the populations into groups according to their values for the environmental factors identified in each PLS regression. In the K-means method, k clusters are created by associating every observation with the nearest mean via an iterative refinement algorithm. To do so, we conducted non-normalized K-means on the X-latent factor scores (scores of the independent variables on the first five latent factors) of the above-described PLS regression. For reasons of clarity we chose to create two clusters; however, using more clusters yielded qualitatively similar results. The groups were then presented on maps. We additionally characterized these two clusters using the Group characterization module of Tanagra 1·4·34 (Rakotomalala, 2005), which gives the mean values of each variable in both clusters and tests their departure from the mean value in the total sample (following Lebart et al., 2000). We chose to present the five most important ones for each cluster with positive test values higher than 2 (with two clusters the highest positive test values are automatically the most negative ones in the other cluster).
RESULTS
Treatment effect on seed dormancy alleviation
For the 85 natural populations, after the nine phases of the test, we obtained a total of 8828 germinants, with a mean number of germinants of slightly more than two seedlings per seed ball (Table 2). The proportions of dormant seeds (1-Imm) were highly variable among populations. Non-dormant populations were scarce; in 96 % of the populations the fraction of dormant seeds on total germinants was at least 40 %. Germination proportions for the different treatments were also highly variable (Table 2). Each treatment led to new germinants. The first drought treatment had the strongest effect, followed by the combined further drought treatments; cold had a relatively weak effect on germination (Table 2). Even after seven treatments some germination could be observed. Treatments significantly affected germination (F3,252 = 69·23, P < 0·001; Tukey post-hoc test: Table 2).
Table 2.
Descriptive statistics of the germination proportions measured during the different phases of the greenhouse germination test for the 85 populations
| Variable | Mean ± s.d. | Min. | Max. |
|---|---|---|---|
| Imm | 0·32a,b ± 0·20 | 0·00 | 0·97 |
| Col | 0·05c ± 0·06 | 0·00 | 0·34 |
| Dro 1 | 0·36a ± 0·15 | 0·03 | 0·67 |
| Further Dro | 0·27b ± 0·18 | 0·00 | 0·80 |
| Proportion of dormant seeds | 0·68 ± 0·20 | 0·03 | 1·00 |
| No. of germinants per seed ball | 2·05 ± 0·64 | 0·20 | 3·66 |
Different letters indicate significant differences between treatments at P < 0·05: a < b < c (Tukey HSD test conducted after a two-way mixed model ANOVA without replication). Imm, immediate germination on cumulative germination along the nine phases; Col, germination after cold treatment on cumulative germination; Dro1, germination after drought treatment on cumulative germination; FurtherDro, germination after further drought treatments on cumulative germination; Proportion of seeds dormant, proportion of the cumulative germination along treatments on the cumulative germination; No. of germinants per seed ball, total number of seedling on the number of seed balls.
Control experiment: treatment vs. time effect on germination in controlled conditions
The germination proportions in the sequential germination test were compared with those in the control experiment. The immediate germination proportions were not significantly different, as expected (Imm = 0·39, Immcontrol = 0·55; t = 2·27, n = 5, P = 0·09). A significant difference was observed for the proportion of germination over the whole year with 7 % of the total germination in the absence of treatment in the control experiment (time effect control) and 61 % in the sequential test after all eight treatments (Col to Dro7) (t = –7·96, n = 5, P < 0·01). The germination proportions after the first treatments (Col in the sequential germination test and the drought treatment in the control experiment) were not significantly different (Drocontrol = 0·21, Col = 0·10; t = 1·34, n = 5, P = 0·25) nor were the germination proportions after the first drought treatment in both experiments (Drocontrol = 0·21, Dro 1 = 0·19; t = 0·26, n = 5, P = 0·81).
Genetic vs. non-genetic variation of the trait
Comparison between two successive years in controlled conditions: among-years variation
There was no significant difference in the proportion of germination between the two years for the three phases of the test [(Imm-2005: 0·42, Imm-2006 = 0·40; t = 0·17, n = 5, P = 0·87); (Col-2005: 0·04, Col-2006: 0·12; t = –1·35, n = 5, P = 0·25); (Dro1-2005: 0·54, Dro1-2006: 0·47; t = 1·54, n = 5, P = 0·20)].
Comparison between greenhouse and in situ seeds in controlled conditions: genetic vs. non-genetic geographical variation of the trait
The differences between regions in the proportion of dormant seeds were highly significant for the seeds collected in situ (F4,79 = 27·08, P < 0·001) whereas those for the seeds collected in the greenhouse were not (F4,66 = 0·95, P = 0·44). Both series of means were significantly correlated (R = 0·931, P = 0·022) with a regression coefficient of 0·308, which could be interpreted as the genetic part of the variation between regions.
Germination phenology in semi-natural conditions
In the field experiment we observed 431 seedlings during one year. The mean number of germinants per seed ball was 0·84 (s.d. = 0·30). Massive germination was observed in autumn, during the 2 months following sowing (mean proportion per population = 0·44, s.d. = 0·15). During winter, no germination was observed from 5 January 2006 to 28 February 2006 and very few during the months preceding and following this period. New germination occurred in spring, mainly for seeds from Biscay and southern France, or the end of summer and second autumn, mainly for seeds from northern France. During early summer, the observed germination proportions were low independent of seed origin (Fig. 2). Germination phenology varied among populations, as shown by the standard deviation for each record intra region.
Fig. 2.

Germination phenology: mean proportion of germination for populations from northern France (n = 6), Bay of Biscay (n = 6) and Southern France (n = 4) for each record in the field; lower bars represent s.d.
A PCA (Fig. 3) suggested positive correlations between (1) immediate germination in the greenhouse and germination during first autumn, (2) first drought treatment and spring germination in the field, (3) third drought treatment and summer germination and (4) repeated drought treatments (Dro4 and Dro7) and germination during second autumn. In most cases we found a significant correlation despite a low power of the analysis [n = 16 populations, β = 0·5, (1) r = 0·797, P < 0·001, (2) r = 0·569 P = 0·021, (3) r = 0·710, P = 0·002, (4) r = 0·409, n.s. and r = 0·243, n.s., respectively; all significant correlations were still significant at α = 0·05 after correcting for multiple testing]. Germination after Dro4, associated with second autumn germination along the first axis of the PCA, corresponds to 3·7 % [s.d. = 0·037, confidence interval (at α = 0·05) = 0·037 ± 0·02] of the total germination. The number of germinants per seed ball in the field was significantly correlated with the number of germinants per seed ball in the greenhouse (R = 0·55, P < 0·05, n = 16), although lower.
Fig. 3.

Correlation circle of a PCA: proportions of germination in the greenhouse and in the field for all periods of observation, n = 16 populations. First component axis = 36·25 %, second component axis = 19·16 %.
Geographical patterns of dormancy
We observed a geographical pattern (Fig. 4), with high dormancy in southern France (as an illustration with arbitrary limits, inland and Mediterranean; n = 19, Imm mean = 0·06, s.d. = 0·05; Col mean = 0·03, s.d. = 0·04; Dro1 mean = 0·40, s.d. = 0·12; FurtherDro mean = 0·51, s.d. = 0·13), a mixed situation along the Bay of Biscay (Southern Brittany and Biscay: n = 39, Imm mean = 0·32, s.d. = 0·16; Col mean = 0·05, s.d. = 0·05; Dro1 mean = 0·43, s.d. = 0·15; FurtherDro mean = 0·21, s.d. = 0·13) and lower proportions of dormant seeds in Northern France (Northern Brittany and northwards, n = 27, Imm mean = 0·47, s.d. = 0·13; Col mean = 0·04, s.d. = 0·04; Dro1 mean = 0·26, s.d. = 0·12; FurtherDro mean = 0·22, s.d. = 0·14). We also noted dissimilarity between southern Brittany where several populations exhibited high proportions of dormancy and northern Brittany where populations exhibited lower proportions of dormancy. There was a significant correlation between the proportion of dormant seeds (1-Imm) and the geographical parameters: latitude (R = –0·68, P < 0·001, n = 85) and longitude (R = 0·61, P < 0·001, n = 85). A one-way ANOVA on the number of germinants per seed ball showed a significant effect of region (Northern France to North Brittany, South Brittany and Biscay, the Mediterranean and inland) but did not distinguish between the North and the Mediterranean (F2,84 = 9·1, P < 0·001, post-hoc Tukey Mediterranean and inland = North < South Brittany and Biscay).
Fig. 4.
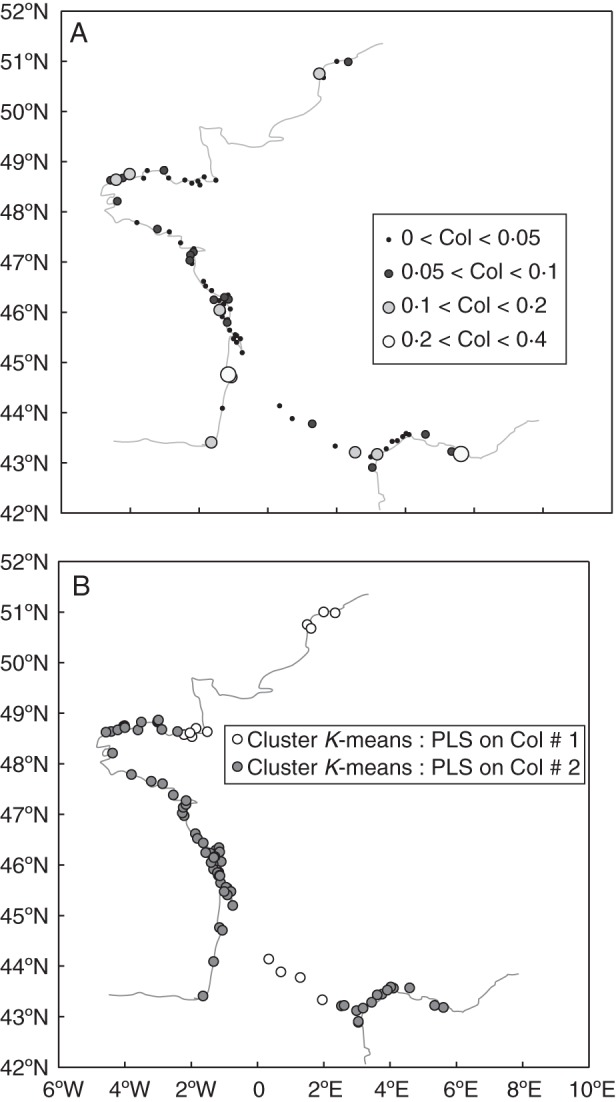
(A) Geographical distribution of the proportion of seeds germinating after the cold treatment (Col, germination after cold treatment on cumulative germination; mean germination = 5 %). (B) Geographical distribution of the two groups of populations clustered according to their values on the five axes of a PLS regression conducted to explain Col (distribution with climate, altitude and habitat as input variables; K-means method, no normalization, two groups, scores on the first five axes of the PLS).
The germination proportion after the cold treatment (Col), which was very low with low variability (Table 2, Fig. 4A), showed no obvious geographical pattern. K-means clustering on Col and latitude distinguished with low confidence (R2 = 0·37) two geographical clusters with slightly higher Col values in Southern France (cluster centroid Col = 0·049 vs. 0·045) below 46·7 °B (Fig. 4B).
Germination proportion after the first drought treatment (Dro1), which was higher and more variable (Table 2, Fig. 5A), showed a geographical pattern with lower values in North Brittany and Northern France, higher values in South-Western France and the Mediterranean and intermediate values in between. The K-means method on Dro1 and latitude distinguished (R2 = 0·49) two geographical clusters with higher Dro1 values in Southern France (cluster centroid Dro1 = 0·44 vs. 0·26), showing a transition zone between 45·4 and 48 °B (Fig. 5B).
Fig. 5.
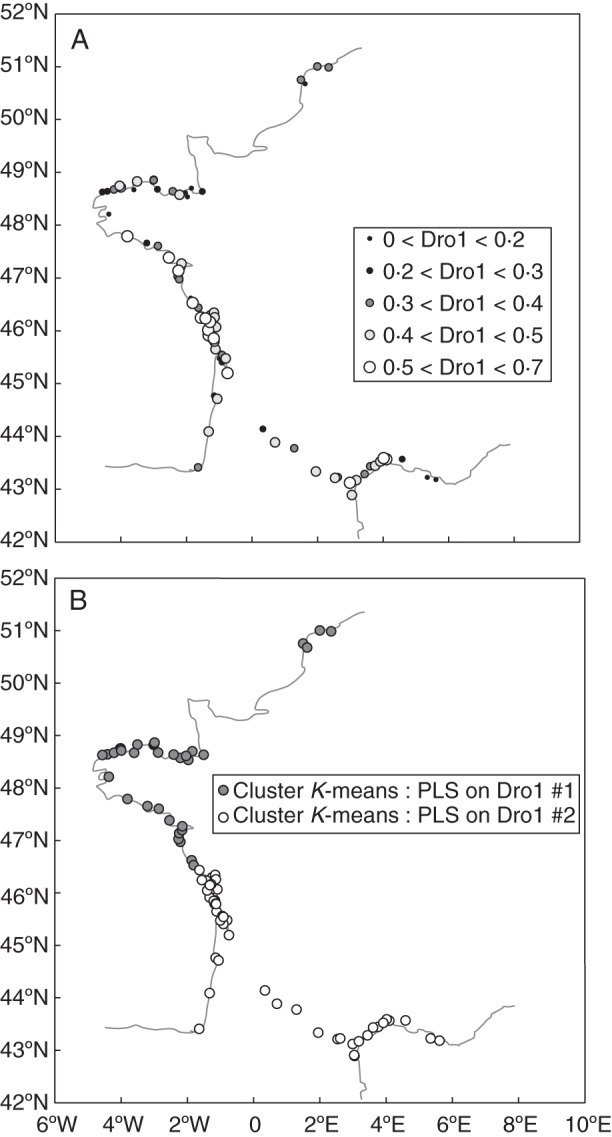
(A) Geographical distribution of the proportion of seeds germinating after the first drought treatment (Dro1, germination after drought treatment on cumulative germination; mean germination = 36 %). (B) Geographical distribution of the two groups of populations clustered according to their values on the five axes of a PLS regression conducted to explain Dro1 (distribution with climate, altitude and habitat as input variables; K-means method, no normalization, two groups, scores on the first five axes of the PLS).
Germination proportion after the further drought treatments (FurtherDro), which were relatively high and variable (Table 2, Fig. 6A), showed a geographical pattern with lower values in North Brittany and Northern France, higher values in South-Western France and the Mediterranean and intermediate values in between. K-means method on FurtherDro and latitude distinguished (R2 = 0·57) two geographical clusters with higher FurtherDro values in Southern France (cluster centroid FurtherDro = 0·49 vs. 0·20), showing a transition zone between 44·5 and 45·5°N (Fig. 6B).
Fig. 6.
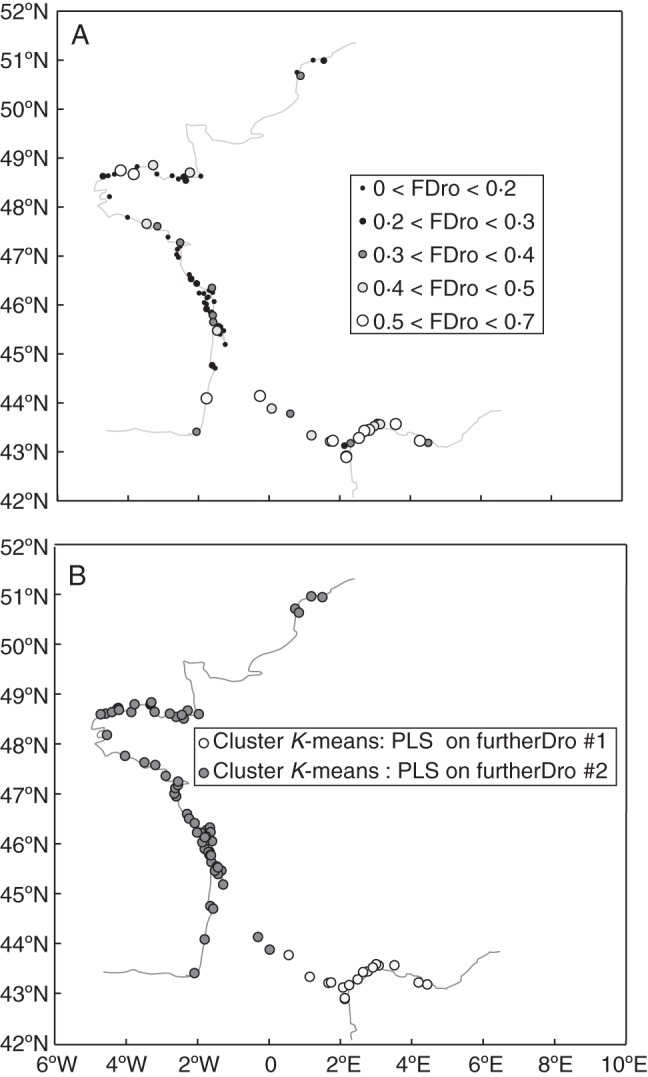
(A) Geographical distribution of the proportion of seeds germinating after drought treatments 2–7 (FurtherDro, further drought treatments on cumulative germination, mean germination = 27 %; abbreviated to ‘FDro’ in key). (B) Geographical distribution of the two groups of populations clustered according to their values on the five axes of a PLS regression conducted to explain FurtherDro (distribution with climate, altitude and habitat as input variables; K-means method, no normalization, two groups, scores on the first five axes of the PLS).
Environmental factors and dormancy proportions
PLS regression on the proportion of dormant seeds
The first PLS axis, kept after the cross validation process, accounted for 48·83 % of the total variation among sites in the bioclimatic data set (Table 1) and explained 46·25 % of the total variation among populations for the proportion of dormant seeds. This axis mainly accounted for maximum temperatures, especially from May to November. These factors were positively related to the proportion of dormant seeds (Table 1). Minimum temperatures in winter and precipitation did not significantly explain the variation in the proportion of dormant seeds.
PLS regressions on Col, Dro1 and FurtherDro
The first axis of the PLS regression on Col accounted for 23·86 % of the total variation among sites in the bioclimatic data set (Table 1) and explained 8·20 % of the total variation among populations for this germination proportion. It mostly accounted for the minimum temperature of the coldest period and winter precipitation (high VIPs and R2 above 0·5), positively related to Col. summer temperatures and P/T were not significant on this axis.
The first five factors of the PLS regression cumulatively explained 91 % of the total environmental variation as well as 30 % of Col variation. K-means clustering based on the population scores on the first five axes grouped Northern France and South-Western France together, representing one group of sites with similar values for the most important environmental factors in explaining Col (Fig. 4B).
These clusters are mainly characterized by winter temperatures (Table 3) that are higher in the Mediterranean populations and along the Atlantic coast (cluster no. 2), as well as autumn precipitations that are higher in cluster no. 2 while summer precipitations are higher in the Northern and South-Western France cluster (cluster no. 1). Northern and South-Western France cluster is also characterized by a higher altitude (Table 3, mean altitude difference = 48·31 m).
Table 3.
Group characterization of ‘environment’ clusters (Figs 4B, 5B and 6B) conducted on X-latent factor scores (scores of the input variables on the first five latent factors) of a PLS regression (explained variable = germination proportions distribution; input variables = climate variables, altitude and habitat)
| Population number | Test value | Group mean (s.d.) | Overall mean (s.d.) | |||
|---|---|---|---|---|---|---|
| Col | Cluster K-means no. 1 | Altitude | 14 | 4·78 | 61·64 (59·53) | 21·28 (34·34) |
| PREC7 | 2·34 | 47·64 (4·20) | 41·29 (11·04) | |||
| Cluster K-means no. 2 | TMIN3 | 71 | 6·38 | 5·22 (0·53) | 4·99 (0·74) | |
| TMIN2 | 6·12 | 3·21 (0·47) | 3·00 (0·69) | |||
| TMIN1 | 6·06 | 6·33 (0·44) | 6·14 (0·64) | |||
| BIO11 | 5·92 | 6·57 (0·56) | 6·36 (0·74) | |||
| PREC10 | 5·7 | 88·14 (10·89) | 84·56 (12·94) | |||
| Dro1 | Cluster K-means no. 1 | P/T | 38 | 4·36 | 3·34 (0·35) | 2·92 (0·79) |
| PREC1 | 4·3 | 95·61 (22·24) | 84·26 (21·75) | |||
| TMIN1 | 3·3 | 3·22 (0·64) | 2·90 (0·80) | |||
| BIO19 | 3·29 | 272·13 (62·01) | 248·34 (59·66) | |||
| BIO6 | 2·74 | 3·10 (0·58) | 2·85 (0·75) | |||
| Cluster K-means no. 2 | TMAX9 | 47 | 7·95 | 23·21 (1·23) | 21·52 (2·16) | |
| TMAX4 | 7·86 | 16·82 (0·93) | 15·50 (1·72) | |||
| TMAX5 | 7·86 | 20·03 (1·06) | 18·56 (1·91) | |||
| TMAX1 | 7·76 | 18·55 (1·04) | 17·31 (1·63) | |||
| TMAX6 | 7·57 | 23·57 (1·63) | 21·77 (2·44) | |||
| FurtherDro | Cluster K-means no. 1 | TMAX7 | 17 | 7·55 | 28·45 (0·58) | 23·62 (2·93) |
| TMAX1 | 7·53 | 14·76 (0·75) | 12·55 (1·35) | |||
| BIO10 | 7·49 | 21·77 (0·59) | 18·65 (1·91) | |||
| BIO5 | 7·43 | 28·45 (0·58) | 23·82 (2·86) | |||
| TMIN7 | 7·26 | 17·05 (0·87) | 14·65 (1·52) | |||
| Cluster K-means no. 2 | PREC7 | 68 | 7·86 | 46·03 (4·92) | 41·29 (11·04) | |
| P/T | 7·77 | 3·26 (0·41) | 2·92 (0·79) | |||
| BIO14 | 7·72 | 45·06 (5·14) | 40·52 (10·79) | |||
| BIO18 | 7·14 | 174·29 (22·69) | 160·04 (36·61) | |||
| PREC11 | 6·58 | 98·31 (14·94) | 91·26 (19·64) | |||
The first axis of the PLS regression on Dro1 accounted for 46·40 % of the total variation among sites in the bioclimatic data set (Table 1) and explained 8·18 % of the total variation among populations for this germination proportion. It mostly accounted for the maximum temperatures from March to October and monthly minimum temperatures from March to August, all positively related to Dro1. Minimum temperatures in winter, P/T and precipitations did not significantly explain the variation for Dro1.
Five factors cumulatively explained 93·94 % of the total environmental variation and 24·98 % of Dro1 variation. K-means clustering based on the population scores on these first five axes separates the populations in two geographical clusters delimited by latitude 46·5°N (Fig. 5B). These clusters are mainly characterized by spring and autumn maximum temperatures (Table 3) that are higher below 46·5°N (cluster no. 2). P/T, precipitation in winter and minimum temperature in winter were higher above 46·5°N (cluster no. 1).
The first axis of the PLS regression on FurtherDro, kept after the cross validation process, accounted for 49·04 % of the total variation among sites in the bioclimatic data set (Table 1) and explained 30·76 % of the total variation among populations for this germination proportion. It mostly accounted (high VIPs and high R2 values for the first axis) for the maximum temperatures, especially July, positively related with FurtherDro. Precipitations in July and November were also essential in the construction of the axis, with a negative relationship with FurtherDro.
Five factors cumulatively explained 93·77 % of the total environmental variation as well as 46·73 % of FurtherDro variation. K-means clustering based on the population scores on these first five axes separated the populations into two geographical clusters meeting in South Western France (44·5°N, Fig. 6B). The Northern cluster (no. 2) is mainly characterized by high P/T, higher precipitation in the driest period (Table 3) and in November, while temperatures in the warmest period and in November are higher in the Southern cluster (no. 1).
DISCUSSION
A reliable picture: control checks
The proportion of dormant seeds in sea beet is high, 68 % of the total germination. The main part of germination (63 %) occurred after drought treatments and mainly during the first drought treatment, which released almost half of the dormancy, while cold had on average a small effect. Further drought treatments had a large effect (almost half the average proportion of dormant seeds), and in some populations a stronger effect than that of previous treatments. On average, about two germinants per seed ball were observed, providing a reasonably reliable picture of the population germination properties.
As a supplement to previous experiments on sea beet (Wagmann et al., 2010), we showed that cold and drought were the crucial factors for dormancy release and not just the progress of time. It is not possible, however, without further experiments to say if the observed high sensitivity to additional drought treatments was due to the duration of the drought periods (accumulation) or to the alternation with periods of moisture. A second check concerned the year in which the seeds were sampled. Scholten et al. (2009) in a similar test found between-year differences in Lomatium dissectum stratification requirements, suggesting differences in environmental conditions during seed development, which would alter the degree of seed dormancy. Similar results were found in Silene noctiflora, Sinapis arvensis and Spergula arvensis (Andersson and Milberg, 1998). In sea beet and in the tested years, environmental conditions during seed development did not vary sufficiently, or the maternal effect was not strong enough, to change the degree of dormancy significantly.
Finally, the results of the dormancy tests in the greenhouse were compared with the germination pattern in a field where sea beets grow naturally. Although in a single year at a single location, the field experiment provides important clues for understanding the natural variation of this trait in sea beet, and reveals different germination patterns along seasons between seeds from different regions, which supports the results of the controlled condition experiment. Scholten et al. (2009) found in L. dissectum a lower requirement for seed dormancy break in the field. In contrast, we observed on average fewer seedlings per seed ball in the field, pointing to less favourable circumstances than the ideal situation in the greenhouse (and perhaps some seed or young seedling predation, although we probably have been able to score most such cases).
Latitudinal decrease of seed dormancy among sea beet populations
Detecting differences in dormancy among populations requires extensive sampling (Schütz and Milberg, 1997). This was achieved here by studying 85 natural populations along an 8° latitudinal range. Along such a large geographical scale with a priori differences in climatic conditions and in the timing of the favourable season, a differential selection of dormancy is to be expected (Fenner and Thompson, 2005). The proportion of dormant seeds in the greenhouse was indeed highly variable, covering almost the entire range from 0 to 1.
To our knowledge, few studies have assessed the geographical variations in dormancy within one species. Silene noctiflora, Sinapis arvensis, Spergula arvensis and Carex canescens show random patterns of within-species variation for dormancy (Schütz and Milberg, 1997; Andersson and Milberg, 1998). Scholten et al. (2009) described non-random variations in cold stratification requirements for germination along an elevation gradient among eight populations of L. dissectum. Van Klinken et al. (2008) described the geographical variation in seed dormancy released by wet heat in Parkinsonia aculeata. Similarly, we reveal non-random latitudinal variations for seed dormancy in sea beet.
The proportion of dormant seeds increased from higher latitudes (Northern Brittany and Northern France), to lower latitudes (Southern France). Latitudinal change was relatively gradual for dormancy alleviated by first drought treatment with a large transition zone around approximately 46°N, while the transition zone was more narrow and more to the south (around 44·5°N) for dormancy alleviated by multiple drought treatments. Whereas Scholten et al. (2009) showed a geographical variation in the requirement for cold stratification in L. dissectum, there is no obvious geographical pattern for germination after the cold treatment in sea beet. The above-described geographical pattern of increasing dormancy with decreasing latitude is apparently mainly due to the dormancy released by drought and is even stronger for the dormancy alleviated after multiple drought treatments.
This experiment gives, to our knowledge, the most precise description of seed dormancy distribution pattern in one species, given the large number of populations studied. The distribution pattern of seed dormancy in this one species corresponds quite well with that observed in meta-analyses over thousands of species, i.e. increasing dormancy along a decreasing precipitation gradient (Baskin and Baskin, 2004; Jurado and Flores, 2005).
Dormancy affects within-year germination timing
In the experimental field, all populations germinated to a large extent during the autumn following the sowing in September. After a winter without germination, seeds from the Bay of Biscay and Southern France and to a lower extent from Northern France germinated also considerably in spring, as previously observed in weed beet (Sester et al., 2006). During early summer we observed low germination proportions, independent of the seed origin, pointing to less favourable – probably too dry – conditions, which is supported by previous experiments in weed beet (Sester et al., 2006). The seasonal pattern of germination observed in the field might be due to the alternation of optimal and non-optimal periods for germination (winter, summer). However, comparison of these results with those obtained under controlled conditions demonstrates that spring, summer or second autumn germination in the field corresponds to dormancy release and not to immediate germination.
New germinations occurred at the end of summer, mainly in northern populations, and second autumn, mainly in populations from Southern France. These later germinations occurred at the same time when the seeds of this year would have been released. Such germination timing could play a crucial role in unstable situations with important year-to-year differences and occasional failure in seed production (Venable, 2007). In Parkinsonia aculeata most seeds are likely to have germinated in the first year. Van Klinken et al. (2008) suggest that dormancy in P. aculeata is more a mechanism ensuring optimal germination timing for seedling establishment than between-year bet-hedging. Sea beet shows a wide variation among populations for dormancy after 1 year, with southern populations germinating for a substantial part in the second autumn. As in P. aculeata, dormancy in sea beet is probably a mechanism ensuring optimal germination timing. Some part of bet-hedging is possible, mainly in southern populations, but probably does not result in an important seed bank.
Llorens et al. (2008) concluded that in Mediterranean shrublands, spring and autumn were favourable germination seasons due to the mild conditions but that irregular and uncertain rains in spring offered little security for seedlings to survive. In their study species, Fumana ericoides, the dormancy pattern favoured germination in autumn. In our study, Mediterranean populations germinated to a substantial extent during spring, with two additional peaks in summer and in autumn. A similar experiment in the Mediterranean area prove helpful in interpreting this observation because the important dormancy release in spring could be brought about by the field conditions in Northern France but be absent in Southern France.
Seed dormancy correlates with climatic factors and optimizes germination timing
The variation in the proportion of dormant seeds, tested in the greenhouse, was not explained by disturbance. It was explained by maximum temperatures and especially by temperatures from spring to autumn, which all correlate positively with it. Winter minimum temperatures and precipitation did not seem to play a major role, in agreement with the low values of dormancy alleviated by the cold treatment. The geographical distribution of dormancy alleviated by cold was poorly explained by the tested environmental variables. Moreover in the greenhouse vs. field comparison experiment, germination alleviated by cold treatment in the greenhouse was apparently not correlated with germination in any season in the field. The distribution of dormancy alleviated by the first drought treatment (36 % of total germination) was poorly explained by the tested environmental variables. The most significant explanatory factors were temperatures from spring to autumn, which are higher below 46·5°N. In the greenhouse vs. field comparison experiment, spring germination in the field experiment was significantly positively correlated with germination alleviated by the first drought treatment in the greenhouse. It appears that spring germination in sea beet is mainly allowed by dormancy alleviation by drought, and not by cold as in many other plant species (Baskin and Baskin, 1998; Scholten et al., 2009). It is possible that the chosen temperature for the cold stratification test was too high. However, the first drought treatment might have simulated climatic or edaphic drought (dry periods in late winter or early spring in the south, or littoral draining soils), but also drought induced by winter frosts.
The distribution of dormancy alleviated by further drought was nicely explained (30·76 % of the total variation among populations) by yearly temperatures with one peak around July, as well as annual and diurnal temperature range, all of which are associated positively with this trait. Summer precipitation was significantly negatively associated with germination proportion after further drought treatments. Spring and autumn maximum temperatures were higher below 44·5°N. High summer temperatures and low rainfall characteristic of the south of France thus seem to select for high levels of dormancy alleviated by several drought episodes. This is supported by the greenhouse vs. field comparison where germination alleviated by further drought treatments in the greenhouse was positively correlated with summer and, although less clearly, second autumn germination in the field. Similarly, summer high temperature and low soil moisture conditions promote dormancy loss in many winter (or facultative winter) annuals, allowing autumn germination in the field, or autumn and spring germination as in Capsella bursa-pastoris (Baskin and Baskin, 1998).
As in some other plant species (Van Klinken et al., 2008; Scholten et al., 2009), climatic factors explained the geographical variation in sea beet seed dormancy. In Parkinsonia aculeata, geographical variation in seed dormancy was explained by wet heat (Van Klinken et al., 2008). In L. dissectum, seed dormancy is released by cold stratification and seeds from drier sites require shorter stratification (Scholten et al., 2009). We show that seed dormancy in sea beet is positively correlated with dry heat, and that the intensity of this relationship increases to the south. Moreover, our results intimately link germination timing and dormancy depth. Although genetic drift cannot be excluded, the non-random geographical variation and the correlation between the trait and climatic factors mostly support the hypothesis of selection.
Dormancy in sea beet could then be interpreted as a way to spread germination over first autumn and another season climatically favourable to seedling survival. In Biscay, dormancy is largely alleviated by one single drought, which could then be interpreted as a way to germinate at the best time in the year for seedling survival, namely spring. In more southern areas, dormancy is largely alleviated by several drought periods, which could then be interpreted as a way to limit summer germination in the southern regions. In these areas, some part of bet-hedging is also possible. Similarly, Scholten et al. (2009) suggested that in L. dissectum the geographical pattern of seed dormancy is related to summer drought, which affects the length of the growing season. However, in this species, dormancy is alleviated by cold stratification and lower seed dormancy is selected in more arid locations, thus allowing the avoidance of late germination just before summer drought. Van Klinken et al. (2008) also suggested that seed dormancy in P. aculeata maximizes seedling establishment rather than spreads the risks between years.
In the Mediterranean environment, summer is a severe stress period for sea beet due to drought (reinforced by hyper-salinity), high temperatures and occasional summer rainfall followed by long dry spells (Letschert, 1993). Such summer rainfall could create favourable conditions for germination after seed production while the subsequent seedling survival would be low. Drought and summer rainfall may explain the dormancy pattern in our study species, which followed adverse summer condition gradients.
In contrast, in northern regions, as seed production occurs in late summer, and as we might consider from the field experiment that autumn conditions are apparently optimal for germination, the higher risk of seedling mortality mainly occurs in late autumn and winter when temperature drops below zero (Pohl-Orf et al., 1999) and when floods are more frequent and responsible for inundation and deleterious hyper-salinity (Letschert, 1993). The proportion of dormant seeds is also positively related to early and late winter temperatures, suggesting the role of seed dormancy in the avoidance of mild winters, which might be optimal for germination but not for seedling survival.
Maternal plasticity and genetic basis of sea beet seed dormancy
The significant correlation between dormancy values per region and the values obtained for the seeds ripened on greenhouse plants from the same regions indicates that the genetic differences followed the same trend as the phenotypic differentiation. The regression coefficient is about 0·308, which can be interpreted as the genetic component of the geographical variation for the proportion of dormant seeds. In an earlier paper (Wagmann et al., 2010) we showed that sea beet populations have sufficient genetic variation for an evolutionary change in dormancy in the future (narrow-sense heritability h2 ≈ 0·4 in individual populations and ≈ 0·5 at the country scale). Seed dormancy has been shown to be a candidate for a genetically based local adaptation as it plays a crucial role, for example, in colonizing species such as Arabidopsis thaliana, in which selection on quantitative trait loci for seed dormancy was shown in an experimental population (Huang et al., 2010). Moreover Lampei and Tielbörger (2010) measured high evolvability of between-year seed dormancy in some species in relation to aridity. The observed regression coefficient of 0·308 also indicates a relatively high environmental component of the total variation, i.e. maternal phenotypic plasticity. However, the possibility of evolutionary or epigenetic change during this period cannot be excluded as the seeds in the greenhouse were collected from plants sampled in 1989, and the seeds collected in situ were from 2005. In summary, while a genetic differentiation of the investigated populations is highly plausible, an important adjustment to the local conditions seems also to be brought about by non-genetic effects. The higher variance among populations in the wild seed collection than in the greenhouse seeds suggests that maternal effects may act to enhance the differentiation. Maternal effects in seed dormancy are known also from other species (Philippi, 1993) and are genetically based (Donohue, 2005). The consequences of these maternal effects on evolutionary potential are currently controversial (Ghalambor et al., 2007; Danchin et al., 2011).
Despite the evidence of a plausible genetic differentiation between populations for seed dormancy, demonstrating local adaptation among populations requires experiments comparing the fitness of individuals from the local vs. foreign populations under the same environmental conditions (Kawecki and Ebert, 2004). Studying the relationship between dormancy and environmental factors, as was done here, is only a first step in understanding the role of natural selection in adjusting germination phenology mediated by dormancy to the local situation.
Sea beet seed dormancy in a changing environment
According to climate change projection, the warming and higher risk of drought during summer are likely to be important in the Mediterranean area, whereas milder, wetter winters are expected in most of northern Europe (Hulme et al., 2002; Christensen et al., 2007). An example of a possible adaptation to the latter projected scenario is provided by Gosling et al. (2009) for Alnus glutinosa, where warmer autumns are likely to enhance autumn germination, which will be increasingly favourable with respect to better seedling survival to the next spring. Similarly, sea beet germination timing should be directly affected by climate change.
Conclusions
The relationship between climate and geographical variation of seed dormancy in sea beet, and the heritability of this trait (Wagmann et al., 2010), together suggest that seed dormancy is a trait that may evolve genetically in the future because of climate change. Although part of the geographical variation of this trait seems to stem from genetic differentiation, another part may stem from maternal phenotypic plasticity. Further study on sea beet seed dormancy, e.g. long-term monitoring, could provide some interesting clues to the debate on the role of non-genetic effects in evolutionary changes (Ghalambor et al., 2007; Danchin et al., 2011).
SUPPLEMENTARY DATA
ACKNOWLEDGMENTS
We thank Robert Dron for technical assistance; and Jean-Claude Dauvin, Thierry Caron, Michel Priem and Station Marine de Wimereux for providing access to the experimental field site and technical assistance. We thank Fabrice Roux and two anonymous referees for their valuable comments. This work was supported by a PhD grant from the French Ministry of Higher Education and Research awarded to K.W. and experimental site preparation was financed by funds from the PPF Lille 1 awarded to the Laboratoire Ecosystèmes Littoraux et Côtiers.
LITERATURE CITED
- Abdi H. Partial least square regression (PLS regression) In: Salkind NJ, editor. Encyclopedia of measurement and statistics. Vol. 2. Thousand Oaks, CA/London/New Dehli: Sage Publications Inc; 2007. pp. 740–744. [Google Scholar]
- Allen PS, Meyer SE. Ecological aspects of seed dormancy loss. Seed Science Research. 1998;8:183–191. [Google Scholar]
- Andersson L, Milberg P. Variation in seed dormancy among mother plants, populations, and years of seed collection. Seed Science Research. 1998;8:29–38. [Google Scholar]
- Baskin CC, Baskin JM. Seeds: ecology, biogeography, and evolution of dormancy and germination. London: Academic Press; 1998. [Google Scholar]
- Baskin CC, Baskin JM. Classification, biogeography, and phylogenetic relationships of seed dormancy. In: Smith R, Dickie J, Linington S, Pritchard H, Probert R, editors. Seed conservation: turning science into practice. Kew: Kew Publishing; 2004. pp. 517–544. [Google Scholar]
- Benjamini Y, Hochberg Y. Controlling the false discovery rate: a practical and powerful approach to multiple testing. Journal of the Royal Statistical Society, Series B (Methodological) 1995;57:289–300. [Google Scholar]
- Bewley JD. Seed germination and dormancy. The Plant Cell. 1997;9:1055–1066. doi: 10.1105/tpc.9.7.1055. [DOI] [PMC free article] [PubMed] [Google Scholar]
- Boudry P, McCombie H, Van Dijk H. Vernalization requirement of wild beet Beta vulgaris ssp. Journal of Ecology. 2002;90:693–703. maritima: among population variation and its adaptive significance. [Google Scholar]
- Bradford KJ. Threshold models applied to seed germination ecology. New Phytologist. 2005;165:338–341. doi: 10.1111/j.1469-8137.2004.01302.x. [DOI] [PubMed] [Google Scholar]
- Bradshaw WE, Holzapfel CM. Genetic response to rapid climate change: it's seasonal timing that matters. Molecular Ecology. 2008;17:157–166. doi: 10.1111/j.1365-294X.2007.03509.x. [DOI] [PubMed] [Google Scholar]
- Carrascal LM, Galvan I, Gordo O. Partial least squares regression as an alternative to current regression methods used in ecology. Oikos. 2009;118:681–690. [Google Scholar]
- Christensen JH, Hewitson B, Busuioc A, et al. Contribution of Working Group I to the Fourth Assessment Report of the Intergovernmental Panel on Climate Change. Cambridge: Cambridge University Press; 2007. Regional climate projections. Climate Change 2007: The Physical Science Basis. [Google Scholar]
- Cleland E, Chuine I, Menzel A, Mooney H, Schwartz M. Shifting plant phenology in response to global change. Trends in Ecology and Evolution. 2007;22:357–365. doi: 10.1016/j.tree.2007.04.003. [DOI] [PubMed] [Google Scholar]
- Cohen D. Optimizing reproduction in a randomly varying environment. Journal of Theoretical Biology. 1966;12:119–129. doi: 10.1016/0022-5193(66)90188-3. [DOI] [PubMed] [Google Scholar]
- Cohen J. A power primer. Psychological Bulletin. 1992;112:155–159. doi: 10.1037//0033-2909.112.1.155. [DOI] [PubMed] [Google Scholar]
- Danchin E, Charmantier A, Champagne FA, Mesoudi A, Pujol B, Blanchet S. Beyond DNA: integrating inclusive inheritance into an extended theory of evolution. Nature Reviews Genetics. 2011;12:475–486. doi: 10.1038/nrg3028. [DOI] [PubMed] [Google Scholar]
- De Cauwer I, Dufaÿ M, Cuguen J, Arnaud JF. Effects of fine-scale genetic structure on male mating success in gynodioecious Beta vulgaris ssp. maritima. Molecular Ecology. 2010;19:1540–1558. doi: 10.1111/j.1365-294X.2010.04586.x. [DOI] [PubMed] [Google Scholar]
- Desplanque B, Boudry P, Broomberg K, Saumitou-Laprade P, Cuguen J, Van Dijk H. Genetic diversity and gene flow between wild, cultivated and weedy forms of Beta vulgaris L. (Chenopodiaceae), assessed by RFLP and microsatellite markers. Theoretical Applied Genetics. 1999;98:1194–1201. [Google Scholar]
- Donohue K. Germination timing influences natural selection on life-history characters in Arabidopsis thaliana. Ecology. 2002;83:1006–1016. [Google Scholar]
- Donohue K. Seeds and seasons: interpreting germination timing in the field. Seed Science Research. 2005;15:175–187. [Google Scholar]
- Donohue K, Dorn L, Griffith C, et al. The evolutionary ecology of seed germination of Arabidopsis thaliana: variable natural selection on germination timing. Evolution. 2005;59:758–770. [PubMed] [Google Scholar]
- Durrant MJ, Payne PA, McLaren JS. The use of water and some inorganic salt solution to advance sugar beet seed: I. Laboratory studies. Annals of Applied Biology. 1983;103:507–515. [Google Scholar]
- Elzinga JA, Atlan A, Biere A, Gigord L, Weis AE, Bernasconi G. Time after time: flowering phenology and biotic interactions. Trends in Ecology and Evolution. 2007;22:432–439. doi: 10.1016/j.tree.2007.05.006. [DOI] [PubMed] [Google Scholar]
- Fenner M, Thompson K. The ecology of seeds. Cambridge: Cambridge University Press; 2005. [Google Scholar]
- Finch-Savage WE, Leubner-Metzger G. Seed dormancy and the control of germination. New Phytologist. 2006;171:501–523. doi: 10.1111/j.1469-8137.2006.01787.x. [DOI] [PubMed] [Google Scholar]
- Ghalambor CK, McKay JK, Carroll SP, Reznick DN. Adaptive versus non-adaptive phenotypic plasticity and the potential for contemporary adaptation in new environments. Functional Ecology. 2007;21:394–407. [Google Scholar]
- Gienapp P, Teplitsky C, Alho JS, Mills JA, Merilä J. Climate change and evolution: disentangling environmental and genetic responses. Molecular Ecology. 2008;17:167–178. doi: 10.1111/j.1365-294X.2007.03413.x. [DOI] [PubMed] [Google Scholar]
- Gosling PG, McCartan SA, Peace AJ. Seed dormancy and germination characteristics of common alder (Alnus glutinosa L.) indicate some potential to adapt to climate change in Britain. Forestry. 2009;82:573–582. [Google Scholar]
- Hautekèete NC, Piquot Y, Van Dijk H. Life span in Beta vulgaris ssp. Journal of Ecology. 2002;90:508–516. maritima: the effects of age at first reproduction and disturbance. [Google Scholar]
- Hautekèete NC, Van Dijk H, Piquot Y, Teriokhin A. Evolutionary optimization of life-history traits in the sea beet Beta vulgaris subsp. Acta Oecologica. 2009;35:104–116. maritima: comparing model to data. [Google Scholar]
- Hermann K, Meinhard J, Dobrev P, et al. 1-Aminocyclopropane-1-carboxylic acid and abscissic acid during the germination of sugar beet (Beta vulgaris L.): a comparative study of fruits and seeds. Journal of Experimental Botany. 2007;58:3047–3060. doi: 10.1093/jxb/erm162. [DOI] [PubMed] [Google Scholar]
- Hijmans RJ, Cameron SE, Parra JL, Jones PG, Jarvis A. Very high resolution interpolated climate surfaces for global land areas. International Journal of Climatology. 2005;25:1965–1978. [Google Scholar]
- Huang X, Schmitt J, Dorn L, et al. The earliest stages of adaptation in an experimental plant population: strong selection on QTLs for seed dormancy. Molecular Ecology. 2010;19:1335–1351. doi: 10.1111/j.1365-294X.2010.04557.x. [DOI] [PubMed] [Google Scholar]
- Hulme M, Jenkins GJ, Lu X, et al. Climate change scenarios for the UK: the UKCIP02 scientific report. Norwich: Tyndall Centre; 2002. [Google Scholar]
- Jump AS, Peñuelas J. Running to stand still: adaptation and the response of plants to rapid climate change. Ecology Letters. 2005;8:1010–1020. doi: 10.1111/j.1461-0248.2005.00796.x. [DOI] [PubMed] [Google Scholar]
- Jurado E, Flores J. Is seed dormancy under environmental control or bound to plant traits? Journal of Vegetation Science. 2005;16:559–564. [Google Scholar]
- Kadereit G, Borsch T, Weising K, Freitag H. Phylogeny of Amaranthaceae and Chenopodiaceae and the evolution of C4 photosynthesis. International Journal of Plant Science. 2003;164:959–986. [Google Scholar]
- Kawecki TJ, Ebert D. Conceptual issues in local adaptation. Ecology Letters. 2004;7:1225–1241. [Google Scholar]
- Lampei C, Tielbörger K. Evolvability of between-year seed dormancy in populations along an aridity gradient. Biological Journal of the Linnean Society. 2010;100:924–934. [Google Scholar]
- Lebart L, Morineau A, Piron M. Statistique exploratoire multidimensionnelle. 2000:181–184. Ed. Dunod. [Google Scholar]
- Letschert JPW. Beta section Beta: biogeographical patterns of variation and taxonomy. Wageningen Agricultural University Papers. 1993;93:1–155. [Google Scholar]
- Li B, Foley ME. Genetic and molecular control of seed dormancy. Trends in Plant Science. 1997;2:384–389. [Google Scholar]
- Llorens L, Ponsa M, Gila L, Boirab H. Seasonality of seed production and germination trends of Fumana ericoides (Cistaceae) in the west semiarid Mediterranean region. Journal of Arid Environments. 2008;72:121–126. [Google Scholar]
- Mazer SJ, Schick CT. Constancy of population parameters for life history and floral traits in Raphanus sativus L. I. Norms of reaction and the nature of genotype by environment interactions. Heredity. 1991;67:143–156. [Google Scholar]
- Menzel A, Sparks TH, Estrella N, et al. European phenological response to climate change matches the warming pattern. Global Change Biology. 2006;12:1969–1976. [Google Scholar]
- Meyer SE, Allen PS. Ecological genetics of seed germination regulation in Bromus tectorum L. 1. Oecologia. 1999;120:27–34. doi: 10.1007/s004420050829. Phenotypic variance among and within populations. [DOI] [PubMed] [Google Scholar]
- Meyer SE, Monsen SB. Habitat-correlated variation in mountain big sagebrush (Artemisia tridentata ssp. vaseyana) seed germination pattern. Ecology. 1991;72:739–742. [Google Scholar]
- Moyers BT, Kane NC. The genetics of adaptation to novel environments: selection on germination timing in Arabidopsis thaliana. Molecular Ecology. 2010;19:1270–1272. doi: 10.1111/j.1365-294X.2010.04558.x. [DOI] [PubMed] [Google Scholar]
- Parmesan C, Yohe G. A globally coherent fingerprint of climate change impacts across natural systems. Nature. 2003;421:37–42. doi: 10.1038/nature01286. [DOI] [PubMed] [Google Scholar]
- Philippi T. Bet-hedging germination of desert annuals: variation among populations and maternal effects in Lepidium lasiocarpum. The American Naturalist. 1993;142:488–507. doi: 10.1086/285551. [DOI] [PubMed] [Google Scholar]
- Pohl-Orf M, Brand U, Driessen S, et al. Overwintering of genetically modified sugar beet, Beta vulgaris L. subsp. vulgaris, as a source for dispersal of transgenic pollen. Euphytica. 1999;108:181–186. [Google Scholar]
- Rakotomalala R. TANAGRA: un logiciel gratuit pour l'enseignement et la recherche. Actes de EGC'2005, RNTI-E-3. 2005;2:697–702. [Google Scholar]
- Rees M. Delayed germination of seeds: a look at the effects of adult longevity, the timing of reproduction, and population size/age structure. American Naturalist. 1994;144:43–64. [Google Scholar]
- Risberg L, Granström A. The effect of timing of forest fire on phenology and seed production in the fire-dependent herbs Geranium bohemicum and G. lanuginosum in Sweden. Forest Ecology and Management. 2009;257:1725–1731. [Google Scholar]
- Sautu A, Baskin JM, Baskin CC, Condit R. Studies on the seed biology of 100 native species of trees in a seasonal moist tropical forest, Panama, Central America. Forest Ecology and Management. 2006;234:245–263. [Google Scholar]
- Scholten M, Donahue J, Shaw NL, Serpe MD. Environmental regulation of dormancy loss in seeds of Lomatium dissectum (Apiaceae) Annals of Botany. 2009;103:1091–1101. doi: 10.1093/aob/mcp038. [DOI] [PMC free article] [PubMed] [Google Scholar]
- Schütz W, Milberg P. Seed dormancy in Carex canescens: regional differences and ecological consequences. Oikos. 1997;78:420–428. [Google Scholar]
- Sester M, Dürr C, Darmency H, Colbach N. Evolution of weed beet (Beta vulgaris L.) seed bank: quantification of seed survival, dormancy, germination and pre-emergence growth. European Journal of Agronomy. 2006;24:19–25. [Google Scholar]
- Simons AM, Johnston MO. Environmental and genetic sources of diversification in the timing of seed germination: implications for the evolution of bet hedging. Evolution. 2006;60:2280–2292. [PubMed] [Google Scholar]
- Sokal RR, Rohlf FJ. Biometry. 3rd edn. New York: W. H. Freeman; 1995. [Google Scholar]
- Tobias RD. An introduction to partial least squares regression. 2003 UCLA Academic Technology Services online publication, http://www.ats.ucla.edu/stat/sas/library/pls.pdf . [Google Scholar]
- Van Dijk H, Boudry P, McCombie H, Vernet Ph. Flowering time in wild beet (Beta vulgaris ssp. maritima) along a latitudinal cline. Acta Oecologica. 1997;18:47–60. [Google Scholar]
- Van Dijk H, Hautekèete N. Long day plants and the response to global warming: rapid evolutionary change in day length sensitivity is possible in wild beet. Journal of Evolutionary Biology. 2007;20:349–357. doi: 10.1111/j.1420-9101.2006.01192.x. [DOI] [PubMed] [Google Scholar]
- Van Dijk H. Ageing effects in an iteroparous plant species with a variable life span. Annals of Botany. 2009;104:115–124. doi: 10.1093/aob/mcp100. [DOI] [PMC free article] [PubMed] [Google Scholar]
- Van Klinken RD, Lukitsch B, Cook C. Interaction between seed dormancy-release mechanism, environment and seed bank strategy for a widely distributed perennial legume. Parkinsonia aculeata (Caesalpinaceae). Annals of Botany. 2008;102:255–264. doi: 10.1093/aob/mcn087. [DOI] [PMC free article] [PubMed] [Google Scholar]
- Venable DL. Bet hedging in a guild of desert annuals. Ecology. 2007;88:1086–1090. doi: 10.1890/06-1495. [DOI] [PubMed] [Google Scholar]
- Vleeshouwers LM, Bouwmeester HJ, Karssen CM. Redefining seed dormancy: an attempt to integrate physiology and ecology. Journal of Ecology. 1995;83:1031–1037. [Google Scholar]
- Wagmann K, Hautekèete N-C, Piquot Y, Van Dijk H. Potential for evolutionary change in the seasonal timing of germination in sea beet (Beta vulgaris ssp. maritima) mediated by seed dormancy. Genetica. 2010;138:763–773. doi: 10.1007/s10709-010-9457-9. [DOI] [PubMed] [Google Scholar]
- Walther G-R, Post E, Convey P, et al. Ecological responses to recent climate change. Nature. 2002;416:389–395. doi: 10.1038/416389a. [DOI] [PubMed] [Google Scholar]
Associated Data
This section collects any data citations, data availability statements, or supplementary materials included in this article.