Abstract
Positron emission tomography (PET) allows detection of functional changes in malignant tissue. Establishment of an immortalized immunocompetent breast cancer mouse model would provide a useful platform for the analysis of novel cancer treatment strategies. This study describes a comparative functional evaluation of murine breast cancer models established from polyoma virus middle T antigen (PyMT)-derived tumors using small animal PET imaging with [18F]FDG and [18F]FLT. Primary PyMT tumor-derived cells and a cell line derived from these tumors (MTHJ) were injected subcutaneously into immunocompetent FVB mice to generate breast cancer xenografts. Tumor growth rates were comparable in both models and tumors were analyzed after 4-5 weeks post-injection. [18F]FDG uptake in vitro followed a comparable trend in both models but reached higher uptake levels in primary PyMT cells vs. MTHJ cells after 120 min. At all time points, [18F]FLT uptake was significantly higher in MTHJ compared to primary PyMT cells. Dynamic small animal PET imaging with [18F]FDG revealed standardized uptake values (SUVs) of 2.5±0.1 (n=8) in tumors from primary cells and 2.8±0.4 (n=6) in MTHJ tumors after 60 min p.i.. The corresponding tumor-muscle-ratios were 9.3±1.5 and 10.4±0.9, respectively. Uptake of [18F]FLT resulted in slightly higher SUV60min in MTHJ tumors (1.1±0.1, n=6) compared to tumors from primary cells (SUV60min=0.9±0.05, n=8, p=0.07). The tumor-muscle-ratio was comparable in both tumors (2.1±0.2 and 1.8±0.1, respectively). The PET imaging data demonstrates that the functional profile of immunocompetent murine breast tumor model MTHJ remains the same as in primary-derived PyMT tumors in vivo. Metabolic and proliferative rates as assessed with [18F]FDG and [18F]FLT are comparable in both tumor models. The observed high SUV60min of 2.8±0.4 with [18F]FDG in MTHJ tumors allows one to monitor efficacy of therapeutic interventions connected with changes in metabolic response of the tumor by means of small animal PET.
Keywords: Polyoma virus middle T antigen (PyMT), breast cancer, PET, [18F]FDG, [18F]FLT, mouse model
Introduction
Breast cancer is the leading malignancy and second leading cause of cancer mortality in women [1]. Over the last decade achievements in early diagnosis and novel treatment strategies have improved the clinical outcome. Several imaging methods are currently used for early detection, including morphological mapping such as X-ray mammography, computed tomography (CT), magnetic resonance imaging (MRI), and ultrasound. Functional imaging of breast cancer is performed with nuclear molecular imaging techniques like single photon emission computed tomography (SPECT) and positron emission tomography (PET) [2,3].
PET allows assessment of changes in the metabolic rate of tumors at high sensitivity. In the clinic, enhanced glucose uptake and high aerobic glycolysis in tumor cells (Warburg effect) is used for the detection of primary tumors and metastases, as well as for monitoring tumor metabolism in response to therapy using 2-deoxy-2-[18F]fluoro-D-glucose ([18F]FDG) [4,5]. [18F]FDG enters the cells through specific glucose transporters, mainly GLUT1, which exhibit altered expression levels during malignant transformation [6]. [18F]FDG is subsequently phosphorylated by hexokinase, which leads to intracellular trapping [7]. However, [18F]FDG also accumulates in non-malignant tissues like inflammatory lesions which can lead to false positive results. Moreover, the poor spatial resolution of PET also limits the detection of small tumors [8]. Besides [18F]FDG, alternative PET radiotracers targeting different receptors, transporters or enzymes over-expressed in breast cancer cells have been developed [9]. A prominent example includes 3’-deoxy-3’-[18F] fluorothymidine ([18F]FLT) as a marker for proliferative activity [10,11]. [18F]FLT is an analog of thymidine, which is phosphorylated by thymidine kinase 1 (TK 1) within the cytosol, but not incorporated into DNA. TK 1 is a cell cycle regulated enzyme with particularly high expression levels during S phase. In many malignant lesions, TK 1 is constitutively up-regulated. [18F] FLT is a selective substrate for TK 1. Intracellular trapping of [18F]FLT is governed by the formation of mono-, di- and triphosphate nucleotides. Phosphorylation of [18F]FLT through TK 1 is dominant to competitive de-phosphorylation processes and subsequent efflux from the cell [12]. Several clinical studies have reported the usefulness of [18F]FDG-PET and [18F]FLT-PET for monitoring efficacy of therapeutic interventions in breast cancer [13-17].
Development of novel strategies in cancer therapy requires extensive pre-clinical experiments before translation into clinical application with cancer patients. For the preclinical development of novel anti-cancer therapies the selection, establishment and characterization of a suitable animal model represents a critical key step [18].
The mouse mammary adenocarcinoma cell line MTHJ represents a specific immunocompetent murine breast cancer model. This cell line was derived by in vitro serial passaging of tumor cells explanted from a transgenic mouse carrying the polyoma virus middle T antigen (PyMT) regulated by the mouse mammary tumor virus (MMTV) promoter. These transgenic mice (FVB/N-Tg (MMTV-PyVT) 634Mul/J, The Jackson Laboratory) spontaneously develop mammary epithelial adenocarcinoma [19,20]. Tumors arising from these mice represent a well-characterized model for the development and progression of human breast cancer. The model covers various stages of tumorigenesis and progression ranging from pre-malignancy to all neoplastic stages in the primary tumor, including the malignant transition producing a high frequency of distant metastasis, which reflect the development of human breast cancer [21]. In addition to these morphological similarities, expression profile of several biomarkers (e.g. loss of estrogen and progesterone receptors during progression into the malignant stage of PyMT-induced tumors) is comparable to that of human breast cancer cells. MTHJ cells derived from PyMT transgenic mouse breast tumors have been shown to be tumorigenic, and have been used to analyze anti-tumor immunity induced by oncolytic viruses [22].
The goal of the present study was the functional characterization of the immunocompetent mouse tumor model MTHJ utilizing PET radiotracers [18F]FDG and [18F]FLT in direct comparison with tumors developed from primary PyMT cells. The systematic evaluation of both tumor models in vitro and in vivo by means of PET should provide insights on metabolic and proliferative activity in established vs. primary PyMT tumor cells. The results of this study should be of importance for the further use of the MTHJ model to investigate efficacy of novel anti-cancer treatment strategies, such as gene therapy, in the framework of preclinical studies.
Materials and methods
Chemicals and radiotracer
All chemicals used for in vitro cell uptake and solutions for the preparation for the injections for the in vivo experiments were purchased from Fisher Scientific or Sigma Aldrich. The PET radiotracers [18F]FDG and [18F]FLT were prepared at the Edmonton PET Center of the Cross Cancer Institute. [18F]FDG was synthesized according to Hamacher et al. using a TracerLab MX automated synthesis unit from G.E. Healthcare [35,36]. Radiosynthesis of [18F]FLT was carried out according to the procedure reported by Machulla et al. [37].
Cell lines
Primary tumor cells (PyMT) were isolated as described [20] from 16-20 week old FVB/N-Tg (MMTV-PyVT) 634Mul/J transgenic mice [21] bearing spontaneous adenocarcinomas of the mammary epithelium. The stable MTHJ cell line was established by continuous culture of PyMT tumor explants. At early passages, fibroblasts were removed by light trypsinization [22]. PyMT and MTHJ cells were maintained in high glucose Dulbecco’s Modified Eagle Medium (DMEM) supplemented with 10% fetal bovine serum (FBS), 100 U/mL penicillin, 100 μg/mL streptomycin, 250 ng/mL fungizone and 2 mM L-glutamine. All media was purchased from Sigma Chemicals and all supplements were purchased from Gibco.
Tumor model
All animal experiments were carried out in accordance with guidelines of the Canadian Council on Animal Care (CCAC) and were approved by the local animal care committee of the Cross Cancer Institute. Six week old female FVB mice (Charles River) were injected subcutaneously in both flanks with either explanted primary PyMT-expressing murine breast cancer cells (5x10⁵ or 1x10⁶ cells/flank) or cultured MTHJ cells (5x10⁵, 2.5x10⁶ or 5x10⁶ cells/flank) and monitored for tumor formation. Animals were housed in sterile surroundings with standardized light/dark cycle and access to food and water ad libitum. Tumor growth was measured in three dimensions using digital calipers and the size calculated using the formula for the volume of a typical ellipsoid: Tvol = π/6 x width x length x depth [38]. Tumor-bearing mice were euthanized at the study end point or sooner if tumor burden endpoint was reached (defined as tumor volume ≥10% of mouse body weight). No spontaneous regression was observed using either the primary cell- or established cell line-based PyMT tumor model.
In vitro radiotracer cell uptake study
Primary PyMT cells and passaged MTHJ cells were grown to ~80 - 90% confluency in 12-well tissue culture plates in a CO2 incubator at 37°C, in high glucose Dulbecco’s Modified Eagle Medium (DMEM) supplemented with fetal bovine serum (FBS), penicillin, streptomycin, fungizone, and L-glutamine as described above with media renewal every 2-3 days. One hour prior to the experiment, the medium was removed and the cells were washed twice with phosphate-buffered saline solution (PBS). Next, cells were washed with glucose-free Krebs-Ringer solution (120 mM NaCl, 4 mM KCl, 1.2 mM KH2PO4, 2.5 mM MgSO4, 25 mM NaHCO3, 70 μM CaCl2, pH 7.4). 300 μl glucose-free Krebs-Ringer solution, with 0.1-0.5 MBq [18F]FDG or [18F]FLT, was added to each well and the plates were incubated at 37°C for specific periods of time (5, 10, 15, 30, 45, 60, 90 and 120 min). After incubation, cells were rinsed twice with ice-cold Krebs-Ringer solution to stop radiotracer uptake and then immediately lysed using 500 μl of 5% trichloracetic acid. Radioactivity in the cell lysate was counted in a γ-counter (Wallac 1480 Wizard-3, Perkin-Elmer). Protein levels were quantified using the BCA protein assay kit (Pierce) according to the manufacturer’s recommendations with bovine serum albumin as the protein standard. Cell uptake levels are expressed as a percent of input radioactivity (=100%) normalized to mg lysate protein [% radioactivity / mg protein].
In vivo small animal PET experiments
For the PET imaging studies female FVB mice were injected subcutaneously in the lower left flank and the upper right flank close to the shoulder with either 5x10⁵ primary PyMT cells or 106 MTHJ cells in 0.1 mL PBS per injection site. Tumor-bearing mice were used for the PET experiments after 4-5 weeks of tumor growth reaching ~160 mm3 in size for primary PyMT and ~70 mm3 for MTHJ tumors. The mice were fasted for 3-4 hours prior to the imaging experiments using [18F]FDG. The animals were anesthetized through inhalation of isoflurane in 40% oxygen / 60% nitrogen (gas flow, 1 L/min). Mice were positioned and immobilized in the prone position with their medial axis parallel to the axial axis of the scanner in the centre of the field of view of the microPET® R4 scanner (Siemens Preclinical Solutions). A transmission scan for attenuation correction was not acquired. The amount of radioactivity present in the injection solution in a 0.5 ml syringe was determined with a dose calibrator (AtomlabTM 300, Biodex Medical Systems), which was cross calibrated with the scanner. The emission scan of 60 min PET acquisition was started. After a delay of approximately 15 s, 5-8 MBq of either [18F]FDG or [18F]FLT in 100-150 μl saline was injected through a needle catheter into the tail vein. Data acquisition continued for 60 min in 3D list mode. The list mode data were sorted into sinograms with 53 time frames (10x2 s, 8x5 s, 6x10 s, 6x20 s, 8x60 s, 10x120 s, 6x300 s). The frames were reconstructed using the Ordered Subset Expectation Maximization applied to the 2D sinograms (2D OSEM) and maximum a posteriori (MAP). The pixel size was 0.085 by 0.085 by 0.12 cm and the resolution in the centre field of view was 1.8 mm. No correction for partial volume effects was performed. The image files were further processed using the ROVER v2.0.30 software (ABX GmbH). Masks for defining 3D regions of interest (ROI) over tumors and the muscle tissue on the contra lateral axilla were set and the ROI’s were defined by thresholding. ROI time-activity curves (TACs) were generated for subsequent data analysis. Standardized uptake values (SUV= [activity/mL tissue] / [injected activity/body weight]) were calculated for each ROI.
Data analysis
All data are expressed as means ± S.E.M. from n investigated animals or cell experiments. All tumor growth curves and TACs were constructed using GraphPad Prism® 4.0 (GraphPad Software). Where applicable, statistical differences were tested by Student’s t-test and were considered significant for p<0.05.
Results
Tumor models
In total, 24 female FVB mice were injected in both flanks with the indicated concentrations of either primary explants of PyMT-derived tumors, or MTHJ cells passaged 20 to 30 times in culture. After 14 days tumors were palpable and were measured twice weekly until 39 days post-injection (Figure 1). All groups showed elevated tumor growth after 24 days, with similar growth rates observed for all groups. Only injection with 1x10⁶ PyMT-derived cells resulted in larger tumor sizes after 39 days of tumor cell injection.
Figure 1.
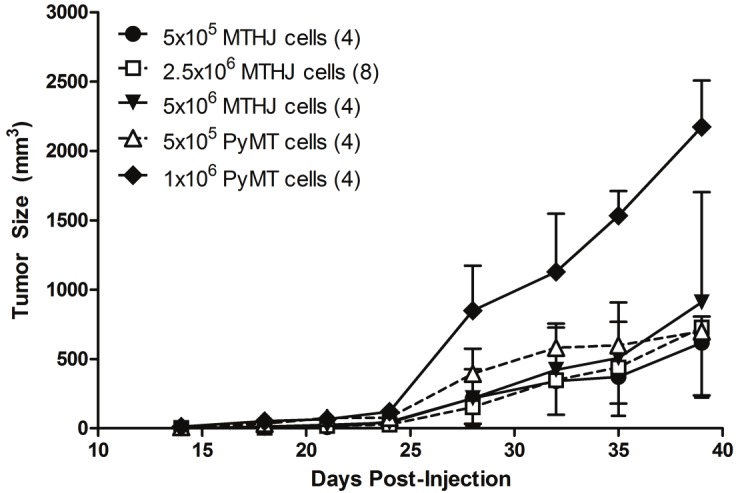
Tumor growth following injection of the indicated numbers of MTHJ or primary PyMT tumor cells subcutaneously into the shoulders of FVB mice. Tumors are measured as described in the Materials and Methods section. The mean tumor volumes ± S.D. are shown (at least 4 animals per group).
In vitro studies
Radiotracer cell uptake into primary PyMT and cultured MTHJ cells was analyzed over a time period of 120 min. Uptake of [18F]FDG and [18F] FLT continuously increased over the entire time course of the experiment (Figure 2). Uptake of [18F]FDG was comparable for primary PyMT and MTHJ cells within the first 60 min. After 90 and 120 min, primary PyMT cells showed higher [18F]FDG uptake reaching an uptake value of 1321±26% radioactivity / mg protein (n=3) vs. 1048±48% radio-activity / mg protein (n=3; p<0.01) in MTHJ cells (Figure 2, top). Conversely, [18F]FLT uptake was significantly lower in primary PyMT cells compared to MTHJ cells at all time points during the study reaching uptake values of 99±8% radioactivity / mg protein (n=3) in primary cells and 306±21% radioactivity / mg protein (n=3; p<0.001) in MTHJ cells, respectively, after 120 min (Figure 2, bottom).
Figure 2.
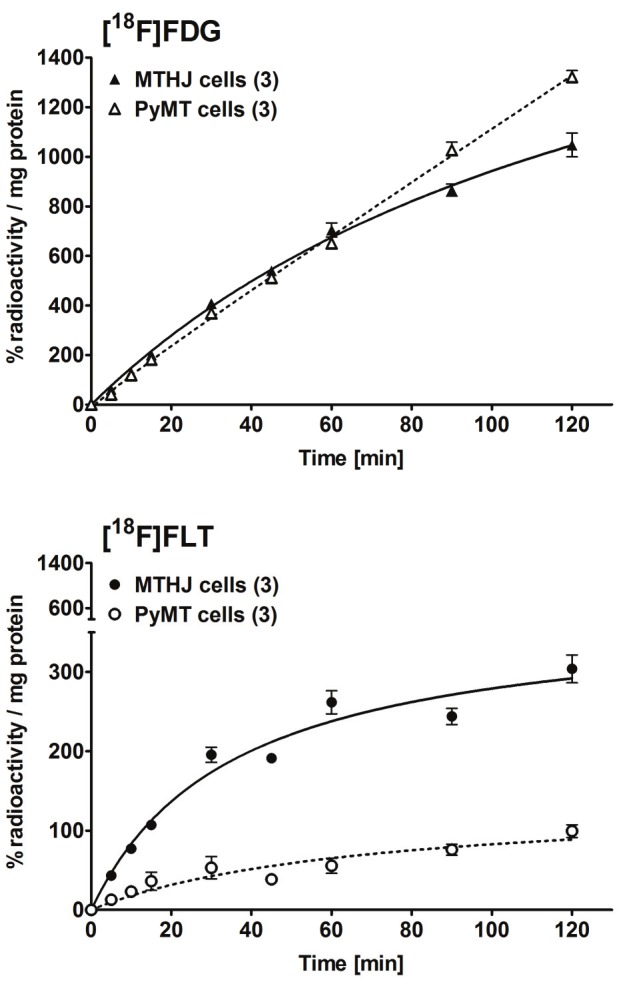
In vitro cell uptake of [18F]FDG (top) and [18F]FLT (bottom) in cultured MTHJ cells and primary PyMT cells. Data are shown as mean % radioactivity / mg protein ± S.E.M. from triplicate samples in 3 separate experiments.
In vivo radiotracer uptake in tumors from MTHJ and primary PyMT cells
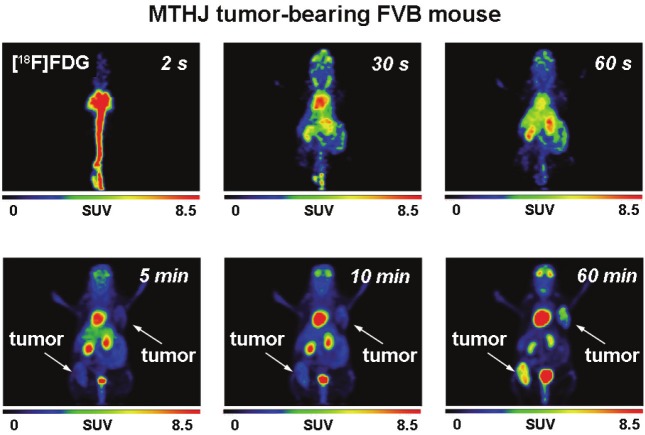
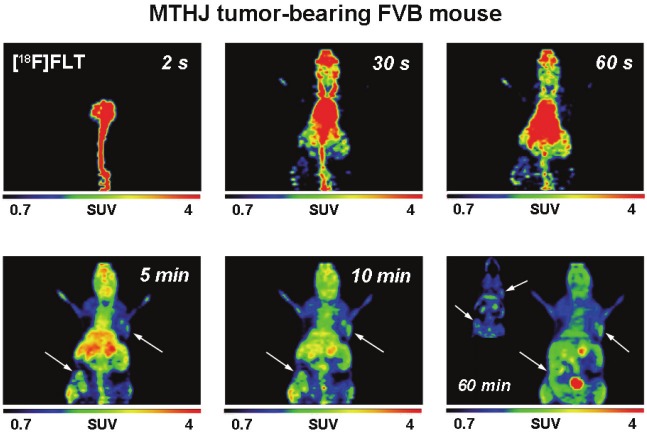
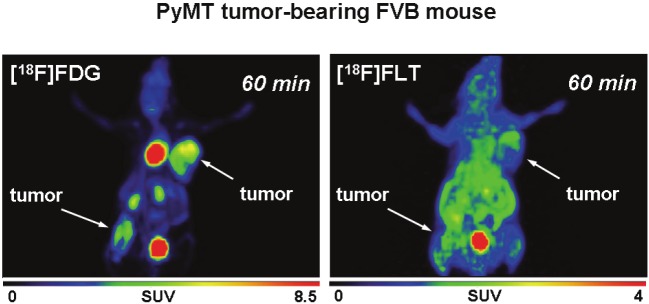
After analysis of radiotracer uptake in vitro, [18F] FDG and [18F]FLT uptake was studied in subcutaneously grown tumors from MTHJ and primary PyMT cells in vivo. Dynamic small animal PET experiments showed increasing uptake of [18F] FDG in MTHJ tumors over a 60 min time period (Figure 3). As demonstrated in representative PET images, tumors started to become visible after 1 min p.i. of [18F]FDG. After 60 min p.i., both tumors (one on the shoulder and one on the lower flank) were clearly visible. Both tumors could be delineated from surrounding tissue. SUV analysis of [18F]FDG uptake in both tumors at 60 min p.i. revealed a SUV of 2.8±0.4 (n=6 tumors from three animals). Figure 4 shows representative small animal PET images of [18F]FLT uptake in MTHJ tumors in the same animal that was used the following day for the [18F]FDG experiment. [18F]FLT was taken up into both tumors, and the tumor became visible at 5 min p.i.. SUV reached a value of 1.1±0.1 (n=6) at 60 min p.i.. Similar to MTHJ tumor-bearing mice, dynamic small animal PET studies were performed using [18F]FDG and [18F]FLT in mice bearing tumors from primary PyMT cells. Figure 5 illustrates small animal PET images after 60 min p.i. of [18F]FLT and 24 h later with [18F]FDG, respectively. SUVs of 2.5±0.1 (n=8) and 0.9±0.05 (n=8) were determined for [18F]FDG and [18F]FLT at 60 min p.i. for these PyMT tumors.
Figure 3.
Representative dynamic small animal PET images (up to 60 min) of [18F]FDG (7.2 MBq injected dose) in a FVB mouse bearing two MTHJ tumors. Images are presented as maximum intensity projections.
Figure 4.
Representative dynamic small animal PET images (up to 60 min) of [18F]FLT (4.5 MBq injected dose) in thesame FVB mouse as shown in Figure 3 bearing two MTHJ tumors. [18F]FLT was measured 24 h prior the [18F]FDGscan. Images are presented as maximum intensity projections. The inset in the 60 min image consist of a coronalsection to allow a better visualization of the tumor on the left lower flank.
Figure 5.
Representative PET imagesat 60 min p.i. of [18F]FDG (6 MBqinjected dose) and [18F]FLT (5 MBqinjected dose) in the same FVBmouse bearing two tumors from primaryPyMT cells. [18F]FDG was measured24 h after the [18F]FLT scan.Images are presented as maximumintensity projections.
Time-activity curves (TACs) were generated for the uptake of both radiotracers in bilateral tumors and in muscle as reference tissue from 3 different mice bearing the MTHJ model and 4 different mice bearing PyMT tumors from primary cells (Figure 6). While [18F]FDG uptake in both tumor models increased continuously over time, uptake of [18F]FLT reached a plateau after approximately 5 to 10 min p.i.. [18F]FLT uptake remained constant over the remaining total scanning time of 60 min. Uptake of [18F]FDG was similar in MTHJ and PyMT tumors from primary cells. In contrast, uptake of [18F]FLT seemed to be slightly lower in tumors from primary cells vs. MTHJ tumors, which is in good agreement with the observed lower cell uptake of [18F]FLT in primary cells in vitro. However, this difference did not reach significance (p=0.071).
Figure 6.
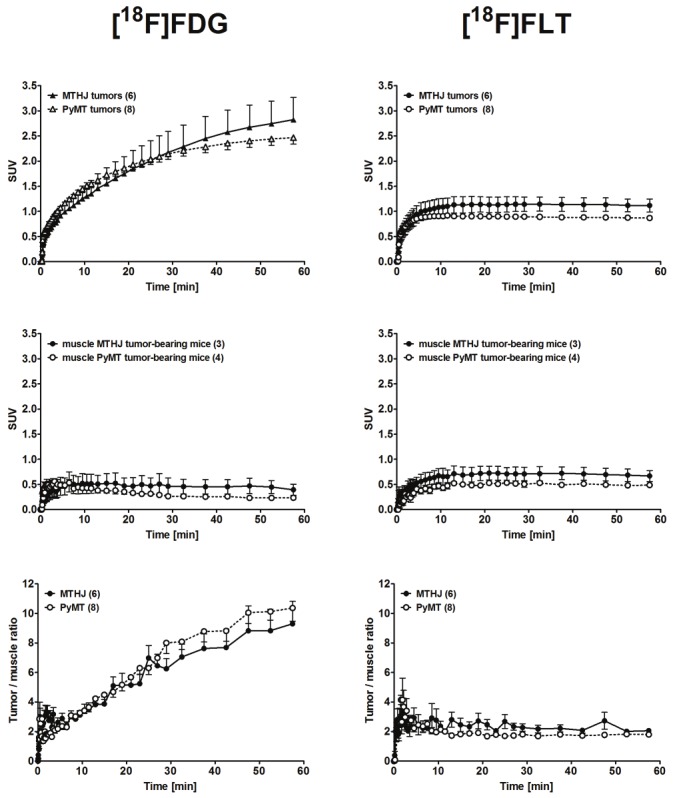
Time-activity curves (TAC) of the radioactivity profile in MTHJ- and primary PyMT cell-derived tumor bearing FVB mice. TACs are shown for the tumors (upper panels), muscle tissue (analyzed from the opposite shoulder region) of the same FVB mice (middle panels), and tumor/muscle ratios (lower panels) after single intravenous injections of [18F]FDG (left) or [18F]FLT (right). Data are shown as means ± S.E.M. from 6 MTHJ tumors in 3 tumor-bearing mice and for 8 primary PyMT cell-derived tumors in 4 tumor-bearing mice.
[18F]FDG uptake in muscle tissue cleared slowly over time, while [18F]FLT showed no clearance within the timeframe of the study (Figure 6). Based on the uptake and clearance patterns of both radiotracers in tumor and muscle tissue, tumor-muscle ratios were calculated (Figure 6). In both tumor models tumor-muscle ratios increased continuously over time for [18F]FDG, but remained nearly constant in the case of [18F] FLT. The tumor-muscle ratios over time were comparable in tumors from MTHJ and primary PyMT cells for each radiotracer studied.
Discussion
The ultimate goal of the present study was to determine whether the tumor model established from cultivated MTHJ cells would be functionally different from a model established from primary PyMT-derived mammary tumor cells. The study should provide a reasonable platform to assess suitability of MTHJ as a pre-clinical breast cancer model using functional imaging with PET. To assess the models, we examined tumor growth, evaluated tracer uptake in vitro and studied the two types of PyMT-based mouse tumors in vivo with small animal PET imaging. The experimental data indicate that (i) MTHJ cells readily form subcutaneous tumors at a high implantation rate with growth rates similar to that of the primary PyMT cells, (ii) MTHJ and primary PyMT cells show similar cell uptake pattern using [18F]FDG whilst higher uptake was observed for [18F]FLT in MTHJ cells, (iii) MTHJ- and primary PyMT-derived tumors showed comparable uptake of [18F]FDG and [18F]FLT, respectively, in vivo. This is indicative that there are no significant differences in metabolic and proliferation rates in both tumor models in vivo.
These results, along with the known biological signatures of the PyMT transgenic mouse model to human breast cancer [21], indicate that the immunocompetent murine MTHJ breast cancer mouse model should be very useful for the evaluation of novel anti-cancer therapies utilizing preclinical PET imaging.
Consistent with previous studies [22], cultured MTHJ cells were able to form palpable tumors in FVB mice. Growth of these cells in vivo was generally comparable to that of primary PyMT-derived cells, although the former was somewhat slower when high concentrations of cell inoculants are compared. Since growth of MTHJ cells can easily be scaled up, MTHJ cells are less heterogeneous than primary tumor explants, and they do not require a continuous supply of animals as donors of tumor tissue, we propose that the MTHJ cell line is a valuable resource to study novel therapeutic interventions directed against breast cancer in an immunocompetent mouse model. Furthermore, slower growing tumors are preferable to allow analysis of the time course of treatment efficacy by means of PET imaging.
MTHJ cells showed three times higher uptake of [18F]FLT compared to primary PyMT cells in vitro which is indicative of a higher proliferation rate in the cultivated MTHJ cells. In both cell lines glucose metabolism was highly active as evidenced by the observed high [18F]FDG uptake. However, after ³80 min incubation time small differences were detectable between MTHJ and primary PyMT cells suggesting a slightly higher metabolic rate of glucose in primary PyMT cells. Comparable high cellular [18F]FDG uptake levels as found during this study were observed for mouse EMT-6 mammary cells in vitro [23]. However, human breast cancer cell lines such as MCF-7 showed lower [18F]FDG uptake presumably reflecting lower metabolic rates of glucose in these tumors [24].
Dynamic small animal PET imaging studies revealed high [18F]FDG uptake in MTHJ tumors without reaching a plateau within 60 min p.i.. Primary PyMT cell-derived tumors also showed a comparable [18F]FDG uptake pattern in vivo which confirms the results from the in vitro studies. In comparison to the murine EMT-6 mammary tumor model, tumors from MTHJ cells as well as primary PyMT cells reached very high SUV levels of almost 3 for [18F]FDG after 60 min p.i. [23,25]. Small animal PET studies with EMT-6 tumors demonstrated standard uptake values for [18F]FDG in the range of 0.9 to 2 after 60 min p.i. [26,27]. A recent comprehensive and systematic study which compared [18F]FDG and [18F]FLT uptake profiles of several human tumor xenograft models reported mean SUVs of 0.3-1.59 for [18F]FDG after 65 min p.i. [28]. All mice were fasted for 4-8 h prior to injection of [18F]FDG. With mean SUVs of 2.5-2.8 in mice that were not fasted, the MTHJ and PyMT models seem to have a much higher glucose metabolic rate and therefore may represent valuable pre-clinical mammary tumor models for the analysis of therapeutic interventions.
Uptake of [18F]FLT was somewhat different in tumors from MTHJ and primary PyMT cells, although data analysis did not reach a significant level. As primary PyMT cells showed a lower [18F]FLT uptake level than MTHJ cells, the PyMT tumors seem to have a slightly lower proliferation rate in vivo. Interestingly, SUVs of 0.9-1.1 for [18F]FLT in both types of tumors are in the same range (0.2-1.4) as determined in several other studies [28-30].
Tumors derived from cultured MTHJ and primary PyMT cells showed a comparable radiotracer uptake profile for [18F]FDG and [18F]FLT which is indicative of comparable metabolic and proliferation rates in both tumors. The MTHJ tumor model represents a good and reliable preclinical mouse mammary tumor model for the analysis of the efficacy of therapeutic interventions. A systematic functional baseline in vivo characterization of a given tumor model is an important prerequisite for the design of a preclinical anti-cancer therapy study [28].
A further advantage of the MTHJ model is the complete immunocompetence of the mice. Most preclinical testing of novel anti-cancer therapeutics for breast cancer treatment is carried out in nude or SCID mice bearing human breast cancer xenografts [18,31-33]. Nude mice, however, are immunodeficient and thus are not as comparable to the breast cancer patient, whose immune system may enhance or repress the efficacy of therapy. In particular, the immune system may play a major role in the efficacy of oncolytic viruses and viral gene therapy vectors [34]. Other mouse cell lines, such as MT1A2 cells, have been studied as immunocompetent murine models for breast cancer. However, no PET imaging was used for characterization of the MT1A2 cell line. Furthermore, in our hands spontaneous regression of MT1A2 tumors occurred at a sufficiently high frequency to confound efficacy studies. Tumors of other immunocompetent murine models, such as those derived from 4T1 cells, demonstrate a very high growth rate. Therefore, both MT1A2 and 4T1 models seem to be less attractive than MTHJ for longitudinal mouse breast cancer studies.
In conclusion, the immunocompetent murine MTHJ breast tumor model, which has high biological relevance to human breast cancer, is functionally similar to the primary PyMT tumor model based on glucose metabolism and proliferation pattern. The observed high SUV levels for [18F]FDG (SUV ~3) and reasonable SUVs for [18F]FLT (SUV ~1) underscore the potential of this pre-clinical mouse model for the analysis and monitoring of novel therapeutic strategies by means of PET.
Acknowledgements
The authors would like to thank John Wilson, David Clendening, Jayden Sader and Blake Lazurko from the Edmonton PET Center for providing 18F produced on a biomedical cyclotron, Jeff McPherson and Angela Westover for production of [18F]FDG and Ali Akbari for the synthesis of [18F]FLT. In addition we thank Kate Agopsowicz for assistance with in vitro work, Gail Hipperson and Dan McGinn from the Vivarium of the Cross Cancer Institute for assisting in animal handling and Hans-Sonke Jans from the Div. of Medical Physics for support of PET data analysis. This work was supported by grants from the Alberta Cancer Foundation (ACF) and the Canadian Breast Cancer Foundation (CBCF).
References
- 1.Czernin J, Benz MR, Allen Auerbach MS. Breast cancer. Methods Mol Biol. 2011;727:141–70. doi: 10.1007/978-1-61779-062-1_9. [DOI] [PubMed] [Google Scholar]
- 2.Mankoff DA. Molecular imaging as a tool for translating breast cancer science. Breast Cancer Res. 2008;10(Suppl 1):S3. doi: 10.1186/bcr2126. [DOI] [PMC free article] [PubMed] [Google Scholar]
- 3.Tafreshi NK, Kumar V, Morse DL, Gatenby RA. Molecular and functional imaging of breast cancer. Cancer Control. 2010;17:143–55. doi: 10.1177/107327481001700302. [DOI] [PubMed] [Google Scholar]
- 4.Lee JH, Rosen EL, Mankoff DA. The role of radiotracer imaging in the diagnosis and management of patients with breast cancer: part 1-overview, detection, and staging. J Nucl Med. 2009;50:569–81. doi: 10.2967/jnumed.108.053512. [DOI] [PubMed] [Google Scholar]
- 5.Lee JH, Rosen EL, Mankoff DA. The role of radiotracer imaging in the diagnosis and management of patients with breast cancer: part 2-response to therapy, other indications, and future directions. J Nucl Med. 2009;50:738–48. doi: 10.2967/jnumed.108.061416. [DOI] [PubMed] [Google Scholar]
- 6.Flier JS, Mueckler MM, Usher P, Lodish HF. Elevated levels of glucose transport and transporter messenger RNA are induced by ras or src oncogenes. Science. 1987;235:1492–5. doi: 10.1126/science.3103217. [DOI] [PubMed] [Google Scholar]
- 7.Macheda ML, Rogers S, Best JD. Molecular and cellular regulation of glucose transporter (GLUT) proteins in cancer. J Cell Physiol. 2005;202:654–62. doi: 10.1002/jcp.20166. [DOI] [PubMed] [Google Scholar]
- 8.Escalona S, Blasco JA, Reza MM, Andradas E, Gomez N. A systematic review of FDG-PET in breast cancer. Med Oncol. 2010;27:114–29. doi: 10.1007/s12032-009-9182-3. [DOI] [PubMed] [Google Scholar]
- 9.Fleming IN, Gilbert FJ, Miles KA, Cameron D. Opportunities for PET to deliver clinical benefit in cancer: breast cancer as a paradigm. Cancer Imaging. 2010;10:144–52. doi: 10.1102/1470-7330.2010.0020. [DOI] [PMC free article] [PubMed] [Google Scholar]
- 10.Sundararajan L, Linden HM, Link JM, Krohn KA, Mankoff DA. 18F-Fluoroestradiol. Semin Nucl Med. 2007;37:470–6. doi: 10.1053/j.semnuclmed.2007.08.003. [DOI] [PubMed] [Google Scholar]
- 11.Buck AK, Schirrmeister H, Mattfeldt T, Reske SN. Biological characterisation of breast cancer by means of PET. Eur J Nucl Med Mol Imaging. 2004;31(Suppl 1):S80–7. doi: 10.1007/s00259-004-1529-6. [DOI] [PubMed] [Google Scholar]
- 12.Reske SN, Deisenhofer S. Is 3'-deoxy-3'-(18)F-fluorothymidine a better marker for tumour response than (18) F-fluorodeoxyglucose? Eur J Nucl Med Mol Imaging. 2006;33(Suppl 1):38–43. doi: 10.1007/s00259-006-0134-2. [DOI] [PubMed] [Google Scholar]
- 13.Schelling M, Avril N, Nahrig J, Kuhn W, Romer W, Sattler D, Werner M, Dose J, Janicke F, Graeff H, Schwaiger M. Positron emission tomography using [(18)F] Fluorodeoxyglucose for monitoring primary chemotherapy in breast cancer. J. Clin. Oncol. 2000;18:1689–95. doi: 10.1200/JCO.2000.18.8.1689. [DOI] [PubMed] [Google Scholar]
- 14.Pio BS, Park CK, Pietras R, Hsueh WA, Satyamurthy N, Pegram MD, Czernin J, Phelps ME, Silverman DH. Usefulness of 3'-[F-18] fluoro-3'-deoxythymidine with positron emission tomography in predicting breast cancer response to therapy. Mol Imaging Biol. 2006;8:36–42. doi: 10.1007/s11307-005-0029-9. [DOI] [PubMed] [Google Scholar]
- 15.Dehdashti F, Mortimer JE, Trinkaus K, Naughton MJ, Ellis M, Katzenellenbogen JA, Welch MJ, Siegel BA. PET-based estradiol challenge as a predictive biomarker of response to endocrine therapy in women with estrogen-receptor-positive breast cancer. Breast Cancer Res Treat. 2009;113:509–17. doi: 10.1007/s10549-008-9953-0. [DOI] [PMC free article] [PubMed] [Google Scholar]
- 16.Dawson LA, Sharpe MB. Image-guided radiotherapy: rationale, benefits, and limitations. Lancet Oncol. 2006;7:848–58. doi: 10.1016/S1470-2045(06)70904-4. [DOI] [PubMed] [Google Scholar]
- 17.Kurdziel KA, Kalen JD, Hirsch JI, Wilson JD, Agarwal R, Barrett D, Bear HD, McCumiskey JF. Imaging multidrug resistance with 4-[18F] fluoropaclitaxel. Nucl Med Biol. 2007;34:823–31. doi: 10.1016/j.nucmedbio.2007.04.011. [DOI] [PubMed] [Google Scholar]
- 18.Kim JB, O'Hare MJ, Stein R. Models of breast cancer: is merging human and animal models the future? Breast Cancer Res. 2004;6:22–30. doi: 10.1186/bcr645. [DOI] [PMC free article] [PubMed] [Google Scholar]
- 19.Guy CT, Cardiff RD, Muller WJ. Induction of mammary tumors by expression of polyomavirus middle T oncogene: a transgenic mouse model for metastatic disease. Mol Cell Biol. 1992;12:954–61. doi: 10.1128/mcb.12.3.954. [DOI] [PMC free article] [PubMed] [Google Scholar]
- 20.Addison CL, Braciak T, Ralston R, Muller WJ, Gauldie J, Graham FL. Intratumoral injection of an adenovirus expressing interleukin 2 induces regression and immunity in a murine breast cancer model. Proc Natl Acad Sci USA. 1995;92:8522–6. doi: 10.1073/pnas.92.18.8522. [DOI] [PMC free article] [PubMed] [Google Scholar]
- 21.Lin EY, Jones JG, Li P, Zhu L, Whitney KD, Muller WJ, Pollard JW. Progression to malignancy in the polyoma middle T oncoprotein mouse breast cancer model provides a reliable model for human diseases. Am J Pathol. 2003;163:2113–26. doi: 10.1016/S0002-9440(10)63568-7. [DOI] [PMC free article] [PubMed] [Google Scholar]
- 22.Hummel JL, Safroneeva E, Mossman KL. The role of ICP0-Null HSV-1 and interferon signaling defects in the effective treatment of breast adenocarcinoma. Mol Ther. 2005;12:1101–10. doi: 10.1016/j.ymthe.2005.07.533. [DOI] [PubMed] [Google Scholar]
- 23.Wuest M, Trayner BJ, Grant TN, Jans HS, Mercer JR, Murray D, West FG, McEwan A, Wuest F, Cheeseman CI. Radiopharmacological evaluation of 6-deoxy-6-[18F] fluoro-D-fructose as a radiotracer for PET imaging of GLUT5 in breast cancer. Nucl Med Biol. 2011;38:461–475. doi: 10.1016/j.nucmedbio.2010.11.004. [DOI] [PubMed] [Google Scholar]
- 24.Oswald J, Treite F, Haase C, Kampfrath T, Mading P, Schwenzer B, Bergmann R, Pietzsch J. Experimental hypoxia is a potent stimulus for radiotracer uptake in vitro: comparison of different tumor cells and primary endothelial cells. Cancer Lett. 2007;254:102–10. doi: 10.1016/j.canlet.2007.02.016. [DOI] [PubMed] [Google Scholar]
- 25.Aft RL, Lewis JS, Zhang F, Kim J, Welch MJ. Enhancing targeted radiotherapy by copper (II) diacetyl- bis (N4-methylthiosemicarbazone) using 2-deoxy-D-glucose. Cancer Res. 2003;63:5496–504. [PubMed] [Google Scholar]
- 26.Shah C, Miller TW, Wyatt SK, McKinley ET, Olivares MG, Sanchez V, Nolting DD, Buck JR, Zhao P, Ansari MS, Baldwin RM, Gore JC, Schiff R, Arteaga CL, Manning HC. Imaging biomarkers predict response to anti-HER2 (ErbB2) therapy in preclinical models of breast cancer. Clin Cancer Res. 2009;15:4712–21. doi: 10.1158/1078-0432.CCR-08-2635. [DOI] [PMC free article] [PubMed] [Google Scholar]
- 27.Thakur ML, Devadhas D, Zhang K, Pestell RG, Wang C, McCue P, Wickstrom E. Imaging spontaneous MMTVneu transgenic murine mammary tumors: targeting metabolic activity versus genetic products. J Nucl Med. 2010;51:106–11. doi: 10.2967/jnumed.109.069542. [DOI] [PubMed] [Google Scholar]
- 28.Keen H, Pichler B, Kukuk D, Duchamp O, Raguin O, Shannon A, Whalley N, Jacobs V, Bales J, Gingles N, Ricketts SA, Wedge SR. An Evaluation of 2-deoxy-2-[(18)F] Fluoro-D-Glucose and 3'-deoxy-3'-[(18)F] -Fluorothymidine Uptake in Human Tumor Xenograft Models. Mol Imaging Biol. 2011 Jul 15; doi: 10.1007/s11307-011-0504-4. [Epub ahead of print] [DOI] [PubMed] [Google Scholar]
- 29.Cao Q, Li ZB, Chen K, Wu Z, He L, Neamati N, Chen X. Evaluation of biodistribution and anti-tumor effect of a dimeric RGD peptide-paclitaxel conjugate in mice with breast cancer. Eur J Nucl Med Mol Imaging. 2008;35:1489–98. doi: 10.1007/s00259-008-0744-y. [DOI] [PubMed] [Google Scholar]
- 30.Rowland DJ, Tu Z, Xu J, Ponde D, Mach RH, Welch MJ. Synthesis and in vivo evaluation of 2 high-affinity 76Br-labeled sigma2-receptor ligands. J Nucl Med. 2006;47:1041–8. [PubMed] [Google Scholar]
- 31.Noblitt LW, Bangari DS, Shukla S, Knapp DW, Mohammed S, Kinch MS, Mittal SK. Decreased tumorigenic potential of EphA2-overexpressing breast cancer cells following treatment with adenoviral vectors that express EphrinA1. Cancer Gene Ther. 2004;11:757–66. doi: 10.1038/sj.cgt.7700761. [DOI] [PubMed] [Google Scholar]
- 32.Wang H, Norris KM, Mansky LM. Analysis of bovine leukemia virus gag membrane targeting and late domain function. J Virol. 2002;76:8485–93. doi: 10.1128/JVI.76.16.8485-8493.2002. [DOI] [PMC free article] [PubMed] [Google Scholar]
- 33.Myoui A, Nishimura R, Williams PJ, Hiraga T, Tamura D, Michigami T, Mundy GR, Yoneda T. CSRC tyrosine kinase activity is associated with tumor colonization in bone and lung in an animal model of human breast cancer metastasis. Cancer Res. 2003;63:5028–33. [PubMed] [Google Scholar]
- 34.Noblitt LW, Bangari DS, Shukla S, Mohammed S, Mittal SK. Immunocompetent mouse model of breast cancer for preclinical testing of EphA2-targeted therapy. Cancer Gene Ther. 2005;12:46–53. doi: 10.1038/sj.cgt.7700763. [DOI] [PubMed] [Google Scholar]
- 35.Wilson JS, Avila Rodriguez MA, Johnson RR, Zyuzin A, McQuarrie SA. Niobium sputtered Havar foils for the high-power production of reactive [18F] fluoride by proton irradiation of [18O] H2O targets. Appl Radiat Isot. 2008;66:565–70. doi: 10.1016/j.apradiso.2007.12.004. [DOI] [PubMed] [Google Scholar]
- 36.Hamacher K, Coenen HH, Stocklin G. Efficient stereospecific synthesis of no-carrier-added 2-[18F] -fluoro-2-deoxy-D-glucose using aminopolyether supported nucleophilic substitution. J Nucl Med. 1986;27:235–8. [PubMed] [Google Scholar]
- 37.Machulla HJ, Blocher A, Kuntzch M, Piert M, Wei R, Grierson JR. Simplified labeling approach for synthesizing 39-deoxy-39-[18F] fluorothymidine ([18F] FLT) J Radioanal Nucl Chem. 2000;243:843–46. [Google Scholar]
- 38.Tomayko MM, Reynolds CP. Determination of subcutaneous tumor size in athymic (nude) mice. Cancer Chemother Pharmacol. 1989;24:148–54. doi: 10.1007/BF00300234. [DOI] [PubMed] [Google Scholar]


