The origins of the diversity in the SHG signal from protein crystals are investigated and potential protein-crystal coverage by SHG microscopy is assessed.
Keywords: second-harmonic generation, SHG microscopy
Abstract
A symmetry-additive ab initio model for second-harmonic generation (SHG) activity of protein crystals was applied to assess the likely protein-crystal coverage of SHG microscopy. Calculations were performed for 250 proteins in nine point-group symmetries: a total of 2250 crystals. The model suggests that the crystal symmetry and the limit of detection of the instrument are expected to be the strongest predictors of coverage of the factors considered, which also included secondary-structural content and protein size. Much of the diversity in SHG activity is expected to arise primarily from the variability in the intrinsic protein response as well as the orientation within the crystal lattice. Two or more orders-of-magnitude variation in intensity are expected even within protein crystals of the same symmetry. SHG measurements of tetragonal lysozyme crystals confirmed detection, from which a protein coverage of ∼84% was estimated based on the proportion of proteins calculated to produce SHG responses greater than that of tetragonal lysozyme. Good agreement was observed between the measured and calculated ratios of the SHG intensity from lysozyme in tetragonal and monoclinic lattices.
1. Introduction
Second-harmonic generation (SHG) microscopy, or second-order nonlinear optical imaging of chiral crystals (SONICC; Kissick et al., 2011 ▶; Wanapun et al., 2010 ▶; Madden et al., 2011 ▶; Haupert & Simpson, 2011 ▶), is a potentially promising new technique for protein-crystal detection.
SHG microscopy takes advantage of the symmetry requirements for SHG in order to discriminate chiral crystals from many achiral crystals and noncrystalline aggregates. The intrinsic chirality of protein crystals requires them to adopt noncentrosymmetric space groups upon crystallization, which are all symmetry allowed for SHG except for 432 (octahedral). However, symmetry dictates only whether or not the individual elements of the underlying hyperpolarizability tensor may be nonzero and constrains certain relations between tensor elements, but does not otherwise constrain the magnitude of the tensor. The practical coverage of SHG microscopy for protein-crystal detection clearly depends both on the experimental detection limits of the instrument and on the intrinsic susceptibility of the protein crystals to SHG. Arguably, the most direct approach for assessing the experimental coverage of SHG microscopy for protein-crystal detection would be to measure the SHG activities of hundreds of diverse protein crystals within numerous crystal polymorphs in order to obtain sufficient statistics for characterization.
Computational methods offer alternative approaches for assessing protein coverage in lieu of time-intensive experimental investigations, enabling simulations of several thousand protein-crystal forms. Numerical methods have the distinct advantages of enabling improved statistics through rapid analysis of a large pool and allowing systematic study of the underlying roles of specific factors that may influence protein-crystal brightness. These include the crystal size, the protein size, the symmetry of the crystal, the secondary-structural content of the protein, the crystal orientation and the detection limits of the instrument.
1.1. Crystal size
Crystal size can have a significant impact on the overall SHG intensity, particularly for crystals that are much smaller than the wavelength of light. For nanocrystals smaller than both the focal volume and the coherence length (either forward or backward), the SHG intensity from the crystal increases with the square of the crystal volume or with the sixth power of the radius. As the crystal becomes larger, the role of coherence becomes increasingly important. In the limit of tight focusing, the SHG intensity in the transmitted direction will saturate for crystals larger than the focal volume (provided that the forward coherence length is longer than the Rayleigh range describing the depth of focus; Saleh & Teich, 1991 ▶). In the epi direction detected back through the objective, the SHG saturates much sooner for thicknesses of the order of the backwards coherence length of ∼100 nm (corresponding to a protein refractive index of the order of 1.4). Therefore, for a depth of field of ∼10 µm the transmitted SHG can easily be of the order of ∼1000-fold brighter than in the epi direction, with this preference generally increasing with increasing depth of focus up to the forward coherence length (Haupert & Simpson, 2011 ▶). Most significantly for comparative purposes, perturbations to these trends from the linear optical properties of the protein crystals (e.g. from phase matching arising from birefringence) can be expected to be fairly minor across most proteins, provided that the depth of focus is considerably shorter than the forward coherence length and birefringence is relatively weak. Ultimately, these effects are likely to affect most protein crystals comparably.
1.2. Protein size
Since the detected SHG is proportional to the bulk number density, the calculated protein tensors should be scaled by the unit-cell volume. If we assume that the density of a protein crystal is constant within a 10% tolerance for all proteins (Fischer et al., 2004 ▶) and assume a similar average mass per amino acid in a protein, the influence of protein size on the number-density evaluation can be most simply accommodated by normalizing the tensor by the number of residues.
We define ξ as the square of the ratio of the magnitude of the SHG hyperpolarizability tensor of the protein crystal unit cell (βSHG) and the number of amino-acid residues in the protein (N res),
Assuming that the unit-cell volume of a protein crystal is roughly proportional to the number of residues in the protein within a given unit-cell symmetry, ξ allows comparisons of the potential SHG intensity from protein crystals on a unit-volume basis.
After performing this normalization, any remaining trends in net SHG activity versus crystal size can be tentatively attributed to changes in internal ordering, that scale with size. For example, more opportunities for internal cancellation might be expected in relatively large globular proteins, reducing the per-residue net nonlinear optical (NLO) activity. Conversely, large highly ordered domains may be more likely in larger proteins, potentially reducing the degree of internal cancellation and resulting in smaller ξ values for smaller proteins.
1.3. Protein secondary structures
The presence of ordered secondary structures within the protein may also potentially impact the net SHG activity of protein crystals. Because secondary-structural motifs exhibit local order, one might intuitively surmise that α-helices and β-sheets would contribute more to the net βSHG values than the relatively disordered random coils. For example, previous calculations of the NLO properties of protein secondary structures suggest relatively strong SHG and sum-frequency generation (SFG) from β-sheets (Perry et al., 2005 ▶), which was subsequently independently confirmed for SFG (Chen et al., 2005 ▶). Interestingly, comparable SHG activity was predicted for both parallel and antiparallel β-sheets, with nonzero NLO polarizability arising primarily from intrinsic pleating. In comparison, the electronic SHG activity of α-helices is expected to be relatively modest. Nevertheless, it is also possible that the secondary structures in most proteins arrange themselves in opposing or random orientations, resulting in SHG cancellation. In this case, the structured content of the proteins will not be strongly correlated with the SHG intensity.
1.4. Crystal symmetry
Finally, the influence of the arrangement of proteins within the lattice was considered. We can qualitatively expect that as the number of required zero elements in the βSHG tensor increases through increased crystal symmetry, the value of |βSHG| is likely to decrease correspondingly. Specifically, a crystal belonging to space group C 1 contains 27 nonzero elements of the βSHG tensor, each of which can contribute to the measured SHG intensity and the evaluation of ξ. For C 2 crystals, the number of nonzero elements is reduced to 13 (Butcher & Cotter, 1991 ▶). Each additional symmetry operation has the potential to produce further internal cancellation and lower the SHG efficiency. In the limit of high symmetry (432), as well as in isotropic systems, the SHG activity ultimately disappears completely by symmetry. However, the assessment of these qualitative expectations is essential for quantitative conclusions.
2. Methods
2.1. Theoretical foundation
Approximate hyperpolarizibilities for the sample protein structures were calculated using the symmetry-additive model, which was developed previously as an extension of perturbation theoretical approaches for modeling the linear optical properties of proteins and formally includes the perturbations to the nonlinear optical response from coupling between amide units (Perry et al., 2005 ▶; Moad et al., 2007 ▶). In brief, quantum-chemical calculations of coupled amide chromophores have confirmed the validity of the symmetry-additive approach for recovering the polarization-dependent nonlinear optical properties of exciton states emerging from coupling. However, these perturbations from coupling become negligible far from resonance, with the symmetry-additive model converging to a simple orientation average in both linear (Moffitt, 1956a ▶,b ▶; Moffitt & Yang, 1956 ▶; Woody & Koslowski, 2002 ▶) and nonlinear optics (Wampler et al., 2008 ▶).
The nonlinear polarizability of a protein was generated by calculating the NLO properties of a model amide chromophore (i.e. N-methylacetamide; NMA); the amide contributions from all the amino-acid residue linkages in the protein structure were then coherently summed. Far from resonance, as in these calculations, inter-chromophore coupling between amides produces only a weak perturbation of the tensor elements derived from the symmetry-additive model (Perry et al., 2005 ▶; Simpson et al., 2004 ▶) and is not likely to represent a dominant source of error in the analysis (Wanapun et al., 2008 ▶). The general validity of the symmetry-additive model as used here has been quantitatively confirmed independently in hyper-Rayleigh scattering experiments of uncolored chromophores (Loison & Simon, 2010 ▶).
This model also treats every amino-acid linkage as being equivalent to NMA, neglecting perturbations from side chains. Previous calculations suggest that this approach is reasonably accurate for linkages between most amino acids, but can significantly deviate for aromatic amino acids (Perry et al., 2005 ▶). Fortunately, the aromatic amino acids typically exhibit relatively low abundance and produce surprisingly weak hyperpolarizabilities for conjugated systems (only around threefold higher than NMA). In light of the quadratic scaling of SHG with number density, it is unlikely that the aromatic groups will substantially perturb the calculated values for ξ, except perhaps in instances of high internal amide cancellation.
It should also be noted that neither the approximation of the hyperpolarizability of the protein nor of N res include contributions from non-amino-acid residues such as internal chromophores or water. Using the same computational methods, the per-molecule SHG activity of water was calculated to be 18-fold lower than that of the amide unit (based on comparison of the ξ values). Given the relatively weak ordering of water compared with the protein amides and the much lower per-unit SHG activity, contributions from water were assumed to represent only a minor perturbation to these calculated results. In principle, additional constituents within the crystal may also contribute to the SHG response (e.g. buffers, cofactors, metals etc.). However, these elements can be expected to exhibit weak orientational order, weak intrinsic hyperpolarizability (e.g. solvated metal ions) and/or low number densities within the crystals relative to the amide. It should be noted that this model would typically fail in the presence of strong internal chromophores (e.g. GFP-labeled mutants, light-sensitive proteins, hemes etc.) that dominate the NLO properties, in which case the present study represents a lower bound for the anticipated SHG activity and protein coverage.
In order to generate NLO predictions for diverse protein crystals, the known protein structure from the PDB was used in combination with the symmetry-additive approach (see above) to calculate the protein nonlinear polarizability, and the protein was positioned randomly from a uniform orientation distribution within the unit cell. Next, the hyperpolarizabilities were symmetrized according to the symmetry operations of the crystal point groups to generate the net tensor for the crystals. This additive approach has been used previously to predict the nonresonant SHG activities of small-molecule crystals (Wampler et al., 2008 ▶; Zyss & Oudar, 1982 ▶).
The resulting βSHG tensor, a 3 × 3 × 3 tensor, describes the relationship between polarization, orientation and the SHG response of the protein crystal. The influence of crystal orientation and light polarization will also significantly impact the SHG intensities detected for individual protein crystals. Since the primary objective of the present study is to assess diversity across protein crystals rather than the effects arising for a single set of identical protein crystals, we choose to work in terms of |βSHG|, effectively integrating over the complete set of polarization-dependent combinations uniformly. Therefore, it follows that our analysis is most directly applicable to the prediction of the collective responses of multiple crystals or single crystals sampled in multiple orientations.
2.2. Computational methods
All calculations were performed in GAMESS (Schmidt et al., 1993 ▶) using the 6-311+G** basis set (Krishnan et al., 1980 ▶). The geometry of NMA was optimized using DFT with the B3LYP functional (Becke, 1993 ▶). The SHG hyperpolarizability of NMA using a 1000 nm fundamental frequency was calculated using a time-dependent Hartree–Fock (TDHF; Karna & Dupuis, 1991 ▶) approach. The βSHG tensor produced is purely real-valued and therefore cannot be directly used to describe resonance-enhanced experiments, but will work for the nonresonant studies anticipated in most experiments. It should also be noted that all calculations were performed in vacuo and must therefore be interpreted cautiously for proteins in a high dielectric environment. Nevertheless, the trends between proteins can still reasonably be expected to hold.
A random sample of 250 protein structures was taken from the RCSB PDB (Bernstein et al., 1977 ▶) using the following criteria: resolution no worse than 2.0 Å and no more than 30% sequence similarity (a list of the PDB entries used is reported as Supplementary Material1).
2.3. Experimental methods
Chicken egg-white lysozyme was purchased from Sigma–Aldrich (catalog No. L6876). A 25 mg ml−1 lysozyme solution was prepared in water and filtered through a 0.2 µm pore-size filter. Tetragonal (D 4) lysozyme crystals were grown in glass capillary tubes (0.4 mm inner diameter) from equal volumes of 25 mg ml−1 lysozyme and 0.02 M sodium acetate buffer pH 4.5, 7% NaCl. Capillaries were placed in a beaker inside another beaker containing the 0.02 M sodium acetate buffer with 7% NaCl. The outer beaker was sealed and the crystals were allowed to grow for 2 d.
Monoclinic (C 2) lysozyme crystals were grown in 96-well sitting-drop crystallization plates (Corning). Crystallization was performed with equal volumes of 25 mg ml−1 lysozyme solution and 0.02 M sodium acetate buffer pH 4.5, 12% NaCl (also used as the reservoir solution). These conditions formed monoclinic crystals as well as tetragonal crystals. A crystallization well that contained only monoclinic crystals was selected for SHG imaging.
SHG images of D 4 lysozyme crystals in capillaries and C 2 lysozyme crystals in 96-well crystallization trays were acquired with a custom-built SHG microscope as described previously (Kissick et al., 2011 ▶; Haupert & Simpson, 2011 ▶). The incident beam was provided by a tunable Mai Tai laser (100 fs, 80 MHz). The wavelength of the incident beam was selected to be 1000 nm, with 300 mW average power (measured before the excitation objective) for the D 4 crystals and 50 mW average power for the C 2 crystals. The acquisition time for SHG images was the same for both the D 4 and the C 2 crystals and was approximately 2 min. SHG signal was detected on two photomultiplier tubes (PMTs; Photonis, Hamamatsu): one in the backwards (epi) direction and one in the transmission (trans) direction. Two-photon-excited fluorescence (TPEF) was detected on one epi PMT (Photonis). Narrow-bandpass filters centered at 500 nm were placed before the SHG PMTs (HQ 500/20m-2p; Chroma Technology) and a bandpass centered at 530 nm was placed before the TPEF PMT (HQ 530/30m-2p; Chroma Technology). The incident beam was selected to be either vertically or horizontally polarized using polarizing beam-splitting cubes (Thorlabs). For the D 4 crystals, vertically polarized SHG was transmitted to the trans SHG PMT and horizontally polarized SHG was rejected using a dichroic sheet polarizer (03 FPG 003; Melles Griot). Coparallel and cross-polarized SHG images were obtained by using vertically and horizontally polarized incident light, respectively, and detecting only the resulting vertical component of the SHG signal. For SHG imaging of D 4 crystals the capillary was rotated between measurements to acquire SHG images of the same crystal at different angles. For SHG imaging of C 2 lysozyme crystals the incident beam was horizontally polarized and both the horizontally and the vertically polarized components of the SHG signal were collected independently.
3. Results
3.1. Theoretical results
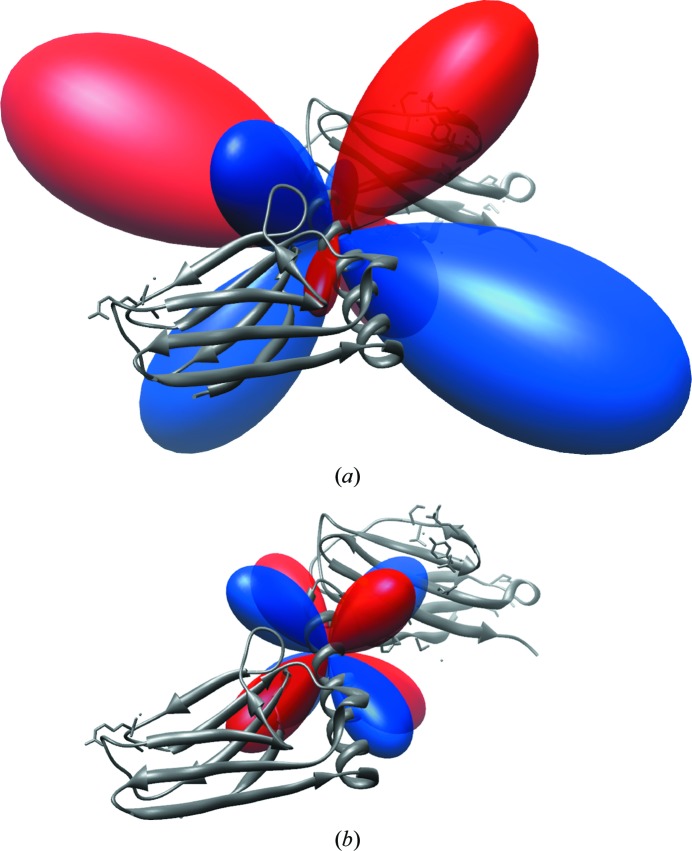
The first hyperpolarizability of NMA from the TDHF calculations is reported in Table 1 ▶; the corresponding hyperellipsoid (Moad et al., 2007 ▶) and vector-sphere (Tuer et al., 2011 ▶) representations are shown in Fig. 1 ▶. The relationships between the visual representations and the tabulated tensor elements have been detailed previously (Moad et al., 2007 ▶; Wampler et al., 2007 ▶). In this case, the relatively large and positive βxxx SHG tensor element corresponds to the amplitude of the lobe directed in the x direction in the hyperellipsoid representation and the x component of the vector intersecting the unit sphere along the x axis. Similarly, the βyyy SHG tensor element has a negative projection along the y axis. The net ξ value of NMA was found to be 11 820 atomic units squared per residue squared. A hyperellipsoid representation of a complete protein tensor for myomesin domains 10 and 11 (PDB entry 3rbs; Pinotsis et al., 2012 ▶) is shown in Fig. 2 ▶. Myomesin was selected as an example because the orthorhombic tensor is easy to visualize and its symmetrization is straightforward. Calculated elements for the hyperpolarizability tensor of the protein are given in Table 2 ▶.
Table 1. Dynamic first hyperpolarizability for NMA at 1000 nm.
Values are in atomic units. Elements with magnitudes of less than 1.3 atomic units were omitted for clarity.
| Element | Value |
|---|---|
| βxxx | 43.0 |
| βxxy, βxyx | 39.0 |
| βxyy | 21.6 |
| βxzz | −5.4 |
| βyxx | 39.6 |
| βyxy, βyyx | 22.8 |
| βyyy | −58.6 |
| βyzz | −11.5 |
| βzxz, βzzx | −5.4 |
| βzyz, βzzy | −11.2 |
Figure 1.
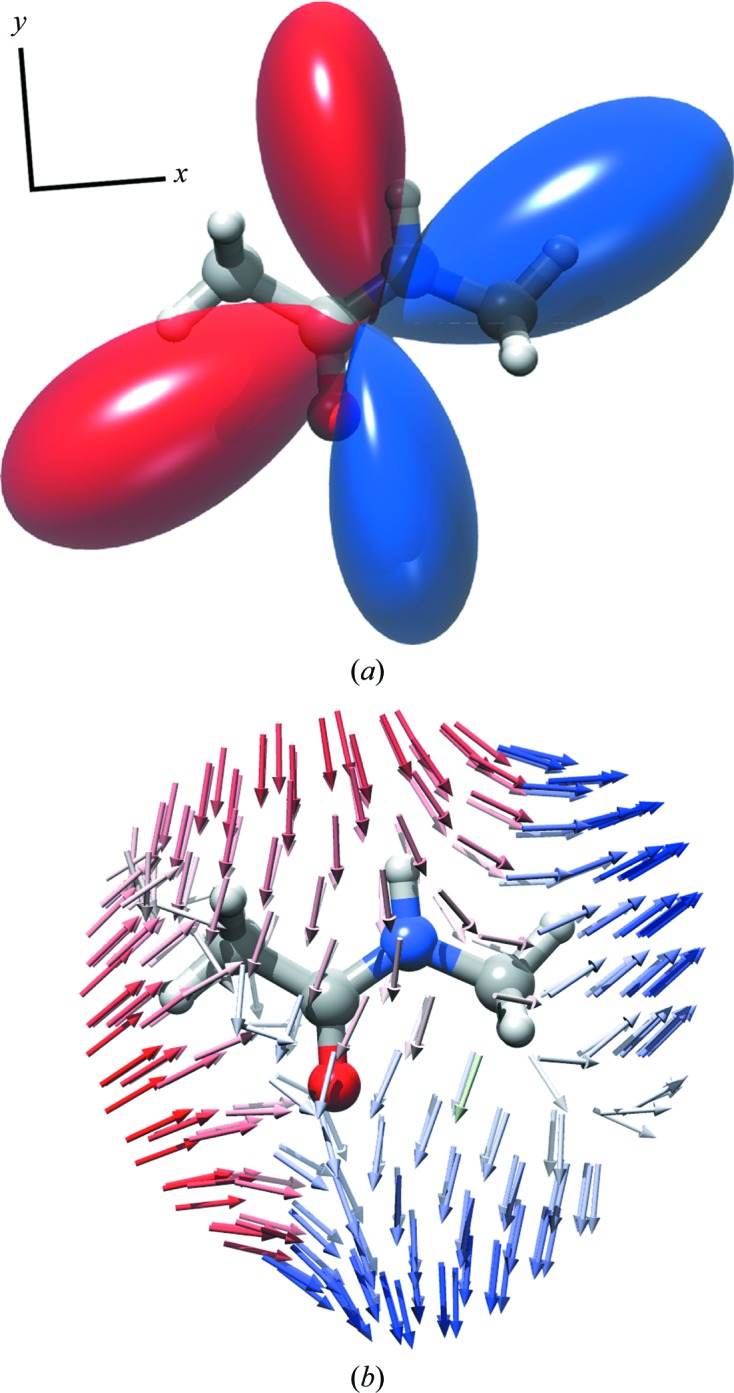
First hyperpolarizability of NMA. (a) Hyperellipsoid representation; (b) unit-sphere representation. The position on the bottom sphere represents the direction of the driving electric field and the vector describes the induced polarization. The projection of the induced polarization along the sphere normal is used to make the hyperellipsoid surface. Red and blue indicate negative and positive signs of the induced field, respectively.
Figure 2.
First hyperpolarizability of myomesin domains 10 and 11 (PDB entry 3rbs). (a) No symmetry; (b) P212121 unit-cell tensor; the image is rotated out of the tensor coordinate system to show detail.
Table 2. Dynamic first hyperpolarizability for myomesin domains 10 and 11 (PDB entry 3rbs) at 1000 nm.
Values are in atomic units.
| Element | Value | |
|---|---|---|
| No symmetry | βxxx | 767 |
| βxxy, βxyx | −931 | |
| βxxz, βxzx | 417 | |
| βxyy | −259 | |
| βxyz, βxzy | −602 | |
| βxzz | −349 | |
| βyxx | −902 | |
| βyxy, βyyx | −251 | |
| βyxz, βyzx | −578 | |
| βyyy | −176 | |
| βyyz, βyzy | −193 | |
| βyzz | 290 | |
| βzxx | 406 | |
| βzxy, βzyx | −604 | |
| βzxz, βzzx | −358 | |
| βzyy | −190 | |
| βzyz, βzzy | 304 | |
| βzzz | 33 | |
| P212121 unit cell | βxyz, βxzy | −602 |
| βyxz, βyzx | −578 | |
| βzxy, βxzy | −604 |
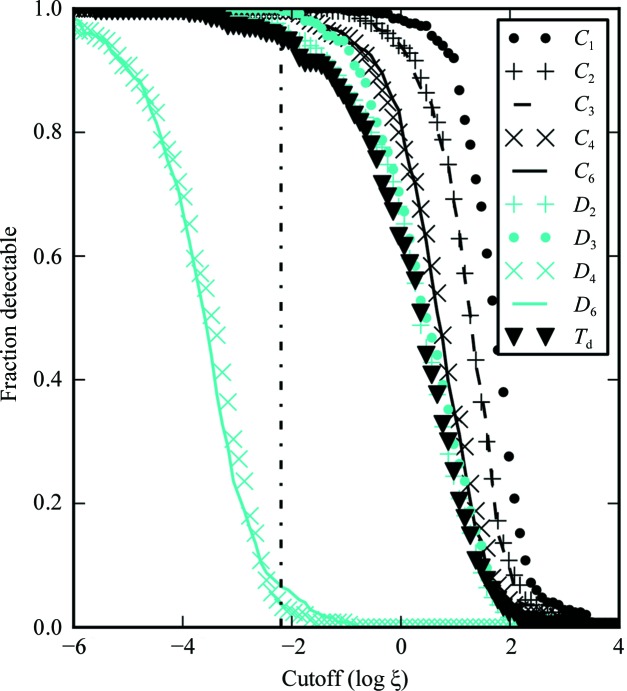
Crystal point-group-dependent results are shown in Fig. 3 ▶. The results indicate a clear break between the anticipated SHG activity of the D 4 and D 6 symmetry groups and those of other crystal symmetries, with the D 4 and D 6 crystals typically ∼10 000-fold weaker in SHG than other crystal classes (based on the differences in the values of ξ at the inflection points in Fig. 3 ▶). Furthermore, considerable diversity in SHG efficiency was predicted within each crystal class, typically spanning 2–3 orders of magnitude.
Figure 3.
Fraction of protein crystals detectable as a function of ξ cutoff for different underlying crystal point groups. Trials with ξ values below the cutoff are not detected. ξ is in squared atomic units per amino acids squared. The vertical dashed line represents D 4 lysozyme (ξ = 0.0064).
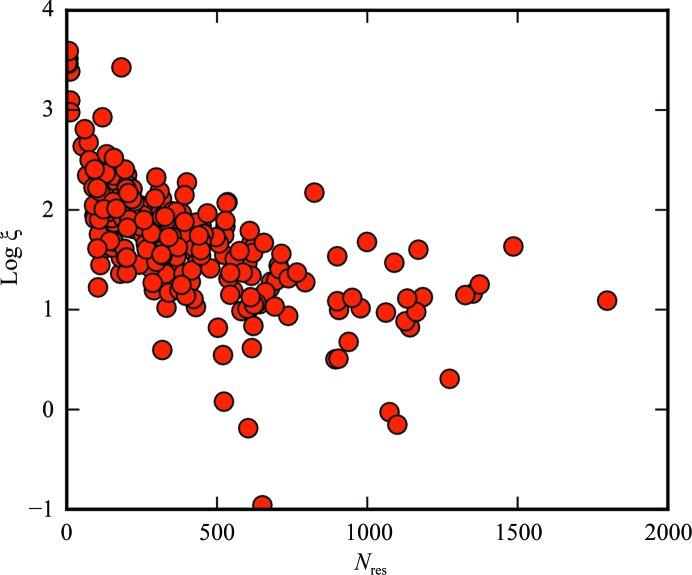
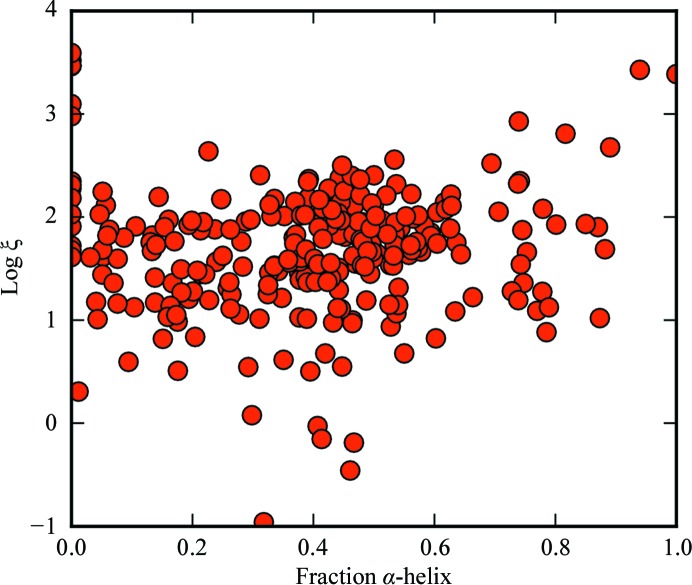
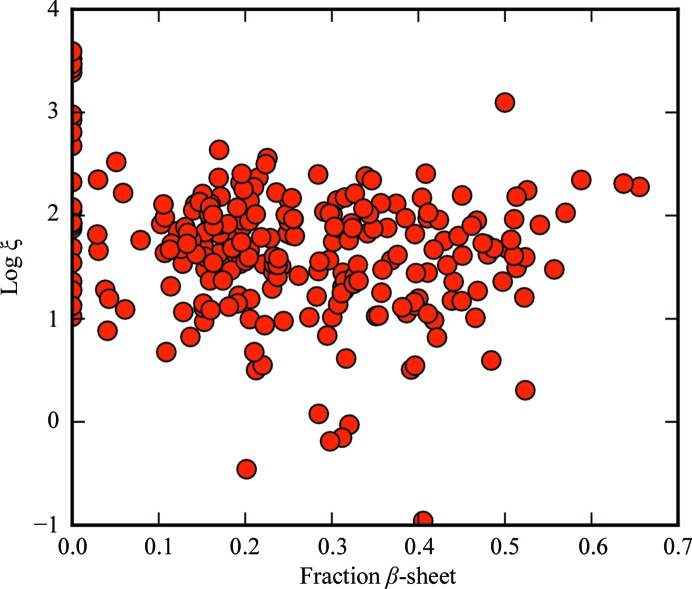
The normalized covariance coefficients for log ξ versus N res, fraction of α-helix and fraction of β-sheet were −0.53, 0.04 and −0.22, respectively (Figs. 6–8).
3.2. Experimental results
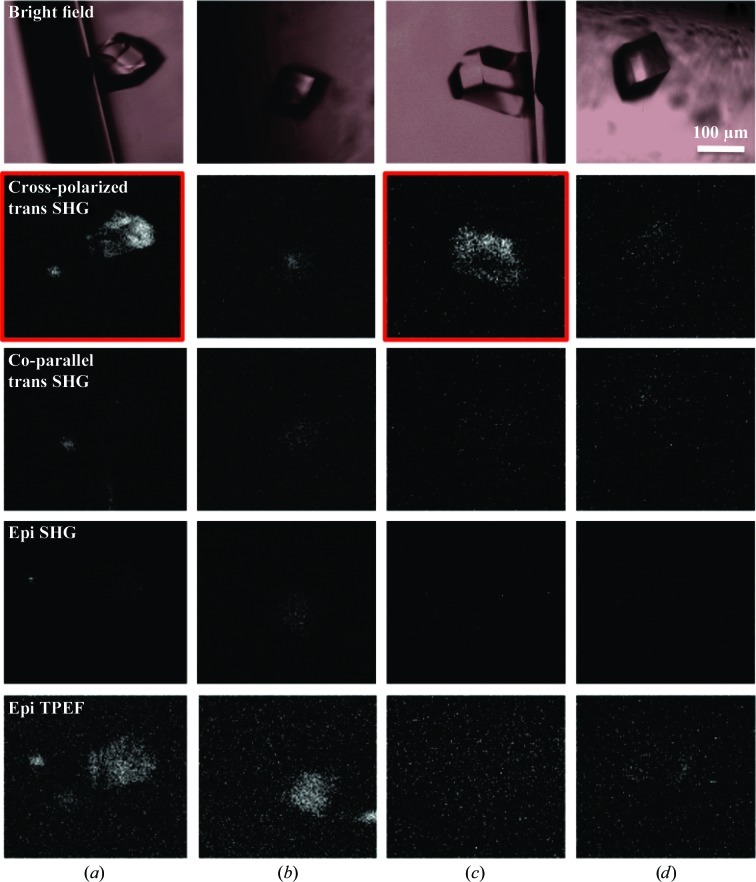
D 4 lysozyme crystals were imaged within glass capillaries and both coparallel and cross-polarized SHG images were acquired, the results of which are shown in Fig. 4 ▶. Sets of images for the D 4 crystals were acquired at different rotation angles of the capillary. When the crystals appeared to lie in the {101} orientation, the crystallographic c axis was approximately parallel to the incident beam (Rong et al., 2002 ▶; Li et al., 1999 ▶). For the two D 4 lysozyme crystals, SHG signal significantly above background was only observed for cross-polarized trans SHG and exclusively when the c axis was tilted with respect to the incident beam. TPEF signal was also observed, but was weak relative to the transmission cross-polarized SHG from the tilted crystals. Detectable SHG signals were not observed in the epi direction. Granularity in the images of D 4 lysozyme crystals was attributed to Poisson fluctuations in the counts, which were more noticeable in images with low signal-to-background ratio (S:B).
Figure 4.
Images of D 4 lysozyme crystals. The rows contain bright-field and SONICC images of two D 4 lysozyme crystals in capillaries before and after rotation of the capillary. (a) Crystal on the side of the capillary wall. (b) The same crystal after rotation of the capillary so that it is approximately positioned in the {101} orientation with respect to the incident beam. (c) A second lysozyme crystal on the side of a capillary wall. (d) The same crystal as in (c) after rotation of the capillary so that it is approximately positioned in the {101} orientation with respect to the incident beam
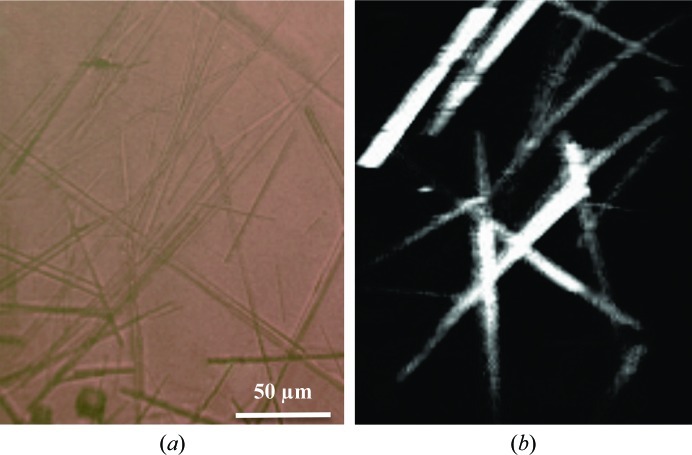
C 2 lysozyme crystals were imaged within 96-well crystallization trays. In contrast to the D 4 crystals, bright SHG signals were observed for both coparallel and cross-polarized detection; a composite of the two polarized SHG images is shown in Fig. 5 ▶. The diversity in SHG intensities between the crystals is attributed to differences in crystal size, orientation and proximity to the focal plane.
Figure 5.
Images of C 2 lysozyme crystals in a 96-well plate. (a) Bright-field image, (b) SHG image (composite of coparallel and cross-polarized).
4. Discussion
Based on the comparisons shown in Figs. 3 ▶, 6 ▶, 7 ▶ and 8 ▶, crystal symmetry is clearly the most reliable predictor of ξ considered in the model. Crystals of D 4 and D 6 symmetry are expected to produce orders of magnitude less SHG than crystals of lower symmetry groups. However, it is evident from the traces in Fig. 3 ▶ that even protein crystals within a single symmetry group still exhibit a little over three orders of magnitude variability in ξ.
Figure 6.
Dependence of ξ on N res. Points (2.98, −0.458), (6.17, 0.676) and (2.17, 0.550) were omitted for clarity. ξ is in squared atomic units per amino acids squared.
Figure 7.
Dependence of ξ on fraction α-helix. ξ is in squared atomic units per amino acids squared.
Figure 8.
Dependence of ξ on fraction β-sheet. ξ is in squared atomic units per amino acids squared.
Protein size is moderately anticorrelated with ξ. The anticorrelation can be rationalized by considering that the more amino acids in a protein, the more potential opportunities for self-cancellation. We can generally expect a larger ξ value for small protein fragments, possibly including single α-helices. Conversely, large proteins tend to be globular, resulting in greater self-cancellation of SHG.
The percentage α-helix and ξ are not strongly correlated. One possible explanation is that α-helices tend to form random or antiparallel assemblies that counteract their net nonlinear polarizabilities. The normalized covariance coefficient for β-sheet composition versus ξ is about half that of the size dependence. Thus, it appears that secondary structure is in general not strongly predictive of SHG activity.
The experimental studies on lysozyme (Figs. 4 ▶ and 5 ▶) were performed to provide a point of reference for interpreting Fig. 3 ▶. The images in Fig. 4 ▶ suggest weak but clearly detectable SHG from D 4 lysozyme crystals. In previous studies, our group and others have observed relatively bright TPEF signals which can potentially interfere with the detection of comparatively weak SHG signals (Padayatti et al., 2012 ▶; Gualtieri, 2010 ▶; Gualtieri et al., 2011 ▶). If the signals on the SHG channels were dominated by TPEF breakthrough, the epi TPEF channel would be expected have higher signal intensities than the SHG channels and produce a similar image contrast. In addition, interference both in the trans and epi SHG signals from TPEF would be expected to be comparable in magnitude owing to the equal probability of fluorescence propagation in both directions. The results from Fig. 4 ▶ do not agree with these predictions, suggesting that TPEF interference is unlikely.
Further evidence supporting SHG detection of D 4 lysozyme crystals can be found in analysis of the polarization-dependent responses. The nonvanishing βSHG tensor elements for a D 4 crystal are βzxy = −βzyx, βxyz = −βyxz, βxzy = −βyzx (Boyd et al., 2004 ▶). Based on these relations, generation of coparallel SHG is not possible, regardless of crystal orientation. This polarization dependence is not a requirement of TPEF because of the incoherent nature of fluorescence emission. Experimentally, the strongest signal is found on the cross-polarized transmission SHG channel in Fig. 4 ▶(a), which indicates that the signals on the SHG PMTs are not consistent with expectations from TPEF and are in excellent agreement with the predicted polarization-dependent SHG from D 4 lysozyme crystals. Therefore, we can conclude that a substantial portion of the signal on the SHG PMTs is indeed owing to genuine SHG and is not an artifact from fluorescence or scattering.
The dependence on crystal orientation is also consistent with expectations for SHG from D 4 lysozyme. For a D 4 crystal, all three polarization indices of the β tensor are orthogonal to each other, such that generation of SHG is forbidden when the incident beam is polarized along one of the crystallographic axes. Therefore, in order to generate SHG the crystal must be tilted so that none of its crystallographic axes are parallel to the incident beam. Through manual rotation of the capillaries and visual bright-field inspection (Figs. 4 ▶ b and 4 ▶ d, top row), each lysozyme crystal was approximately positioned in the {101} orientation. Since the crystallographic c axis is perpendicular to the {101} orientation of the crystal, the incident beam is approximately coparallel with the c axis for a crystal in this orientation (Li et al., 1999 ▶). In these cases very weak cross-polarized SHG signal was observed, with S:B only slightly greater than 1:1 for both crystals (Figs. 4 ▶ b and 4 ▶ d, second row). The nonzero SHG signal is likely to be a result of the c axis being slightly off-angle from the incident beam from the approximation of crystal positioning. As shown in Figs. 4 ▶(b) and 4 ▶(d) (second row), when the c axis of the D 4 lysozyme crystal is clearly tilted so that it is no longer parallel to the incident beam, cross-polarized SHG signal is observed with an S:B of 5:1 and 3:1, respectively. Consequently, it should be noted that during SHG imaging of other high-symmetry (D 4 and D 6) protein crystals it may be necessary to probe the SHG response from several orientations if initial results indicate the absence of SHG signal.
Another observation suggesting SHG rather than TPEF is the forward-to-backward ratio as observed in the epi and trans images. Crystals that are large relative to the backwards coherence length (typically 1–200 nm) produce significantly stronger SHG in the trans direction. The forward-to-backward ratio, or the differences in intensity between the epi and trans images, is therefore indicative of crystal size in the nanocrystal regime (Wanapun et al., 2010 ▶). For small crystals that approach the diffraction limit, SHG will propagate equally in the forward and backward directions and similar responses on the epi and trans detector can be expected (Gualtieri et al., 2011 ▶). The observation of only trans SHG is consistent with these expectations.
For comparison, a composite image of coparallel and cross-polarized SHG images of several needle-like lysozyme crystals, which are typically monoclinic (C 2; Walsh et al., 1998 ▶; Yamashita et al., 2002 ▶), is in shown in Fig. 5 ▶. The C 2 lysozyme crystals were relatively bright, with four of the brightest crystals having average intensities of 3.0 × 10⁷, 1.8 × 10⁷, 2.1 × 10⁷ and 1.5 × 10⁷ counts s−1. The average intensities of the two rotated D 4 lysozyme crystals were 1.2 × 10⁶ and 7.0 × 10⁵ counts s−1. This provides an estimation of signal intensities for C 2 crystals (∼2.1 × 10⁷ counts s−1) and D 4 crystals (∼9.9 × 10⁵ counts −1). The images of C 2 crystals were acquired with an incident average power six times lower than that used to image the D 4 crystals. Owing to the dependence of SHG intensity on the incident power squared, the C 2 SHG image was multiplied by a factor of 36 in order to compare the signal intensities with those for D 4 crystals. After scaling, the resulting signal intensities for the C 2 crystals were ∼ 800 times greater than those of the D 4 crystals. The ξ values for C 2 and D 4 lysozyme were determined to be 4.3 and 0.0064, respectively. This corresponds to greater signal intensities for C 2 over D 4 by a factor of ∼670, which is in close agreement with the experimentally determined factor of ∼800. However, the excellent agreement between the theoretical and experimental ratios may simply be fortuitous given the substantial diversity in the measured SHG activities of the individual crystals.
With our current instrument configuration we expect, based on the ξ value of D 4 lysozyme in Fig. 3 ▶, about 5% coverage for D 4 and D 6 crystals and greater than 95% for protein crystals with lower than D 4 symmetry. Even with an order of magnitude smaller S:B in the measurement, we still expect at least 80% coverage for noncentrosymmetric space groups of lower than D 4 symmetry. After weighting the results from Fig. 3 ▶ with the occurrence of space groups in the PDB (Bernstein et al., 1977 ▶), it was calculated that SHG microscopy should be able to detect ∼84% of all protein crystals in the PDB.
5. Conclusion
When considering an orientational average of protein crystals that are larger than the focal volume, the factor with the greatest predictive power over SHG intensity is the symmetry of the crystal. In general, the more elements of the hyperpolarizability tensor that vanish in a point group, the lower the hyperpolarizability is expected to be. Even within a particular crystal class the SHG efficiencies of proteins can vary 1000-fold, suggesting that the majority of the variability in protein SHG intensity across proteins is owing to random packing and orientation effects within the protein and within the lattice. Increasing amino-acid count is moderately likely to reduce SHG intensity, but again the variability in SHG intensity per unit volume is mostly dominated by other properties of the protein. The results from this model do not suggest that the percentage of α-helix is a strong predictor of the expected SHG intensity from a protein crystal. The fractional β-sheet composition is expected to be a weak predictor of trends in SHG intensity. Results of SHG measurements (Figs. 4 ▶ and 5 ▶) demonstrate that tetragonal lysozyme (a D 4 crystal with ξ = 0.0064) is definitively detectable by existing SONICC instrumentation. Based on our theoretical results, we predict that protein crystals belonging to the D 4 and D 6 point groups will be challenging but possible to detect using SHG microscopy. The experimental ratio of the SHG efficiencies for tetragonal and monoclinic lysozyme crystals was in good agreement with the theoretical predictions of the model. However, these collective results suggest the importance of highly optimized instrumentation, collection in transmission and a large dynamic range for detection in order to achieve this theoretical coverage on a routine basis.
Supplementary Material
Supplementary material file. DOI: 10.1107/S0907444912037638/yt5044sup1.txt
Acknowledgments
The authors acknowledge support from NIH R01GM-103401-3 and from the Center for Direct Catalytic Conversion of Biomass to Biofuels (C3Bio), an Energy Frontier Research Center funded by US Department of Energy, Office of Science, Office of Basic Energy Sciences Award No. DE-SC0000997.
Footnotes
Supplementary material has been deposited in the IUCr electronic archive (Reference: YT5044). Services for accessing this material are described at the back of the journal.
References
- Becke, A. D. (1993). J. Chem. Phys. 98, 1372–1377.
- Bernstein, F. C., Koetzle, T. F., Williams, G. J., Meyer, E. F. Jr, Brice, M. D., Rodgers, J. R., Kennard, O., Shimanouchi, T. & Tasumi, M. (1977). J. Mol. Biol. 112, 535–542. [DOI] [PubMed]
- Boyd, R. W., Sipe, J. E. & Milonni, P. W. (2004). J. Opt. A Pure Appl. Opt. 6, S14.
- Butcher, P. N. & Cotter, D. (1991). The Elements of Nonlinear Optics. Cambridge University Press.
- Chen, X., Wang, J., Sniadecki, J. J., Even, M. A. & Chen, Z. (2005). Langmuir, 21, 2662–2664. [DOI] [PubMed]
- Fischer, H., Polikarpov, I. & Craievich, A. F. (2004). Protein Sci. 13, 2825–2828. [DOI] [PMC free article] [PubMed]
- Gualtieri, E. J. (2010). Nonlinear Optical Imaging of Membrane Protein Crystals. PhD thesis, Purdue University, USA.
- Gualtieri, E. J., Guo, F., Kissick, D. J., Jose, J., Kuhn, R. J., Jiang, W. & Simpson, G. J. (2011). Biophys. J. 100, 207–214. [DOI] [PMC free article] [PubMed]
- Haupert, L. M. & Simpson, G. J. (2011). Methods, 55, 379–386. [DOI] [PMC free article] [PubMed]
- Karna, S. P. & Dupuis, M. (1991). J. Comput. Chem. 12, 487–504.
- Kissick, D. J., Wanapun, D. & Simpson, G. J. (2011). Annu. Rev. Anal. Chem. 4, 419–437. [DOI] [PMC free article] [PubMed]
- Krishnan, R., Binkley, J. S., Seeger, R. & Pople, J. A. (1980). J. Chem. Phys. 72, 650–654.
- Li, M., Nadarajah, A. & Pusey, M. L. (1999). Acta Cryst. D55, 1012–1022. [DOI] [PubMed]
- Loison, C. & Simon, D. (2010). J. Phys. Chem. A, 114, 7769–7779. [DOI] [PubMed]
- Madden, J. T., DeWalt, E. L. & Simpson, G. J. (2011). Acta Cryst. D67, 839–846. [DOI] [PMC free article] [PubMed]
- Moad, A. J., Moad, C. W., Perry, J. M., Wampler, R. D., Goeken, G. S., Begue, N. J., Shen, T., Heiland, R. & Simpson, G. J. (2007). J. Comput. Chem. 28, 1996–2002. [DOI] [PubMed]
- Moffitt, W. (1956a). J. Chem. Phys. 25, 467–478.
- Moffitt, W. (1956b). Proc. Natl Acad. Sci. USA, 42, 736–746. [DOI] [PMC free article] [PubMed]
- Moffitt, W. & Yang, J. T. (1956). Proc. Natl Acad. Sci. USA, 42, 596–603. [DOI] [PMC free article] [PubMed]
- Padayatti, P., Palczewska, G., Sun, W., Palczewski, K. & Salom, D. (2012). Biochemistry, 51, 1625–1637. [DOI] [PMC free article] [PubMed]
- Perry, J. M., Moad, A. J., Begue, N. J., Wampler, R. D. & Simpson, G. J. (2005). J. Phys. Chem. B, 109, 20009–20026. [DOI] [PubMed]
- Pinotsis, N., Chatziefthimiou, S. D., Berkemeier, F., Beuron, F., Mavridis, I. M., Konarev, P. V., Svergun, D. I., Morris, E., Rief, M. & Wilmanns, M. (2012). PLoS Biol. 10, e1001261. [DOI] [PMC free article] [PubMed]
- Rong, L., Komatsu, H. & Yoda, S. (2002). J. Cryst. Growth, 235, 489–493.
- Saleh, B. E. A. & Teich, C. M. (1991). Fundamentals of Photonics. New York: John Wiley & Sons.
- Schmidt, M. W., Baldridge, K. K., Boatz, J. A., Elbert, S. T., Gordon, M. S., Jensen, J. H., Koseki, S., Matsunaga, N., Nguyen, K. A., Su, S., Windus, T. L., Dupuis, M. & Montgomery, J. A. (1993). J. Comput. Chem. 14, 1347–1363.
- Simpson, G. J., Perry, J. M., Moad, A. J. & Wampler, R. D. (2004). Chem. Phys. Lett. 399, 26–32.
- Tuer, A., Krouglov, S., Cisek, R., Tokarz, D. & Barzda, V. (2011). J. Comput. Chem. 32, 1128–1134. [DOI] [PubMed]
- Walsh, M. A., Schneider, T. R., Sieker, L. C., Dauter, Z., Lamzin, V. S. & Wilson, K. S. (1998). Acta Cryst. D54, 522–546. [DOI] [PubMed]
- Wampler, R. D., Begue, N. J. & Simpson, G. J. (2008). Crystal Growth Des. 8, 2589–2594.
- Wampler, R. D., Moad, A. J., Moad, C. W., Heiland, R. & Simpson, G. J. (2007). Acc. Chem. Res. 40, 953–960. [DOI] [PubMed]
- Wanapun, D., Kestur, U. S., Kissick, D. J., Simpson, G. J. & Taylor, L. S. (2010). Anal. Chem. 82, 5425–5432. [DOI] [PubMed]
- Wanapun, D., Wampler, R. D., Begue, N. J. & Simpson, G. J. (2008). Chem. Phys. Lett. 455, 6–12.
- Woody, R. W. & Koslowski, A. (2002). Biophys. Chem. 101–102, 535–551. [DOI] [PubMed]
- Yamashita, Y., Oka, M., Tanaka, T. & Yamazaki, M. (2002). Biochim. Biophys. Acta, 1561, 129–134. [DOI] [PubMed]
- Zyss, J. & Oudar, J. L. (1982). Phys. Rev. A, 26, 2028–32048.
Associated Data
This section collects any data citations, data availability statements, or supplementary materials included in this article.
Supplementary Materials
Supplementary material file. DOI: 10.1107/S0907444912037638/yt5044sup1.txt


