

Abstract
Signaling through GABAA receptors controls neural progenitor cell (NPC) development in vitro and is altered in schizophrenic and autistic individuals. However, the in vivo function of GABAA signaling on neural stem cell proliferation, and ultimately neurogenesis, remains unknown. To examine GABAA function in vivo, we electroporated plasmids encoding short-hairpin (sh) RNA against the Na-K-2Cl cotransporter NKCC1 (shNKCC1) in NPCs of the neonatal subventricular zone in mice to reduce GABAA-induced depolarization. Reduced GABAA depolarization identified by a loss of GABAA-induced calcium responses in most electroporated NPCs led to a 70% decrease in the number of proliferative Ki67+ NPCs and a 60% reduction in newborn neuron density. Premature loss of GABAA depolarization in newborn neurons resulted in truncated dendritic arborization at the time of synaptic integration. However, by 6 weeks the dendritic tree had partially recovered and displayed a small, albeit significant, decrease in dendritic complexity but not total dendritic length. To further examine GABAA function on NPCs, we treated animals with a GABAA allosteric agonist, pentobarbital. Enhancement of GABAA activity in NPCs increased the number of proliferative NPCs by 60%. Combining shNKCC1 and pentobarbital prevented the shNKCC1 and the pentobarbital effects on NPC proliferation, suggesting that these manipulations affected NPCs through GABAA receptors. Thus, dysregulation in GABAA depolarizing activity delayed dendritic development and reduced NPC proliferation resulting in decreased neuronal density.
Introduction
Building a circuit requires the orchestration of processes that control the number of neurons being produced, their migration, and their morphogenesis to form proper synaptic connections. Defects in one or several of these mechanisms will lead to circuit abnormalities associated with altered excitability and behavioral defects. One highly conserved signal that controls cell development in both neural and peripheral stem cell niches is the neurotransmitter GABA acting through GABAA receptors (Henschel et al., 2008; Young and Bordey, 2009). More specifically, pharmacological perturbation of GABAA activity in vitro and in vivo has implicated GABAA receptors as regulators of neural progenitor cell (NPC) proliferation (LoTurco et al., 1995; Liu et al., 2005; Cesetti et al., 2011) and dendritogenesis of newborn neurons (Ge et al., 2006; Wang and Kriegstein, 2008; Duveau et al., 2011) in embryonic and postnatal animals. However, whether GABAA receptor activity acts in a cell-autonomous manner on NPCs remains unknown. In addition, its in vivo function on neurogenesis, and specifically on neuron production, remains unclear.
GABAA receptor activation in NPCs and newborn neuroblasts leads to depolarization (Owens and Kriegstein, 2002; Bordey, 2006; Platel et al., 2010b), although a hyperpolarizing action has been reported (Cesetti et al., 2011). GABAA-induced depolarization is due to the presence of the Na-K-2Cl cotransporter NKCC1 and the lack of the K-Cl cotransporter KCC2 that carries chloride in and out of the cells, respectively (Owens and Kriegstein, 2002). A function of GABAA receptors was previously reported on dendritogenesis using NKCC1 knockdown to reduce GABAA-induced depolarization (Ge et al., 2006; Wang and Kriegstein, 2008).
Intriguingly, genes involved in GABAA signaling, including NKCC1 (SLC12A2 gene in humans), are linked with autism and schizophrenia (Muhle et al., 2004; Potkin et al., 2009; Arion and Lewis, 2011). These neurodevelopmental disorders are associated with altered neuronal density and dendritic arbors, and dysfunctional GABAergic signaling (Rubenstein and Merzenich, 2003; Chao et al., 2010). A defect in NPC proliferation could account for altered neuronal density. Thus, these previous studies showing GABAA alterations in human neurodevelopmental disorders show that further exploration of GABAA activity on neuron production in vivo is clearly warranted.
One attractive region to address this issue is the neurogenic subventricular zone (SVZ)-to-olfactory bulb (OB) system because of its well defined GABAergic developmental sequence (Bordey, 2007). In addition, the OB circuit is hypoplastic in individuals with schizophrenia or autism (Brang and Ramachandran, 2010; Nguyen et al., 2010; Tobin et al., 2010). We thus examined the consequences of diminished GABAA-induced depolarization on neurogenesis from NPCs in the neonatal SVZ by using electroporation and short-hairpin RNA (shRNA). One of our key findings is that diminished GABAA depolarization in NPCs led to a marked reduction in the number of proliferative NPCs and the density of newborn neurons.
Materials and Methods
Mice.
Animal protocols were approved by the Yale University Institutional Animal Care and Use Committee. Experiments were performed in CD1 mice of either sex (Charles River Laboratories). Postnatal day 0 (P0)–P1 mice were used for electroporation. P6 mice received tamoxifen at 5 d post-electroporation (dpe). P7 and P8 mice corresponding to 1 week post-electroporation (wpe) mice were used for proliferation analysis, patch-clamp recordings in the OB, and calcium imaging in the SVZ. P14–P15 mice corresponding to 2 wpe were used for cell density and dendrite analysis, patch-clamp recordings, and calcium imaging in the OB. P36–P42 mice corresponding to 6 wpe were used for dendrite analysis and for patch-clamp recordings. At least 3 mice were used per experiment and condition.
Neonatal in vivo electroporation.
Plasmids (2–5 μg/μl) were diluted in filtered PBS containing 0.1% fast green as a tracer. Plasmid solution (0.5–1 μl) was injected into the lateral ventricles of cold-anesthetized neonatal P0–P1 pups, using a <50-μm-diameter pulled glass pipette. After plasmid injection using manual pressure, tweezer-type electrodes (model 520, BTX) were placed on the heads of each pup and 3–4 square-pulses of 50 ms duration with 950 ms intervals at 130 V were applied using an ECM830 BTX pulse generator. Following electroporation, pups were gently warmed, returned to the dam, and carefully monitored for recovery.
Vectors.
NKCC1 shRNA (shNKCC1) was kindly provided by Drs. D. D. Wang and A. R. Kriegstein, University of California, San Francisco (Wang and Kriegstein, 2008), and subcloned into the pSico vector (Addgene; Ventura et al., 2004) using HpaI/XhoI sites. A control shRNA (shControl) was a scrambled sequence that did not complement any known gene using a BLAST search. pSico contains a U6 promoter preceding a Stop sequence containing enhanced green fluorescent protein (GFP) flanked by LoxP sites before the shRNA sequence. pSico was coinjected with pCAG-tdTomato (denoted pRFP, constructed using the pCMV-tdTomato; Clontech) and either the constitutively expressed pCAG-Cre (denoted pCre) or the tamoxifen-inducible pCAG-ERT2CreERT2 (denoted pERT2CreERT2; Addgene). To verify successful Cre-mediated recombination, pCALNL-DsRed (Matsuda and Cepko, 2007) (DsRed noted as RFP; Addgene) was used in some experiments. Plasmid concentration varied from 1 to 3 μg/μl.
Cell culture and Western blot analysis.
The Neuro-2a mouse neuroblastoma cell line (American Type Culture Collection) was propagated in multiwell plates or flasks (BD Falcon) at 37°C and 5% CO2. The medium consisted of DMEM supplemented with 10% heat-inactivated fetal calf serum, 100 U/L penicillin, and 100 μg/L streptomycin. PolyJet (SignaGen) was used to transfect the vectors when cells reached 80% confluency. For in vitro verification of NKCC1 knock down, a hemagglutinin (HA)-tagged NKCC1 overexpression vector (kindly provided by Dr. B. Forbush, Yale University) was used in conjunction with pSico-shNKCC1. Transfection efficiency was verified, and RNA and protein were harvested 72 h post-transfection. Transfected cells were lysed in radioimmunoprecipitation assay buffer supplemented with a Protease Inhibitor Cocktail and a serine/threonine and tyrosine protein Phosphatase Inhibitor Cocktail (Sigma). Protein was resolved on SDS-polyacrylamide gels and transferred to a polyvinylidene difluoride membrane after electrophoresis using the Trans-blot module (Bio-Rad). Membranes were blocked in 5% milk powder and 0.05% Tween in TBS for 1 h and probed overnight at 4°C with primary antibodies to detect HA-tagged NKCC1 (1:1000, HA.11 Clone 16B12 monoclonal antibody, Covance) or GFP (1:2500, GFP monoclonal antibody MAB3580, Millipore). Membranes were washed and then incubated with horseradish peroxidase-conjugated secondary antibodies (1 h, room temperature). Specific protein bands were detected by the ECL system using Super Signal Chemiluminescent substrate (Pierce). Total protein loaded was quantified by staining membranes with amido black; probed protein levels were normalized to amido black levels.
Tamoxifen and pentobarbital experiments.
For the experiments using pERT2CreERT2, 4-hydroxytamoxifen was dissolved to 10 mg/ml in ethanol and sunflower seed oil (Sigma) and stored at −20°C. The solution was heated to 37°C before subcutaneous injection at 100 μg/g to pups 5 dpe (3 injections, >4 h apart). Pentobarbital (5–6 mg/kg) or an equivalent volume of sterile saline for control was injected twice a day starting at 2 dpe for 7 d.
Immunohistochemistry and image acquisition.
Five days to 6 weeks following electroporation, mice were deeply anesthetized (Nembutal 100 mg/kg, i.p.) and transcardially perfused with PBS followed by 4% paraformaldehyde. Brain tissue was drop-fixed in 4% paraformaldehyde overnight, and then sliced into 100 μm sections using a Leica VT1000S vibratome. Immunostaining was as we previously reported (Platel et al., 2008, 2009). Antibodies used include: rabbit anti-RFP (1:500, Rockland Immunochemicals), rat anti-RFP (1:500, Chromotek), chicken anti-GFP (1:500, Abcam), rabbit anti-Ki67 (1:500, Vector Labs), rabbit anti-cleaved caspase-3 (1:250, Cell Signaling Technology), rabbit anti-Sox2 (1:1000, Abcam), mouse anti-GFAP (1:500, Millipore Bioscience Research Reagents), Alexa Fluor dye conjugates (1:1000, Invitrogen), FITC or DyLight dye conjugates (1:500, Jackson ImmunoResearch), and nuclear stains To-Pro-3 or DAPI (1:5000, Invitrogen). Sections were mounted in Prolong Gold antifade reagent (Invitrogen). Images were acquired using an Olympus Fluoview 1000 confocal microscope with a 20× objective (numerical aperture 0.75, optical section step size 2 μm).
Electrophysiology.
Horizontal OB slices (300 μm) were prepared from anesthetized (Nembutal 100 mg/kg, i.p.) P8–P42 mice using Leica VT1000S. An artificial CSF (ACSF) dissection solution with sucrose and reduced Ca2+ contained the following (in mm): 132 Sucrose, 28 NaCl, 2.6 KCl, 1.23 NaH2PO4, 3 MgSO4, 26 NaHCO3, 10 dextrose, and 1 CaCl2, equilibrated with 95% O2/5% CO2 and chilled to 4°C during slicing. Brain slices were incubated at 35°C for 30 min and then maintained at room temperature. During experiments, slices were superfused with ACSF at room temperature that contained the following (in mm): 124 NaCl, 3 KCl, 1.23 NaH2PO4, 1.2 MgSO4, 26 NaHCO3, 10 dextrose, and 2.5 CaCl2, equilibrated with 95% O2/5% CO2.
Perforated patch-clamp recordings were made from neurons in the granule cell layer of the OB as previously described (Wang et al., 2003; Platel et al., 2010a). Intracellular solution contained the following (in mm): 125 CsCl, 2 EGTA, 10 HEPES, 6 MgCl2, pH 7.24, mOsm 303 adjusted with sucrose. Patch electrodes (10–15 MΩ resistance) were front-loaded with gramicidin-free intracellular solution and then back-loaded with the gramicidin (5 μg/ml) intracellular solution. Pipette capacitance and series resistance were not compensated. Liquid junction potential was corrected by −4 mV. To determine the reversal potential of GABAA currents, muscimol (5 μm) was pressure-applied near the patched cell and a ramp protocol (−100 mV to +100 mV from a holding potential of −60 mV) was run at the peak of the current.
Calcium imaging experiments.
Horizontal OB slices or sagittal SVZ slices (300 μm) were prepared as described for electrophysiology experiments. SVZ cells and ganglion cell layer (GCL) neurons were loaded by pressure application of Fluo-4 AM (100 μm) or Oregon Green BAPTA (100 μm), respectively, both diluted in ACSF and 0.4% Pluronic acid F-127 (Invitrogen) as we previously described (Lacar et al., 2010; Young et al., 2010). Muscimol (25 μm) was pressure-applied near the loaded cells to detect GABAA responses, and at the end of each experiment, KCl (50 mm) was applied to ensure cell viability. Images were acquired every 2 s with Fluoview acquisition software. In the SVZ, RFP+ NPCs displayed faint GFP fluorescence that was low enough to allow the detection of changes in Fluo-4 fluorescence (data not shown). F0 (i.e., baseline) and F are the mean fluorescence intensities measured throughout all of the regions of interest (ROIs) and in each ROI, respectively. A change in fluorescence was considered to be a Ca2+ increase if it was >15% F/F0 increase. Intracellular Ca2+ changes were calculated and analyzed using Calsignal (Platel et al., 2007).
Morphometry.
Complete RFP+ neurons in confocal z-stacks acquired at 20× were traced using the NeuroLucida and NeuroExplorer morphometry software (MicroBrightField). Z-stacks from 3 different square fields of view were taken per OB section, from 3 different OB sections in a randomly selected series from each animal (N > 3 and indicated in the results). Sholl analyses were performed using summed dendrite length as a measure of morphological complexity. Length was measured in 10 μm increment concentric circles and plotted as a function of the radial distance from the soma. At 6 wpe, we limited analysis to neurons of the superficial GCL that are preferentially born during the neonatal period compared with deep neurons (Lemasson et al., 2005).
Careful examination of individual cells revealed two populations, which we termed Group 1 and Group 2. The two groups were visible on the Sholl analysis plot that displayed two peaks. Group 1 included cells with a peak complexity within the first 200 μm and Group 2 included cells with a peak complexity above the 200 μm mark. As a result, cells in Group 1 were significantly shorter than cells in Group 2 (data not shown). Although cell morphology analysis was performed blindly, we found that there was not an equal distribution of Group 1 and Group 2 cells in all the conditions examined. More Group 1 cells in the control condition compared with the experimental condition would result in artificial truncation of the second peak in the control condition due to the addition of zeroes. We thus divided cells into two groups and used a cutoff of 240 μm at 2 weeks and 250 μm at 6 weeks based on the Gaussian peak distribution.
Cell density measurement.
Confocal z-stacks of serial, coronal OB sections containing RFP+ neurons and sagittal SVZ sections containing RFP+ NPCs were acquired at 20× using an Olympus Fluoview 1000 confocal microscope. ImageJ (NIH, http://rsb.info.nih.gov/ij/) was used to manually count cells in a given volume and both of these numbers were used to arrive at cell density. Cells were counted in >3 different OB or SVZ sections from each animal (N > 3 and indicated in the results), and data were normalized to average littermate control densities.
Statistical analysis.
Statistical analysis was performed per animal (N) for cell density, proliferation and dendritic length, and per number of cells (n) for the patch-clamp and calcium imaging data. Statistical analysis was performed with GraphPad Prism 5 software, and the data are presented as mean ± SEM. Significance was assessed with unpaired two sided Student's t test unless otherwise mentioned. The other tests included Fisher Exact, one-way ANOVA, and two-way repeated-measures (RM) ANOVA (with condition as a between groups factor and radial distance from soma as a within group factor) with post hoc Bonferroni's test for comparison of dendritic length. Significance was set at p < 0.05 with the tests mentioned above, and asterisks indicate significance levels.
Results
shRNA expression in NPCs and newborn neurons using neonatal electroporation
To manipulate GABAA responses in SVZ cells, we used a knockdown approach in vivo for NKCC1. The knockdown was achieved by introducing plasmid DNA encoding shRNA into single NPCs via electroporation at P0–P1 (Lacar et al., 2010; Platel et al., 2010a). Since neonatal NPCs generate neuroblasts, both NPCs and neuroblasts express the vectors a few days post-electroporation (data not shown). Over time, fast cycling NPCs dilute the vector resulting in labeling of only a cohort of neuroblasts born within the first week post-electroporation (Lacar et al., 2010). These vector-expressing newborn neurons migrate to the OB through a rostral migratory stream (RMS), enter the OB synaptic network by 1 wpe, and reach their final location in the OB by 2 wpe (Fig. 1A).
Figure 1.

shRNA expression in the neonatal SVZ using electroporation. A, Diagrams illustrating time points and corresponding locations of SVZ-born cells following electroporation at P0–P1. B, Diagram of pSico before and after Cre-mediated recombination and gfp excision allowing shRNA expression. C, Confocal images of granule neurons expressing pRFP and pSico with or without pCre coelectroporation. Loss of GFP expression with Cre suggests functional recombination of the plasmid. D, SVZ cells expressing pCALNL and pSico with or without pCre coelectroporation. Note that the GFP from pSico persists in the SVZ despite functional Cre recombination as indicated by the presence of RFP from pCALNL. Scale bars: C, 25 μm; D, 50 μm.
The pSico vector used to express shRNA encodes a floxed sequence containing a GFP Stop reporter allowing us to monitor Cre-induced recombination through the loss of GFP (Fig. 1B; Ventura et al., 2004). pSico, a Cre-encoding plasmid (pCre), and a RFP-encoding vector (pRFP) were coelectroporated; GFP fluorescence (from pSico) was examined in the SVZ and the OB at 1–2 wpe. In the OB, GFP was lost in 80–90% of the newborn RFP+ neurons at 2 wpe, suggesting functional recombination and gfp excision (Fig. 1C). In the SVZ, RFP+ NPCs retained weak GFP expression at 2 wpe despite pCre coelectroporation (Fig. 1D). We hypothesized that despite gfp excision, GFP would persist due to both its half-life and a ceiling effect of Cre leading to pSico vector copies unaffected by Cre in NPCs. In newborn neurons, the ceiling effect would not occur due to pSico dilution following several cell divisions. To test this hypothesis, we used pCALNL-RFP, which allows RFP expression only in the presence of Cre (Matsuda and Cepko, 2007). At 2 wpe of pCre, pCALNL-RFP and pSico, both GFP and RFP were present in SVZ cells, suggesting that despite functional recombination, GFP persisted (Fig. 1D). This point is important for analyzing the percentage of proliferative cells in the SVZ as described below. Granule cells in the OB displayed only RFP (data not shown), consistent with pSico dilution following cell division. Collectively, these data suggest that pSico is an efficient vector that successfully recombined in newborn neurons and NPCs permitting shRNA expression.
NKCC1 knockdown curtails NPC proliferation resulting in reduced neuron production
To reduce GABAA-induced depolarization, we modified the chloride gradient by knocking down NKCC1 in neonatal NPCs in vivo. Indeed, by maintaining a high intracellular chloride concentration, NKCC1 imposes a chloride reversal potential more depolarized than GABAA reversal potential. GABAA receptor activation in cells expressing NKCC1, such as neuroblasts, leads to chloride efflux from the cells and thus a GABAA-induced depolarization. pSico encoding shNKCC1 was transfected into Neuro-2a cells with HA-tagged NKCC1 overexpressor (Carmosino et al., 2008), and with or without pCre to verify NKCC1 knockdown (Fig. 2A). The shNKCC1 sequence was the same as that recently published (Ge et al., 2006; Wang and Kriegstein, 2008). In the presence of pCre, shNKCC1 reduced levels of NKCC1-HA to 1.3 ± 2.9% of control without pCre (p < 0.01, N = 8 each condition, Fig. 2B). Littermate wild-type mice were then electroporated with pSico encoding shNKCC1 or shControl.
Figure 2.
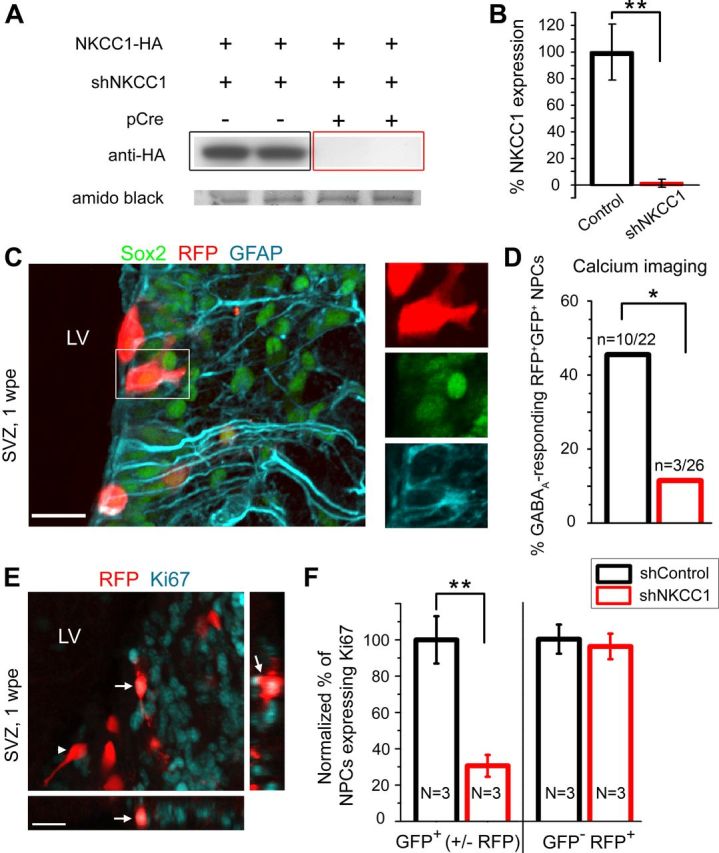
NKCC1 knockdown curtails NPC proliferation resulting in reduced neuron production. A, Western blot of NKCC1 knockdown in Neuro-2a cells transfected with HA-tagged NKCC1 overexpressor and shNKCC1 with or without pCre. Amido black staining verifies equivalent amounts of protein loaded in each condition. B, Quantification of NKCC1-HA expression in Neuro-2a cells following knockdown with shNKCC1. C, Confocal images of the SVZ at 1 wpe, including cells expressing a stem cell marker Sox2 (pseudo-colored green), RFP (red) and GFAP (blue) immunostaining. Box indicates the RFP+ Sox2+ GFAP+ cell magnified on the right. D, Quantification of muscimol-responding RFP+ NPCs at 1 wpe electroporated with shControl (black) or shNKCC1 (red). E, Confocal images of RFP (red) and cell division marker Ki67 (blue) immunostaining in the SVZ at 1 wpe. Arrows: RFP+ Ki67+ cell, also displayed in projections; arrowhead: RFP+ cell that is not Ki67+. F, Quantifications of RFP+ GFP+ NPCs and RFP+ GFP− (internal control) NPCs expressing Ki67+ with shControl (black) or shNKCC1 (red). *p ≤ 0.05, **p < 0.01. Scale bars: C and E, 20 μm.
In NPCs, GABAA-induced depolarization leads to intracellular calcium increases through voltage-gated calcium channels (Young et al., 2010). A decreased magnitude of GABAA-induced depolarization is expected to decrease the likelihood to reach the voltage threshold for opening calcium channels. We thus used calcium imaging to examine whether GABAA-induced calcium increase was lost in shNKCC1-containing NPCs. Although patch-clamp recording is another approach allowing direct measurements of the GABAA reversal potential (EGABA, i.e., imposed by the chloride gradient), NPCs express gap junctions leading to poor space-clamp of the GABAA-induced currents making EGABA difficult to assess accurately (Liu et al., 2006; Lacar et al., 2011). At 1 wpe in the SVZ, the majority of RFP+ cells, which are derived from radial glia, express GFAP and the stem cell marker Sox2, and are thus considered NPCs (Graham et al., 2003; Fig. 2C). A minority of RFP+ cells in the SVZ are ependymal cells that are not proliferative and did not respond to GABAA agonists (data not shown). We found that significantly fewer shNKCC1- than shControl-containing NPCs displayed calcium increases in response to GABAA activation (3/26 [11%] shNKCC1 NPCs versus 10/22 [45%] shControl NPCs, p = 0.01, Fisher's Exact test, N = 5 each, Fig. 2D).
Knowing that pharmacological inhibition or enhancement of GABAA activity in acute slices and in vivo, respectively, altered the number of proliferative cells in the SVZ (Liu et al., 2005; Cesetti et al., 2011), we used immunostaining for the cell division marker Ki67 to assess the percentage of proliferative NPCs (Fig. 2E). Since GFP+ cells in the SVZ express shNKCC1 from pSico (Fig. 1), we analyzed GFP+ cells (with and without RFP). We found a significant 70% decrease in the percentage of GFP+ NPCs that were Ki67+ with shNKCC1 compared with shControl (p = 0.008, N = 3 each, unpaired two sided t test, Fig. 2E,F). We also analyzed RFP+GFP− cells that do not contain the shNKCC1 and thus represent an internal control. There was no change in the percentage of proliferative RFP+GFP− NPCs (Fig. 2F).
Such a decrease in NPC proliferation implies that neuron production is decreased. Visual inspection of the GCL in OB sections suggested a decreased number of RFP+ newborn neurons in shNKCC1 compared with littermate shControl-electroporated animals (Fig. 3A). Quantification revealed a significant 60% decrease in density of shNKCC1-containing neurons compared with control (p = 0.0002, N = 6 each, Fig. 3B). There was no difference in electroporation efficiency as assessed by the density of RFP+ cells in the SVZ from the same brains (Fig. 3B). In addition, in the absence of pCre coelectroporation, there was no difference in RFP+ neuron density between shNKCC1 and shControl (Fig. 3B). As mentioned earlier, NPCs generate neuroblasts that are expected to contain shNKCC1. shNKCC1 in neuroblasts may affect their migration or survival and contribute to a decrease in newborn neurons in the OB. However, there was no change in the number of cleaved caspase 3- immunopositive cells in the SVZ-OB axis (data not shown). In addition, we found no ectopic neuroblasts in the shNKCC1 condition. Thus, a decrease in the number of proliferative NPCs following loss of GABAA-induced depolarization likely accounts for the reduced number of newborn neurons.
Figure 3.
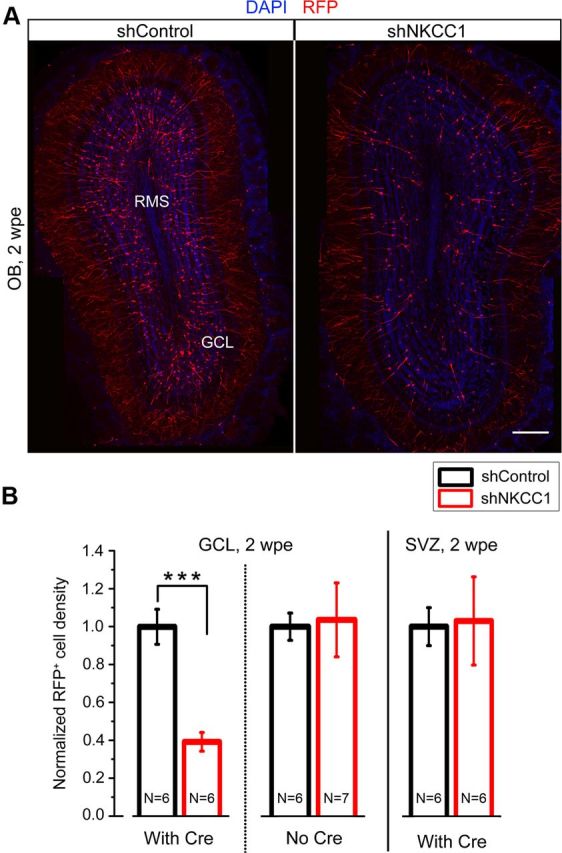
NKCC1 knockdown in NPCs results in reduced neuron production. A, Representative images of shControl (left) and shNKCC1 (right) RFP+ neurons in the OB, showing a decrease in the number of RFP+ newborn neurons containing shNKCC1. B, Quantifications of normalized RFP+ cell density in the GCL with and without pCre and in the SVZ at 2 wpe. N, number of mice. ***p < 0.001. Scale bar, 100 μm.
shNKCC1 leads to premature loss of GABAA depolarization in newborn neurons and dendritic truncation
GABAA receptor activation is known to depolarize newborn neuroblasts in the SVZ and RMS (Wang et al., 2003). To examine whether GABAA-induced depolarization in newborn neurons was prematurely lost using shNKCC1, we performed gramicidin-perforated patch-clamp recordings and calcium imaging in acute slices (Wang et al., 2003; Platel et al., 2010a). In the GCL, EGABA was obtained by recording 5 μm muscimol-induced GABAA currents in RFP+ neurons. In shControl neurons, EGABA shifted from depolarizing to hyperpolarizing between 1 and 4 wpe over the course of synaptic integration (p = 0.004, n = 20 and 10 cells, respectively, Fig. 4A). With shNKCC1, we expected a premature shift in EGABA. Indeed, shNKCC1-containing newborn neurons displayed significantly more negative EGABA than shControl neurons at 1 wpe (−58 versus −48 mV, p = 0.001, n = 6 shControl and 20 shNKCC1 cells, Fig. 4A). Using calcium imaging at 2 wpe in the GCL, we found that GABAA activation induced calcium increases in significantly fewer shNKCC1 than shControl neurons (3/29 [10%] shNKCC1 cells versus 8/13 [61%] shControl cells, p = 0.001, Fisher's Exact test, Fig. 4B). Collectively, these data show that NKCC1 knockdown prematurely suppresses GABAA-induced depolarization in newborn neurons.
Figure 4.

GABAA depolarizing activity promotes dendritogenesis of newborn neurons. A, Left, Representative current (I)-voltage (V) curves of 5 μm muscimol-induced currents in shNKCC1 (red) and shControl (black) GCL neurons at 1 wpe. Arrows indicate EGABA, the means of which are plotted on the right at 1 wpe (n = 6 shNKCC1 and 20 shControl cells) and 4 wpe (n = 7 and 10). NS, Not significant. B, Left, Images of RFP+ (red) and calcium dye Oregon Green BAPTA-loaded (green) neurons in the GCL at 2 wpe. Right, Significantly fewer shNKCC1 neurons exhibit calcium responses to muscimol compared with shControl, indicating decreased GABAA-induced depolarization in shNKCC1 neurons. C, D, F, G, Representative reconstructions of Group 2 shNKCC1 and shControl neurons at 2 (C) and 6 (F) wpe and corresponding plots of the summed dendrite length (D, G). E, H, Graphs of total dendritic length of Group 2 neurons with shControl (black) and shNKCC1 (red) at 2 (D) and 6 (G) wpe. A break was inserted in the y-axis. n, number of cells analyzed. *p ≤ 0.05, **p < 0.01. Scale bars: B, 60 μm; C, F, 100 μm.
We examined dendritic complexity of both shControl and shNKCC1-containing newborn granule cells at 2 wpe, which corresponds to a critical period of cell maturation and synaptic integration (Petreanu and Alvarez-Buylla, 2002; Nissant et al., 2009; Fig. 4C). Newborn neurons were split into two groups based on morphology (see Materials and Methods). At 2 wpe, we found that Group 1 shNKCC1 and shControl neurons displayed similar degree of complexity (two-way RM ANOVA, p > 0.05, Fig. 4D), resulting in a similar total dendritic length (data not shown). Group 2 shNKCC1 neurons had significantly less complex apical dendrites than those of shControl neurons at 2 wpe (two-way RM ANOVA, p < 0.001) with decreased length at 300–330 μm from the soma (Bonferroni post hoc test, p < 0.01, N = 3 each, Fig. 4D). This was accompanied by a 23% decrease in their total dendritic length (p = 0.04, Fig. 4E). Next, we examined dendritic complexity at 6 wpe when maturation and synaptic integration of newborn neurons are completed (Petreanu and Alvarez-Buylla, 2002; Fig. 4F). At 6 wpe, Group 1 neurons displayed similar dendritic complexity between the two conditions. Group 2 shNKCC1 neurons displayed a small, though significant, decrease in their dendritic complexity (two-way RM ANOVA, p < 0.011) with decreased length at 240 μm from the soma (Bonferroni post hoc test, p < 0.05, N = 4 each, Fig. 4G). The total dendritic length was not significantly different (Fig. 4H). These data suggest that GABAA-induced depolarization is important for dendritic growth during synaptic integration resulting in a truncated dendritic tree in cells experiencing premature loss of GABAA-induced depolarization with shNKCC1. Once integrated, the dendritic complexity of shNKCC1-containing newborn neurons recovered to some extent, but not completely, compared with control neurons.
shNKCC1 in newborn neurons and bypassing NPCs leads to truncated dendritic trees and normal neuron production
To further validate that the change in neuronal density was due to a decreased NPC proliferation and not neuroblast loss, we used the inducible pERT2CreERT2 strategy to bypass NKCC1 knockdown in NPCs (Fig. 5A,B) and determine whether the effect on cell number remained. 4-Hydroxytamoxifen injections at 5 dpe led to gfp excision in newborn neurons in the OB (data not shown). Calcium imaging at 2 wpe validated efficient NKCC1 knockdown as shown by the significant loss of GABAA-induced calcium increase in shNKCC1 compared with shControl-containing neurons (9/23 [39%] shControl cells versus 3/34 [9%] shNKCC1 cells, p = 0.008, Fisher's Exact test, 5 μm muscimol, Fig. 5C). Using pERT2CreERT2 induction at 5 dpe, we found that the density of newborn neurons was not significantly different between shNKCC1- and shControl-electroporated animals (p ≥ 0.247, N = 4 or 5, Fig. 5D). These data further support the finding that GABAA depolarizing activity in NPCs regulates their proliferation, resulting in a major decrease in the number of newborn neurons generated. Ultimately, the major effect of NKCC1 knockdown is primarily on the density of newborn neurons and less on their dendritic complexity, which partially recovered by 6 wpe. We thus primarily focused on NPC proliferation for the remainder of the study. Considering that NKCC1 could have effects independent of GABAA receptor activity (e.g., volume regulation; Cesetti et al., 2011), we examined whether another manipulation of GABAA activity could alter NPC proliferation.
Figure 5.

Reducing GABAA-induced depolarization in newborn neurons but not in NPCs leads to truncated dendritic trees but normal neuron production. A, Diagram of pSico encoding shNKCC1 before and after tamoxifen-induced ERT2CreERT2-mediated recombination and gfp excision allowing shNKCC1 expression in newborn neurons. B, Diagram illustrating that pERT2CreERT2 coelectroporated mice were injected with tamoxifen at 5 dpe, when most newly born neurons have exited the SVZ. C, Calcium imaging in the GCL at 2 wpe (9 d post-tamoxifen, dpt) shows a significant decrease in the number of shNKCC1 (red) neurons responding to muscimol compared with shControl (black), indicating decreased GABAA-induced depolarization and therefore efficient NKCC1 knockdown. D, shNKCC1 neuron density normalized to control at 9 d post-tamoxifen. n, number of cells; N, number of mice analyzed. **p < 0.01.
Pentobarbital treatment increases the number of proliferative NPCs and prevents the shNKCC1-induced decrease
GABAA currents recorded in SVZ cells have been shown to be significantly enhanced by the barbiturate pentobarbital, a GABAA receptor allosteric agonist (Liu et al., 2005). We thus explored whether pentobarbital treatment would have an opposed effect on the number of Ki67+ NPCs compared with shNKCC1 electroporation. In addition, we examined whether pentobarbital would prevent the effect observed by shNKCC1. Mice were treated with pentobarbital (5–6 mg/kg) or saline twice a day for 7 d from P2 to P8 following electroporation with pRFP and shNKCC1 or shControl at P0 (Fig. 6A). At P8, we analyzed the percentage of RFP+ NPCs that were Ki67+ in shControl + saline and shControl + pentobarbital and as described above for mice electroporated with shNKCC1 with and without pentobarbital. Comparison was performed using one-way ANOVA followed by Tukey–Kramer test. We found a significant 47% increase with pentobarbital compared with saline (from 10.0% to 14.5%, N = 3 each, p = 0.02, Fig. 6B). The combined treatment with shNKCC1 and pentobarbital (N = 5) prevented such an increase in the percentage of proliferative NPCs induced by pentobarbital and normalized this percentage (from 14.5% in pentobarbital to 9.5% with combined treatment, p = 0.045). When compared with shNKCC1 electroporated mice, the combined treatment also prevented the decrease in proliferative NPCs induced by shNKCC1 (from 10.0% to 5.1% with shNKCC1, N = 3, p = 0.027, Fig. 6B). Collectively, these data suggest that enhancement of GABAA activity in NPCs results in an increase in the number of proliferative NPCs. In addition, these data suggest that shNKCC1 alone and pentobarbital alone affected NPCs through GABAA receptors.
Figure 6.

Effects of pentobarbital and combined shNKCC1/pentobarbital treatments on the number of proliferative NPCs. A, Diagram illustrating the experimental paradigm. B, Quantification of RFP+ and GFP+ NPCs expressing Ki67 in four different conditions: shControl (open black), shControl plus pentobarbital (pento, gray filled black), shNKCC1 plus pento (gray-filled red), and shNKCC1 (open red). The GABAA agonist increased NPC proliferation in shControl cells and rescued the proliferative defect in shNKCC1 cells. *p < 0.05.
Discussion
Our data show that GABAA receptor activation controls important facets of neurogenesis, including NPC proliferation and dendritic morphogenesis of newborn neurons during a critical period of synaptic integration. Importantly, in vivo reduction of GABAA depolarizing activity in NPCs led to a significant decrease in the number of newborn neurons.
Altered dendritogenesis following reduced GABAA-induced depolarization reported here has also been shown in embryonic and adult systems in vivo suggesting that it is a highly conserved function of GABAA receptor activity (Ge et al., 2006; Wang and Kriegstein, 2008; Duveau et al., 2011). Our data are also consistent with a previous report showing that GABAA activity regulated dendritic growth by stabilizing lamellipodia in newborn neurons migrating to the OB in acute slices (Gascon et al., 2006). However, it was surprising to find that the dendritic length of NKCC1-expressing neurons recovered over time. The 6-week-old NKCC1-containing neurons displayed a minor, albeit significant, decrease in their complexity. Our data thus suggest that a premature loss of GABAA-induced depolarizations in newborn neurons has a negative impact on dendritogenesis during a critical period of integration and plasticity (Petreanu and Alvarez-Buylla, 2002; Nissant et al., 2009) despite a partial recovery once fully integrated.
Our data suggest that altered GABAA depolarizing activity in NPCs using a single cell genetic approach led to a significant decrease in the number of proliferative NPCs and in neuron production. Bypassing NPCs using an inducible Cre-encoding plasmid to alter GABAA activity only in immature neurons resulted in a normal density of neurons. Our data suggest that GABAA depolarizing activity promotes neonatal NPC proliferation, which is in contrast with our previous finding in slices using pharmacological GABAA receptor inhibition (Liu et al., 2005). However, several reasons could explain the discrepancies between these findings. The ages of the animals were different (neonate here versus 3–4 weeks old), which is important because the neonatal SVZ is morphologically and antigenically different in neonates and >P20 animals (Peretto et al., 2005). In addition, here we genetically altered radial glia. These radial glia subsequently generate type B cells (astrocyte-like cells), which we examined in the earlier study. Here we used a genetic approach allowing us to manipulate single cells in vivo, suggesting that our effects are cell-autonomous. In the other study, bath application of a GABAA antagonist could have indirect effects on the network, including the release of various factors altering cell proliferation. Finally, we had speculated two types of GABAergic inputs onto NPCs, one tonic from neuroblasts and one phasic (synaptic-like) from extra-SVZ sources (Bordey, 2007). These distinct sources could use distinct mechanisms of GABAA action and differentially affect NPC proliferation. Addressing these mechanisms is outside the scope of the present study. Our findings also seem to contradict the findings of a previous study reporting GABAA-induced depolarization in NPCs of the SVZ (Cesetti et al., 2011). However in this latter study, the authors likely recorded from transit amplifying cells that act as NPCs with more restricted self-renewal capacity. Here, NPCs refer predominantly to neural stem cells with radial glia features that are receiving the plasmid. Transit amplifying cells are rapidly proliferative and are thus expected to quickly dilute plasmids and shRNA.
To further investigate GABAA receptor regulation of NPC proliferation, we used the barbiturate pentobarbital, which increases the amplitude of GABAA responses in NPCs of the SVZ (Liu et al., 2005) and is routinely used in the treatment of epilepsy. In vivo pentobarbital treatment resulted in a significant increase in the number of proliferative NPCs, consistent with the effect of NKCC1 knockdown (decreased proliferation with reduced GABAA activity). Mechanistically, by increasing the amplitude of GABAA-induced depolarization with pentobarbital as previously shown (Liu et al., 2005), GABAA receptor activation is expected to depolarize NPCs above the voltage threshold for opening voltage-gated calcium channels (Young et al., 2010). shNKCC1 has the opposite effect compared with pentobarbital. Indeed, since shNKCC1 reduces the driving force for chloride efflux, it is expected to decrease the amplitude of GABAA-induced depolarization, which then does not reach the threshold for opening calcium channels; as a result fewer shNKCC1-containing NPCs display calcium increases. We thus tested pentobarbital in shNKCC1-containing NPCs because it is known to increase GABAA depolarization. We found that a combined treatment consisting of shNKCC1 and pentobarbital prevented the effect observed by pentobarbital treatment. This finding suggests that pentobarbital affected NPC proliferation through a cell autonomous effect and through GABAA receptors as opposed to a systemic effect. In addition, comparing the combined treatment to mice that were electroporated with shNKCC1 but not treated with pentobarbital revealed that the combined treatment prevented the effect of NKCC1 knockdown on NPC proliferation. This importantly suggests that the effects of shNKCC1 on proliferation acted through GABAA receptor activity. Mechanistically, although it is tempting to propose that GABAA receptors act on NPC proliferation through calcium increases, additional experiments knocking out selective calcium channel subunits would be required; such experiments are outside the scope of the present study.
In conclusion, reduced GABAA-induced depolarization caused decreased NPC proliferation, resulting in the underproduction of neurons. It is likely that NPCs of various developmental systems may respond differentially to altered GABAA activity, but the effect on cell proliferation is likely conserved across systems and ages as shown in vitro. Collectively, our findings may explain how dysfunctional GABAA signaling beginning in neural stem cells may contribute to altered neuronal density and dendritic arbors reported in individuals with schizophrenia and autism spectrum disorder (Rubenstein and Merzenich, 2003; Chao et al., 2010).
Footnotes
This work was supported by grants from CT Stem Cell initiative, NIH R01 DC007681 (A.B.) and NRSA F31 NS063758 (S.Z.Y). We thank Ivy Nguyen for helping with tracing and the lab members for helpful discussion and comments. The present material is based on work partly supported by the State of Connecticut under the Connecticut Stem Cell Research Grants Program. Its contents are solely the responsibility of the authors and do not necessarily represent the official views of the State of Connecticut, the Department of Public Health of the State of Connecticut, or CT Innovations, Inc. The funders had no role in study design, data collection and analysis, decision to publish, or preparation of the manuscript.
References
- Arion D, Lewis DA. Altered expression of regulators of the cortical chloride transporters NKCC1 and KCC2 in schizophrenia. Arch Gen Psychiatry. 2011;68:21–31. doi: 10.1001/archgenpsychiatry.2010.114. [DOI] [PMC free article] [PubMed] [Google Scholar]
- Bordey A. Adult neurogenesis: basic concepts of signaling. Cell Cycle. 2006;5:722–728. doi: 10.4161/cc.5.7.2614. [DOI] [PubMed] [Google Scholar]
- Bordey A. Enigmatic GABAergic networks in adult neurogenic zones. Brain Res Rev. 2007;53:124–134. doi: 10.1016/j.brainresrev.2006.07.004. [DOI] [PubMed] [Google Scholar]
- Brang D, Ramachandran VS. Olfactory bulb dysgenesis, mirror neuron system dysfunction, and autonomic dysregulation as the neural basis for autism. Med Hypotheses. 2010;74:919–921. doi: 10.1016/j.mehy.2008.11.048. [DOI] [PubMed] [Google Scholar]
- Carmosino M, Giménez I, Caplan M, Forbush B. Exon loss accounts for differential sorting of Na-K-Cl cotransporters in polarized epithelial cells. Mol Biol Cell. 2008;19:4341–4351. doi: 10.1091/mbc.E08-05-0478. [DOI] [PMC free article] [PubMed] [Google Scholar]
- Cesetti T, Fila T, Obernier K, Bengtson CP, Li Y, Mandl C, Hölzl-Wenig G, Ciccolini F. GABA(A) receptor signalling induces osmotic swelling and cell cycle activation of neonatal prominin(+) precursors. Stem Cells. 2011;29:307–319. doi: 10.1002/stem.573. [DOI] [PubMed] [Google Scholar]
- Chao HT, Chen H, Samaco RC, Xue M, Chahrour M, Yoo J, Neul JL, Gong S, Lu HC, Heintz N, Ekker M, Rubenstein JL, Noebels JL, Rosenmund C, Zoghbi HY. Dysfunction in GABA signalling mediates autism-like stereotypies and Rett syndrome phenotypes. Nature. 2010;468:263–269. doi: 10.1038/nature09582. [DOI] [PMC free article] [PubMed] [Google Scholar]
- Duveau V, Laustela S, Barth L, Gianolini F, Vogt KE, Keist R, Chandra D, Homanics GE, Rudolph U, Fritschy JM. Spatiotemporal specificity of GABAA receptor-mediated regulation of adult hippocampal neurogenesis. Eur J Neurosci. 2011;34:362–373. doi: 10.1111/j.1460-9568.2011.07782.x. [DOI] [PMC free article] [PubMed] [Google Scholar]
- Gascon E, Dayer AG, Sauvain MO, Potter G, Jenny B, De Roo M, Zgraggen E, Demaurex N, Muller D, Kiss JZ. GABA regulates dendritic growth by stabilizing lamellipodia in newly generated interneurons of the olfactory bulb. J Neurosci. 2006;26:12956–12966. doi: 10.1523/JNEUROSCI.4508-06.2006. [DOI] [PMC free article] [PubMed] [Google Scholar]
- Ge S, Goh EL, Sailor KA, Kitabatake Y, Ming GL, Song H. GABA regulates synaptic integration of newly generated neurons in the adult brain. Nature. 2006;439:589–593. doi: 10.1038/nature04404. [DOI] [PMC free article] [PubMed] [Google Scholar]
- Graham V, Khudyakov J, Ellis P, Pevny L. SOX2 functions to maintain neural progenitor identity. Neuron. 2003;39:749–765. doi: 10.1016/s0896-6273(03)00497-5. [DOI] [PubMed] [Google Scholar]
- Henschel O, Gipson KE, Bordey A. GABAA receptors, anesthetics and anticonvulsants in brain development. CNS Neurol Disord Drug Targets. 2008;7:211–224. doi: 10.2174/187152708784083812. [DOI] [PMC free article] [PubMed] [Google Scholar]
- Lacar B, Young SZ, Platel JC, Bordey A. Imaging and recording subventricular zone progenitor cells in live tissue of postnatal mice. Front Neurosci. 2010;4:43. doi: 10.3389/fnins.2010.00043. [DOI] [PMC free article] [PubMed] [Google Scholar]
- Lacar B, Young SZ, Platel JC, Bordey A. Gap junction-mediated calcium waves define communication networks among murine postnatal neural progenitor cells. Eur J Neurosci. 2011;34:1895–1905. doi: 10.1111/j.1460-9568.2011.07901.x. [DOI] [PMC free article] [PubMed] [Google Scholar]
- Lemasson M, Saghatelyan A, Olivo-Marin JC, Lledo PM. Neonatal and adult neurogenesis provide two distinct populations of newborn neurons to the mouse olfactory bulb. J Neurosci. 2005;25:6816–6825. doi: 10.1523/JNEUROSCI.1114-05.2005. [DOI] [PMC free article] [PubMed] [Google Scholar]
- Liu X, Wang Q, Haydar TF, Bordey A. Nonsynaptic GABA signaling in postnatal subventricular zone controls proliferation of GFAP-expressing progenitors. Nat Neurosci. 2005;8:1179–1187. doi: 10.1038/nn1522. [DOI] [PMC free article] [PubMed] [Google Scholar]
- Liu X, Bolteus AJ, Balkin DM, Henschel O, Bordey A. GFAP-expressing cells in the postnatal subventricular zone display a unique glial phenotype intermediate between radial glia and astrocytes. Glia. 2006;54:394–410. doi: 10.1002/glia.20392. [DOI] [PubMed] [Google Scholar]
- LoTurco JJ, Owens DF, Heath MJ, Davis MB, Kriegstein AR. GABA and glutamate depolarize cortical progenitor cells and inhibit DNA synthesis. Neuron. 1995;15:1287–1298. doi: 10.1016/0896-6273(95)90008-x. [DOI] [PubMed] [Google Scholar]
- Matsuda T, Cepko CL. Controlled expression of transgenes introduced by in vivo electroporation. Proc Natl Acad Sci U S A. 2007;104:1027–1032. doi: 10.1073/pnas.0610155104. [DOI] [PMC free article] [PubMed] [Google Scholar]
- Muhle R, Trentacoste SV, Rapin I. The genetics of autism. Pediatrics. 2004;113:e472–e486. doi: 10.1542/peds.113.5.e472. [DOI] [PubMed] [Google Scholar]
- Nguyen AD, Shenton ME, Levitt JJ. Olfactory dysfunction in schizophrenia: a review of neuroanatomy and psychophysiological measurements. Harv Rev Psychiatry. 2010;18:279–292. doi: 10.3109/10673229.2010.511060. [DOI] [PubMed] [Google Scholar]
- Nissant A, Bardy C, Katagiri H, Murray K, Lledo PM. Adult neurogenesis promotes synaptic plasticity in the olfactory bulb. Nat Neurosci. 2009;12:728–730. doi: 10.1038/nn.2298. [DOI] [PubMed] [Google Scholar]
- Owens DF, Kriegstein AR. Is there more to GABA than synaptic inhibition? Nat Rev Neurosci. 2002;3:715–727. doi: 10.1038/nrn919. [DOI] [PubMed] [Google Scholar]
- Peretto P, Giachino C, Aimar P, Fasolo A, Bonfanti L. Chain formation and glial tube assembly in the shift from neonatal to adult subventricular zone of the rodent forebrain. J Comp Neurol. 2005;487:407–427. doi: 10.1002/cne.20576. [DOI] [PubMed] [Google Scholar]
- Petreanu L, Alvarez-Buylla A. Maturation and death of adult-born olfactory bulb granule neurons: role of olfaction. J Neurosci. 2002;22:6106–6113. doi: 10.1523/JNEUROSCI.22-14-06106.2002. [DOI] [PMC free article] [PubMed] [Google Scholar]
- Platel JC, Dupuis A, Boisseau S, Villaz M, Albrieux M, Brocard J. Synchrony of spontaneous calcium activity in mouse neocortex before synaptogenesis. Eur J Neurosci. 2007;25:920–928. doi: 10.1111/j.1460-9568.2007.05367.x. [DOI] [PubMed] [Google Scholar]
- Platel JC, Gordon V, Heintz T, Bordey A. GFAP-GFP neural progenitors are antigenically homogeneous and anchored in their enclosed mosaic niche. Glia. 2009;57:66–78. doi: 10.1002/glia.20735. [DOI] [PubMed] [Google Scholar]
- Platel JC, Dave KA, Gordon V, Lacar B, Rubio ME, Bordey A. NMDA receptors activated by subventricular zone astrocytic glutamate are critical for neuroblast survival prior to entering a synaptic network. Neuron. 2010a;65:859–872. doi: 10.1016/j.neuron.2010.03.009. [DOI] [PMC free article] [PubMed] [Google Scholar]
- Platel JC, Stamboulian S, Nguyen I, Bordey A. Neurotransmitter signaling in postnatal neurogenesis: the first leg. Brain Res Rev. 2010b;63:60–71. doi: 10.1016/j.brainresrev.2010.02.004. [DOI] [PMC free article] [PubMed] [Google Scholar]
- Platel JC, Heintz T, Young S, Gordon V, Bordey A. Tonic activation of GLUK5 kainate receptors decreases neuroblast migration in a whole mount preparation of the subventricular zone. J Physiol. 2008;586:3783–3793. doi: 10.1113/jphysiol.2008.155879. [DOI] [PMC free article] [PubMed] [Google Scholar]
- Potkin SG, Turner JA, Guffanti G, Lakatos A, Fallon JH, Nguyen DD, Mathalon D, Ford J, Lauriello J, Macciardi F. A genome-wide association study of schizophrenia using brain activation as a quantitative phenotype. Schizophr Bull. 2009;35:96–108. doi: 10.1093/schbul/sbn155. [DOI] [PMC free article] [PubMed] [Google Scholar]
- Rubenstein JL, Merzenich MM. Model of autism: increased ratio of excitation/inhibition in key neural systems. Genes Brain Behav. 2003;2:255–267. doi: 10.1034/j.1601-183x.2003.00037.x. [DOI] [PMC free article] [PubMed] [Google Scholar]
- Tobin VA, Hashimoto H, Wacker DW, Takayanagi Y, Langnaese K, Caquineau C, Noack J, Landgraf R, Onaka T, Leng G, Meddle SL, Engelmann M, Ludwig M. An intrinsic vasopressin system in the olfactory bulb is involved in social recognition. Nature. 2010;464:413–417. doi: 10.1038/nature08826. [DOI] [PMC free article] [PubMed] [Google Scholar]
- Ventura A, Meissner A, Dillon CP, McManus M, Sharp PA, Van Parijs L, Jaenisch R, Jacks T. Cre-lox-regulated conditional RNA interference from transgenes. Proc Natl Acad Sci U S A. 2004;101:10380–10385. doi: 10.1073/pnas.0403954101. [DOI] [PMC free article] [PubMed] [Google Scholar]
- Wang DD, Kriegstein AR. GABA regulates excitatory synapse formation in the neocortex via NMDA receptor activation. J Neurosci. 2008;28:5547–5558. doi: 10.1523/JNEUROSCI.5599-07.2008. [DOI] [PMC free article] [PubMed] [Google Scholar]
- Wang DD, Krueger DD, Bordey A. GABA depolarizes neuronal progenitors of the postnatal subventricular zone via GABAA receptor activation. J Physiol. 2003;550:785–800. doi: 10.1113/jphysiol.2003.042572. [DOI] [PMC free article] [PubMed] [Google Scholar]
- Young SZ, Bordey A. GABA's control of stem and cancer cell proliferation in adult neural and peripheral niches. Physiology (Bethesda) 2009;24:171–185. doi: 10.1152/physiol.00002.2009. [DOI] [PMC free article] [PubMed] [Google Scholar]
- Young SZ, Platel JC, Nielsen JV, Jensen NA, Bordey A. GABAA increases calcium in subventricular zone astrocyte-like cells through L- and T-type voltage-gated calcium channels. Front Cell Neurosci. 2010;4:8. doi: 10.3389/fncel.2010.00008. [DOI] [PMC free article] [PubMed] [Google Scholar]