

Abstract
Docking and virtual screening (VS) reach maximum potential when the receptor displays the structural changes needed for accurate ligand binding. Unfortunately, these conformational changes are often poorly represented in experimental structures or homology models, debilitating their docking performance. Recently, we have shown that receptors optimized with our LiBERO method (Ligand-guided Backbone Ensemble Receptor Optimization) were able to better discriminate active ligands from inactives in flexible-ligand VS docking experiments. The LiBERO method relies on the use of ligand information for selecting the best performing individual pockets from ensembles derived from normal mode analysis or Monte Carlo. Here we present ALiBERO, a new computational tool that has expanded the pocket selection from single to multiple, allowing for automatic iteration of the sampling-selection procedure. The selection of pockets is performed by a dual method that uses exhaustive combinatorial search plus individual addition of pockets, selecting only those that maximize the discrimination of known actives compounds from decoys. The resulting optimized pockets showed increased VS performance when later used in much larger unrelated test sets consisting of biologically active and inactive ligands. In this paper we will describe the design and implementation of the algorithm, using as a reference the human estrogen receptor alpha.
INTRODUCTION
Docking methods are one of the preferred tools for computational prediction of ligand–receptor interactions. Thanks to methodological advances in the field, today we are able to re-dock small molecules into their cognate receptor (a.k.a., self-docking) correctly in as many as ~ 90% of the cases.1 Much less optimistic are the expectations of accurate docking of new ligands into non-cognate receptors (a.k.a., cross-docking), a crucial activity in the world of computational drug discovery. According to our results, cross-docking experiments still provide incorrect results for half of the ligands when the receptor flexibility is not taken into account.2
A plethora of approximations have been proposed to address the issue of receptor’s flexibility in docking context, thoroughly reviewed elsewhere.3–8 For the sake of simplicity, here we discretized those approaches into two main categories: a) sampling techniques using exhaustive search of both the ligand and the receptor, and b) sampling techniques using exhaustive search for the ligand while considering one or multiple forms of the receptor “rigid”. Molecular dynamics (MD) simulation can be considered as a representative of the former category. In a MD simulation, solvent molecules emulating physiological environments surround the receptor and ligand, and the atomic interactions are calculated with the force field.9 Unfortunately, despite encouraging results from the MD community10, 11, exhaustive sampling of the protein–ligand space still remains to be benchmarked within the framework of VS. Ensemble docking, in which flexible-ligand dockings are performed in discrete pocket conformations, can be considered as a representative of the second category.12 In ensemble docking, the receptor plasticity is represented by the variation in experimental structures (e.g., from x-ray crystallography or nuclear magnetic resonance (NMR) spectroscopy), computational models, or both.13–18 The decoupling of the receptor and ligand sampling steps allows submission of the docking runs in parallel (e.g, Linux cluster), speeding up the time needed for the docking calculations. On the other hand, a great danger of the ensemble docking is that at some point the addition of pockets deteriorates the ensemble performance.16
In the context of ensemble docking, we previously proposed our ligand-guided optimization framework LiBERO (Ligand-guided Backbone Ensemble Receptor Optimization)19, which consists of two main steps: (i) generation of multiple receptor conformations, and (ii) selection a posteriori of the best individual conformations according to docking/VS performance. LiBERO has proved to be useful in several applications including optimization of x-ray and homology models19–22 and prospective screening studies.23–25 Early applications of the method, however, only used a single iteration of the sampling-selection step and the conformers were “hand-picked” according to their individual VS performance. Whereas a large population of conformers (e.g., 800 in reference24), increased the likelihood of finding models with better performance, we observed that multiple iterations of the sampling-selection step significantly improved the discriminative power of the models.19 The iterations resulted in inheritance of advantageous conformational features in the pockets from the previous steps, combined with newly found features.
In this paper we present ALiBERO, a new method that has automated all the steps of the LiBERO framework. Starting from single or multiple receptor structures, the software iteratively creates receptor ensembles, performs VS docking and selects the combination of pockets that maximizes the recognition of ligand actives from decoys. The method was implemented as a free add-on to the ICM software (Molsoft LLC) and is presented in the context of small molecule docking, using crystal structures of human estrogen receptor alpha as an example (Uniprot entry: ESR1_HUMAN). The optimized pockets are later tested in prospective VS experiments with unrelated compounds, where they display increased recognition with respect to the original x-ray structures. As requested by the referees, the applicability of method was further tested with a distant homology model of the Adenosine receptor A2A (PDB ID: 3EML).
MATERIALS AND METHODS
ALiBERO has been implemented as an iterative algorithm based on heuristic search (see Figure 1), consisting of two main steps: i) a large population of receptor conformers (pockets) is generated, and, ii) a flexible-ligand static-receptor small-scale VS docking is carried out on each of the conformers, from which the best performing “children” pockets are selected for the next generation. This iterative process is repeated until a termination condition has been reached, such as reaching a threshold for the fitness function, or when successive iterations no longer improve the results. As input, the algorithm takes one or multiple 3D receptor structures, such as those coming from x-ray, NMR or in silico models, plus a ligand training set consisting of target-specific ligands and decoys (note that 3D information is not required for the ligand set).
Figure 1.

Flowchart of the ALiBERO method as used in small molecule docking context: As input, the algorithm takes one or multiple 3D receptor structures plus a ligand training set consisting of target-specific ligands plus decoys. In the first step, backbone and side chains plasticity is recreated by using 100 EN-NMA derived conformers. In the second step, a flexible-ligand static-receptor small-scale VS docking is carried out on each of the conformers, from which some pockets are selected for the next generation. The pockets are selected according to their combined screening performance, as measured by the NSQ_AUC (see Methods). The whole process is repeated until successive iterations no longer improve the results. Note that after the VS docking, an additional ICM side chain refinement step can be performed to replicate the changes induced-by-ligands.
In the next sections we will describe ALiBERO specifications in the context of small molecule ICM-VS docking.26 A more “hands-on” description of the method is addressed in a book chapter.27
Estrogen receptor preparation (Uniprot entry: ESR1_HUMAN)
The estrogen receptor ensemble was taken from our http://pocketome.org cross-docking database.28 The Pocketome is a large benchmark of ligand-receptor complexes collected in our laboratory to characterize receptor-ligand conformational changes in the Protein Data Bank (PDB). Each Pocketome entry describes a collective binding site and consists of an ensemble of experimentally determined structures of that site, holo or apo, superimposed in space, with associated textual and graphical information.28 When this study was performed, the ESR1_HUMAN_300_551 tag contained 31 holo receptors with their corresponding cognate ligands (see Table 1 and Supporting Table S1). The 31 holo structures represented a wide spectrum of the conformational plasticity displayed by the protein upon ligand binding (visit http://Pocketome.org website for full infomation). Chains, heteroatoms, and prosthetic groups not involved in the binding site were deleted from the complexes.28 Although some of the co-crystals contained crystallographic water molecules in the binding site, their contribution would have compromised the docking of non-cognate compounds and they were deleted from the complexes.
Table 1.
List of the 31 crystallographic structures included in the ESR1_HUMAN_300_551 Pocketome entry.
| PDB ID | Chain | Resolution (Å) | PDB ID | Chain | Resolution (Å) |
|---|---|---|---|---|---|
| 1GWQ | A | 2.5 | 2QAB | A | 1.9 |
| 1L2I | B | 2.0 | 2QE4 | B | 2.4 |
| 1R5K | B | 2.7 | 2QGW | A | 2.4 |
| 1X7E | B | 2.8 | 2QH6 | B | 2.7 |
| 1X7R | A | 2.0 | 2QR9 | A | 2.0 |
| 1ZKY | A | 2.3 | 2QSE | B | 1.9 |
| 2B1V | B | 1.8 | 2QXM | B | 2.3 |
| 2BJ4 | B | 2.0 | 2QZO | B | 1.7 |
| 2FAI | B | 2.1 | 2R6Y | A | 2.0 |
| 2G44 | B | 2.7 | 3DT3 | A | 2.4 |
| 2G5O | B | 2.3 | 3ERD | A | 2.0 |
| 2I0J | D | 2.9 | 3ERT | A | 1.9 |
| 2IOK | A | 2.4 | 3OS8 | A | 2.0 |
| 2POG | A | 1.8 | 3OS8 | D | 2.0 |
| 2Q70 | A | 2.0 | 3OSA | A | 2.3 |
| 2QA6 | B | 2.6 |
Receptors were prepared according to standard ICM procedures. Protein atom types were assigned, hydrogens and missing heavy-atoms were added, and added or zero occupancy side chains and polar hydrogen atoms were optimized and assigned the lowest energy conformation. Protein atom types and parameters were taken from a modified version of the ECEPP/3 force field.29 For consistency, binding pocket residues were defined as those amino acids being at 5 Å from all 31 active ligands. The binding pocket was described by five 0.5 Å spacing potential grid maps, representing van der Waals potentials for hydrogens and heavy-atoms, electrostatics, hydrophobicity, and hydrogen bonding. A truncated soft van der Waals potential was introduced and the other potentials were rescaled accordingly to avoid atom overlap (e.g., for two oppositely charged atoms).
Ligand selection and preparation
Training set
The actives were selected as those ligands present in the 31 x-ray structures of the ESR1_HUMAN_300_551 Pocketome entry (see list at Table 1 and 2D structures at Supporting Table S1). The ligands belonged to 10 distinct chemical scaffolds representing a myriad of agonists, antagonists, and ligands that can behave as agonists or antagonists depending on the tissue (a.k.a., selective estrogen receptor modulators, SERM). The decoys were taken from Shoichet’s directory of useful decoys (DUD) dataset30, which had two different entries for the ER, labeled as “ER_agonist - Estrogen receptor agonist” and “ER_antagonist - Estrogen receptor antagonist”. For our purposes here, both agonist and antagonist decoys were mixed in a single set consisting of 4018 ligands. Two training sets were used to compare the effect of the ratio of actives:decoys: i) Tr1:13 (31 actives, 418 decoys coming from clustering all 4018 decoys), and ii) Tr1:1 (31 actives, 31 decoys randomly selected from the 418 cluster centers; see 2D structures at Supporting Table S2).
Table 2.
Prospective VS performance of pockets before and after ALiBERO optimization for the PDB IDs 1X7E_B and 3ERT_A. The performance was measured as the normalized square root of the area under the ROC curve (NSQ_AUC). Note that selection strategies appear to the right of the PDB IDs (“SL” stands for “single-leader” and “TP” stands for “team-players”), and M is the number of “children” pockets to be selected on each generation. F stands for “Free exploration”, E stands for “best Ensemble pockets”, and I stands for “best Individual pockets”
| X-ray | ALiBERO | |
|---|---|---|
|
| ||
| Training set (TR1:1) | Test set (TST1:350) | |
| 1X7E_B SL (M=1) | 0.44 | 0.49 |
| 1X7E_B TP (M=3) | 0.44 | 0.57 |
| 1X7E_B TP (M=5) | 0.44 | 0.51 / 0.55 (E:3) / 0.49 (I:2) |
| 1X7E_B TP (M=Free) | 0.44 | 0.45 (F:10) / 0.48 (E:2) / 0.47 (I:2) |
|
| ||
| 3ERT_A SL (M=1) | 0.54 | 0.64 |
| 3ERT_A TP (M=3) | 0.54 | 0.72 |
| 3ERT_A TP (M=Free) | 0.54 | 0.67 (F:3) |
|
| ||
| Training set (TR1:13) | Test set (TST1:343) | |
|
| ||
| 1X7E_B SL (M=1) | 0.40 | 0.50 |
| 1X7E_B TP (M=3) | 0.40 | 0.54 |
| 1X7E_B TP (M=Free) | 0.40 | 0.53 (F:10) / 0.54 (E:2) / 0.58 (I:3) |
Test set
The ligands for prospective VS validation were collected from the ChEMBL database31, entry ESR1_HUMAN. The actives were defined as those ligands having biological activity at a concentration ≤ 1 nM (pKi ≥ 9), and the inactives were selected as those ligands that needed ≥ 10 μM to display activity (pKi ≤ 5). An extra filtering step was performed to narrow the set to only “drug-like” molecules. The filters applied to the test set were the following: 150 < molecular weight (g/mol) < 500; 10 < number of atoms < 100; −4 < log P < 5; number of rotatable bonds < 8; polar surface area < 150; number of hydrogen donors < 10; number of hydrogen acceptors < 10. Because we used two training sets with different ratios of actives and decoys (Tr1:13 and Tr1:1), we also built two different test sets on which all the ligands having a chemical similarity ≥ 0.2 (according to Tanimoto) with respect to the training sets were deleted. The test set corresponding to Tr1:13 was named Tst1:343 and contained 16 actives and 5491 inactives, and the test set corresponding to Tr1:1 was named Tst1:350 and contained 16 actives and 5586 inactives (1:350 ratio).
For every ligand, bond orders, tautomeric forms, stereochemistry, hydrogen atoms, and protonation states were assigned automatically by the ICM chemical conversion procedure and were assigned the MMFF force field atom types and charges.32 Ligand molecules were prepared for docking by rotational search followed by the Cartesian minimization in the absence of the receptor and the lowest-energy conformations were used as starting points for ICM docking.
In Silico receptor ensembles
The goal of this step was to produce a large number of energetically feasible pocket models starting from one or several initial structures. Two complementary sampling methods were used in order to create discrete models of the pocket, i) heavy-atom elastic network normal mode analysis (EN-NMA) to represent the intrinsic equilibrium fluctuations of the backbone and side chains, as described elsewhere33, and, ii) all-atom ICM Monte Carlo refinement, to simulate the induced-by-ligand changes in the side chains. The ALiBERO script allows the user to choose the number of ligand-receptor complexes to be refined, and the refined receptors will undergo a new round of VS. Although we deliberately did not use any distance restraint during the refinement of ERα pockets, restraints can be added to keep known anchoring contacts, or can be used as a condition to “guide” the fitness function.
ICM-VS docking
The ligand set of compounds was docked into each pocket according to standard ICM VS docking. ICM ligand docking uses a biased probability Monte Carlo (BPMC) optimization of the ligand internal variables in the set of grid potential maps of the receptor.34 Flexible ligands are automatically placed into the binding pocket in several random orientations used as starting points for Monte Carlo optimization. The optimized energy function includes the ligand internal strain and a weighted sum of the grid map values in ligand atom centers. The ligand binding poses were evaluated with an all-atom ICM ligand binding score, that had been derived from a multi-receptor screening benchmark as a compromise between approximated Gibbs free energy of binding and numerical errors.35 To improve convergence of docking predictions, three independent runs of the docking procedure were performed.
Fitness function and pocket selection
In small molecule docking context, ALiBERO uses an objective fitness function to increase the ability of the receptor to discriminate true active ligands from decoys. To quantify such discrimination, several “figures of merit” have been proposed in the literature. The most intuitive metric is the area under the receiver operating characteristic curve (ROC), abbreviated as AUC36, that describes the cumulative ability of a docking procedure to recognize true positives and negatives while avoiding false positives and false negatives. A theoretically perfect VS performance has an AUC value of 1.0, whereas a random selection has an AUC of 0.5. Recently, we introduced a Normalized SQuare root AUC (NSQ_AUC) metric, which puts emphasis on “early” hit enrichment in screening results while retaining contribution for overall selectivity and sensitivity of the model.20 The difference is that the effective area (AUC*) is defined for the ROC curve plotted with X coordinate calculated as square root of “False Positive rate”, X = Sqrt (FP). The normalized square root AUC is then calculated as,
The NSQ_AUC measure returns the value of 1.0 for any perfect separation of signal from noise and values close to zero for a random selection.
In order to build the ROC curves, two different strategies were used (see Figure 2). On early non-automatized applications of the LiBERO procedure19, only the best performing individual pocket (“single leader”) was selected for the next generation. Thus, the scores coming from different pockets were not merged at any stage. ALiBERO has expanded the pocket selection from single to multiple, and now the ROC curves can be built according to either individual or ensemble scoring modalities. In ensemble scoring, the ligand scores from individual pockets are merged, numerically sorted, and only the best score is kept to calculate the AUCs. One major drawback of ensemble docking is that pockets often behave anti-cooperatively, and at some point the addition of scores from some cavities increases the number of false positives, thus deteriorating the AUC | NSQ_AUC values.16 In principle, the deterioration effect can be minimized if the selection is narrowed to those pockets providing the best combined VS performance. To date, however, no unified method has been proposed for selecting the “team” of pockets displaying the best combined performance.16, 37–42 Here, we propose a dual strategy, in which combinatory pocket search is performed until M = 2 (M is the number of pockets in the ensemble), and an individual pocket addition M + m′ (m′ is the single pocket which leads to the best combined performance) is performed when M ≥ 3. The search procedure is repeated until the addition of pockets no longer increases the value of the fitness function, or until M reaches the value defined by the user. According to our tests, exhaustive combinatorial pocket search when M ≥ 3 does not lead to significant improvement with respect to the individual addition approach, and does not justify the associated increase in computational time.
Figure 2.

Scheme representing the two strategies for selecting the “children” conformers that will pass to the next generation. Both strategies are implemented in the ALiBERO script.
Apart from discriminatory measures like the AUC or the NSQ_AUC, ALiBERO can utilize alternative descriptors focusing on the properties of the actives, such as the average docking score for a portion of the actives (e.g, the best scored half of actives (ADS1/2)) or the consistency of binding modes (C). C is quantified by building a comparison matrix of the pairwise alignments of the atomic property fields maps (APF) of the active ligands.43 After the sampling step, if the optimized pockets displayed values better than the previous generation then the generation was considered successful, and the “children” conformers became the “parents” in the next generation. The objective of the ALiBERO optimization was to iteratively increase the recognition, as measured by those figures of merit.
Software and Hardware
ALiBERO script was implemented in Perl language (v5.8.8), and runs on a “master” node that submits and monitors “slave” threads involving ICM 3.7 software26 (Molsoft LLC, La Jolla, CA). In its current implementation, ALiBERO uses 1 CPU x VS run, allowing for submitting the jobs locally (i.e., a Linux multi-CPU Desktop) or remotely to Linux-based clusters running the PBS/Torque queue system, allowing parallel linear scaling performance. An ALIBERO run consisting of 10 generations (100 conformers, side chain refinement, VS x 3 repetitions (with 62 ligands)) takes ~ 1 day using ~ 300 CPUs (mostly Intel Xeon X3370 3.00GHz) on our local cluster located at the San Diego Supercomputer Center. Execution on the cluster requires a site ICM license for the cluster and an automated user login to the cluster master node. The receptor and ligand preparations, the docking simulations, and the energy evaluations were carried out with ICM 3.7.
RESULTS AND DISCUSSION
ALiBERO method was designed to optimize the docking performance of any receptor, irrespective of having experimental or in silico origin. As a proof of concept, here we used the human estrogen receptor alpha (ERα), a protein that has been extensively studied in structure-based drug design (SBDD) context. The ER is a transcription factor, whose malfunction is implicated in the pathology of numerous diseases including obesity, diabetes, atherosclerosis and cancer. To date, two different forms of the ER have been identified, ERα encoded by gene ESR1 and ERβ encoded by ESR2. The Uniprot entry ESR1_HUMAN had a match in the Pocketome database (ESR1_HUMAN_300_551; see Methods), and when this study was performed consisted of 31 x-ray receptor-ligand complexes (see Supporting Table S1; more details about the composition of ESR1_HUMAN_300_551 entry can be found at http://pocketome.org). Our objective with ALiBERO was not to improve the recognition for all 31 conformations, but rather to “fix” the recognition of the worst pocket, so that it performed on par with the best ones.
Performance of individual x-ray structures
One of the issues when working with multiple holo crystal structures is how to determine which pockets will perform better in VS docking. With the exception of obvious reasons (i.e., strong steric clashes), often the visual inspection or the “chemical intuition” (or even crystal resolution, see Supporting Figure S3) is not enough for predicting a priori which structure (or structures) will be the best in terms of ligand discrimination. In that regard, even small differences in side chain positions can lead to quite dissimilar ligand poses and therefore very distinct VS performance. One way of assessing a posteriori the recognition of the pockets is to carry out retrospective VS docking experiments with a small ligand set, and assume that the performance will be qualitatively transferable to larger sets. We followed such an approach to establish a baseline for the performance of the individual structures in the ESR1_HUMAN_300_551 ensemble. Thus, for each individual receptor, we performed retrospective flexible-ligand ICM-VS using a small ligand set consisting of 31 actives and 31 decoys (see Methods). With such a ligand set, all 31 PDB IDs had recognition values above random (see Figure 3), in particular an AUC ≥ 0.7 and a NSQ_AUC ≥ 0.5, with minimum values of 0.70, 0.53, and maximum of 0.88, 0.80, and mean values of 0.78, 0.63, for AUC and NSQ_AUC, respectively. The squared root nature of the NSQ_AUC magnified the discrimination power of each receptor, a factor that may be decisive when selecting them for VS.
Figure 3.

Variability in VS performance of the 31 PDB IDs from the ESR1_HUMAN_300_551 Pocketome entry with a small ligand set (31 actives + 31 decoys). The performance was measured by the: (a) area under the ROC curve (AUC), and (b) the normalized square root area under the ROC curve (NSQ_AUC). To facilitate the comparison the PDB IDs in both figures were sorted according to the NSQ_AUC values.
Because the Pocketome files contained the actual 3D coordinates of the receptors and the ligands we could also quantify the cross-docking performance by geometry-based measures, such as the ligand RMSD with respect to the native pose in the crystal, or the coverage of atomic contacts.44 Figure 4 shows the performance of the 31 receptors from the ESR1_HUMAN_300_551 entry according to geometry prediction. To facilitate the comparison with screening performance, in Figure 4 the PDB IDs were sorted according to NSQ_AUC (as in Figure 3), the left bars represent the percentage of active ligands predicted with RMSD ≤ 2 Å with respect to their native pose in the crystal (note that a 100% value meant success in 31 cases), and the right bars represent the percentage of active ligands keeping ≥ 50% of the ligand-receptor atomic contacts, again with respect to their native pose in the crystal (4 Å cutoff used; note that a 100% value meant success in 31 cases). On average, the native ligand poses were correctly predicted for 47% of the ligands according to RMSD, in consonance with our previous reports2, 33, 45, with a maximum of 71% for 3OSA_A (22 / 31) and minimum of 23% for 1X7E_B (7 / 31). The mean value for the coverage of contacts was 31%, with a maximum of 48% for 2I0J_D, and a minimum of 6% for 2QH6_B. Interestingly, when we attempted to correlate performance in screening (as measured by NSQ_AUC) with performance in geometry prediction as measured by RMSD or contacts, we observed a diffuse linear correlation (R2 = 0.22 and R2 = 0.03 respectively). There existed cases with exceptional performance according to NSQ_AUC and mediocre performance in geometry prediction (e.g., 2IOK_A) and vice versa (e.g., 1GWQ_A). This indicated that ERα pockets displaying good screening capabilities may or may not display decent performance in the binding mode prediction arena. Taking the results from both figures together, we selected 1X7E_B as the worst performer within the ERα ensemble, having an AUC = 0.70, a NSQ_AUC = 0.53, 23% success in geometry prediction according to RMSD (7 out of 31 ligands were predicted with the correct binding mode), and 16% success in geometry prediction according to coverage of contacts (5 out of 31 ligands kept more than 50% of the native contacts). The suboptimal performance in both screening and geometry prediction situated 1X7E_B as a worst-case scenario for anyone attempting to capture active ligands from a large pool of actives and inactives. In the following sections, our objective was to use ALiBERO to maximize the discrimination of actives from decoys of 1X7E_B, while keeping geometry predictions within acceptable values. Because RMSD and coverage of contacts showed some correlation (R2 ~ 0.5), from now on we will only refer to RMSD values when discussing ligand geometry predictions in the text.
Figure 4.
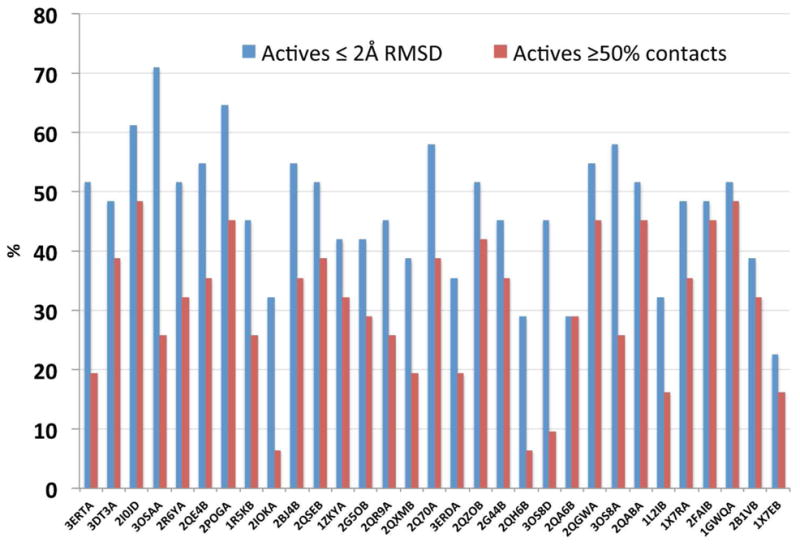
Variability in geometry prediction performance of the 31 PDB IDs from the ESR1_HUMAN_300_551 Pocketome entry, as measured by: i) percentage of active ligands with a RMSD ≤ 2 Å with respect to their native pose in the x-ray), and ii) percentage of active ligands with a coverage ≥ 0.5. The coverage was defined as the number of equivalent ligand-receptor atomic contacts between the reference and the target, divided by the contacts in the reference (4 Å cutoff used).44 Note that the PDB IDs are sorted according to NSQ_AUC (as in Figure 3). A value of 100% indicated success in all 31 cases.
ALiBERO optimization
Multiple ALiBERO runs were carried out on the 1X7E_B crystal to check how the variation of input parameters affected the overall performance. Some of those parameters were; the fitness function, the number of EN-NMA conformers and the average amplitude of the displacements, the use of Monte Carlo refinement (and the number of ligand-receptor complexes refined), the number of “children” structures selected on every generation, and the size of the training set. On every run, we routinely monitored when the AUC | NSQ_AUC values max out (see example in Figure 5a) with the training set, and compared the results with those from the best performing crystal structures.
Figure 5.
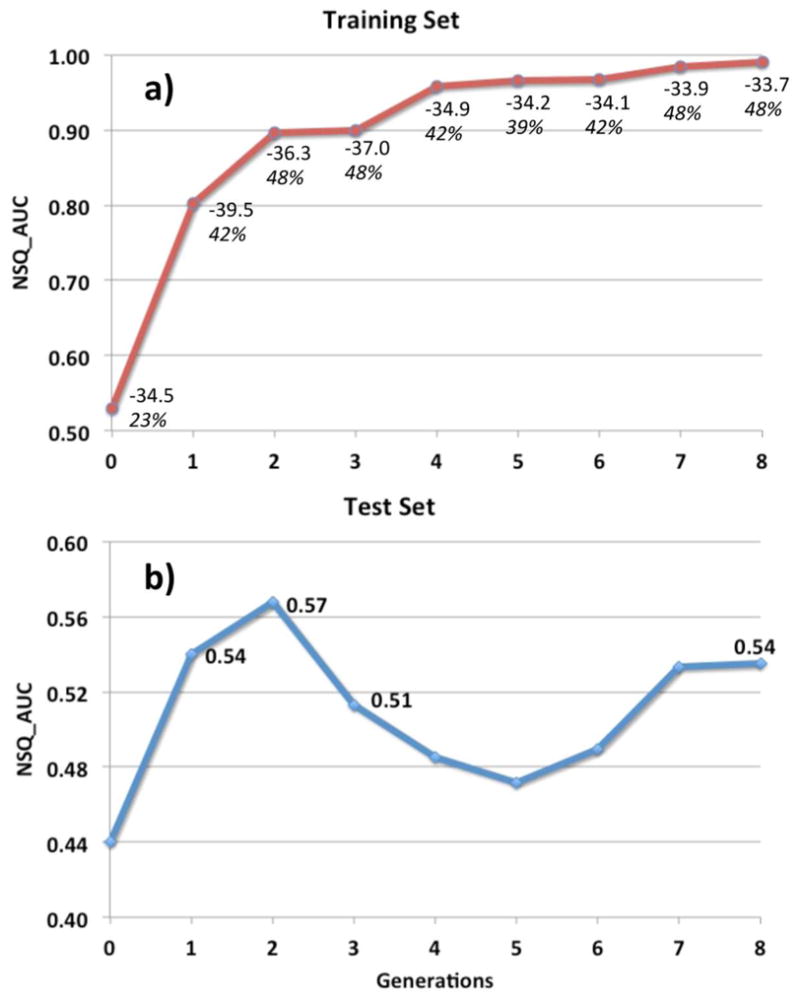
a) Iterative increase in VS performance during an ALiBERO run starting from the 1X7E_B crystal when using NSQ_AUC as fitness function. The training set used (Tr1:1) consisted of 31 actives and 31 decoys (see Methods). On every generation, the plot also displays numbers for the average docking score for the best half of the actives (ADS1/2) on top and the success in geometry prediction as the percentage of active ligands with a RMSD ≤ 2 Å with respect to their native pose in the x-ray on the bottom (italics). b) Prospective performance of the pockets optimized with ALiBERO with a very challenging test set (Tst1:350) consisting of 16 biological actives and 5586 inactives, all distinct to the ligands in training set (see Methods). Note the difficulty in predicting which ALiBERO generation will perform better in prospectively VS. According to a compromise between NSQ_AUC and ADS1/2, generation #3 was considered a candidate for prospective VS. In realistic drug discovery applications we recommend using several candidate generations to check for convergence in results.
Independent of the fitness function used, we observed that the use of the iterative optimization consistently increased the recognition properties of the initial structure (see example in Figure 5a), being NSQ_AUC the descriptor providing better overall results. In this sense, a key issue was to assess whether the optimization was leading to predictive models and not to artifacts. After studying the results, we noticed that there was some correspondence between descriptors measuring properties of the actives and overall performance. For instance, we observed that once the NSQ_AUC values stabilized, the average docking score for the best scored half of actives (ADS1/2) correlated well with binding mode prediction (see Figure 5a). Most importantly, generations having better ADS1/2 had a tendency of performing better when used with unrelated compounds (see Figure 5b). Another predictor for convergence was to check the consistency of the binding mode for the actives (see Methods). As a reference, the value of C for the bioactive conformation of 31 PDB IDs in ESR1_HUMAN_300_551 entry was 0.5, meaning that half of the ligands shared the binding mode. We should note that, although ADS1/2 and C worked well as an accessory predictor, they did not necessarily always lead to better AUC | NSQ_AUC values when used as fitness function.
With regard to the number of conformers per generation, we observed that ~ 100 EN-NMA derived conformers provided enough variability to represent the equilibrium dynamics of the receptor. A smaller number forced the algorithm to require more generations to reach similar screening performance, whereas creating > 100 conformers only lead to small improvements (tested up to 300 conformers), probably due to a better convergence in the EN-NMA sampling. The structures within the ESR1_HUMAN_300_551 entry displayed moderate backbone mobility, and thus better results were obtained when the ensembles were created at ~ 1 Å RMSD with respect to the “parent” conformations. Use of all-atom Monte Carlo side chain refinement step consistently improved the results, in particular, when we refined the 5 top-scored complexes for the selected pockets (coming from EN-NMA).
An interesting test was to compare the two strategies for selecting the pockets on each generation (see Figure 2 and Methods). A selection step based on the “single leader” approach improved dramatically the recognition with respect to the 1X7E_B crystal (x-ray performance AUC = 0.70, NSQ_AUC = 0.53), reaching AUC = 0.9 and NSQ_AUC = 0.83 values (3ERT_A and 3DT3_A crystals displayed an AUC = 0.88 and a NSQ_AUC = 0.80). However, for achieving such a performance the algorithm often needed many generations, allowing for unrealistic deviations from the original structure. When we left the selection open to multiple conformers, we observed a very significant improvement in performance, reaching values > 0.95 for both AUC and NSQ_AUC (see Figure 5a). This enhanced recognition provided by multiple pockets is de per se highly beneficial in cases where specific recognition towards given scaffolds is needed, like in lead optimization stages. Details about the transferability of the enhanced performance in prospective VS, along with how the size of the training set affected the results will be given in the validation section.
Validation of ALiBERO models with an unrelated test set
The ultimate goal of ALiBERO is to improve the recognition of the receptors, so that their properties remain applicable outside the set used during the optimization. To test the transferability of ALiBERO-derived pockets we compiled an extremely challenging set extracted from ChEMBL database31, consisting of true active and inactive ligands (see Methods for more details). We want to emphasize that the pockets used in prospective VS were selected as those generations from individual runs having better NSQ_AUC and ADS1/2 values with the training set (see discussion above), thus, no information about the test set composition was used at any stage of the optimization.
Table 2 displays a summary of the results obtained with the structures before and after ALiBERO optimization with different conditions. In consonance with our previous reports23–25, NSQ_AUC values demonstrated that pockets optimized by a ligand-guided approach consistently improved the recognition of new ligands with respect to the original x-ray. In particular, whereas 1X7E_B crystal displayed a NSQ_AUC = 0.44 (note that the larger ratio of actives vs. inactives consistently lowered the AUC and NSQ_AUC values with respect to the ones in the training set), the optimized models displayed NSQ_AUC values ranging from 0.45 to 0.57. While the 1X7E_B pocket optimized via “single-leader” did not show remarkable improvement with respect to the crystal (NSQ_AUC = 0.49), some ensembles selected via “team-players” strategy did. As expected, the performance of the ensembles had dependency on the number of pockets. We knew from past experience that even when working with ensembles of only experimental structures, the addition of more than 3–5 pockets may trigger anti-cooperative behavior in VS.45–47 Multiple runs were performed in which M (i.e., the number of “children” pockets to be selected on each generation) was fixed to 3, 5 or to free (unlimited). As shown in Table 2, minor improvements were obtained with pockets created by allowing free exploration (labeled as F in the Table). This effect was somewhat expected, since the contributions of each individual conformer to the enrichments with the training set were quite variable. In these cases, however, it was still possible to improve the VS performance by excluding the spurious pockets, that is, keeping only those pockets contributing significantly to the ensemble scoring with the training test (labeled as E in the Table), or alternatively, by keeping those pockets performing significantly better individually with training set (labeled as I in the Table; note that best individual pockets were often among those performing better in ensembles). For instance, by selecting the 2 pockets performing better individually or in the ensemble we could increase the NSQ_AUC to 0.47 and 0.48, respectively. When we fixed M to 5 pockets, we observed an increase of the NSQ_AUC to 0.51, and again we the performance could be increased by just keeping the best 2–3 performing pockets with the training set. Curiously, optimum results were obtained when M = 3 (NSQ_AUC = 0.57, note the square root nature of the descriptor), performing on par with the best crystal structure 3ERT_A (NSQ_AUC = 0.54). Another interesting test was to compare the performance of pockets optimized with training sets having a larger ratio of actives:decoys (Tr1:13). According to our data, pockets created by using more decoys on the training set showed slightly different screening performance on the test set, with NSQ_AUC values ranging from 0.53 to 0.58 (x-ray displayed a NSQ_AUC = 0.40).
To illustrate the full potential of ALiBERO, we also performed optimizations of the PDB ID 3ERT_A, the best x-ray structure from ESR1_HUMAN ensemble according to NSQ_AUC with the training set. As shown in Table 2, prospective performance of 3ERT_A obtained via the “single-leader” was improved (NSQ_AUC = 0.64) with respect to that of the x-ray (NSQ_AUC = 0.54). As happened with 1X7E_B, much better results were obtained with the “team-player” strategy, achieving values of NSQ_AUC = 0.67 with the “free” selection strategy, and a remarkable value of NSQ_AUC = 0.72 when M = 3. The consistency of results obtained with different crystals and ligand sets, along with the improved docking scores, evidenced that the responsible of the favorable results was a better docking and scoring of the complexes in the pockets, rather than a simple memory of the compounds used for training.
Finally, we compared the structural features of some of the cavities leading to opposite docking performance with the training set. PDB IDs 2I0J_D and 2POG_A could be considered examples of crystals performing well in screening (NSQ_AUC = 0.78 and 0.71, respectively) and in geometry prediction (61% and 65% success in ligand RMSD, respectively), whereas PDB ID 1X7E_B could be considered as a example of a bad performing crystal (NSQ_AUC = 0.53, 23% success in ligand RMSD). Despite the different x-ray resolution of 2I0J_D and 2POG_A (2.9 Å and 1.8 Å, respectively), their cognate ligands displayed a very similar binding mode, only differing to that of 1X7E_B (resolution: 2.8 Å) due to the presence of an acetonitrile group in the vicinity of amino acids F404, M421, F425, L428 (see Figure 6 and Supporting Table S1). The main differences in the receptor side were slight variations on a few side chains (L384, M388, M343, M421, and L525; see Figure 6a, note that we only showed image for 2IOJ_D and 1X7E_B), not all them involved in the conserved network of ligand-receptor interactions (D351, E353, W383, L387, R394, F404, F425, G521 and H524). After ALiBERO optimization, the best performing models only displayed subtle changes in backbone and side chain positions (see Figure 6b), yet these changes were capable of improving significantly the recognition of actives in the training set and in the test set.
Figure 6.

a) Structural views of pockets of the crystals 2I0J_D (green) and 1X7E_B (magenta) with their cognate ligands. b) Best performing ensemble of 1X7E_B from ALiBERO optimization in light pink (crystals are shown as a reference). The changes in side chains positions of ALiBERO pockets were subtle, yet capable of increasing the recognition of actives in both the training set and the test set.
Further validation with a homology model
As requested by the referees, we performed an additional test to verify the applicability of the ligand-guided approach on undetermined x-ray structures. For this exercise, we utilized ALiBERO to recreate “blindly” the interactions of the published Adenosine receptor A2A (A2AAR) with its ligand ZM24138 (PDB ID: 3EML), starting from a distant template (beta-2 adrenergic receptor; PDB ID: 2RH1; sequence identity with removed T4L fusion domain ~ 30%). The adenosine A2A receptor is a member of the GPCR family, seven-transmembrane domain receptors that activate cellular transduction pathways. The A2AAR is considered an important therapeutic target due to its participation in inflammation processes, and in the regulation of myocardial oxygen consumption and coronary blood flow. In this case, we built a “raw” homology model according to standard ICM homology modeling procedures48 (details about the sequence alignment and construction of the model can be found elsewhere19). The training set consisted of 23 AA2AR subtype specific antagonists49 including the cognate ligand and representing diverse compounds built on both adenine-like and pyrazolo-triazolo-pyrimidine (PTP) scaffolds, plus two sets of decoys obtained from the ChemDiv drug-like compound database (www.chemdiv.com). The first training set was built so that the ratio of actives:decoys (Tr1:1), and the second was built by adding 338 decoys (Tr1:15). Pocket residues were defined as those being at 3.5 Å from the mesh obtained with ICM PocketFinder algorithm50. A harmonic distance restraint (between Asn2536.55 and any exocyclic N15 atom in the actives) was used in the complex refinement stages (not during the docking), since it is know experimentally that mutation to alanine disrupts an important polar contact with of ZM24138. Because the homology model was quite distant to the target, the average displacements during the EN-NMA stage were set to 2 Å, and the number of “team-players” M was fixed at 3.
Before ALiBERO optimization, the raw homology model displayed very poor screening performance with the training set (AUC = 0.63 and a NSQ_AUC = 0.29), and the docking poses of the cognate ligand ZM24138 were distinct to that in the crystal. In particular, the best-scored pose displayed a ligand RMSD of 7.5 Å with respect to the x-ray (7.4 Å without the very flexible phenoxy-ring), and only 16 out of 75 native contacts (21%) were conserved (see Table 3). After the optimization, the best scored complexes represented a much more realistic view of the actual complex, getting a coverage of contacts ~50%, a number that was on par with the best two models submitted to the worldwide GPCRock2008 assessment51 (models #1 by Costanzi and #2 by Katritch et al.) where 29 groups of GPCR modeling experts submitted their blind predictions before the publication of the x-ray structure. With the A2A receptor, a larger ratio of decoys provided more robust results than with the ERα, obtaining a ligand pose keeping 51% of the contacts and a RMSD of 4.6 Å with respect to the x-ray (2.8 Å without the very flexible phenoxy-ring) (see Table 3).
Table 3.
Summary of the results before and after ALiBERO optimization of a homology model of the A2A adenosine receptor in complex with the ligand ZM24138. The RMSD of the ligand (with and without the very flexible phenoxy-ring) was performed after receptor superimposition to the PDB ID 3EML. The coverage of contacts was defined as the number of equivalent ligand-receptor atomic contacts between the reference and the target, divided by the contacts in the reference (4 Å cutoff used).44
| Raw Homology Model | |||||
|---|---|---|---|---|---|
| Training Set | AUC | NSQ_AUC | Ligand RMSD (Å) | Contacts Coverage | ICM Docking Score |
| Tr1:1 | 0.63 | 0.29 | 7.5 / 7.4 | 21% | −17.9 (kcal/mol) |
| Tr1:15 | 0.66 | 0.26 | ~ | ~ | ~ |
| ALiBERO | |||||
| Training Set | AUC | NSQ_AUC | Ligand RMSD (Å) | Contacts Coverage | ICM Docking Score |
| Tr1:1 | 0.96 | 0.92 | 6.2 / 4.3 | 47% | −28.7 (kcal/mol) |
| Tr1:15 | 0.92 | 0.78 | 4.6 / 2.8 | 51% | −28.8 (kcal/mol) |
Final Remarks
Although the method has been presented here in the context of small molecule docking, we envision that the “team-players” algorithm can be easily adapted to work in other contexts dealing with sampling, such as ligand-based docking approaches, protein-protein docking, or protein structure prediction, as long as the fitness function is well chosen. We want to emphasize, however, that the quality of the optimization will depend on the quality of the initial structures, the ligand set, as well as the parameters used for modeling the system. Thus, although ALiBERO will optimize any model, a bad combination of protein/ligand/parameters may run a risk of over-fitting, producing models that will not be predictive outside the context of the training set. The ALiBERO script is available from the authors upon request as a free add-on to ICM (Molsoft LLC) molecular modeling package for the Linux platform.
CONCLUSIONS
In this study we presented the design and implementation of ALiBERO, an extension of our ligand-guided method, that introduces a fully automated iterative process where on each step receptor conformers are generated by EN-NMA and/or Monte Carlo sampling followed by a posteriori selection of the best combination of conformers according to a cumulative fitness function. The combination of conformers is obtained by a new method, which first performs an exhaustive combinatorial search, followed by individual addition of the pockets. The convergence of the optimization is checked by population-based ligand measures such as the average docking score for the actives, or the consistency of the binding mode. The method has been proven to be effective in prospective screening and ligand geometry predictions not only with x-ray structures but also with homology models, providing that there exists information on actives in the literature. The algorithm, based on the ICM docking/VS screening platform, is implemented as a free add-on to the ICM program, allowing highly parallel distributed execution on a Linux computer cluster managed by the PBS queuing system.
Supplementary Material
Acknowledgments
The authors thank Vsevolod Katritch for his help with the preparation of ICM scripts and for the A2AAR data, Winston Chen and Marco Neves for providing us with the ligand sets for the ERα, Irina Kufareva for valuable suggestions, Kurt Kristiansen for his feedback on the software, and Karie Wright for help with manuscript preparation. We would like to thank the referees for their comments and suggestions to improve the quality of this paper. MR is supported by a Marie Curie OIF fellowship. This work was supported by NIH grant 1-R01-GM074832.
Footnotes
SUPPORTING INFORMATION AVAILABLE
Supporting Tables S1 and S2 including all compounds used in the training with ERα(Tr1:1) and Supporting Figure S3. This information is available free of charge via the Internet at http://pubs.acs.org.
References
- 1.Neves MAC, Totrov M, Abagyan R. Docking and scoring with ICM: the benchmarking results and strategies for improvement. J Comput-Aided Mol Des. 2012 doi: 10.1007/s10822-012-9547-0. [DOI] [PMC free article] [PubMed] [Google Scholar]
- 2.Bottegoni G, Kufareva I, Totrov M, Abagyan R. A new method for ligand docking to flexible receptors by dual alanine scanning and refinement (SCARE) J Comput-Aided Mol Des. 2008;22(5):311–25. doi: 10.1007/s10822-008-9188-5. [DOI] [PMC free article] [PubMed] [Google Scholar]
- 3.Carlson HA, McCammon JA. Accommodating protein flexibility in computational drug design. Mol Pharmacol. 2000;57(2):213–8. [PubMed] [Google Scholar]
- 4.Teodoro ML, Kavraki LE. Conformational flexibility models for the receptor in structure based drug design. Curr Pharm Des. 2003;9(20):1635–48. doi: 10.2174/1381612033454595. [DOI] [PubMed] [Google Scholar]
- 5.Teague SJ. Implications of protein flexibility for drug discovery. Nat Rev Drug Discovery. 2003;2(7):527–541. doi: 10.1038/nrd1129. [DOI] [PubMed] [Google Scholar]
- 6.Rao BC, Subramanian J, Sharma SD. Managing protein flexibility in docking and its applications. Drug Discovery Today. 2009;14(7–8):394–400. doi: 10.1016/j.drudis.2009.01.003. [DOI] [PubMed] [Google Scholar]
- 7.McCammon JA. Target flexibility in molecular recognition. Biochim Biophys Acta. 2005;1754(1–2):221–4. doi: 10.1016/j.bbapap.2005.07.041. [DOI] [PubMed] [Google Scholar]
- 8.Sousa SF, Fernandes PA, Ramos MJ. Protein-ligand docking: Current status and future challenges. Proteins: Struct, Func Bioinf. 2006;65(1):15–26. doi: 10.1002/prot.21082. [DOI] [PubMed] [Google Scholar]
- 9.Karplus M, Kuriyan J. Molecular dynamics and protein function. Proc Natl Acad Sci U S A. 2005;102(19):6679–6685. doi: 10.1073/pnas.0408930102. [DOI] [PMC free article] [PubMed] [Google Scholar]
- 10.Dror RO, Pan AC, Arlow DH, Borhani DW, Maragakis P, Shan Y, Xu H, Shaw DE. Pathway and mechanism of drug binding to G-protein-coupled receptors. Proc Natl Acad Sci U S A. 2011 doi: 10.1073/pnas.1104614108. [DOI] [PMC free article] [PubMed] [Google Scholar]
- 11.Shan Y, Kim ET, Eastwood MP, Dror RO, Seeliger MA, Shaw DE. How does a drug molecule find its target binding site? J Am Chem Soc. 2011;133(24):9181–3. doi: 10.1021/ja202726y. [DOI] [PMC free article] [PubMed] [Google Scholar]
- 12.Totrov M, Abagyan R. Flexible ligand docking to multiple receptor conformations: a practical alternative. Curr Opin Struct Biol. 2008;18(2):178–84. doi: 10.1016/j.sbi.2008.01.004. [DOI] [PMC free article] [PubMed] [Google Scholar]
- 13.Nichols SE, Baron R, Ivetac A, McCammon JA. Predictive power of molecular dynamics receptor structures in virtual screening. J Chem Inf Model. 2011;51(6):1439–46. doi: 10.1021/ci200117n. [DOI] [PMC free article] [PubMed] [Google Scholar]
- 14.Cavasotto CN, Kovacs JA, Abagyan RA. Representing receptor flexibility in ligand docking through relevant normal modes. J Am Chem Soc. 2005;127(26):9632–40. doi: 10.1021/ja042260c. [DOI] [PubMed] [Google Scholar]
- 15.Amaro RE, Baron R, McCammon JA. An improved relaxed complex scheme for receptor flexibility in computer-aided drug design. J Comput-Aided Mol Des. 2008:22693–705. doi: 10.1007/s10822-007-9159-2. [DOI] [PMC free article] [PubMed] [Google Scholar]
- 16.Barril X, Morley S. Unveiling the full potential of flexible receptor docking using multiple crystallographic structures. J Med Chem. 2005:484432–4443. doi: 10.1021/jm048972v. [DOI] [PubMed] [Google Scholar]
- 17.Rockey WM, Elcock AH. Structure selection for protein kinase docking and virtual screening: homology models or crystal structures? Curr Protein Pept Sci. 2006;7(5):437–57. doi: 10.2174/138920306778559368. [DOI] [PubMed] [Google Scholar]
- 18.Damm KL, Carlson HA. Exploring experimental sources of multiple protein conformations in structure-based drug design. J Am Chem Soc. 2007;129(26):8225–35. doi: 10.1021/ja0709728. [DOI] [PubMed] [Google Scholar]
- 19.Katritch V, Rueda M, Lam PCH, Yeager M, Abagyan R. GPCR 3D homology models for ligand screening: Lessons learned from blind predictions of adenosine A2a receptor complex. Proteins: Struct, Func Bioinf. 2010;78(1):197–211. doi: 10.1002/prot.22507. [DOI] [PMC free article] [PubMed] [Google Scholar]
- 20.Katritch V, Kufareva I, Abagyan R. Structure based prediction of subtype-selectivity for adenosine receptor antagonists. Neuropharm. 2011;60(1):108–15. doi: 10.1016/j.neuropharm.2010.07.009. [DOI] [PMC free article] [PubMed] [Google Scholar]
- 21.Katritch V, Reynolds KA, Cherezov V, Hanson MA, Roth CB, Yeager M, Abagyan R. Analysis of full and partial agonists binding to beta2-adrenergic receptor suggests a role of transmembrane helix V in agonist-specific conformational changes. J Mol Recognit. 2009;22(4):307–18. doi: 10.1002/jmr.949. [DOI] [PMC free article] [PubMed] [Google Scholar]
- 22.Neves MA, Simoes S, Sa e Melo ML. Ligand-guided optimization of CXCR4 homology models for virtual screening using a multiple chemotype approach. J Comput-Aided Mol Des. 2010;24(12):1023–33. doi: 10.1007/s10822-010-9393-x. [DOI] [PubMed] [Google Scholar]
- 23.Bisson WH, Cheltsov AV, Bruey-Sedano N, Lin B, Chen J, Goldberger N, May LT, Christopoulos A, Dalton JT, Sexton PM, Zhang XK, Abagyan R. Discovery of antiandrogen activity of nonsteroidal scaffolds of marketed drugs. Proc Natl Acad Sci U S A. 2007;104(29):11927–11932. doi: 10.1073/pnas.0609752104. [DOI] [PMC free article] [PubMed] [Google Scholar]
- 24.Cavasotto CN, Orry AJ, Murgolo NJ, Czarniecki MF, Kocsi SA, Hawes BE, O’Neill KA, Hine H, Burton MS, Voigt JH, Abagyan RA, Bayne ML, Monsma FJ., Jr Discovery of novel chemotypes to a G-protein-coupled receptor through ligand-steered homology modeling and structure-based virtual screening. J Med Chem. 2008;51(3):581–8. doi: 10.1021/jm070759m. [DOI] [PubMed] [Google Scholar]
- 25.Katritch V, Jaakola VP, Lane JR, Lin J, Ijzerman AP, Yeager M, Kufareva I, Stevens RC, Abagyan R. Structure-based discovery of novel chemotypes for adenosine A(2A) receptor antagonists. J Med Chem. 2010;53(4):1799–809. doi: 10.1021/jm901647p. [DOI] [PMC free article] [PubMed] [Google Scholar]
- 26.Abagyan R, Totrov M. Biased probability Monte Carlo conformational searches and electrostatic calculations for peptides and proteins. J Mol Biol. 1994;235(3):983–1002. doi: 10.1006/jmbi.1994.1052. [DOI] [PubMed] [Google Scholar]
- 27.Katritch V, Rueda M, Abagyan R. Ligand-Guided Receptor Optimization. In: Orry AJW, Abagyan R, editors. Homology Modelling: Methods and Protocols. Vol. 857. Springer; 2012. [DOI] [PubMed] [Google Scholar]
- 28.Kufareva I, Ilatovskiy AV, Abagyan R. Pocketome: an encyclopedia of small-molecule binding sites in 4D. Nuc Acids Res. 2012;40(Database issue):D535–40. doi: 10.1093/nar/gkr825. [DOI] [PMC free article] [PubMed] [Google Scholar]
- 29.Nemethy G, Gibson KD, Palmer KA, Yoon CN, Paterlini G, Zagari A, Rumsey S, Scheraga HA. Energy parameters in polypeptides. 10. Improved geometrical parameters and nonbonded interactions for use in the ECEPP(SLASH)3 algorithm, with application to proline-containing peptides. J Chem Phys. 1992;96:6472. [Google Scholar]
- 30.Huang N, Shoichet BK, Irwin JJ. Benchmarking sets for molecular docking. J Med Chem. 2006;49(23):6789–801. doi: 10.1021/jm0608356. [DOI] [PMC free article] [PubMed] [Google Scholar]
- 31.Gaulton A, Bellis LJ, Bento AP, Chambers J, Davies M, Hersey A, Light Y, McGlinchey S, Michalovich D, Al-Lazikani B, Overington JP. ChEMBL: a large-scale bioactivity database for drug discovery. Nucleic Acids Res. 2012;40(Database issue):D1100–7. doi: 10.1093/nar/gkr777. [DOI] [PMC free article] [PubMed] [Google Scholar]
- 32.Halgren TA. Merck molecular force field. I. Basis, form, scope, parameterization, and performance of MMFF94. J Comp Chem. 1996;17:490–519. [Google Scholar]
- 33.Rueda M, Bottegoni G, Abagyan R. Consistent Improvement of Cross-Docking Results Using Binding Site Ensembles Generated with Elastic Network Normal Modes. J Chem Inf Model. 2009 doi: 10.1021/ci8003732. [DOI] [PMC free article] [PubMed] [Google Scholar]
- 34.Totrov M, Abagyan R. Flexible protein-ligand docking by global energy optimization in internal coordinates. Proteins. 1997;(Suppl 1):215–20. doi: 10.1002/(sici)1097-0134(1997)1+<215::aid-prot29>3.3.co;2-i. [DOI] [PubMed] [Google Scholar]
- 35.Schapira M, Totrov M, Abagyan R. Prediction of the binding energy for small molecules, peptides and proteins. J Mol Recognit. 1999;12(3):177–90. doi: 10.1002/(SICI)1099-1352(199905/06)12:3<177::AID-JMR451>3.0.CO;2-Z. [DOI] [PubMed] [Google Scholar]
- 36.Teramoto R, Fukunishi H. Supervised consensus scoring for docking and virtual screening. J Chem Inf Model. 2007;47(2):526–34. doi: 10.1021/ci6004993. [DOI] [PubMed] [Google Scholar]
- 37.Huang SY, Zou X. Ensemble docking of multiple protein structures: considering protein structural variations in molecular docking. Proteins. 2007;66(2):399–421. doi: 10.1002/prot.21214. [DOI] [PubMed] [Google Scholar]
- 38.Cavasotto CN, Abagyan RA. Protein flexibility in ligand docking and virtual screening to protein kinases. J Mol Biol. 2004;337(1):209–25. doi: 10.1016/j.jmb.2004.01.003. [DOI] [PubMed] [Google Scholar]
- 39.Li Y, Kim DJ, Ma W, Lubet RA, Bode AM, Dong Z. Discovery of novel checkpoint kinase 1 inhibitors by virtual screening based on multiple crystal structures. J Chem Inf Model. 2011;51(11):2904–14. doi: 10.1021/ci200257b. [DOI] [PMC free article] [PubMed] [Google Scholar]
- 40.Craig IR, Essex JW, Spiegel K. Ensemble docking into multiple crystallographically derived protein structures: an evaluation based on the statistical analysis of enrichments. J Chem Inf Model. 2010;50(4):511–24. doi: 10.1021/ci900407c. [DOI] [PubMed] [Google Scholar]
- 41.Hritz J, de Ruiter A, Oostenbrink C. Impact of plasticity and flexibility on docking results for cytochrome P450 2D6: a combined approach of molecular dynamics and ligand docking. J Med Chem. 2008;51(23):7469–77. doi: 10.1021/jm801005m. [DOI] [PubMed] [Google Scholar]
- 42.Korb O, Olsson TS, Bowden SJ, Hall RJ, Verdonk ML, Liebeschuetz JW, Cole JC. Potential and Limitations of Ensemble Docking. J Chem Inf Model. 2012 doi: 10.1021/ci2005934. [DOI] [PubMed] [Google Scholar]
- 43.Totrov M. Ligand binding site superposition and comparison based on Atomic Property Fields: identification of distant homologues, convergent evolution and PDB-wide clustering of binding sites. BMC Bioinf. 2011;12 (Suppl 1):S35. doi: 10.1186/1471-2105-12-S1-S35. [DOI] [PMC free article] [PubMed] [Google Scholar]
- 44.Rueda M, Katritch V, Raush E, Abagyan R. SimiCon: a web tool for protein-ligand model comparison through calculation of equivalent atomic contacts. Bioinformatics. 2010;26(21):2784–5. doi: 10.1093/bioinformatics/btq504. [DOI] [PMC free article] [PubMed] [Google Scholar]
- 45.Bottegoni G, Kufareva I, Totrov M, Abagyan R. Four-dimensional docking: a fast and accurate account of discrete receptor flexibility in ligand docking. J Med Chem. 2009;52(2):397–406. doi: 10.1021/jm8009958. [DOI] [PMC free article] [PubMed] [Google Scholar]
- 46.Rueda M, Bottegoni G, Abagyan R. Recipes for the Selection of Experimental Protein Conformations for Virtual Screening. J Chem Inf Model. 2010;50(1):186–193. doi: 10.1021/ci9003943. [DOI] [PMC free article] [PubMed] [Google Scholar]
- 47.Verdonk ML, Mortenson PN, Hall RJ, Hartshorn MJ, Murray CW. Protein-ligand docking against non-native protein conformers. J Chem Inf Model. 2008;48(11):2214–25. doi: 10.1021/ci8002254. [DOI] [PubMed] [Google Scholar]
- 48.Cardozo T, Totrov M, Abagyan R. Homology modeling by the ICM method. Proteins. 1995;23(3):403–14. doi: 10.1002/prot.340230314. [DOI] [PubMed] [Google Scholar]
- 49.Bolcato C, Cusan C, Pastorin G, Spalluto G, Cacciari B, Klotz KN, Morizzo E, Moro S. Pyrazolo-triazolo-pyrimidines as adenosine receptor antagonists: Effect of the N-5 bond type on the affinity and selectivity at the four adenosine receptor subtypes. Purin Sign. 2008;4(1):39–46. doi: 10.1007/s11302-007-9058-y. [DOI] [PMC free article] [PubMed] [Google Scholar]
- 50.An J, Totrov M, Abagyan R. Pocketome via comprehensive identification and classification of ligand binding envelopes. Mol Cell Proteomics. 2005;4(6):752–61. doi: 10.1074/mcp.M400159-MCP200. [DOI] [PubMed] [Google Scholar]
- 51.Michino M, Abola E, Brooks CL, 3rd, Dixon JS, Moult J, Stevens RC. Community-wide assessment of GPCR structure modelling and ligand docking: GPCR Dock 2008. Nat Rev Drug Discovery. 2009;8(6):455–63. doi: 10.1038/nrd2877. [DOI] [PMC free article] [PubMed] [Google Scholar]
Associated Data
This section collects any data citations, data availability statements, or supplementary materials included in this article.