

Abstract
A rapid and inexpensive method for estimating lipid content of yeasts is needed for screening large numbers of yeasts samples. Nile red is a fluorescent lipophilic dye used for detection and quantification of intracellular lipid droplets in various biological system including algae, yeasts and filamentous fungi. However, a published assay for yeast is affected by variable diffusion across the cell membrane, and variation in the time required to reach maximal fluorescence emission. In this study, parameters that may influence the emission were varied to determine optimal assay conditions. An improved assay with a high-throughput capability was developed that includes the addition of dimethyl sulfoxide (DMSO) solvent to improve cell permeability, elimination of the washing step, the reduction of Nile red concentration, kinetic readings rather than single time-point reading, and utilization of a black 96-well microplate. The improved method was validated by comparison to gravimetric determination of lipid content of a broad variety of ascomycete and basidiomycete yeast species.
Keywords: Biodiesel, neutral lipids, Nile red, oleaginous yeast, kinetic reading, black microplate
1. Introduction
Research on biomass-derived fuels (biofuels) has been intensified to search for alternative renewable sources of energy due to the diminishing nonrenewable fossil-fuel stocks. Renewable diesel fuel (biodiesel) is an alternative liquid fuel that can substantially replace conventional diesel and reduce exhaust pollution and engine maintenance costs (U.S. EPA, 2006). Oleaginous microorganisms, microbes that can accumulate more than 25% lipids by dry weight, are receiving increasing attention for their potential use in commercial production of oil for food, chemical and energy applications (Ratledge, 1991, Ageitos et al., 2011). Microalgae that accumulate neutral lipids up to 50% by dry weight are promising sources for biodiesel (Hu et al., 2008, Huang et al., 2009; Chen et al., 2009) and are nearing commercialization. Phototrophic microalgae; however, require more stringent growth conditions, such as direct sunlight for photosynthesis and a longer incubation period than yeasts, which may require less than an hour to duplicate (Ageitos et al., 2011). Yeasts have been of high industrial interest as sources of renewable oleochemicals, including fuels and platform chemicals for lubricants, adhesives, solvents, and polymers. It has been known for decades that a number of yeast species can accumulate up to 70% lipids, including for example Lipomyces starkeyi, Rhodosporidium toruloides, Rhodotorula glutinis, and Yarrowia lipolytica (Botham and Ratledge, 1979; Ageitos et al., 2011). However, most yeast species have not been analyzed to determine oil content. Strain improvement and process development are needed for commercial market applications.
Current methods to quantify/measure neutral lipids for screening large number of sample are complex, laborious, and time-consuming, usually involving extraction, purification, concentration and determination of lipids (Shahidi, 2001; Bligh and Dyer, 1959). Methods involving the use of lipophilic fluorescent dyes include, i.e. Sudan black (Evans et al., 1985), Nile red (Cole, 1990; Kimura et al., 2004, Chen et al., 2009), Nile blue (Greenspan et al., 1985) and BODIPY (Listenberger and Borwn, 2007) have all been reported to be effective and rapid for estimating the lipid content of yeast, fungi, microalgae, ciliates and/or macrophage. BODIPY 505/515 (4,4-difluoro-1,3,5,7,-tetramethyl-4-bora-3a,4a-diaza-s-indacene), a bright green fluorescent dye, is used for detection of lipids in microalgae, and is able to detect a wide range of lipids, such as fatty acids, phospholipids, cholesterol, cholesteryl esters, and ceramides (Elle et al., 2010). The sensitivity of Nile red to neutral lipids was first investigated byGreenspan et al. (1985) on macrophage lipids having greater fluorescence intensity with yellow-gold fluorescence with excitation at 450–500 nm and emission at > 528 nm. Nile red has been used for detection and quantification of intracellular lipid droplets in various biological systems (Safranyos and Cavenye, 1985). Nile red exhibits properties of a near-ideal lysochrome and is strongly fluorescent as a hydrophobic probe in which the fluorescence maxima exhibit a blue-shift proportional to the hydrophobicity of the environment (Greenspan et al., 1985; Greenspan and Fowler, 1985). The dye is soluble in the lipids and it does not interact with any tissue constituent except by solution. Nile red can be applied to cells in an aqueous medium, and it selectively binds to lipids (Greenspan et al., 1985). Nile red is very soluble and strongly fluorescent in wide range of organic solvents, but solubility and fluorescence are negligible in water (Greenspan and Fowler, 1985). While Nile red can stain most lipids, its fluorescence character varies depending on the lipid class. Nile red emits at a shorter wavelength when bound to neutral lipids, compared to polar compounds (Greenspan and Fowler, 1985). Unsaturated fatty acids exhibit stronger fluorescence intensity than saturated fatty acids (Fowler et al., 1987).
Limitations of the existing Nile red methods for detecting yeast lipids include variable diffusion across the cell membrane, and inconsistent readings due to time differences among strains and species to reach maximal emission. In this study, parameters that may influence the fluorescent emission were varied to achieve more consistent readings and to develop method for high throughput sample analysis. Validity of the fluorescence measurement was tested by comparison with lipid percent composition determined by extraction and gravimetric analysis.
2. Materials and methods
2.1. Organisms and culture conditions
Five different yeast species were revived from cryo-preserved stocks at the Phaff Yeast Culture Collection, the University of California Davis: One known oleaginous yeast species Rhodosporidium diobovatum UCD-FST 08-225, two low-lipid content control species Saccharomyces cerevisiae UCD-FST 70-12 and Pichia manshurica UCD-FST 49-14, one taxonomically-related oleaginous yeast Rhodosporidium paludigenum UCD-FST 09-163, and one suspected oleaginous species Cryptococcus victoriae UCD-FST 10-939 (Table 1). Strain C. victoriae UCD-FST 10-939 was selected because the cell mass floated in 20% glycerol when stocks were prepared for cryopreservation, an indicator of potential high lipid content and in a separate study, it produced high dry biomass (>10g/L) (data not shown). All yeasts were revived on Potato Dextrose Agar (Difco™, Cat.# 213400, Sparks, Maryland, USA) and incubated at 22°C for three to five days. For observation of the lipid accumulation, the yeasts were cultivated in 100 ml Medium A (glucose 30 g/l, yeast extract 1.5 g/l, NH4Cl 0.5 g/l, KH2PO4 7.0 g/l, Na2HPO4.12H2O 5.0 g/l, MgSO4.7H2O 1.5 g/l, FeCl3.6H2O 0.08 g/l, ZnSO4.7H2O 0.01 g/l, CaCl2.2H2O 0.1 g/l, MnSO4.5H2O 0.1 mg/l, CuSO4.5H2O 0.1 mg/l, Co(NO3)2.6H2O 0.1 mg/l; pH 5.5; Suutari et al., 1993) in a 250 ml Erlenmeyer flask. Flasks were incubated in a rotary shaker (Series 25, New Brunswick Scientific Co., Inc., Edison, New Jersey, USA) at 200 rpm at 30°C for 5 days. Liquid cultures were divided for Nile red analysis described in section 2.2, and gravimetric analysis described in section 2.3. For gravimetric analysis, 25 ml of the cultures was transferred to a 50 ml conical tube (Cat. # 62.547.205, Sarstedt, Netwon, North Carolina, USA) in triplicate, centrifuged at 2808 × g for 10 min to remove the supernatant, followed by washing twice with 15 ml sterile water. Cell pellets were stored overnight at −80°C, and freeze-dried in a Freezone® 4.5 L Freeze Dry System (Model 7750020, Labconco®, Kansas City, Missouri, USA) at 0.027mBar, −47°C for 48 hours. Freeze-dried cell pellets were maintained at −80 prior to gravimetric analysis. From each strain, about 20 mg dry cells in triplicate were used for gravimetric analysis of lipid content.
Table 1.
Yeast strains selected for the confirmation study
| Yeast species | Phylum | UCD-FST ID # |
Other collection ID # |
Source location |
|---|---|---|---|---|
| Cryptococcus humicola | Basidiomycete | 10–1145 | FORDA-CC 545 | Protected Forest Papalia, South Konawe, Sulawesi, Indonesia |
| Cryptococcus humicola | Basidiomycete | 10–1004 | FORDA-CC 579 | Protected Forest Papalia, South Konawe, Sulawesi, Indonesia |
| Cryptococcus ramirezgomezianus | Basidiomycete | 54–11.224 | Aspen Valley, Central Sierra, California, USA | |
| Cryptococcus victoriae | Basidiomycete | 10–939 | FORDA-CC 768 | Protected Forest Papalia, South Konawe, Sulawesi, Indonesia |
| Prototheca zopfii var. zopfii | Achlorophilic algae | 60–48 | YB-4826 | Obtained from NRRL culture collection |
| Rhodosporidium diobovatum | Basidiomycete | 67–405 | Exudate of Pterocarya rhoifolia, Shinkai, Kiso, Japan | |
| Rhodosporidium diobovatum | Basidiomycete | 70–46 | ATCC 22264, CBS 6084 | Triumph Reef, South East Florida, Florida, USA |
| Rhodosporidium diobovatum | Basidiomycete | 08–225 | CBS 6085 | Obtained from CBS |
| Rhodosporidium diobovatum | Basidiomycete | 04–830 | Experimental Orchard, near Winters, California, USA | |
| Rhodosporidium toruloides | Basidiomycete | 68–264 | CBS 315 | Atmosphere, Tokyo, Japan |
| Rhodotorula dairensis | Basidiomycete | 68–257 | CBS 347 | Atmosphere, Tokyo, Japan |
| Rhodotorula graminis | Basidiomycete | 04–862 | Female olive fly walk plate, Davis, California, USA | |
| Rhodosporidium paludigenum | Basidiomycete | 09–163 | CBS 3044 | Obtained from CBS |
| Rhodotorula babjevae | Basidiomycete | 05–775 | Obtained from Wolfskill USDA olive germplasm collection, Winters, California, USA | |
| Rhodosporidium fluviale | Basidiomycete | 81–485.4 | Opunctia ficus-indica, Tucso, Arizona, USA | |
| Rhodotorula mucilaginosa | Basidiomycete | 10–870 | FORDA-CC 704 | Protected Forest Papalia, South Konawe, Sulawesi, Indonesia |
| Rhodotorula mucilaginosa | Basidiomycete | 10–1102 | FORDA-CC 564, LIPI MC 465 | Protected Forest Papalia, South Konawe, Sulawesi, Indonesia |
| Saccharomyces cerevisiae | Ascomycete | 70–12 | ATCC 26108, CBS 8803, S288C | Obtained from R.K. Mortimer |
| Scheffersomyces stipitis | Ascomycete | 10–948 | FORDA-CC 776 | Protected Forest Papalia, South Konawe, Sulawesi, Indonesia |
| Pichia manshurica | Ascomycete | 49–14 | Olive brine, Berkeley, California, USA | |
| Yarrowia lipolytica | Ascomycete | 51–30 | CBS 2073 | Obtained from CBS |
2.2. Lipid analysis
2.2.1. Effect of washing cells in buffer prior to analysis
Each culture grown in Medium A as described above was divided into two sets, and was adjusted to OD600 = 1.0 with Medium A with a spectrophotometer (+NanoDrop 2000c UV-Vis spectrophotometer, Thermo Scientific Inc., Wilmington, Delaware, USA). One set of cultures was washed by centrifugation at 9,200 × g for 5 min at room temperature, culture supernatant was discarded and washed once with 10 mM phosphate buffered saline pH 7.4 amended with 0.15 M KCl (PBSKCL). The cells were then re-suspended in PBSKCL and cell density was re-adjusted to OD600 = 1.0.
2.2.2. Evaluation of the published method (Kimura et al., 2004)
Samples washed in PBSKCL (OD600 = 1.0) were analyzed using the method described by Kimura et al. (2004), using a Nanodrop 3300 fluorospectrometer with excitation at 470 nm and emission spectra measured at 400 – 700nm. Nile red (9-diethylamino-5-benzo[α]phenoxazinone) was obtained from Acros Organics (New Jersey, USA). The Nile red stock solution of 0.1 mg/mL in acetone was prepared immediately before use. The published method calls for a single reading 5 min after adding 0.24 – 0.47 µg/ml of Nile red. We first observed the maximum emission peak from 3 – 7 min at 30 sec intervals, and second observed variability of emission peak taken from the same culture batch measured at one time point, 5 min. For each culture, 1.0 µl of 0.1 mg/ml Nile red in acetone was added to 250 µl culture giving a final concentration of 0.4 µg/ml Nile red. Unstained culture was used as a blank. At the end of each measurement the blank was once again measured.
2.2.3. Modification of the Nile red fluorescence method
2.2.3.1. Variation in cell culture concentrations in Medium A or PBSKCL and addition of DMSO
Five different cell concentrations were used: unwashed cells OD600=0.1, 0.25, 0.5, 1.0 cells in Medium A, and 10% washed cells in PBSKCL OD600=1.0. Four replicates were used for each strain. For treatment with DMSO (dimethyl sulfoxide, Cat.# BP231-100, Fisher chemicals, New Jersey, USA), 25 µl DMSO:Medium A 1:1 (v/v) was added to 250 µl of culture in a 96-well microplate.
2.2.3.2. Nile red concentration
Twenty five microliters Nile red in acetone were added to OD600=1.0 to reach a final Nile red concentration of 5, 10, 50, or 100 µg/ml immediately after the initial absorbance reading at 600 nm to the corresponding well. For data analysis, the highest fluorescence intensity reached by each reaction during the kinetic reading was selected regardless of time. Fluorescence at 530/25 nm excitation, at 590/35 nm emission was measured every 60 sec for 20 minutes.
2.2.3.3. The use of black versus clear 96-well microplate
To examine the effect of microplate types on the measurement, clear flat bottom 96-well microplates (Cat.# 3631, Costar®, New York, USA) and black 96-well microplates with clear flat bottom (Cat.# 3370, Costar®Incorporated, New York, USA) were used. Black microplate wells were sealed with Viewseal (Cat. # EK-46070, E&K Scientific, California, USA). Published protocols suggested several combinations of excitation and emission wavelength for detecting lipid.Greenspan et al. (1985) reported 450–500nm and >528nm for intracellular detection; Greenspan and Fowler (1985) suggested 549nm and 628nm in aqueous conditions;Kimura et al. (2004) suggested 488nm and 400–700nm with spectrum at 5 min for yeast cells. In this study, we used the following combination protocol based on our preliminary optimization result (Data not shown) using a 96-well microplate reader (Biotek Synergy 2, Vermont, USA). Initial absorbance reading at 600 nm; initial fluorescence excitation at 530/25 nm, emission at 590/35 nm; and kinetic reading for 20 min with 60 sec interval with shaking for 30 sec. For clear plates, the optic position was set to bottom position, and for the black plate to top 50% position.
2.3. Gravimetric measurement of total lipids
To verify that Nile red was effective in determining the intracellular lipid content, a gravimetric method was used for comparison (Cheng et al. 2011), modified as follows. Certain yeast species have thicker cell walls that may prevent the release of intracellular lipids during the extraction. Several cell lysis methods were compared including enzymatic, physical, and chemical procedures, and relative lysis determined microscopically. Bead beating was determined to be superior (data not shown). Triplicate 20 mg samples of cells were transferred to 2-mL screw cap tubes, then 1.5 ml Folch’s solvent (Folch et al. 1956) was added and the tube was filled with 0.5 mm zirconia beads (Cat.# 11079105z, Biospec Products Inc., Oklahoma, USA) and two, 0.4 cm glass beads. Cells were homogenized in a MP Bio Fast Prep®-24 homogenizer (MP Biomedicals, Ohio, USA) for 30 sec, 5X with 30 sec interval on ice. A total of 6 mL Folch’s solvent was used to extract lipids and 1.2 mL 0.9% NaCl was added to give a better phase separation. Three mL of the chloroform phase was evaporated gradually in a 2.0 ml pre-weighed amber vial (Cat.# 500-322, Sun Sri, Rockwood, Tennessee, USA) under a slow stream of nitrogen. The lipid weight after extraction was used to calculate the percent of lipid as a percent of cell dry weight.
2.4. Data analysis
Fluorescence data were corrected for variation in cell density by dividing the fluorescence unit by background OD600 values.
When applicable, data were subjected to one-way analysis of variance and p value <0.05 was considered significant. Pairwise significant differences were tested by the Fisher’s LSD-test to group non-significantly different yeast species.
3. Results
3.1. Evaluation of the published method (Kimura et al. 2004)
Two yeasts species were used to evaluate the accuracy and consistency of the published (Kimura et al. 2004) method: Rhodosporidium paludigenum UCD-FST 09-163 and Saccharomyces cerevisiae UCD-FST 70-12. Cells were washed in PBSKCL (OD600 = 1.0). Nile red (1.0 mg/mL in acetone) was added to a final concentration of 0.4 µg/ml. Fluorescence spectra were recorded every 30 sec from 3 to 7 min after addition of the Nile red. As shown in Figure 1, E-max values differed up to 3-fold, depending on when the measurement was taken. R. paludigenum and S. cerevisiae reached the maximum emission peak (Emax) at 3 min after Nile red addition, but the Emax occurred at different wavelengths of 598 nm and 634 nm, respectively. The Emax values were 266 and 270 relative fluorescence unit (RFU) for the former and the latter, respectively. Emax values at 5 min, the time point recommended byKimura et al. (2004) were 488nm excitation and 565–585nm emission. R. paludigenum did not have significantly higher Emax than S. cerevisiae.
Fig. 1.
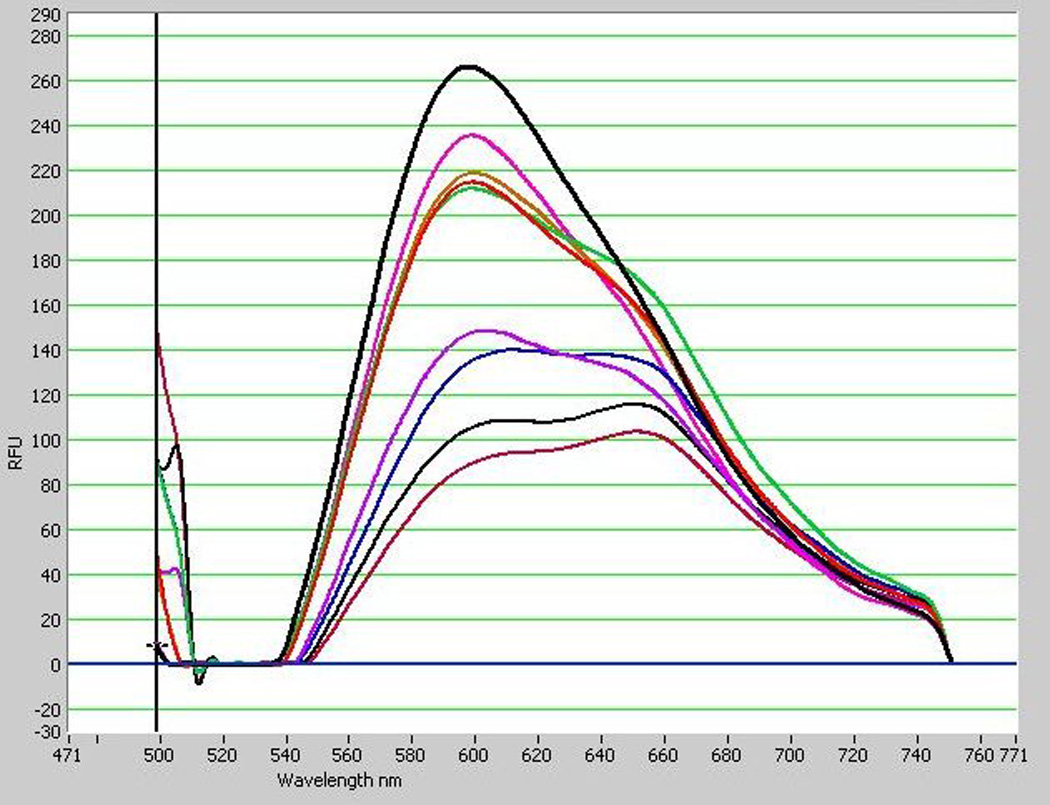
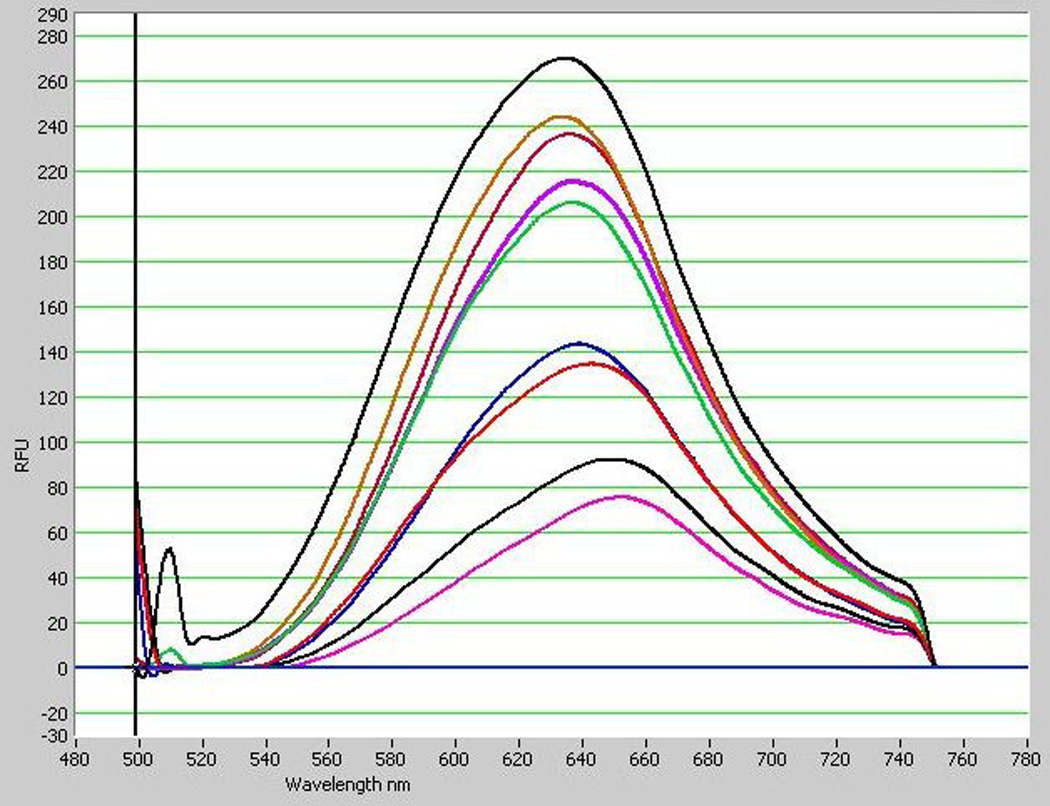
Variable emission spectra of Nile red-stained cultures of two yeast species over time. High lipid control Rhodotorula paludigenum UCD-FST 09-163 reached the highest peak spectrum 3 min after addition of Nile red of 266 Rfu at 598nm (A) and low lipid control Saccharomyces cerivisiae UCD-FST 70-12 reached the highest peak spectrum at 6.5 min of 270 Rfu at 634 nm (B). Culture with a final concentration of 4.0µg/mL Nile red was measured for fluorescence spectra every 30 sec from 3–7 min after adding Nile red.
Fig. 1A.
Note. Incubation time after Nile red addition, from highest to lowest peak: 3.0min, 6.5min, 4.5min, 3.5min, 4.0min, 5.0min, 6.0min, 5.5min, 7.0min.
Fig. 1B.
Note. Incubation time after Nile red addition, from highest to lowest peak: 3.0min, 4.5min, 7.0min, 5.0min, 4.0min, 6.0min, 3.5min, 5.5min, 6.5min.
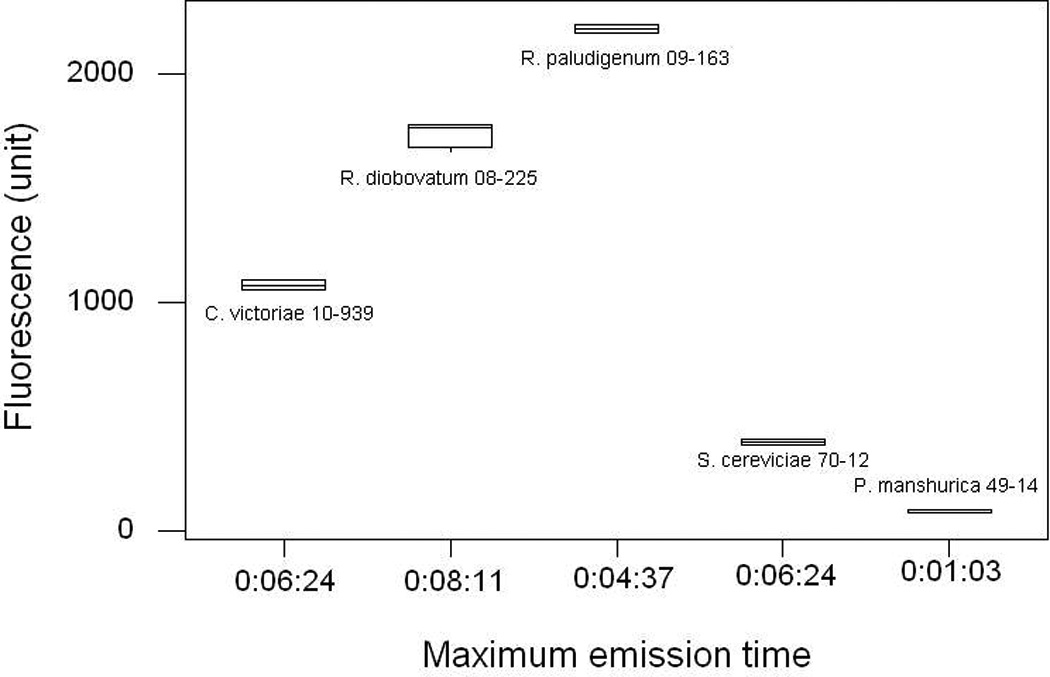
In the second observation, we employed a 5-min staining period as recommended (Kimura et al., 2004) using the five strains listed in section 2.1. Oleaginous R. diobovatum UCD-FST 08-225 exhibited a significantly higher maximum fluorescence intensity spectrum (P < 0.001), compared to the other four strains that exhibited significantly much lower spectrum. These four fluorescence intensities were not significantly different from each other (Figure 2). Kimura’s method (Kimura et al., 2004) was not reproducible in these trials. There were high variability of time to reach maximum fluorescence emission intensity across different yeast species. One possible reason could be that different species of yeast have different cell wall permeability that may prevent Nile red to penetrate the cell wall and cytoplasmic membrane (Chen et al., 2009) in the time allotted for measurement. The published method also measures one sample at a time, making analysis of large numbers of samples a difficult and time-consuming process.
Fig. 2.
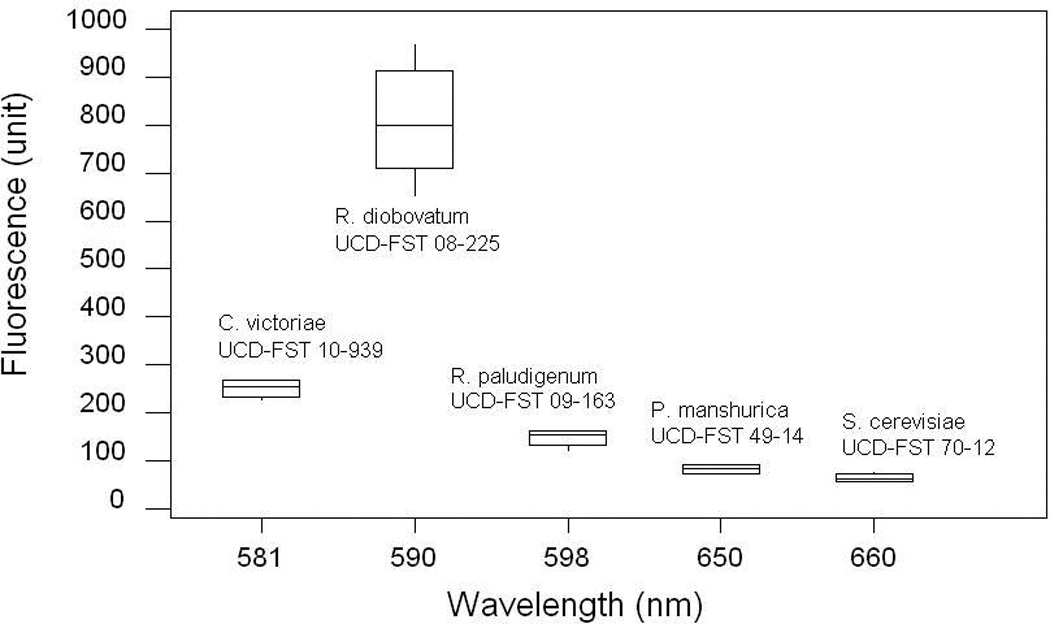
Average fluorescence intensities by five yeast species all measured at 5 min (n=4–5). In each reading, one µl Nile red (0.1 mg/ml in acetone) was added to 250 µl culture.
3.2. Improvement of the existing Nile red assay with specific regard to yeast lipids
To improve the existing techniques, several assay conditions were varied as follows: comparison of unwashed versus washed cells in PBSKCL, various cell densities, assay with and without addition of DMSO, a range of concentrations of Nile red, and comparison of two types of 96-well microplate (black vs clear).
3.2.1. The effect of washing, cell culture dilution and incorporation of DMSO on lipid detection
Since temperatures gave no major changes in fluorescence sensitivity (data not shown), we employed an assay temperature of 30°C throughout the experiment. Fluorescence intensity increased with an increase in cell concentrations (Figure 3A). As expected, two low lipid content yeast controls, P. manshurica UCD-FST 49-14 and S. cerevisiae UCD-FST 70-12 had the lowest fluorescence intensity (50.54 and 85.99 relative fluorescence intensity unit, respectively) in 250 µl cell cultures of OD600=1.0. Strain P. manshurica UCD-FST 49-14, in particular, had the lowest fluorescence intensities across different treatments. Washing cells in PBSKCL buffer did not necessarily facilitate a more sensitive lipid detection because cells in Medium A exhibited similar reading value (Figure 3. A). Thus, the wash step was omitted in the subsequent process. Addition of 25µl DMSO:Medium A (1:1) mixture to the 250µl culture improved cell penetration on two yeasts, R. paludigenum 01-163 and P. manshurica 49-14 but not the other three (Figure 3B). DMSO is a stain carrier that helps Nile red penetrate through the cell wall and the cytoplasmic membrane in microorganisms (Chen et al., 2009). Most polar and non-polar compounds can be dissolved in DMSO, and DMSO is miscible in a range of organic solvents making it very versatile as a stain carrier (Govender et al., 2012). The observe differenced in maximum fluorescence intensity suggest that certain yeasts require a carrier for Nile red to penetrate the cells. Therefore, DMSO was employed for subsequent tests. Higher Nile red concentrations resulted in no increase on the fluorescence intensities, on the contrary it reduced the fluorescence intensity (Figure 3D). A final concentration of 5 µg/ml Nile red gave the highest emission values. From this study, the most effective combination of conditions to obtain optimum fluorescence measurement, were cells at OD600 = 1.0, addition of 25µl DMSO:Medium A (1:1, v/v) and 25 µl of 50 µg/ml Nile red for a final concentration of 5µg/ml.
Fig. 3.


Fluorescence intensity and variability under several assay conditions. (A) Cell washing and addition of DMSO on lipid detection. (B) Introduction of DMSO to 10% cell culture density. (C) Higher cell concentration with a Nile red concentration (100µg/ml). (D) Various Nile red concentrations optimized conditions: cell culture in Medium A, cell OD600=1.0, and addition of 25 µl DMSO:Med.A (1:1, v/v). The volume of each cell culture was 250 µl.
Clear 96-well microplate gave inconsistent fluorescence reading in our first trial (Data not shown). We speculated that in a clear microplate, fluorescence might include emission from adjacent wells, and therefore we selected a black microplate with clear bottom for subsequent tests. For the black microplate, we modified the fluorescence measurement by setting the optic position to top 50%. We again compared the performance of the two microplate types by employing the improved conditions described above (Figure 4).
Fig. 4.

Comparison of clear (A) 96-well microplate and (B) black 96-well microplate. Spectra were corrected for a slight variation in culture OD reading by dividing fluorescence intensity unit with the background OD600 values. (C) Comparison of the fluorescence intensity at the same time point using the highest fluorescence intensity unit of the black microplate (C).
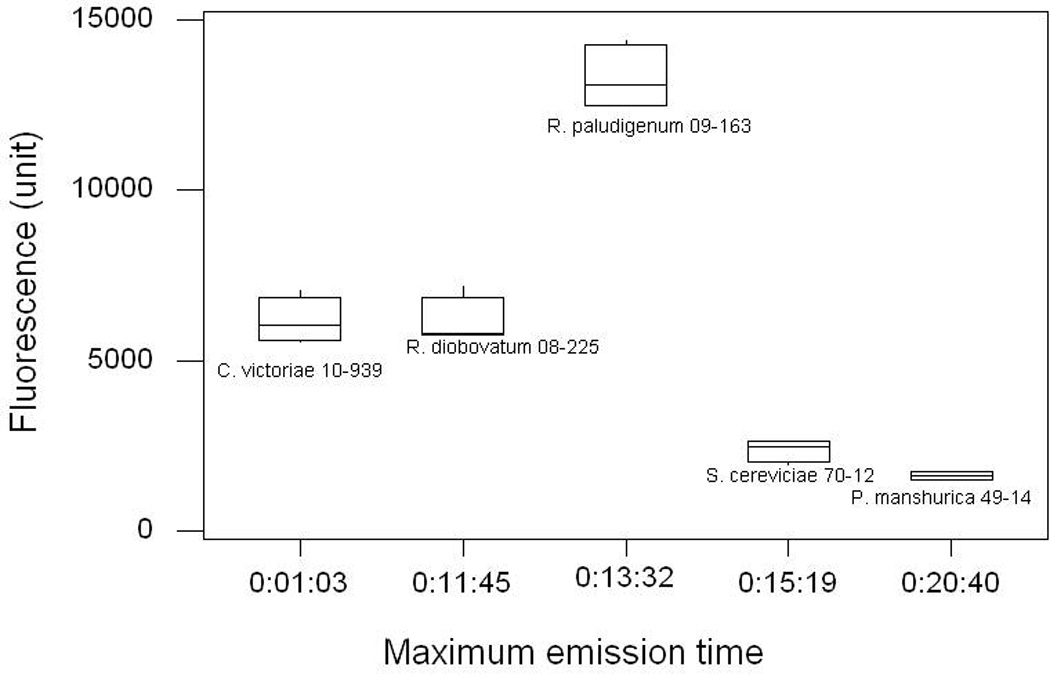
In most cases, the time required to obtain maximum fluorescence intensity is much quicker with the black microplate (2 – 8 min), and after that the fluorescence intensity decreases. The maximum intensity in a clear microplate, however, required up to 20 min. For instance, although R. paludigenum UCD-FST 09-163 exhibited the highest fluorescence intensity of all yeasts in both microplate types (P<0.001), the time required to obtain maximum fluorescence intensity with the black microplate was 4.5 min compared to that with clear microplate (13.5 min). Nile red was known to quench immediately in aqueous solution (Sackett and Wolff, 1987) and began to lose fluorescence after 10 min of irradiation in microalgae (Govender et al., 2012). In this regard, the use of a clear microplate may not be suitable for yeast.
3.2.2. Comparison of cells grown in several common growth media
Strain R. diobovatum UCD-FST 08-225 was grown in potato dextrose broth (PDB), Medium A, Medium A supplemented with sucrose rather than glucose, and yeast extract/malt extract broth (YMB). The Nile red assay was performed using cells at OD600=1.0, 5 µg/ml of Nile red concentration and 25 µl of DMSO:Medium A (1:1, v/v). Fluorescence measurements of the uninoculated broth and cultures (Figure 5) showed that fluorescence varies with the medium used. Most blank media fluoresce to some extent. Uninoculated YMB gave the highest fluorescence background which suggested that YMB was not an appropriate media for this assay. Use of other media should be validated before using this assay.
Fig. 5.

Comparison of fluorescence of the non-inoculated and inoculated media with R. diobovatum UCD-FST 08-225 with different carbon sources. (A) Blank PDB, (B) PDB and yeast, (C) Medium A, (D) Medium A and yeast, (E) Medium A-sucrose, (F) Medium A-sucrose and yeast, (G) YMB, (H) YMB and yeast.
3.2.3. Gravimetric method for measurement of the total lipid content
Relative fluorescence intensity obtained using optimized reaction conditions described above were compared to absolute lipid content of five yeast strains determined gravimetrically.
The improved Nile red method was compared to gravimetric analysis by further testing 20 yeast strains both Basidiomycete and Ascomycete species. Strains were selected to include more strains of the species belonging to the genera that were used in this optimization study (Rhodotorula, Cryptococcus, Rhodosporidium, Yarrowia). In addition, the two low lipid control strains (S. cerevisiae and P. manshurica) and two other species of our interest (Scheffersomyces and Prototecha) were also included in the set (Table 1.). Strains with high fluorescence were likely to have higher lipid contents and vice versa (r=0.71, Figure. 7.), suggesting that this improved method is reliable across numerous yeast species. Two species R. paludigenum and R. diobovatum, were selected because they are buoyant strain and they are relatives of the known oleaginous yeast species Rhodosporidium toruloides (Ageitos et al., 2011). All, except one strain of R. diobovatum had consistently high lipids (>30% of total lipid content) in both analyses (Table 2.). It was not known before that these species are oleaginous (Ageitos et al., 2011). This may be the first study to discover R. diobovatum and R. paludigenum as oleaginous yeast. Detailed analysis of fatty acid content of this particular species will be described in another publication. On the other hand, one strain of the known oleaginous yeast, Y. lipolytica had consistently low lipids on both analyses.
Fig. 7.

Comparison of the lipids from gravimetric and Nile red fluorescence methods using 20 different yeast strains (r =0.71).
Table 2.
Comparison of lipid content by Nile red and gravimetric analyses for ascomycete and basidiomycete yeast species
| Species | UCD-FST ID # | Nile red (RFU)i,ii | Total lipids (%)ii |
|---|---|---|---|
| Cryptococcus humicola | 10–1004 | 855.86±35.54c | 33.955±0.88cd |
| Cryptococcus ramirezgomezianus | 54–11.22 | 517.56±16.83b | 23.487±1.97bc |
| Cryptococcus victoriae | 10–939 | 371.65±5.13b | 22.173±3.47bc |
| Prototheca zopfii var. zopfii | 60–48 | 144.68±3.74a | 16.827±1.19b |
| Rhodosporidium diobovatum | 04–830 | 434.07±24.41b | 40.927±1.76d |
| Rhodosporidium diobovatum | 08–225 | 287.61±0.89ab | 30.88±0.64c |
| Rhodosporidium diobovatum | 67–405 | 291.61±2.17ab | 30.857±1.48c |
| Rhodosporidium diobovatum | 70–46 | 204.64±4.78a | 20.577±5.24b |
| Rhodosporidium toruloides | 68–264 | 958.13±14.11d | 45.457±7.49d |
| Rhodotorula dairensis | 04–862 | 300.9±2.32ab | 39.903±0.55d |
| Rhodotorula graminis | 68–257 | 156.87±1.2a | 19.907±2.85b |
| Rhodosporidium paludigenum | 09–163 | 467.45±16.55b | 31.037±2.33c |
| Rhodotorula babjevae | 05–775 | 306.98±1.72ab | 29.797±0.94c |
| Rhodosporidium fluviale | 81–485.4 | 519.8±50.09b | 24.727±4.04bc |
| Rhodotorula mucilaginosa | 10–1102 | 48.23±1.38a | 27.683±1.10c |
| Rhodotorula mucilaginosa | 10–870 | 84.95±1.55a | 10.103±0.76ab |
| Saccharomyces cerevisiae | 70–12 | 171.13±6.15a | 11.8±0.47ab |
| Scheffersomyces stipitis | 10–948 | 43.33±0.4a | 12.76±0.72ab |
| Pichia manshurica | 49–14 | 82.25±0.54a | 15.383±0.65b |
| Yarrowia lipolytica | 51–30 | 62.62±0.72a | 15.947±0.24b |
RFU: relative fluorescence unit.
Different superscript letters indicate groups which are significantly different by Fisher’s test, p<0.05, n=3.
4. Discussion
Several improvements were made to a published Nile red protocol for yeast lipid analysis. The high carbon, nitrogen limiting Medium A with glucose as a carbon source was suitable for accumulation of lipids which is in agreement withSuutari et al. (1993). The kinetic reading rather than selection of a single time-point, allowed different strains to reach their maximum fluorescence emission, which occur at different time points for different species. This improvement is important to identify new strains that may be otherwise overlooked if reading all strains at the same single time point. Scaling the volume of the reaction down to 250 µl in a 96-well microplate rather than using a single cuvette increased the throughput and efficiency. Addition of DMSO may improve Nile red penetration through the cell of certain species. Cell washing with PBSKCL is time-consuming and did not show any significant effect on the fluorescence reading. Elimination of the wash step thus accelerates the screening process; however, it should be noted that washing cells with PBSKCL may be necessary when certain media such as YM are used to grow yeast, as YM gave high fluorescence background (Figure 8). The improved protocol is high-throughput as a preliminary step for screening large numbers of samples to identify oleaginous yeast candidate; however, other lipid analysis protocols need to be subsequently employed to allow the detection of small differences in lipid content.
Fig. 8.
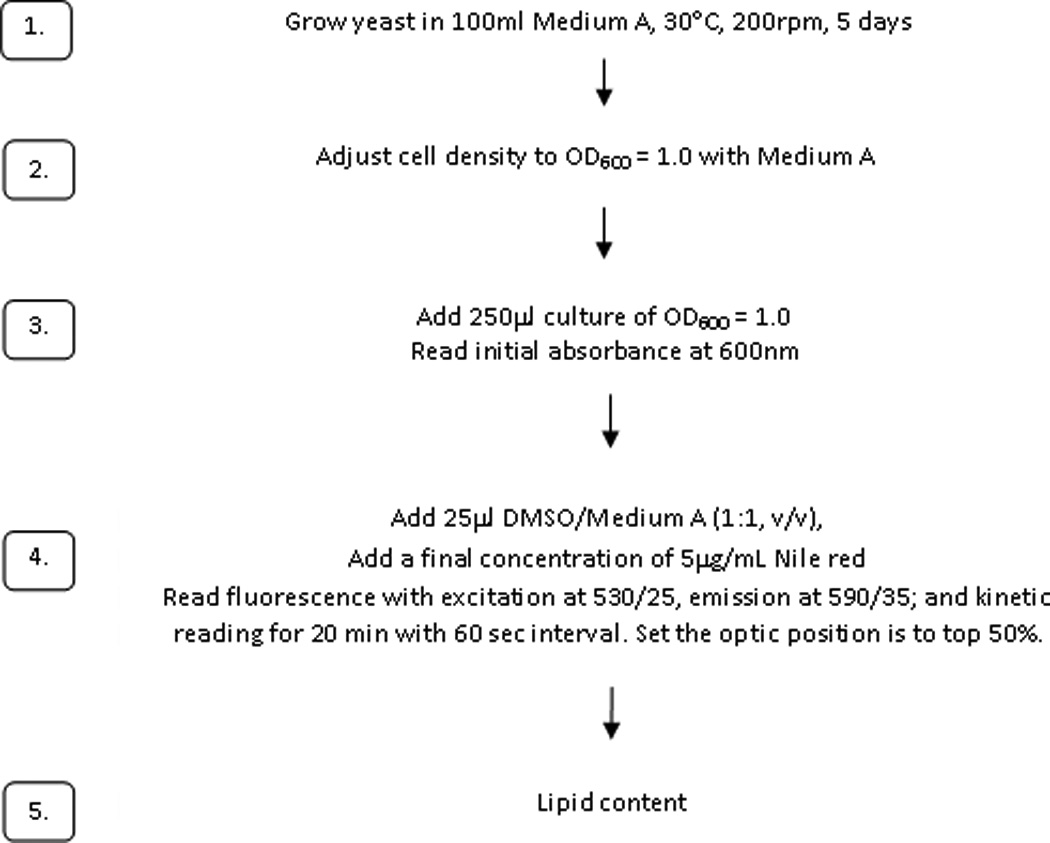
Protocols for improved Nile red assay method
The optimized protocol is summarized as follows, and is diagrammed in Figure 9.
Yeast is cultivated in 100ml Medium A (Suutari et al., 1993) in a 250 ml Erlenmeyer flask and incubated at 30°C, 200 rpm for 5 days.
Cell density is adjusted in Medium A to OD600=1.0. For each strain, 250 µl of this culture is transferred to a 96-well black microplate in quadruplicate. To each well, 25 µl DMSO/MedA (1:1, v/v) and 25 µl 0.05 mg/ml Nile Red (final concentration of 5 µg/ml Nile red) are mixed into the culture before the lipid measurement. Initial absorbance reading is at 600 nm; initial fluorescence excitation at 530/25, emission at 590/35; and kinetic reading for 20 min with 60 sec interval. The optic position is set to top 50%.
Maximal emission values are determined. Fluorescence data were corrected for variation in cell density by dividing the fluorescence unit by background OD600 values.
Fig. 6.

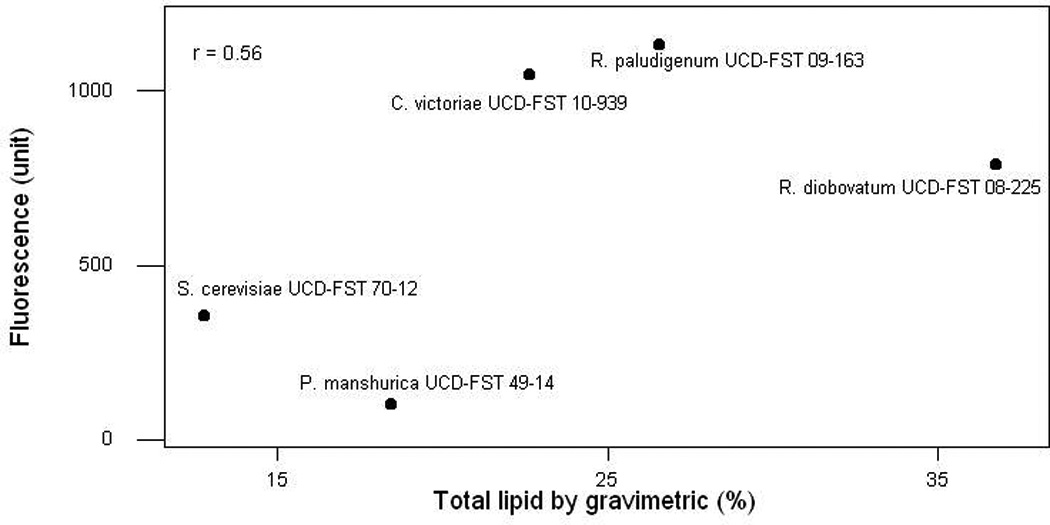
Comparison of the lipids from gravimetric and Nile red fluorescence methods. Lipids as determined by gravimetric in percentage (A) and by the best method combination with Nile red (OD600=1.0 culture, 25ul DMSO/MedA, 25ul 0.05mg/mL Nile Red) (B). Correlation plot of the two methods (r =0.56) showing two low lipid control S. cerevisiae UCD-FST 70-12 and P. manshurica UCD-FST 49-14 had consistently detected having low lipid in both lipid analyses methods.
Highlights.
An improved Nile red assay for estimation of intracellular yeast lipid is developed
The use of 96-well microplate is high-throughput for screening large sample number
No prior cell washing with buffer is needed
Dimethyl sulfoxide improves Nile red staining for certain species
Kinetic reading allows different yeast strains to reach maximum emission
Acknowledgments
Some yeasts used in this study originated from a collaborative project with the Government of the Republic of Indonesia, funded by Grant Number U01TW008160 from the NIH Fogarty International Center, the NIH Office of Dietary Supplements, the National Science Foundation and the Department of Energy. This project was supported by the USDA Agricultural Food Research Initiative of the National Food and Agriculture, USDA, Grant #35621-04750. The content is solely the responsibility of the authors and does not necessarily represent the official views of the Fogarty International Center or the National Institutes of Health, the Office of Dietary Supplements, the National Science Foundation, the Department of Energy, or the Department of Agriculture. David Mills, Department of Viticulture and Enology, UC Davis, USA provided access to the microplate reader. Jean VanderGheynst, Yu-Shen Cheng and Hong-Yun Go, of the Department of Biological and Agricultural Engineering, UC Davis, USA are thanked for advice on gravimetric analysis.
Footnotes
Publisher's Disclaimer: This is a PDF file of an unedited manuscript that has been accepted for publication. As a service to our customers we are providing this early version of the manuscript. The manuscript will undergo copyediting, typesetting, and review of the resulting proof before it is published in its final citable form. Please note that during the production process errors may be discovered which could affect the content, and all legal disclaimers that apply to the journal pertain.
References
- Ageitos JJ, Vallejo JA, Veiga-Crespo P, Villa TG. Oily yeasts as oleaginous cell factories. Applied Microbiology and Biotechnology. 2011;90:1219–1227. doi: 10.1007/s00253-011-3200-z. [DOI] [PubMed] [Google Scholar]
- Bligh EG, Dyer WJ. A rapid method of total lipid extraction and purification. Biochemistry and Physiology. 1959;37:911–917. doi: 10.1139/o59-099. [DOI] [PubMed] [Google Scholar]
- Botham PP, Ratledge C. A biochemical explanation for lipid accumulation in Candida 107 and other oleaginous micro-organisms. Journal of General Microbiology. 1979;114:361–375. doi: 10.1099/00221287-114-2-361. [DOI] [PubMed] [Google Scholar]
- Chen W, Zhang C, Song L, Sommerfeld M, Hu Q. A high throughput Nile red method for quantitative measurement of neutral lipids in microalgae. Journal of Microbiological Methods. 2009;77:41–47. doi: 10.1016/j.mimet.2009.01.001. [DOI] [PubMed] [Google Scholar]
- Cheng YS, Zheng Y, VanderGheynst JS. Rapid quantitative analysis of lipids using colorimetric method in a microplate format. Lipids. 2011;46:95–103. doi: 10.1007/s11745-010-3494-0. [DOI] [PubMed] [Google Scholar]
- Cole TA. Use of Nile red as a rapid measure of lipid contents in ciliates. European Journal of Protistology. 1990;25:361–368. doi: 10.1016/S0932-4739(11)80129-X. [DOI] [PubMed] [Google Scholar]
- Elle IC, Olsen LCB, Pultz D, Rødkær SV, Færgeman NJ. Something worth dyeing for: molecular tools for the dissection of lipid metabolism in Caenorhabditis elegans. FEBS Letters. 2010;584:2183–2193. doi: 10.1016/j.febslet.2010.03.046. [DOI] [PubMed] [Google Scholar]
- Evans CT, Ratledge C, Gilbert SC. A rapid screening method for lipid-accumulating yeast using a replica-printing technique. Journal of Microbiological Methods. 1985;4:203–210. [Google Scholar]
- Folch J, Lees M, Sloane-Stanley GH. A simple method for the isolation and purification of the total lipids from animal tissues. Journal of Biological Chemistry. 1956;226:497–509. [PubMed] [Google Scholar]
- Fowler SD, Brown WJ, Warfel J, Greenspan P. Use of nile red for the rapid in situ quantitation of lipids on thin-layer chromatograms. Journal of Lipid Research. 1987;28:1225–1232. [PubMed] [Google Scholar]
- Govender T, Ramanna L, Rawat I, Bux F. BODIPY staining, an alternative to the Nile Red fluorescence method for the evaluation of intracellular lipids in microalgae. Bioresource Technology. 2012;114:507–511. doi: 10.1016/j.biortech.2012.03.024. [DOI] [PubMed] [Google Scholar]
- Greenspan P, Fowler SD. Spectrofluorometric studies of the lipid probe, nile red. Journal of Lipid Research. 1985;26:781–789. [PubMed] [Google Scholar]
- Greenspan P, Mayer EP, Fowler SD. Nile red: A selective fluorescent stain for intracellular lipid droplets. The Journal of Cell Biology. 1985;100:955–977. doi: 10.1083/jcb.100.3.965. [DOI] [PMC free article] [PubMed] [Google Scholar]
- Hu Q, Sommerfeld M, Jarvis E, Ghirardi M, Posewitz M, Seibert M, Darzins A. Microalgal triacylglycerols as feedstocks for biofuel production: perspectives and advances. The Plant Journal. 2008;54:621–639. doi: 10.1111/j.1365-313X.2008.03492.x. [DOI] [PubMed] [Google Scholar]
- Huang GH, Chen G, Chen F. Rapid screening method for lipid production in alga based on Nile red fluorescence. Biomass and Bioenergy. 2009;33:1386–1392. [Google Scholar]
- Kimura K, Yamaoka M, Kamisaka Y. Rapid estimation of lipids in oleaginous fungi and yeasts using Nile red fluorescence. Journal of Microbiological Methods. 2004;56:331–338. doi: 10.1016/j.mimet.2003.10.018. [DOI] [PubMed] [Google Scholar]
- Listenberger LL, Brown DA. Fluorescent Detection of Lipid Droplets and Associated Proteins. Current Protocols in Cell Biology. 2007:24.2.1–24.2.11. doi: 10.1002/0471143030.cb2402s35. [DOI] [PubMed] [Google Scholar]
- Ratledge C. Lipids and fatty acids. In: Rose AH, editor. Economic Microbiology. vol. 2. New York & London: Academic Press; 1978. pp. 263–301. [Google Scholar]
- Ratledge C. Microorganisms for Lipids. Acta Biotechnologica. 1991;5:429–438. [Google Scholar]
- Safranyos RGA, Caveney S. Rates of diffusion of fluorescent molecules via cell-to-cell membrane channels in a developing tissue. Journal of Cell Biology. 1985;100:736–747. doi: 10.1083/jcb.100.3.736. [DOI] [PMC free article] [PubMed] [Google Scholar]
- Shahidi F. Extraction and measurement of total lipids. Current Protocols in Food Analytical Chemistry. 2001:D1.1.1–D1.1.11. [Google Scholar]
- Suutari M, Priha P, Laakso S. Temperature shifts in regulation of lipids accumulated by Lipomyces starkeyi. Journal American Oil Chemists’ Society. 1993;70:891–894. [Google Scholar]
- U.S. Environmental Protection Agency. [accessed May 2012];Alternative fuels: Biodiesel Report #EPA420-F-06-044 (2006) 2006 Available at: http://www.epa.gov/smartway.