Abstract
Single-molecule fluorescence methods offer the promise of ultrasensitive detection of biomolecules, but the passive immobilization methods commonly employed require analyte concentrations in the picomolar range. Here, we demonstrate that superparamagnetic Fe3O4 nanoparticles (NPs) can be used with an external magnetic field as a simple strategy to enhance the immobilization efficiency and thereby decrease the detection limit. Inorganic nanoparticles functionalized with streptavidin were bound to biotinylated single-stranded DNA oligonucleotides, which were in turn annealed to complementary oligonucleotides labeled with a Cy3 fluorescence dye. Using an external magnetic field, the superparamagnetic nanoparticles were localized to a specific region within the flow chamber surface. From the single-molecule fluorescence time traces, single-step photobleaching indicated that the surface-immobilized NPs were primarily bound with a single Cy3-labeled oligonucleotide. This strategy gave a concentration detection limit for the Cy3-labeled oligonucleotide of 100 aM, 3,000-fold lower than that from an analogous strategy with passive immobilization. With a sample volume of 25 μL, this method achieved a mole detection limit of approximately 2.5 zeptomoles (~1500 molecules). Together, the results support that idea that single-molecule fluorescence methods could be used for biological applications, such as detection and measurements of nucleic acids from biological or clinical samples without PCR amplification.
Keywords: Magnetic nanoparticles, single-molecule total internal reflection fluorescence microscopy, zeptomole detection limit, directed immobilization
Introduction
The sensitivity of detection assays depends on the efficiency of detecting the target molecules above the level of background. Techniques utilizing ensemble measurements, such as surface plasmon resonance imaging (1, 2), capillary isoelectric focusing (3), dot-blotting immunoassay (4) and pore-limit electrophoresis (5), have reached zeptomole detection limits. In principle, single molecule methods have the ultimate detection limit of individual molecules, either one at a time in solution or many in parallel when they are immobilized on a surface. Thus, these methods, especially immobilization-based methods, have potential applications in the amplification-free detection of individual DNA and RNA molecules. The most common immobilization strategies for single-molecule fluorescence experiments utilize biotin-streptavidin linkages (6), thiol crosslinking (7), and click chemistry (7, 8). These strategies give detectable immobilization of molecules from solutions containing 250 amol to 1 pmol of analytes (9, 10). In practice, the detection limits for these methods are limited by the efficiency of immobilizing the molecules on the surface of a microscope slide using passive diffusion. Typically, only a small fraction of the target molecules are immobilized for detection, and they are spread over many fields of view.
We reasoned that a directed immobilization approach could increase the immobilization efficiency and lower the detection limit. Inorganic superparamagnetic nanoparticles (NPs) functionalized with biomolecules have extensive applications in biosensors (11–14), drug delivery systems (15–17), and sample purification (18–20). The biomolecule confers the specificity of the NP assembly towards the targeted molecules, such as DNA, microRNAs, carbohydrates, and antigens. The superparamagnetic properties of these NPs allow them to be manipulated with external magnetic fields during immobilization (21–23) and offer a strategy to minimize the search volume for binding sites. Indeed, NPs have been used in conjunction with a broad range of detection strategies, with analyte detection limits ranging from 10 pM to 333 aM (Table 1).
Table 1.
Comparison of the limits of detection achieved by magnetic nanoparticles in different analyte detection assays.
| Method of detection | Analyte | LoDa | References |
|---|---|---|---|
| Microplate fluorescence | Herpes simplex virus | 6 pM | 24 |
| Microplate fluorescence | DNA oligonucleotides | 1 pM | 25 |
| Grating-coupled surface plasmon resonance | β human chorionic gonadotropin | 450 fM | 26 |
| Particle counting immunoassay | BPDE-DNA | 180 fM | 27 |
| Surface-enhanced Raman scattering | Rift Valley Fever virus, West Nile virus | 20 fM | 28 |
| Digital ELISA with polymeric arrays | Prostate specific antigen | 14 fM | 29 |
| Microfluidic GRAVI-Chip | DNA sequences of Legionella pneumophila | 333 aM | 30 |
LoD: Limit of detection
Here, using superparamagnetic nanoparticles functionalized with streptavidin protein, single-stranded DNA oligonucleotides labeled with single Cy3 dyes were captured and immobilized for single-molecule imaging by total internal reflection fluorescence microscopy (TIRFM). By applying an external magnetic field, the DNA-NP assemblies were directed to the imaging surface, increasing the local concentration and greatly improving the immobilization efficiency. The detection threshold for observing the target DNAs was reduced to the attomolar range (~100 aM). This concentration limit represents a 3,000-fold improvement in immobilization efficiency, compared to passive immobilization methods. With a sample chamber volume of ~25 μL, a mole detection threshold of ~2.5 zeptomoles (~1500 molecules) was attained. This detection limit is sufficiently low that it would be expected to allow amplification-free detection of DNA and RNA molecules in drawn blood samples (31).
Materials and methods
Synthesis of Fe3O4 nanoparticles
Fe3O4 nanoparticles were prepared via the chemical coprecipitation method (32). Briefly, iron (II) chloride and iron (III) chloride were dissolved in deionized water, and the nanoparticles were precipitated at room temperature with the addition of 1 M NaOH to maintain a constant pH of 10. The precipitate was heated to 80 °C and washed several times with water and ethanol. The NPs were magnetically pelleted and then dried at 70 °C. Previous studies reported magnetization at saturation values ranging from 40 – 70 emu/g for unmodified Fe3O4 nanoparticles (33, 34). Iron oxide-core nanoparticles conjugated with streptavidin and coated with poly-glucose carbohydrate were purchased from Nanocs (Boston, MA).
Scanning-transmission electron microscope measurements
The NPs were diluted in ethanol and sonicated for five minutes. A drop of the suspension was deposited onto a carbon-coated copper grid for imaging. The grid was dried at room temperature for 20 minutes. The images were recorded with a Hitachi S-5500 scanning electron microscope equipped with a bright-field detector for scanning-transmission microscopy (STEM) imaging at a magnification of 600k.
Functionalizing the nanoparticles with streptavidin
The NPs were modified with the aminosilane 3-aminopropyltriethoxysilane (APTES; United Chemical Technologies, Bristol, PA) to prepare the surface for conjugation with the streptavidin (35). The NPs (20 mg) were washed several times with ethanol and then sonicated for 5 minutes. They were added to a prepared solution containing 2% APTES in a 1:1 mixture of ethanol and water. The mixture was sonicated for 30 minutes and then incubated overnight at 50 °C with rapid stirring. The NPs were pelleted, washed with methanol, and dried at 50 °C. They were then conjugated with streptavidin as described (32). Briefly, the APTES-coated nanoparticles (5 mg) were mixed with a 0.05 mg/mL solution of the crosslinker 1-ethyl-3-[3-dimethylaminopropyl] carbodiimide hydrochloride (EDAC; Thermo Fisher Scientific, Rockford, Illinois) dissolved in a hybridization buffer (100 mM MES, 500 mM NaCl, pH 6). The mixture was sonicated for 25 minutes at 9 °C. The NPs were pelleted using a magnet, and the supernatant was removed. A 5 μg/mL solution of streptavidin (Sigma-Aldrich, St. Louis, MO) in 40 mM phosphate-buffered saline PBS solution (pH 7.0) was added to the NPs, and the mixture was sonicated for 1 hour at 25 °C. The NPs were magnetically pelleted and resuspended in 40 mM PBS solution. The amount of streptavidin conjugated to the NPs was determined by measuring the protein content of the supernatant with the Bradford protein assay (Bio-Rad). The decrease in the streptavidin concentration in the supernatant was used as a measure of the amount of streptavidin bound to the nanoparticles. The streptavidin-NPs were resuspended in PBS buffer to a concentration of 20 μM, based on the amount of conjugated streptavidin.
DNA binding assays
The DNA binding experiments were performed using the following oligonucleotides: 5'-biotin-TGTGTAAGTTTTAGGTTGATTTTGGT-Cy3, 5'-biotin-TGTGTAAGTTTTAGGTTGATTTTGGT, 5'-Cy3-ACCAAAATCAACCTAAAACTTACACA, 5'-GGTGAAATCATGCCGAACATCCCG, and 5'-GGTGA/iCy3/AATCATGCCGAACATCCCG. For the biotinylated DNA capture assay, the reaction mixture consisted of 5 μM streptavidin-NPs, 2 μM biotinylated DNA oligonucleotides, 50 mM Tris (pH 8.0), and 0.5 M NaCl. At each time point, the NPs were magnetically pelleted, and the supernatant was removed to stop the reaction. The absorbance at 260 nm (A260) was measured to determine the DNA content of the supernatant, and the absorbance at 400 nm (A400) was measured to determine the background. The supernatant was returned to the NP-containing reaction tube to reinitiate the binding reaction. The binding reaction was stopped at several time points to measure the reduction in the DNA content as a measure of DNA binding by the streptavidin-NPs. As a control, the nonspecific adsorption to the streptavidin-NPs was measured by performing the reaction with a non-biotinylated oligonucleotide of the same sequence. Prior to the DNA hybridization experiments, the DNA-NPs were washed several times with PBS buffer to remove the unbound oligonucleotides. For the DNA hybridization assays, the reaction mixture consisted of 5 μM DNA-NPs, 2 μM complementary Cy3-labeled oligonucleotide, 50 mM Tris (pH 8.0), and 1 M NaCl. The absorbance at 545 nm (A545) was measured to determine the depletion of the Cy3-labeled oligonucleotides from the supernatant due to hybridization to the DNA-NPs. A nonspecific reaction had the same reaction conditions except that the oligonucleotide was not complementary in sequence to the DNA linked to the NPs.
Surface immobilization
Quartz slides (G. Finkenbeiner Inc., Waltham, MA) were cleaned by incubation in NOCHROMIX solution (Godax Laboratories, Cabin John, MD), followed by a series of 20-min sonication steps, first in acetone, then in 70% ethanol, and finally in 1 M KOH, with rinses and 10-min sonications in water after each of the three solvent wash steps. The slides were stored in distilled water and were flamed for approximately two minutes prior to use. A flow chamber was constructed from a cleaned quartz slide and coverslip separated by double-sided tape. For directed DNA-NP immobilization, the flow chambers were pre-treated with 1 mg/mL biotinylated bovine serum albumin (BSA; Sigma-Aldrich) for 2 min. A ceramic block magnet (field strength ~ 2000 Oe; model 542000, Lowe's) was then placed atop the flow channel, and 25 μL of the diluted NP solution was pipetted into the chamber. The NPs were incubated in the magnetized chamber for 5 min and then flushed with buffer (500 mM NaCl, 50 mM Tris, pH 8.0). For the control immobilization of the biotinylated DNA in the absence of NPs, the flow chambers were pre-treated with 1 mg/mL biotinylated BSA and then with 0.1 mg/mL streptavidin (Life Technologies, Grand Island, NY). The biotinylated oligonucleotides were pipetted into the flow chamber and incubated for 1, 5 and 30 min.
Single-molecule fluorescence microscopy
The slide was mounted on an inverted microscope (Olympus IX-71) with a 60× water-immersion objective. The samples were excited by prism-type total internal reflection with a 532-nm laser (Crystalaser, Reno, NV). The images were acquired with a cooled I-PentaMAX IIC CCD (Princeton Instruments, Trenton, NJ). The image capture frequency was 2 – 10 Hz. A deoxygenating imaging buffer, used to slow photobleaching, consisted of 50 mM Tris (pH 8.0), 500 mM NaCl, 0.8 mM Trolox, 12% glucose, 0.1 mg/mL glucose oxidase (Sigma-Aldrich) and 0.04 mg/mL catalase (Roche). The molecules were imaged for up to 60 s to observe complete photobleaching of the individual Cy3 dyes, seen as discrete losses in intensity in the time traces. The photobleaching events were identified by a sliding two-tailed t-test. The number of Cy3 photobleaching events per localized peak corresponds to the number of oligonucleotides bound to the NP. The large fraction of detected molecules with single-step photobleaching indicates that each observed NP captured a single Cy3-labeled oligonucleotide, as expected because the binding reaction included a substoichiometric amount of Cy3-labeled oligonucleotide relative to NPs.
Data analysis
The binding data were fit with the Sips isotherm to assess saturation and heterogeneity in binding of the streptavidin-functionalized nanoparticles to the biotinylated surface (36).
| (1) |
where c is the DNA concentration, K is the binding constant, and n is the heterogeneity index. If n = 1, binding to the surface is homogeneous and can be described by a single binding constant. Lower values of n indicate heterogeneity in binding modes, generating a distribution of binding constants.
Results and discussion
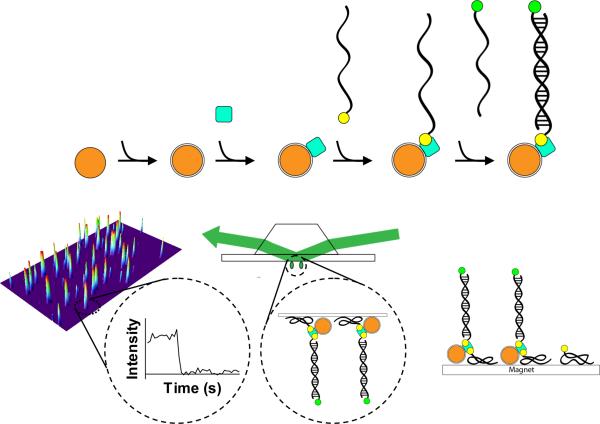
The detection limit in single-molecule imaging is constrained by the efficiency with which the molecules can be immobilized on the imaging surface and by the area size over which these molecules are dispersed. Both to increase the immobilization efficiency and to decrease the surface area, we developed the strategy shown in Fig. 1. Superparamagnetic nanoparticles were functionalized with streptavidin protein, and biotinylated oligonucleotides were attached to the NPs through a biotin-streptavidin linkage. A fluorescently labeled oligonucleotide target was then annealed by base-pairing with the biotinylated oligonucleotide. For detection, the target-bound nanoparticles were directed to the surface of a microscope slide using an external magnetic field and visualized using TIRFM.
Figure 1.
Schematic for the assembly, directed immobilization, and single-molecule detection of captured DNA targets by magnetic nanoparticles. 1) The Fe3O4 nanoparticles are prepared by the coprecipitation method. 2) The nanoparticles are treated with APTES to activate the surface. 3) Streptavidin molecules (filled blue square) are conjugated to the surface via the EDAC-mediated coupling reaction. 4) The DNA recognition site is attached through a biotin-streptavidin linkage (biotin is indicated by a filled yellow circle). 5) The dye-labeled target DNA is captured by hybridization. The Cy3 dye is shown as a filled green circle. 6) The nanoparticle assembly is added to the flow chamber, and a magnet is applied to attract the nanoparticles to the BSA-biotin-treated surface, thus reducing the search volume. 7) The immobilized nanoparticles are detected by single-molecule TIRFM. 8) Within a single field of view, the fluorescence signals from individual molecules are acquired. The inset shows the time trace for the indicated molecule. The stepwise decrease in fluorescence corresponds to dye photobleaching.
Characterization and surface modification of Fe3O4 nanoparticles
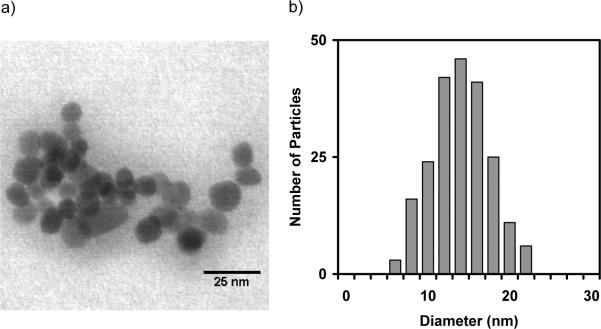
For characterization, the chemically precipitated Fe3O4 NPs were imaged by STEM, and their average diameter was measured to be 13.9 ± 7.9 nm (Figure 2). The surfaces of the NPs were initially modified by treatment with 3-aminopropyltriethoxysilane (APTES) to make amino groups available on the nanoparticle surface. To biofunctionalize the NPs, the crosslinking carbodiimide EDAC was added with the streptavidin solution to facilitate direct conjugation of the streptavidin molecules to the amine-coated surface of the APTES-NPs. The protein assay of the supernatant following the biofunctionalization reaction indicated that 5 mg of NPs depleted approximately 1 nmol of streptavidin from the reaction supernatant. Using the average NP diameter to estimate the NP concentration, the mole ratio of streptavidin/NP was 1.5, indicating that the NPs were conjugated with an average of 1 – 2 streptavidin molecules.
Figure 2.
STEM characterization of the Fe3O4 nanoparticles. a) An STEM image of unmodified nanoparticles. b) Size distribution of the nanoparticles (N = 217). The histogram was fit with a unimodal Gaussian distribution (diameter = 13.9 nm, σ = 7.4 nm, R2 = 0.9933).
Depletion assays to monitor DNA binding
The functionality of the streptavidin-conjugated NPs was tested by measuring the binding of a biotinylated oligonucleotide by the streptavidin-NPs. The streptavidin-NPs were incubated with biotinylated DNA oligonucleotides, and the binding was tracked using a depletion assay, as binding to the streptavidin-NPs resulted in a decrease in the DNA concentration of the supernatant. This DNA concentration was measured by A260 readings of the supernatant following magnetic pelleting of the NPs. Within five min, the DNA concentration of the supernatant was reduced from 2.0 μM to 0.8 μM, and this 60% reduction in the supernatant DNA concentration reflects the amount of DNA that was precipitated with the NPs due to binding (Figure 3). After an hour, the percentage of DNA bound to the NPs was 70%, corresponding to 1.4 μM from the solution. Nonbiotinylated oligonucleotides were used in a control reaction to establish whether DNA binding to the NPs occurred through biotin-streptavidin linkages or instead through nonspecific adsorption to the NPs. The depletion of the non-biotinylated oligonucleotides to the NPs was very low, less than 0.2 μM after one hour. Thus, the streptavidin molecules remained functional after conjugation to the NPs and were binding the biotinylated DNA oligonucleotides primarily through biotin-streptavidin linkages.
Figure 3.
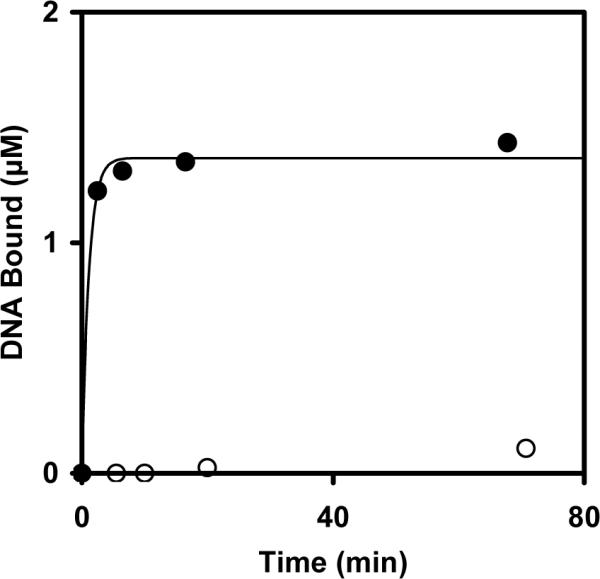
Time course for binding of the biotinylated oligonucleotides (filled circles) and non-biotinylated oligonucleotides (open circles) by the streptavidin-conjugated nanoparticles as monitored by the depletion assay. The data were fit with a single exponential (solid line), y(t) = A(1-exp−kt), giving 0.9 min−1 as a lower limit for the rate constant of biotin-streptavidin binding.
The single-stranded DNA oligonucleotide linked to the NP provides a sequence-dependent binding site to capture targeted complementary DNAs through base pairing. To test the ability of the NP complex to capture sequence-specific oligonucleotides by hybridization, the NP complexes were incubated with a 5' Cy3-labeled oligonucleotide that was complementary to the DNA bound to the NPs. The absorbance of the supernatant at 545 nm was measured at various time points to follow the depletion of the complementary Cy3-labeled oligonucleotides from the supernatant by hybridization to the DNA-NPs. The DNA-NP complexes depleted 0.9 μM of 1 μM complementary DNA (Figure 4). When incubated with a mixture of Cy3-labeled, complementary and unlabeled, noncomplementary DNA oligonucleotides of equal length (26 nt), the complementary DNA concentration was similarly reduced (~0.9 μM of 1 μM) based on the A545 measurements. The A260 measurements showed that ~45% of the total DNA was depleted, which is equivalent to the amount of complementary DNA depleted according to the A545 data, and indicates that the noncomplementary DNA was at most marginally depleted (data not shown). This result indicates that the DNA-NP can capture the targeted oligonucleotides through base pairing. The single-stranded oligonucleotide that is linked to the NP represents a customizable binding site for targeting sequence-specific single-stranded DNA.
Figure 4.
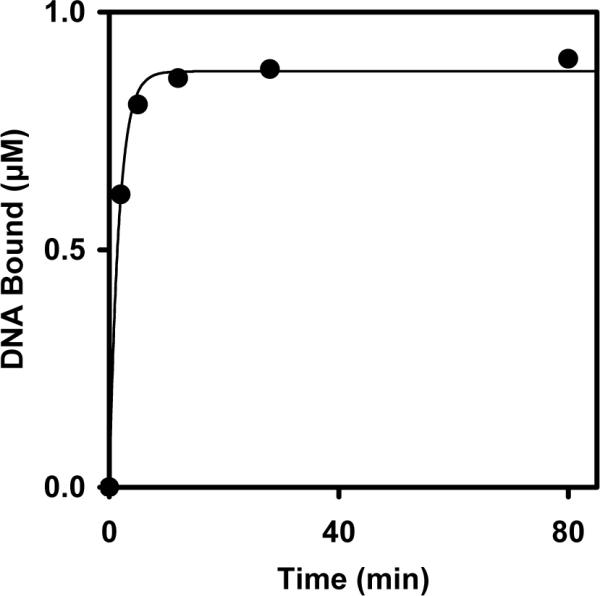
Time course for capture of the Cy3-labeled, complementary oligonucleotides by hybridization to the DNA-NPs. The data were fit with a single exponential (solid line). The observed rate constant for DNA hybridization was 0.6 min−1.
Single-molecule detection using directed oligonucleotide immobilization
The response of the superparamagnetic nanoparticles to external magnetic fields can be used to enhance the immobilization efficiency by localizing them near the surface where the binding sites are located. For the directed immobilization experiments, the flow chambers were pretreated with denatured biotinylated BSA. Prior to assembly of the flow chambers, the quartz slides were rigorously cleaned to reduce the background (see Methods). A magnet was placed on the opposite side of the surface to be imaged, creating a defined magnetized region. The DNA-NP complexes, isolated by magnetic retrieval from the previous incubation, were pipetted into the magnetized flow chamber. A magnetic field was applied orthogonal to the flow direction, with the expectation that the magnetic moments of the nanoparticles would become aligned with the field (37, 38), causing the nanoparticles to move in solution toward the microscope slide where they could be retained by formation of a stable complex between the conjugated streptavidin and biotin immobilized on the slide surface (see Fig. 1). Unbound nanoparticles were washed out from the flow chamber, and then fluorescence signals from the immobilized molecules were collected upon 532-nm excitation using wide-field TIRFM (see Panel 8 in Fig. 1). Figure 5 shows a representative time trace for the Cy3 fluorescence intensity from an immobilized DNANP complex. The Cy3 fluorescence from the observed molecules gives a strong signal, more than seven-fold greater than the background noise. The time trace exhibits a single stepwise decrease in the intensity, which corresponds to the photobleaching of a single Cy3 dye. The number of photobleaching steps per detected molecule serves as a readout for the number of dye-labeled oligonucleotides per immobilized NP. Further analysis, described below, showed that single-step photobleaching occurred for nearly all of the observed molecules, indicating that most of the NPs were bound to a single Cy3-labeled oligonucleotide.
Figure 5.
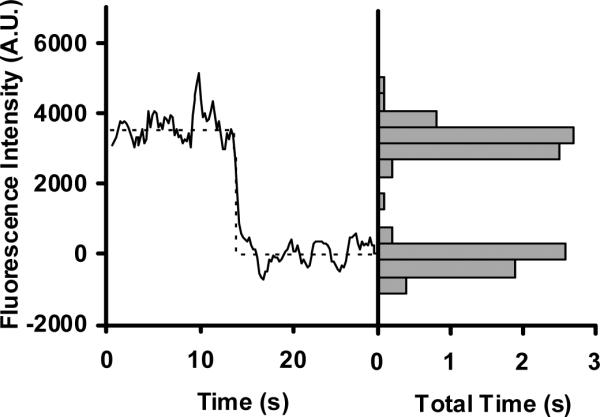
A representative time trace and intensity distribution for the Cy3 intensity of a single NP-immobilized oligonucleotide. The single-step decrease in intensity corresponds to the photobleaching of a single Cy3 dye. The histogram on the right shows the total time distribution of the intensities from the trace. The number of instances for each intensity bin was converted to total time by multiplying the number of instances by the frame capture time (100 ms). Two well-separated populations that correspond to the fluorescent and photobleached states are observed. The fluorescence intensity is shown in arbitrary units (A.U.).
The effect of the magnetization area on the number density (the number of observed molecules per field of view) was investigated by varying the size of the magnetization area (1 cm2 – 0.08 cm2) by using magnets with different cross-sectional areas (Table 2). The expectation was that the number density would increase as the magnet area was reduced because more NPs would be attracted to a smaller area. For an oligonucleotide concentration of 10 fM, 8 dye-labeled molecules were expected to be immobilized within each field of view, based on a model in which all of the NP complexes were uniformly distributed over a magnetized area of 1 cm2 and included the background that was determined as the average number of fluorescent `spots' in the absence of Cy3-labeled oligonucleotide. Indeed, the number detected per field of view was 5 ± 2, similar to the expected value. Reducing the area of the magnetized region to 0.08 cm2 increased the expected number density to 49, and the detected number of immobilized DNA-NP complexes was 59 ± 15. Thus, the average number density of detected complexes was responsive to the size of the magnetized region and agrees well with the calculated values based on a uniform distribution model.
Table 2.
The effect of the magnetization area on the immobilization efficiency.
| Concentration (fM) | 10 | 10 | 10 |
| Volume (μL) | 25 | 25 | 25 |
| Magnetization area (cm2) | 1 | 0.2 | |
| Expected number density | 8 | 27 | |
| Measured number densitya ± s.d. | 5 ± 2 | 32 ± 9 | 59 ± 15 |
Number density is the average number of detected molecules per field of view (n = 7 – 10).
The expected number density was determined from the ratio of the total number of added dye-labeled oligonucleotides to the number of fields of view within the magnetized area.
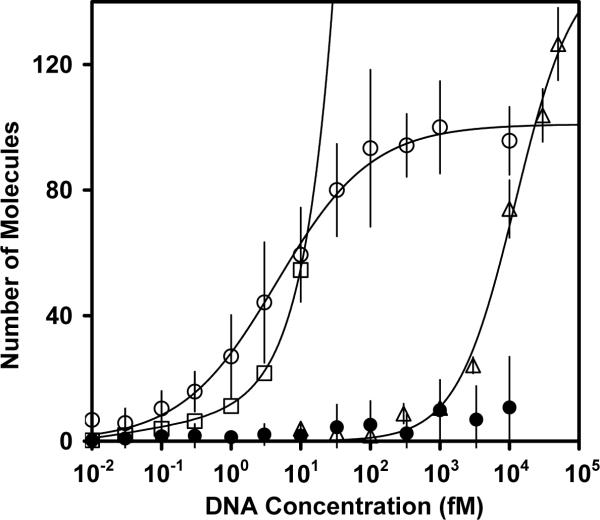
The number of detected molecules exhibiting single-step photobleaching or a fluorescence signal consistent with a single Cy3 dye was counted for several fields of view from 10 aM – 10 pM (Figure 6). To determine the detection limit, we measured the background by incubating the NP-DNA with non-complementary target DNA labeled with Cy3 dye. The number of detected molecules per field was collected over the same range of concentrations. This background value then includes non-specific interactions of any free DNA with the surface or with the magnetized nanoparticles, as well as unrelated background fluorescence present on the microscope slide. The number of detected complexes exceeded the average background value plus three standard deviations at a concentration of 100 aM (with Student's t-test p value of 0.004), and this value therefore represents the concentration detection limit (39). Using the expected detection values based on the uniform distribution model, the predicted concentration detection limit was 1000 – 3000 aM. The decreased detection limit, even modestly beyond this calculated value, could be a result of the non-uniform distribution of the nanoparticles across the magnetized region, with a higher number density of nanoparticles at the front of the magnetized region due to the average velocity towards the surface being greater than the flow velocity.
Figure 6.
The surface-binding curves for the directed and passive immobilization of different concentrations of Cy3-labeled oligonucleotides. The nanoparticles directed to the biotin-BSA surface by a constant magnetic field and immobilized are shown as open circles. The passively immobilized biotinylated oligonucleotides that were allowed to incubate for 30' are shown as open triangles. At each concentration, 7 – 10 fields of view were imaged. The open squares show the expected number of molecules based on a uniform distribution model. The filled circles show the average number of background counts and errors bars corresponding to the three standard deviations. The background was measured for nanoparticles incubated with a non-complementary Cy3-labeled oligonucleotide over the full range of DNA concentrations. The experimental data were best fit with the Sips model, giving parameters for directed immobilization of K = 4.48 fM, n = 0.63, R2 = 0.994, and for passive immobilization of K = 11.4 pM, n = 1.05, R2 = 0.993.
With higher concentrations of DNA-NP, the signal continued to increase with concentration up to approximately 100 fM and then reached a plateau. The nanoparticle surface-binding curves were best fit with Sips isotherms (Equation 1), giving a heterogeneity constant of ~ 0.6 and indicating multiple binding modes. The binding data were also fit using single-state and two-state Langmuir isotherms to test for discrete classes of binding states. However, these isotherms gave larger Chi-squared values and were rejected. The multiple binding modes could reflect heterogeneity associated with the surface-immobilized BSA-biotin conjugates or with the streptavidin conjugate on the surface of the nanoparticles.
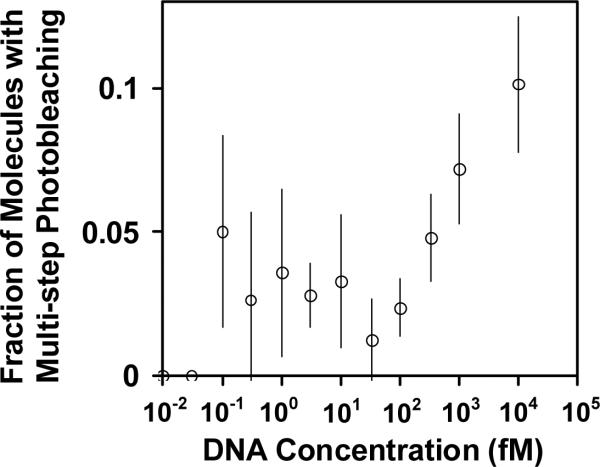
In addition to saturation of the surface binding sites, the plateau could arise from aggregation of the nanoparticles at these concentrations. To consider these two models further, we determined the fractions of the detected particles that exhibited single-step photobleaching across the concentration range. If the plateau arose solely from saturation of the surface sites, then the fraction of detected molecules showing single-step photobleaching would not be expected to change, whereas it would decrease if aggregation occurred. When the entire range of DNA-NP concentrations tested (10 aM – 10 pM) was considered together, approximately 95% of the detected molecules showed single-step photobleaching. For the lowest concentrations, 98% of the traces showed single-step photobleaching, indicating that each observed NP had captured a single Cy3-labeled oligonucleotide and that aggregates were not appreciable. On the other hand, from 100 fM to 10 pM, the fraction of detected molecules showing single-step photobleaching decreased from 97% to 91% (Figure 7). This increase in multi-step photobleaching could originate in part from two immobilized NPs fortuitously binding sufficiently close together that their fluorescence emissions are not spatially resolved, but it most likely also reflects some aggregation of DNA-NPs. This effect does not represent a major limitation of the method, as the primary purpose is to work at very low concentrations where aggregation is insignificant.
Figure 7.
The fraction of detected NPs that show multi-step photobleaching. The increase in multi-step photobleaching with concentration most likely results from limited aggregation of nanoparticles and the increased likelihood of small distances between two or more NPs, such that they are diffraction limited. It is unlikely that these signals represent NPs with multiple Cy3 dyes, because the Cy3-labeled target concentration was limiting during hybridization and the hybridizations were performed under the same concentrations and conditions for all reactions, with dilution to various extents prior to immobilization. In principle, the Cy3-labeled dye could become redistributed after this dilution, but the unwinding of these hybrids is expected to be negligible on the time scale of the experiments.
To evaluate the effects of the directed immobilization on the detection limit, we performed parallel experiments with passive surface immobilization of biotinylated oligonucleotides. The flow chambers were pretreated with denatured biotinylated BSA and streptavidin, and then biotinylated Cy3-labeled DNA oligonucleotides were pipetted into the flow chamber and incubated up to 30 minutes. Here, the surface binding of the oligonucleotides depends on the free diffusion of the molecules to the imaging surface, where they can be immobilized through biotin-streptavidin linkages. The concentration detection limit initially improved with incubation time, from 10 pM with a 1-min incubation to 1 pM with a 5-min incubation. Further increases in incubation time suggested an approach to equilibrium, as a 30-minute incubation gave only a small further decrease in detection limit to 300 fM. At high concentrations, saturation behavior was observed (Fig. 6), and the concentrations required for saturation decreased with incubation time in parallel with the detection limit (data not shown). In contrast to the immobilization behavior of the NPs, the biotinylated DNA molecules that were passively immobilized gave a heterogeneity constant of ~1, indicating homogeneous surface binding.
A comparison of the detection limits with and without the magnetic field-directed localization of NPs reveals a 3,000-fold improvement in the immobilization efficiency compared to freely diffusing oligonucleotides. With the sample volume of 25 μL, a mole detection limit of 2.5 zeptomoles was attained with the directed immobilization method, which corresponds to ~1500 molecules. It is likely that further reductions in the size of the magnetized region would give additional decreases in the detection limit.
To test the general applicability of this method, we performed analogous measurements using commercially available NPs of a similar size (25–30 nm, see Methods). We obtained a limit of detection that was in the same range (1 fM, data not shown). These NPs did require longer incubation times on the slide surface than the synthesized NPs (10 min instead of 1 min) and did not give as low a detection limit, most likely because the commercial NPs have a poly-glucose coating, which would be expected to reduce the magnetization (40 – 42). Nevertheless, the detection limit with these NPs was 100-fold lower than for freely diffusing oligonucleotides, indicating that commercially available NPs can also be used productively with this method.
Conclusions
By conjugating inorganic nanoparticles with functional biomolecules, these complexes can be used to capture targets selectively through biorecognition. The superparamagnetic response of Fe3O4 nanoparticles to external magnetic fields, in combination with the sensitivity of single-molecule fluorescence methods, offers a simple strategy to improve the immobilization efficiency by more than three orders of magnitude, into the zeptomole range. The detection level approaches the copy number of circulating nucleic acids found in plasma and serum samples, which can be used as biomarkers for cancer, tissue injuries, and genetic disorders (43–47). This assay could be extended for the direct detection of unmodified ssDNA or microRNAs by conjugating self-quenching molecular beacons to the NPs, such that hybridization to the sequence-specific target would induce a conformation change that gives a fluorescence signal (48). The ability to detect simultaneously several hundred individual molecules offers the potential to employ multiple excitation and multiple emission wavelengths to detect a range of analytes with zeptomole sensitivity.
Acknowledgments
This work was supported by grants to R.R. from the National Institutes of Health (GM070456) and the Welch Foundation (F-1563) and by a grant to K.W. from the Welch Foundation (F-1699).
Footnotes
Publisher's Disclaimer: This is a PDF file of an unedited manuscript that has been accepted for publication. As a service to our customers we are providing this early version of the manuscript. The manuscript will undergo copyediting, typesetting, and review of the resulting proof before it is published in its final citable form. Please note that during the production process errors may be discovered which could affect the content, and all legal disclaimers that apply to the journal pertain.
References
- 1.Sendriou IE, Gifford LK, Lupták A, Corn RM. Ultrasensitive DNA Microarray Biosensing via in Situ RNA Transcription-Based Amplification and Nanoparticle-Enhanced SPR Imaging. J. Am. Chem. Soc. 2011;133:4271–4273. doi: 10.1021/ja2005576. [DOI] [PMC free article] [PubMed] [Google Scholar]
- 2.Seefeld TH, Zhou W, Corn RM. Rapid Microarray Detection of DNA and Proteins in Microliter Volumes with Surface Plasmon Resonance Imaging Measurements. Langmuir. 2011;27:6534–6540. doi: 10.1021/la200649n. [DOI] [PMC free article] [PubMed] [Google Scholar]
- 3.Ramsay LM, Dickerson JA, Dada O, Dovichi NJ. Femtomolar Concentration Detection Limit and Zeptomole Mass Detection Limit for Protein Separation by Capillary Isoelectric Focusing and Laser-Induced Fluorescence Detection. Anal. Chem. 2009;81:1741–1746. doi: 10.1021/ac8025948. [DOI] [PMC free article] [PubMed] [Google Scholar]
- 4.Hou S, Chen H, Cheng H, Huang C. Development of Zeptomole and Attomolar Detection Sensitivity of Biotin-Peptide Using a Dot-Blot Gold Nanoparticle Immunoassay. Anal. Chem. 2007;79:980–985. doi: 10.1021/ac061507g. [DOI] [PubMed] [Google Scholar]
- 5.Hughes AJ, Herr AE. Quantitative Enzyme Activity Determination with Zeptomole Sensitivity by Microfluidic Gradient-Gel Zymography. Anal. Chem. 2010;82:3803–3811. doi: 10.1021/ac100201z. [DOI] [PubMed] [Google Scholar]
- 6.Ha T. Single-molecule fluorescence resonance energy transfer. Methods. 2001;25:78–86. doi: 10.1006/meth.2001.1217. [DOI] [PubMed] [Google Scholar]
- 7.Alemán EA, Pedini HS, Rueda D. Covalent-Bond-Based Immobilization Approaches for Single-Molecule Fluorescence. ChemBioChem. 2009;10:2862–2866. doi: 10.1002/cbic.200900640. [DOI] [PMC free article] [PubMed] [Google Scholar]
- 8.Best MD. Click Chemistry and Bioorthogonal Reactions: Unprecedented Selectivity in the labeling of Biological Molecules. Biochemistry. 2009;48:6571–6584. doi: 10.1021/bi9007726. [DOI] [PubMed] [Google Scholar]
- 9.Sui B, Li L, Li L, Jin W. An ultra-sensitive DNA assay based on single-molecule detection coupled with hybridization accumulation and its application. Analyst. 2011;136:3950–3955. doi: 10.1039/c1an15405b. [DOI] [PubMed] [Google Scholar]
- 10.Neely LA, Patel S, Garver J, Gallo M, Hackett M, McLaughlin S, Nadel M, Harris J, Gullans S, Rooke J. A single-molecule method for the quantitation of microRNAs gene expression. Nature Method. 2005;3:41–46. doi: 10.1038/nmeth825. [DOI] [PubMed] [Google Scholar]
- 11.Chemla YR, Grossman HL, Poon Y, McDermott R, Stevens R, Alper MD, Clarke J. Ultrasensitive magnetic biosensor for homogeneous immunoassay. Proc. Natl. Acad. Sci. U.S.A. 2000;97:14268–14272. doi: 10.1073/pnas.97.26.14268. [DOI] [PMC free article] [PubMed] [Google Scholar]
- 12.Ravindranath SP, Mauer LJ, Deb-Roy C, Irudayaraj J. Biofunctionalized magnetic nanoparticle integrated mid-infrared pathogen sensor for food matrixes. Anal. Chem. 2009;81:2840–2846. doi: 10.1021/ac802158y. [DOI] [PubMed] [Google Scholar]
- 13.Wang J, Munir A, Zhu Z, Zhou HS. Magnetic Nanoparticle Enhanced Surface Plasmon Resonance Sensing and Its Application for the Ultrasensitive Detection of Magnetic Nanoparticle-Enriched Small Molecules. Anal. Chem. 2010;82:6782–6789. doi: 10.1021/ac100812c. [DOI] [PubMed] [Google Scholar]
- 14.Jie G, Wang L, Yuan J, Zhang S. Versatile Electrochemiluminescence Assays for Cancer Cells Based on Dendrimer/CdSe-ZnS-Quantum Dot Nanoclusters. Anal. Chem. 2011;83:3873–3880. doi: 10.1021/ac200383z. [DOI] [PubMed] [Google Scholar]
- 15.Singh A, Dilnawaz F, Sahoo SK. Long circulating lectin conjugated paclitaxel loaded magnetic nanoparticles: a new theranostic avenue for leukemia therapy. PLoS One. 2011;6:e26803. doi: 10.1371/journal.pone.0026803. [DOI] [PMC free article] [PubMed] [Google Scholar]
- 16.Schroeder A, Heller DA, Winslow MW, Dahlman JE, Pratt GW, Langer R, Jacks T, Anderson DG. Treating metastatic cancer with nanotechnology. Nat. Rev. Cancer. 2012;12:39–50. doi: 10.1038/nrc3180. [DOI] [PubMed] [Google Scholar]
- 17.Hu J, Qian Y, Wang X, Liu T, Liu S. Drug-Loaded and Superparamagnetic Iron Oxide Nanoparticle Surface-Embedded Amphiphilic Block Copolymer Micelles for Integrated Chemotherapeutic Drug Delivery and MR Imaging. Langmuir. 2012;31:2073–2082. doi: 10.1021/la203992q. [DOI] [PubMed] [Google Scholar]
- 18.Bao J, Chen W, Liu T, Jin P, Wang L, Liu J, Wei Y, Li Y. Bifunctional AuFe3O4 Nanoparticles for Protein Separation. ACS Nano. 2007;1:293–298. doi: 10.1021/nn700189h. [DOI] [PubMed] [Google Scholar]
- 19.Park HY, Schadt MJ, Wang L, Lim II, Nioki PN, Kim SH, Jang MY, Luo J, Zhong CJ. Fabrication of magnetic core@shell Fe oxide@Au nanoparticles for interfacial bioactivity and bio-separation. Langmuir. 2007;23:9050–9056. doi: 10.1021/la701305f. [DOI] [PubMed] [Google Scholar]
- 20.Beveridge JS, Stephens JR, Latham AH, Williams ME. Differential magnetic catch and release: analysis and separation of magnetic nanoparticles. Anal. Chem. 2009;81:9618–9624. doi: 10.1021/ac9016456. [DOI] [PubMed] [Google Scholar]
- 21.Dubus S, Gravel J, Le Drogoff B, Nobert P, Veres T, Boudreau D. PCR-free DNA Detection Using a Magnetic Bead-Supported Polymeric Transducer and Microelectromagnetic Traps. Anal. Chem. 2006;78:4457–4464. doi: 10.1021/ac060486n. [DOI] [PubMed] [Google Scholar]
- 22.Barbee KD, Huang X. Magnetic Assembly of High-Density DNA Arrays for Genomic Analyses. Anal. Chem. 2008;80:2149–2154. doi: 10.1021/ac702192y. [DOI] [PMC free article] [PubMed] [Google Scholar]
- 23.Loaiza OA, Jubete E, Ochoteco E, Cabañero G, Grande H, Rodríguez J. Gold-coated ferric oxide nanoparticles based disposable magnetic geosensors for the detection of DNA hybridization processes. Biosensors and Bioelectronics. 2011;26:2194–2200. doi: 10.1016/j.bios.2010.09.034. [DOI] [PubMed] [Google Scholar]
- 24.Thomson DAC, Dimitrov K, Cooper MA. Amplification-free detection of herpes simplex virus DNA. Analyst. 2011;136:1599–1607. doi: 10.1039/c0an01021a. [DOI] [PubMed] [Google Scholar]
- 25.Shlyapnikov YM, Shylapnikova EA, Morozova TY, Beletsky IP, Morozov VN. Detection of microarray-hybridized oligonucleotides with magnetic beads. Anal. Biochem. 2010;399:125–131. doi: 10.1016/j.ab.2009.12.030. [DOI] [PubMed] [Google Scholar]
- 26.Wang Y, Dostalek J, Knoll W. Magnetic nanoparticle-enhanced biosensor based on grating-coupled surface plasmon resonance. Anal. Chem. 2011;83:6202–6207. doi: 10.1021/ac200751s. [DOI] [PubMed] [Google Scholar]
- 27.Wang Z, Wang X, Liu S, Yin J, Wang H. Fluorescently imaged particle counting immunoassay for sensitive detection of DNA modifications. Anal. Chem. 2010;82:9901–9908. doi: 10.1021/ac102416f. [DOI] [PubMed] [Google Scholar]
- 28.Zhang H, Harpster MH, Wilson WC, Johnson PA. Surface-enhanced Raman scattering detection of DNAs derived from virus genomes using Au-coated paramagnetic nanoparticles. Langmuir. 2012;28:4030–4037. doi: 10.1021/la204890t. [DOI] [PubMed] [Google Scholar]
- 29.Kan C, Rivnak AJ, Campbell TG, Piech T, Rissin DM, Mosl M, Peterca A, Niederberger H, Minnehan KA, Purvish PP, Ferrell EP, Meyer RE, Chang L, Wilson DH, Fournier DR, Duffy DC. Isolation and detection of single molecules on paramagnetic beads using sequential fluid flows in microfabricated polymer array assemblies. Lab Chip. 2012;12:977–985. doi: 10.1039/c2lc20744c. [DOI] [PubMed] [Google Scholar]
- 30.Laschi S, Miranda-Castro R, Gonzalez-Fernandez E, Palchetti I, Raymond F, Rossier JS, Marrazza G. A new gravity-driven microfluidic-based electrochemical assay coupled to magnetic beads for nucleic acid detection. Electrophoresis. 2010;31:3727–3736. doi: 10.1002/elps.201000288. [DOI] [PubMed] [Google Scholar]
- 31.Alberts B, Johnson A, Lewis J, Raff M, Roberts K, Walter P. Molecular Biology of the Cell. 4th edition Garland Science; New York: 2002. [Google Scholar]
- 32.Kouassi GK, Irudayaraj J. Magnetic and Gold-Coated Magnetic Nanoparticles as a DNA Sensor. Anal. Chem. 2006;78:3234–3241. doi: 10.1021/ac051621j. [DOI] [PubMed] [Google Scholar]
- 33.Kim DK, Zhang Y, Voit W, Rao KV, Muhammed M. Synthesis and characterization of surfactant-coated superparamagnetic monodispersed iron oxide nanoparticles. Journal of Magnetism and Magnetic Materials. 2001;225:30–36. [Google Scholar]
- 34.Shen Xing-Can, Fang Xiu-Zhong, Zhou Ying-Hua, Liang Hong. Synthesis and Characterization of 3-Aminopropyltriethoxysilane-Modified Superparamagnetic Magnetite Nanoparticles. Chemistry Letters. 2004;33:1468–1469. [Google Scholar]
- 35.Bruce IJ, Sen T. Surface Modifications of Magnetic Nanoparticles with Alkoxysilanes and Their Applications in Magnetic Bioseparations. Langmuir. 2005;21:7029–7035. doi: 10.1021/la050553t. [DOI] [PubMed] [Google Scholar]
- 36.Burden CJ, Pittelkow YE, Wilson SR. Statistical analysis of adsorption models for oligonucleotide microarrays. Statistical Applications in Genetics and Molecular Biology. 2004;3 doi: 10.2202/1544-6115.1095. Article 35. [DOI] [PubMed] [Google Scholar]
- 37.Stephens JR, Beveridge JS, Williams ME. Analytical methods for separating and isolating magnetic nanoparticles. Phys. Chem. Chem. Phys. 2012;14:3280–3289. doi: 10.1039/c2cp22982j. [DOI] [PubMed] [Google Scholar]
- 38.Frey N, Peng S, Cheng K, Sun S. Magnetic nanoparticles: synthesis, functionalization, and applications in bioimaging and magnetic energy storage. Chem. Soc. Rev. 2009;38:2532–2542. doi: 10.1039/b815548h. [DOI] [PMC free article] [PubMed] [Google Scholar]
- 39.IUPAC . In: Compendium of Chemical Terminology. 2nd ed. McNaught AD, Wilkinson A, editors. Blackwell Scientific Publications; Oxford: 1997. [Google Scholar]
- 40.Choi H, Choi SR, Zhou R, Kung HF, Chen I.-Wei. Iron oxide nanoparticles as magnetic resonance contrast agent for tumor imaging via folate receptor-targeted delivery. Academic Radiology. 2004;11:996–1004. doi: 10.1016/j.acra.2004.04.018. [DOI] [PubMed] [Google Scholar]
- 41.Bautista MC, Bomati-Miguel O, Zhao X, Morales MP, González-Carreño T, Pérez de Alejo R, Ruiz-Cabello J, Veintemillas-Verdaguer S. Comparative study of ferrofluids based on dextran-coated iron oxide and metal nanoparticles for contrast agents in magnetic resonance imaging. Nanotechnology. 2004;15:154–159. [Google Scholar]
- 42.Jianga W, Yang HC, Yang SY, Horng HE, Hung JC, Chen YC, Hong C. Preparation and properties of superparamagneticnanoparticles with narrow size distribution and biocompatible. Journal of Magnetism and Magnetic Materials. 2001;225:41–46. [Google Scholar]
- 43.Lu J, Getz G, Miska EA, Alvarez-Saavedra E, Lamb J, Peck D, Sweet-Cordero A, Ebert BL, Mak RH, Ferrando AA, Downing JR, Jacks T, Horvitz HR, Golub TR. MicroRNA expression profiles classify human cancers. Nature. 2005;435:834–838. doi: 10.1038/nature03702. [DOI] [PubMed] [Google Scholar]
- 44.Mitchell PS, Parkin RK, Kroh EM, Fritz BR, Wyman SK, Pogosova-Agadjanyan EL, Peterson A, Noteboom J, O'Briant KC, Allen A, Lin DW, Urban N, Drescher CW, Knudsen BS, Stirewalt DL, Gentleman R, Vessella RL, Nelson PS, Martin DB, Tewari M. Circulating microRNAs as stable blood-based markers for cancer detection. Proc. Natl. Acad. Sci. U.S.A. 2008;105:10513–10519. doi: 10.1073/pnas.0804549105. [DOI] [PMC free article] [PubMed] [Google Scholar]
- 45.Wang K, Zhang S, Marzolf B, Troisch P, Brightman A, Hu Z, Hood LE, Galas DJ. Circulating microRNAs, potential biomarkers for drug-induced liver injury. Proc. Natl. Acad. Sci. U.S.A. 2009;106:4402–4407. doi: 10.1073/pnas.0813371106. [DOI] [PMC free article] [PubMed] [Google Scholar]
- 46.Schwarzenbach H, Hoon DSB, Pantel K. Cell-free nucleic acids as biomarkers in cancer patients. Nat. Rev. Cancer. 2011;11:426–437. doi: 10.1038/nrc3066. [DOI] [PubMed] [Google Scholar]
- 47.Hui L, Bianchi DW. Cell-free fetal nucleic acids in amniotic fluid. Human Reproduction Update. 2011;17:362–371. doi: 10.1093/humupd/dmq049. [DOI] [PMC free article] [PubMed] [Google Scholar]
- 48.Tyagi S, Kramer FR. Molecular Beacons: Probes the Fluoresce upon Hybridization. Nat. Biotechnol. 1996;14:303–308. doi: 10.1038/nbt0396-303. [DOI] [PubMed] [Google Scholar]


