Abstract
A model of synaptic and extra-synaptic excitatory signaling in the hippocampus is presented. The model is used to analytically evaluate the potential contributions of homosynaptic and heterosynaptic glutamate spill-over to receptor signaling during an electrophysiological experiment in which glutamate transporters are pharmacologically blocked. Inhibition of glutamate uptake selectively prolongs the decay kinetics of the second field excitatory post-synaptic potential evoked by paired pulse stimulation of Schaffer collateral axons in area CA1. The model includes AMPA and NMDA glutamate receptors, and the removal of glutamate by transporters and diffusion. We establish analytically that the prolongation cannot be caused by local effects, i.e., the transporters acting within or near the synapse. In contrast, a time profile of glutamate consistent with spill-over from adjacent synapses can explain the effect. The different reaction kinetics of AMPA and NMDA receptors have a significant role in reproducing the experimental results, as explained by analysis of the ODEs governing the reactions.
Keywords: neurotransmitter spill-over, hippocampus, NMDA receptors, AMPA receptors, glutamate transporters
1. Introduction
The hippocampal region of the brain is believed to play a major role in information storage, and understanding its structure and function is central to understanding mechanisms of memory and learning. The hippocampus is organized in layers of pyramidal neurons, and the connectivity of different cells has been partially mapped. In particular, principal neurons in the part of the hippocampus called CA3 send long axonal processes (Schaffer collaterals) to synapse on dendrites of pyramidal cells and interneurons in the CA1 region. But morphological connectivity of these neurons only partly determines the characteristics of neural networks. The actual functional connectivity must be flexible, i.e. have time dependent features, for information processing such as memory and learning to occur. In part, this flexibility is obtained through long and short term synaptic plasticity, and possibly variable connectivity through synaptic spill-over of neurotransmitter in particular conditions.
Early studies of spill-over in the neuromuscular junction showed a slowed decay of synaptic current when acetylcholinesterase was blocked, evidence of prolonged acetylcholine presence ([14],[22]). In contrast to acetylcholine, the actions of most other neurotransmitters are terminated by reuptake mediated by plasma membrane transporters. Reviews of experimental results relating to synaptic spill-over and the role of neurotransmitter transporters can be found in Barbour and Hausser [4], Kullman and Aztely [18], Holmseth, et al. [10], Atwell and Gibb [2], and Tizingounis and Wadiche [35]. Spillover has been presented as an explanation of prolongation of decay of inhibitory post-synaptic currents (IPSCs) when GABA uptake is blocked in hippocampal inhibitory synaptic currents (Isaacson et al. 1993), while in the cerebellum, compound parallel fibre-Purkinje cell excitatory synaptic currents show delayed decay that could be explained by spill-over ([27],[19]). Also in the cerebellum, spill-over of glutamate is inferred at the cerebellar mossy fiber-granule cell connection in DiGregorio et al. [13]. In the hippocampus, evidence for spill-over at excitatory synapses is presented in, for example, Arnth-Jensen et al. [1], Vogt and Nicoll [38], Asztely et al. [3], Lozovaya et al. [21], Tsukada et al.[34], and Diamond [11]. The action of neurotransmitter transporters is key in many of these studies, since the inhibition of these transporters can lead to excess neurotransmitter in the extracellular space. More recent studies of this phenomenon include Scimemi et al. [30] and Sun et al. [32]. An overview of glutamate spill-over and transporter action is given in Diamond [12].
Recently, it has been reported that spill-over from climbing fibers onto glutamate receptors on interneurons in the cerebellum may be a central mechanism of activation at this unique connection (Szapiro and Barbour [33]). Technological advances, such as glutamate sensing fluorescent reporters, have been developed to directly detect concentrations of gluta-mate in extra-synaptic spaces. In Hires et al. [15], these are used to measure the time course of glutamate propagation after synaptic release. Here they demonstrate that submicromolar glutamate persists along dendritic surfaces for hundreds of milliseconds, and depends upon coordination of release from adjacent sites. In a similar vein, Okubo et al. ([24],for a review see [25]) have developed another type of fluorescent glutamate indicator that allows for the detection of glutamate in intact brain tissue. The family of indicators, dubbed EOS (Excitatory Optical Sensor) are used to study glutamate dynamics in intact brain structures. This imaging method has been used to visualize the release of extra-synaptic glutamate adjacent to excitatory synapses at the parallel fiber-Pukinje cell synapse. A quantitative measurement of the time dependent spread of glutamate with this method remains problematic, because the kinetics of the EOS are slow compared to that of relevant physiological processes, reading the signal from the response of the indicator involves a deconvolution step. We note, also, that as of yet, it is not possible to directly resolve the time course of glutamate within a synaptic cleft.
There has been a parallel effort in the mathematical modeling of spill-over in many of these experiments. In Barbour and Hausser [4], a simple model of inter-synaptic diffusion of neurotransmitter is constructed, to predict the likelihood of activation of nearby sites, referred to as “crosstalk”. A more complex model is developed in Rusakov and Kullman [29], including three dimensional details of the neuropil, and other factors affecting glutamate diffusion, in order to create a spatiotemporal profile of glutamate in the extra-synaptic space and its effect upon receptors. Large scale Monte Carlo modeling of neurotransmitter release and receptor activation in physiologically realistic simulations of neuropil was pioneered by Sejnowski and his group (see http://www.mcell.cnl.salk.edu). In Sejnowski et al [7], there is an example of such a study that addresses glutamate spill-over at the ciliary ganglion synapse. In Mitchell et al. [23], glutamate spill-over at the cerebellar mossy fiber-granule cell synapse was modeled by combining glutamate diffusion models (in restricted fractional two and three dimensional spaces) with probabilistic models of receptor activation. The effect of glutamate transporters on signal transmission in the CA1 region of the hippocampus was recently analyzed with a Monte Carlo model of a typical synaptic environment in Zheng et al. [40]. This work incorporates an estimate of diffusion made in situ with a two-photon excitation technique.
Glutamate transporters, known as excitatory amino acid transporters, or EAATs, are transmembrane proteins that bind free glutamate in the extracellular space and actively move it to the intercellular side of the membrane, a process that involves the binding and transport of other ions in a complex cascade (see ([39], [26]) for more details). Three major subtypes of EAATs in the central nervous system are expressed in the forebrain on both astrocytes (glial: EAAT1 and EAAT2), and neurons (neuronal: EAAT3). In general they regulate glutamate homeostasis by taking up synaptically released transmitter, and are speculated to shape glutamate receptor dynamics during synaptic transmission. The role of neuronal and glial transporters in controlling receptor dynamics can be investigated through the use of glutamate uptake inhibitors. The glutamate uptake blocker DL-TBOA, blocks both neuronal and glial transporters, and a newer transport blocker, L-threo-beta-benzylaspartate, L-TBA, exhibits a slight selectivity for EAAT3 over both EAAT1 and EAAT2. A recent paper by Sun et al. [32], studies the characteristics of L-TBA in detail.
The exact role of the neuronal and glial transporters a subject of current debate. Recent experimental evidence suggests that the density of transporter molecules in hippocampal tissue is lower than originally thought, raising the question of how so few can affect the signaling characteristics of the receptors at the synapses so significantly [10]. The amount of glutamate released itself is debated, with estimates as low as 500 molecules, for instance see [37], who fitted a 3-D glutamate diffusion model to data from patch clamp mossy fiber terminal-CA3 pyramidal cell synapse experiment [17]. In the synapses we will be considering, it is generally accepted that the number is 3000-5000 molecules per vesicle ([4],[6], [28]) and that upon stimulation generally a single vesicle is released.
In this paper we study spill-over phenomena in glutamatergic synapses, specifically in the CA1 region of the hippocampus. In particular, the action of glutamate transporters to limit spill-over, as reported by Diamond [11],[30], and Arnth-Jensen [1], is examined from a modeling perspective. Diamond infers the presence of spill-over from the response of receptors that are pharmacologically blocked by a low affinity competitive antagonist. The effect of the blocker on the measured signal depends on the local concentration of glutamate, having a larger effect when lower concentrations of glutamate are present. Hence, the fact that it blocks the slow component of the signal to a greater degree than the fast component, implies that the slow component is a response to lower concentrations of glutamate. He also found that simultaneously blocking neuronal glutamate transporters increases the activation of receptors responding to low concentrations of glutamate, indicating that the low concentrations of glutamate are normally removed by the transporters. Mechanistically speaking, transporters appear to “clean up” after a release of glutamate molecules, preventing the occurrence of spill-over. Here we use a formal mathematical approach to gain insight into the spatial scales of transporter actions in limiting spill-over. To do so we model electrophysiological experiments in hippocampal slices that utilize the glutamate uptake inhibitor L-TBA.
Both transporter and receptor function are thought to be important in plasticity effects, where neurons are more or less sensitive to stimuli dependent on their previous firing history. To investigate short term synaptic plasticity, experiments are carried out in which a series of electrical stimuli are delivered to axon fibers, while the response (voltage change) is measured in the dendrites of the cells on the receiving side. Two equal impulses, delivered in quick succession, can generate either a short lived increase in the response (paired pulse facilitation) or decrease (paired pulse depression), depending on brain region/synapse and inter-pulse interval. These short term changes are mechanistically distinct from long-term potentiation and depression, phenomena that may underlie more permanent forms of memory storage In each case, however, neurons exhibit responses that are sensitive to the history of stimulation previously received.
In the experiments we model in this paper, paired pulse facilitation in rodent hippocampal slices is used to study the phenomenon of spill-over. Upon stimulation with a second, equal amplitude pulse, the probability of release of neurotransmitter is increased, which causes more synapses to release vesicles of glutamate into the synaptic cleft, so more glutamate is released overall in the slice. Transporter molecules will normally pick up any excess of glutamate, but when they are inhibited by a pharmacological blocker, a prolongation of the response is seen upon the second pulse [11]. This is presumed to be the effect of neurotransmitter leaking away from active sites and stimulating receptors at adjacent synapses or extra-synaptic regions. The evidence for this is indirect, since, as mentioned above, the concentration of glutamate within the cleft, and in many cases, outside the cleft, cannot be directly measured. Even though the amount of glutamate per vesicle (and hence per synapse) is small, if many postsynaptic densities are stimulated, and transporters are inhibited, spill-over of neurotransmitter could be significant.
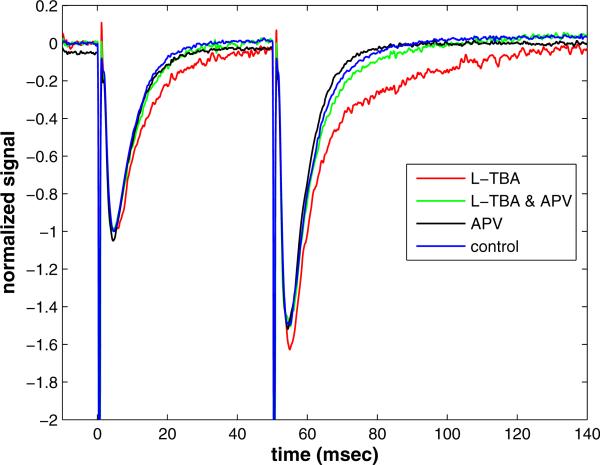
The experimental data presented in figure 1 are recordings of the effect of electrical stimulation of transverse hippocampal slices (350 μm) from CD1 mice of 3-5 weeks of age. Stimuli are delivered to axon fibers arising from pyramidal cells in CA3, while the response is measured in the dendrites of the pyramidal cells of CA1. Recordings were performed at 30 degrees C. Field excitatory postsynaptic potentials (fEPSPs) were evoked by 100 μsecond duration stimuli in stratum radiatum. Stimulus strength (typically 50-100 μA) was adjusted to elicit responses 30-40% of maximum to avoid the occurrence of population spikes (action potentials). A paired pulse stimulation was delivered 50 milliseconds apart, every 20 seconds. The final 5 traces were averaged to arrive at the trace shown for a given experimental protocol. The resulting signal is shown in figure 1 for four different protocols: control, with transporters blocked by L-TBA, with NMDA receptors blocked by APV, and with transporters and NMDA receptors simultaneously blocked.
Figure 1.
The effect of transporter blocker L-threo-β-benzylaspartate (L-TBA) on field EPSP decay kinetics during paired pulse stimulation. The NMDA receptor antagonistic APV almost completely removes the effect.
The following key facts summarize the results of this experiment.
The peak amplitude of the second response is larger presumably due primarily to increased glutamate release probability.
Blocking transporters and/or NMDA receptors does not significantly affect the relative or absolute peak amplitudes.
The rate of decay of the second response is the same as the first if transporters are not blocked.
Blocking transporters creates a marked prolonged decay in the second response.
Blocking NMDA receptors when transporters are also blocked restores the decay rate of the second response to that of the control.
We develop a general model to examine the implications of these facts, especially relative to the local or spatially extended action of released glutamate.
The organization of the paper is as follows. First we outline the physiological processes involved. Then we develop the theoretical model, and mathematically analyze its behavior to arrive at the assertion that something other than local effects near the synapse must be involved. Numerical simulations are next presented to fill in the picture of the dynamics of the receptors. The time profile of leaking glutamate necessary to produce the results of the experiment is determined by fitting the model to the experimental data, guided by physiological estimates of the kinetic parameters of the receptors and transporters. We end with a discussion and summary of the research and its implications, and directions for future work.
2. Model Development
2.1. Physiological Processes
Most electrochemical signaling in the central nervous system is carried out by chemical synapses with transmitter gated ion channels. When an action potential reaches the pre-synaptic terminal of a nerve cell, it causes an elevation in calcium concentration due to the opening of voltage dependent calcium channels. This rise in calcium ultimately triggers the fusion of a vesicle of neurotransmitter molecules with the cell membrane. The neurotransmitter is released into a narrow region (the synaptic cleft) between the presynaptic membrane of the axon and the postsynaptic membrane of the target dendrite. The neurotransmitter can bind to ion channels in the postsynaptic membrane that are gated by the binding of the signalling molecule. The ion channels then open, thus changing the postsynaptic membrane potential and possibly triggering an action potential in the target cell.
Glutamate is the main excitatory neurotransmitter in the central nervous system, and in what follows we describe the components of excitatory glutamatergic signaling.
We consider two types of receptors, named after their synthetic agonists, N-methyl-D-aspartic acid receptor (NMDAR), and α-amino-3-hydroxy-5-methyl-4-isoxazole-propionic acid receptor (AMPAR). Both are glutamate-gated ion channels and as such are transmembrane proteins with binding sites for glutamate on their extracellular side. Both possess two binding sites and require two molecules of glutamate bound for activation. the kinetics of each are different, and AMPARs are thought to possess two desensitized states, while NMDARs have only one.
Re-uptake of neurotransmitter is essential for normal operation of chemical synapses, allowing for recycling of the molecules, and reduction of high levels of neurotransmitter which can cause prolonged receptor activity and excitotoxicity. Rapid clearance of neurotransmitter is also necessary for precision in signalling, and prevents the influence of neurotransmitter on neighboring postsynaptic and extra-synaptic receptors. As described in the introduction, re-uptake is performed by these transporters, the EAATs. In general, transporter function depends on electrochemical gradients of Na+, K+ and H+. They co-transport glutamate with three Na+ ions and one H+, and counter-transport one K+ ion in a thermodynamically coupled manner. For details see Zerangue and Kavanaugh [39].
One possible explanation of the prolongation of the response is the “buffering” of glutamate by transporters within and near the synaptic cleft, thus preventing it from lingering and activating the postsynaptic receptors. If so, a simple model of competition between the receptors and transporters for glutamate should be able to reproduce the observed results. To test this, we propose a “well-stirred” model of the concentrations of the constitutive components: the transporter molecules, the two types of receptor molecules, and free glutamate. This is essentially an “average synapse” model, and assumes the measured signal is a linearly rescaling of the signal produced by the receptors of one synapse. This signal is presumed to be proportional to the concentration of activated receptors at any time. We rely on well established kinetic schemes for each receptor, and assume that the equations for the receptors are linked only through the shared glutamate pool. Glutamate is released in a concentration pulse, and is allowed to diffuse away with a realistic time constant (between 1-5 msec, see Clements et al. [5]).
The reaction mechanisms and rate constants for the activation of AMPAR and NMDAR we use are reviewed in Attwell and Gibb [2], and a schematic is shown in figure 3. Each receptor has binding sites for two glutamate molecules, and can be activated (the ion channel opened) once these are occupied. The activated state is denoted G2N* for NMDAR, and G2A* for AMPAR. Each can also become desensitized, for instance for the NMDAR the desensitized state has two molecules of glutamate bound and is labeled G2DN. AMPAR is thought to possess two desensitized states, with one and two molecules of glutamate bound, GDA and G2DA respectively. This difference is essential in creating a range of dynamic response, allowing for a richer signalling vocabulary in the neuron, a point which is developed more fully in section 3.
Figure 3.
Kinetic scheme for the state transitions of AMPA and NMDA receptors. See the text for more explanation and parameter values.
For the transporters, we assume the simplest possible chemical kinetics. In our model, transporters bind glutamate in the synapse or extracellular space, and in one step move it to the opposite side of the membrane, where it is removed from play. The transporter returns then to its unbound state and is ready to transport another molecule of glutamate. The reaction mechanism is thus
The simulations follow the concentration of receptor and transporter states in stimulated synapses, where 3000 molecules of glutamate are released into a 0.005 μm3 space, so the initial concentration is about 1 mM. We mimic this release of glutamate by adding a term εt2e–γt to the right-hand side of the ODE for the concentration of glutamate [G], which, by itself, generates a sigmoidal type profile of glutamate concentration rising from zero to the amount . This limit is the maximum concentration of glutamate released (1 mM) and once γ is fixed, this determines the value of ε. In the simulations γ = 1.0 msec–1, which, along with the diffusion constant, determines the profile of glutamate concentration of growth and decay. The time to peak and decay can be determined analytically for varying γ and δ, but the expression is cumbersome. For γ = δ = 1.0, however, the solution simplifies to [G](t) = t3exp(–t), which peaks at 3 msec (allowing for some latency between the stimulus time and the observed response) and decays with a rate constant of 1, consistent with the observation that glutamate clears the cleft within the first 5 msec [5]. The peak amount of glutamate concentration experienced by the receptors also depends on δ, with less reaching the receptors on the post-synaptic side of the cleft for larger values of δ.
The total concentration of the receptor molecules is fixed. AMPAR are assumed more numerous (about 80 molecules in a postsynaptic density) than NMDAR (about 25 molecules in a postsynaptic density) [2]. The number of transporter molecules can be adjusted from zero to several thousand, depending on the situation being simulated. These facts are summarized in the following table:
2.2. Model Equations
In this section we present the equations in dimensional form. The complete set can be written:
with initial condition
where
The components of X are the concentrations of the species in the reactions listed in the previous section, e.g. [G], [R], [GR], etc.
Invoking the law of mass action, the ODEs for the AMPAR states are
| (2.1) |
For the NMDAR, the equations describing the evolution of all states are
| (2.2) |
The time evolution of the states of the transporters are given by
| (2.3) |
The concentration of glutamate obeys the following ODE
| (2.4) |
Note that it is this equation that couples all the other chemical species. We add a linear diffusion term, –δ[G], to model the loss of glutamate from the cleft due to diffusion.
2.3. Analysis
In these equations, the receptors and transporters interact only through the shared pool of glutamate, and this imposes a simplifying structure on the phase space. There are four invariant subspaces, namely the NMDAR states + glutamate, the AMPAR states + gluta-mate, the transporter states + glutamate, and the direction representing the concentration of glutamate alone.
There is a conserved quantity in the equations for the transporter, AMPAR and NMDAR subspaces, e.g. the total number of molecules of each species must remain constant. If the reaction is started with glutamate being introduced into a glutamate-free solution, the three conserved quantities are
We can then express the concentration of N, A, T as
The ODEs for [N], [A] and [T ] are thus not needed to compute the full solution, giving a reduction of 15 to 12 dimensions. A further reduction to 11 equations is achieved by noting that the equation for [Gin] can be solved by direct integration once the concentration [TG] is known.
The reduced system possesses a fixed point at [A] = [A](0), [N] = [N](0), [T ] = [T ](0), and the rest of the concentrations set to zero. A linear change of coordinates to shift the origin to this fixed point further simplifies the system. The result is an 11 dimensional set of equations for the concentrations of NMDAR states, AMPAR states, transporter states and glutamate:
| (2.5) |
Following the release of a vesicle of neurotransmitter, modeled by an increase in glutamate concentration, the dynamics of the above system is simple: after an initial peak in the concentration of activated receptors, the diffusion of glutamate results in the decay of the trajectory to the attracting fixed point. In the full 11 dimensional phase space the trajectory follows a path that ultimately collapses on the subspace spanned by the slowest eigendirections of the attracting fixed point. This means that the long term decay rate seen in the response of the receptors is governed by the least negative eigenvalues. To determine the eigenvalues and eigendirections we must linearize the equations about the fixed point. The result can be expressed
where X = ([GA], [G2A], [G2A*], [G2DA], [GDA], [GN], [G2N], [G2N*], [G2DN], [TG], [G])T , and M is the 11×11 coefficient matrix. The invariant subspaces are evident in M, see table III.
Table III.
Coefficient matrix M for the linear system
| GA | G 2 A | G2A* | G 2 DA | GDA | GN | G 2 N | G2N* | G 2 DN | TG | G |
|---|---|---|---|---|---|---|---|---|---|---|
| –(k–1 + kd2) | k –2 | 0 | 0 | k –d2 | 0 | 0 | 0 | 0 | 0 | 0 |
| 0 | –(k–2 + kd1 + β) | α | k –d1 | 0 | 0 | 0 | 0 | 0 | 0 | 0 |
| 0 | β | – α | 0 | 0 | 0 | 0 | 0 | 0 | 0 | 0 |
| 0 | k d1 | 0 | –(k–3 + k–d1) | 0 | 0 | 0 | 0 | 0 | 0 | 0 |
| k d2 | 0 | 0 | k –3 | –k –d2 | 0 | 0 | 0 | 0 | 0 | 0 |
|
| ||||||||||
| 0 | 0 | 0 | 0 | 0 | –l –1 | l –2 | 0 | 0 | 0 | 0 |
| 0 | 0 | 0 | 0 | 0 | 0 | –(1–2 + ld + b) | a | l–d | 0 | 0 |
| 0 | 0 | 0 | 0 | 0 | 0 | b | -a | 0 | 0 | 0 |
| 0 | 0 | 0 | 0 | 0 | 0 | ld | 0 | –l–d | 0 | 0 |
|
| ||||||||||
| 0 | 0 | 0 | 0 | 0 | 0 | 0 | 0 | 0 | –(k–t + kc) | 0 |
|
| ||||||||||
| k –1 | k –2 | 0 | k –3 | 0 | l –1 | l –2 | 0 | 0 | k–t | – δ |
From the structure of M it is clear that the linearized dynamics of the receptors are uncoupled from one another, and from the transporters. Near the fixed point the trajectory can be approximated by the solution X(t) to the linearized system, which can be written
where vi are the eigenvectors and λi are the eigenvalues of the coefficient matrix. While it is possible to compute these (using computer algebra) for general parameter values, the result is intractable. Instead we compute them for the physiological parameter values listed in Table I, the result is shown in Table IV.
Table I.
Parameter Values for the Receptors and Transporter Kinetics
| parameter name | value |
|---|---|
| k 1 | 8000 1/(M ms) |
| k –1 | 2 1/ms |
| k 2 | 4000 1/(M ms) |
| k –2 | 4 1/ms |
| k 3 | 4000 1/(M ms) |
| k –3 | 0.114 1/ms |
| k d1 | 0.15 1/ms |
| k d2 | 0.16 1/ms |
| k –d1 | 0.002 1/ms |
| k –d2 | 0.014 1/ms |
| α | 9 1/ms |
| β | 20 1/ms |
| l 1 | 10000 1/(M ms) |
| l –1 | 0.005 1/ms |
| l 2 | 5000 1/(M ms) |
| l –2 | 0.080 1/ms |
| ld | 0.0084 1/ms |
| l–d | 0.0018 1/ms |
| a | 0.0916 1/ms |
| b | 0.0465 1/ms |
| kt | 5000 1/(M ms) |
| k–t | 0.005 1/ms |
| kc | .01 1/ms |
| δ | 0.1 - 1.0 1/ms |
Table IV.
Eigenvalues (first row) and Eigenvectors (columns) for the trivial solution of the complete system, organized by subspace.
| λ | -31.2745 | -2.0805 | -1.126 | -0.1161 | -0.1449 | -0.0135 | -0.0125 | -0.005 | -0.0009 | -0.134 | -0.9 |
|---|---|---|---|---|---|---|---|---|---|---|---|
| GA | -0.1039 | -140.789 | 1.464 | 0.0486 | -0.6849 | 0.0 | 0.0 | 0.0 | 0.0 | 0.0 | 0.0 |
| G 2 A | 0.7584 | 0.0 | 0.3497 | -0.0035 | 0.0 | 0.0 | 0.0 | 0.0 | 0.0 | 0.0 | 0.0 |
| G2A* | -0.6517 | 0.0 | 1.0173 | -0.0089 | 0.0 | 0.0 | 0.0 | 0.0 | 0.0 | 0.0 | 0.0 |
| G 2 DA | 0.0 | 0.0 | -0.138 | -7.0262 | 0.0 | 0.0 | 0.0 | 0.0 | 0.0 | 0.0 | 0.0 |
| GDA | 0.0 | 5.4502 | -0.91 | 7.8277 | -101.10 | 0.0 | 0.0 | 0.0 | 0.0 | 0.0 | 0.0 |
| GN | 0.0 | 0.0 | 0.0 | 0.0 | 0.0 | -0.538 | -0.9956 | 1.0 | -0.0293 | 0.0 | 0.0 |
| G 2 N | 0.0 | 0.0 | 0.0 | 0.0 | 0.0 | 0.7286 | 0.7448 | 0.0 | -0.0120 | 0.0 | 0.0 |
| G2N* | 0.0 | 0.0 | 0.0 | 0.0 | 0.0 | -0.6567 | 0.4377 | 0.0 | -0.0613 | 0.0 | 0.0 |
| G 2 DN | 0.0 | 0.0 | 0.0 | 0.0 | 0.0 | -0.0442 | -0.5857 | 0.0 | -1.1318 | 0.0 | 0.0 |
| TG | 0.0 | 0.0 | 0. | 0.0 | 0.0 | 0.0 | 0.0 | 0.0 | 0.0 | 1.0 | 0.0 |
| G | -0.09 | 238.5 | -19.1031 | -0.9183 | -1.5451 | 0.0096 | 0.0028 | 0.0056 | -0.0030 | 0.1553 | 1.0 |
The invariant subspaces are obvious again from the structure of the eigenvectors, e.g. the G subspace is spanned by an eigenvector with eigenvalue –δ = –0.9. The transporter+glutamate subspace is spanned by the [G] eigenvector and one with components in both directions. The AMPAR+glutamate subspace is spanned by 2 eigenvectors in the [GA], [GDA], [G] subspace, 1 in the [GA], [G2A], [G2A*] subspace, and 2 eigenvectors with components in all directions. The most negative eigenvalues, -31.2745, -2.0805, and -1.126, appear in the AMPAR+Glut subspace. There are also two less negative eigenvalues, the least negative (-0.0135) for decay in the [GA], [GDA], [G] subspace, and the other, -0.1161, which corresponds to a decay constant of 8.62 msec, is mainly in the [G2DA], [GDA] direction.
The NMDAR+glutamate subspace has eigendirections with the three least negative eigenvalues of the whole system, -0.0009, -0.005 and -0.0125 (with time constants 1111, 200, 80 msec, respectively). Two of these eigenvalues (-0.0009 and -0.0125) have eigenvectors with components in the [G2N*] direction and will control the slowest decay in the [G2N*] signal. By contrast, in the AMPAR subspace, the eigendirections containing a component in the [G2A*] direction have eigenvalues -31.2745, -1.126 and -0.1161. All are more negative than any of those associated with the [G2N*] direction. It is a fact that a trajectory of a linear system near a stable node will ultimately collapse onto the subspace spanned by eigenvectors with the least negative eigenvalues. The final decay to the fixed point will occur on the time scale of those eigenvalues. Consequently the decay in the signal obtained by adding the [G2N*] and [G2A*] together will be determined at long times by the [G2N*] eigenvalues, since [G2A*] decays much more rapidly. If the NMDAR are removed, the dynamics will be restricted to the AMPAR+G subspace, and the slow decay component of the signal will also be removed, as borne out by the experimental run with the NMDAR blocked by APV.
The transporter+G subspace has eigenvalues of -0.9 and -0.134, corresponding to time constants 1.11 and 7.46 msec respectively. The dynamics in this subspace evolves on an intermediate time scale. If the transporters are removed, the long term decay of the signal must be unchanged, since it occurs in the NMDAR+glutamate subspace. This is the basis for our assertion that local synaptic phenomena cannot be responsible for the experimental observations.
2.3.1. Nonlinear Analysis: NMDAR
The linear analysis in the previous section provides some insight into the structure of the phase space, but is not the whole picture by any means. To analyze the full time course of the reaction, not just the decay back to unbound receptor states, we make approximations that allow us to solve the nonlinear equations in closed form. To do so we consider two separate phases of the reaction: 1) the very fast binding of two glutamate molecules, 2) the population of the doubly bound states and subsequent decay back to the attracting fixed point.
During the initial phase of the reaction the concentration of glutamate is very high in comparison to that of the free receptors ([G](0) = G0 = 1 mM vs. [N](0) = N0 = 0.007 mM). Accordingly, we rescale time by defining τ = l1G0t. The receptor state variables are rescaled by the initial concentration of unbound receptors N0, while we rescale [G] by its initial concentration, G0. The result is
with , , , , , and . The rescaled parameter , and the rest follow the convention , e.g. . The initial conditions are y0(0) = 1, g(0) = 1, y1(0) = y2(0) = y3(0) = y4(0) = 0. Note , and if we look on a time scale much less than , we can assume that g′ ≅ 0, so g is approximately constant, and therefore substitute g = 1 into the remaining equations. Referring to the parameter values from Attwell and Gibb in Table II, we see that l1G0 = 101/msec, while a, b and l–2 are , and ld, l–d, l–1 are , so the rescaled version of each is and , respectively. Thus, during this first brief phase we make the further approximation that terms involving these parameters can be ignored.
Table II.
Initial Concentrations
The resulting system is
In this approximate system the variables y3 and y4 will remain zero, and g is fixed at 1. The equations are then reduced to three, with linear terms only:
This set of ODEs is easily solved in closed form, yielding
In terms of the original variables we have
| (2.6) |
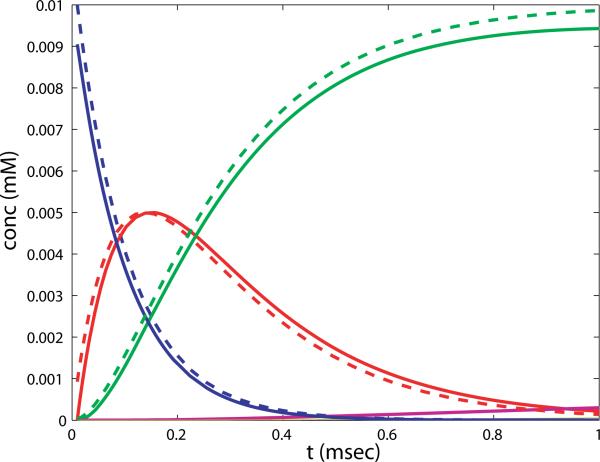
To illustrate the validity of this approximation during short time intervals, we plot the numerical solution to the full system over the first millisecond along with the approximate solution in figure 4.
Figure 4.
Comparison of the exact solution to the approximation for the fast binding phase of NMDAR, eq. (2.6), and the numerical solution of the NMDAR states in the full system, eq.(2.5). blue: [N], green: [G2N], red: [GN], purple: [G2N*], solid lines: full simulation, dashed lines: approximation. [G2N*] is not included in the approximation, and is just beginning to grow in the first msec of the reaction.
Note that almost all receptors are double-bound with glutamate at the end of this phase. Thus the first, rapid part of the reaction can be completely replaced by setting the concentration of all receptor states to zero, with the exception of [G2N], which is set to N0. This will be the initial condition for the second phase.
In the second phase we assume that all the free glutamate has diffused away, that is, the characteristic unbinding time for glutamate is much longer than its residence time in the cleft. At first the receptor states are redistributed between fully bound and deactivated, activated, and desensitized. Thus we rescale time by a rate representative of the redistribution, namely, τ = at. We again rescale the concentrations of the receptor states by N0, and since the initial concentration of glutamate is very small, we rescale it by N0 also. The equation for g = [G]/N0 is
We assume that g begins very small, so that the first two binding terms (whose coefficients are order 1) can be neglected. Further, because the diffusion term has a much larger coefficient than the unbinding terms (order 10 vs. order 10–1), we assume that any free glutamate created by unbinding is immediately diffused away. This keeps the concentration of g almost zero, and setting g = 0 in the other ODEs results in
| (2.7) |
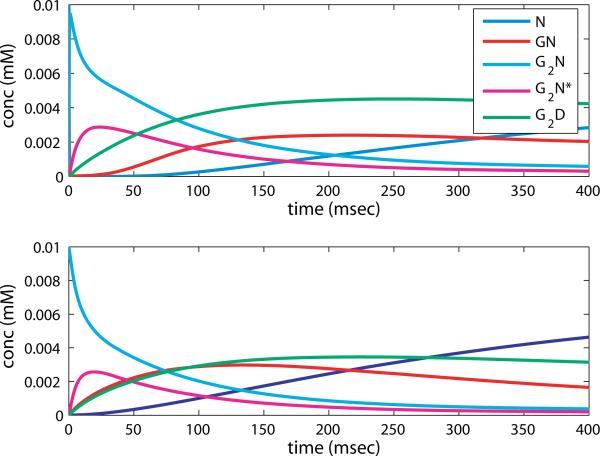
with rescaled parameters following the convention . The system can be reduced to four linear equations by noting that y0 can be found by invoking the conserved quantity y0 + y1 + y2 + y3 + y4 = 1. We solve the resulting system by finding the fundamental matrix of solutions, composed from the eigenvalues and eigenvectors of the coefficient matrix. We plot the result with parameter values from Table II, in terms of the original variables, along with a simulation of the full nonlinear system, in figure 5.
Figure 5.
Simulation of the NMDAR reaction equations (2.5) (top) and the solution to the approximation equations (2.7) (bottom) in the second phase of the reaction.
Note that the overall behavior of the nonlinear system is captured by this linearization. G2N decays quickly and G2N* is formed. Following this the desensitized state is populated, and G2N* decays. Finally the unbound state is recovered from G2D and GN. The recovery of the unbound state occurs more quickly in the approximation, since there is no free G available. However, for the purpose of creating the measured signal G2N*, the approximation would give a reasonable facsimile; for instance, the characteristic decay rate of G2N* is approximately the same.
2.3.2. Nonlinear analysis: AMPAR
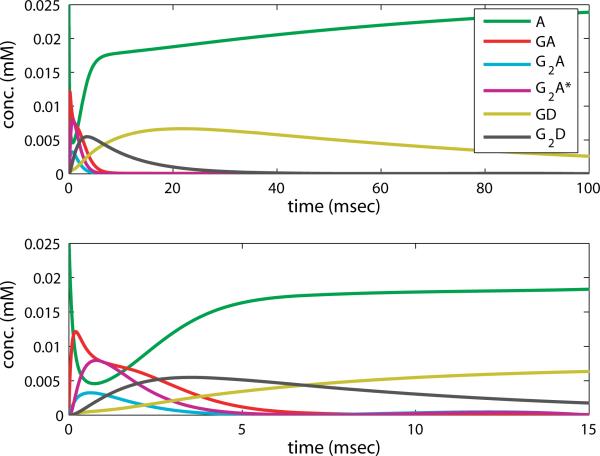
In figure 6 we plot a simulation of all the states in the full AMPAR reaction process, for 15 msec and 100 msec to resolve the fast binding and slow recovery part of the reaction, respectively. These suggest a time rescaling to isolate the early phase, namely τ = k1G0t, with . We also rescale the receptor states by total number of receptors, A0, and the glutamate by the initial amount of glutamate, G0. The resulting equations are
with g = [G]/G0, z0 = [A]/A0, z1 = [GA]/A0, z2 = [G2A]/A0, z3 = [G2A*]/A0, z4 = [G2D]/A0, z5 = [GD]/A0, and rescaled parameters of the form .
Figure 6.
Simulation of the AMPAR reaction, from eq. (2.5), for 100 msec and 15 msec.
We note that k̃–1, k̃–2, k̃–3, are all O(1) and , while is order 10–1, k̃d1, k̃d2 are order 10–2, and k̃–d1, k̃–d2 are order 10–3, 10–4 respectively. Assuming G0 > A0 by a factor of 10, is O(10–1). For a coarse approximation to the reaction in the first millisecond after the release of glutamate we consider only the O(1) terms (which neglects the transitions involving the desensitized states that are initially unpopulated) arriving at
Furthermore, for the first instance of the reaction (for t less than the unitless time scale set by ) g′ ≅ 0 and g can be fixed at 1. Since the equations for z4 and z5 are uncoupled from the rest of the system and z4(0) = z5(0) = 0, they must remain zero. Incorporating these approximations leads to the following system:
| (2.8) |
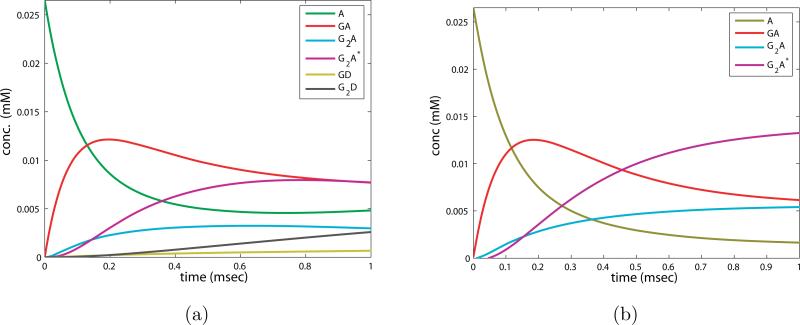
This system can be solved exactly by finding the fundamental matrix of solutions as for the NMDAR reactions. In figures 7 a) and b) we plot the numerical solution to the full system and the exact solution to the approximate system. The duration of this phase of the reaction depends on the time constant G0k1/δ ~ O(1) – O(10), which is on the order of the 1 msec time window utilized in graphing both. The phase is characterized by decay of the free receptor population, growth and subsequent decay of [GA], followed closely by the growth of [G2A], and transition from [G2A] to [G2A*]. Note that the approximation necessarily will not capture the growth in the desensitized states. This reduction involves more states than the first phase of the NMDAR reaction, because the binding rate of glutamate at physiological concentrations is smaller and comparable to the transition rate to the “on” receptor state. Therefore it includes both the binding of G and the redistribution in the non-desensitized states.
Figure 7.
a) Numerical simulation of full system of ODEs (2.5) for the first msec of the AMPAR reaction. b) Solution to the approximate system of ODEs for the first phase of the AMPAR reaction, eq. (2.8).
The relative sizes of the four states at the end of the phase are given approximately by the fixed point for the system above, (z̃0, z̃1, z̃2, z̃0). Because of the conserved quantity (z0+z1+z2+z3 = 1) the fixed point is non-trivial and depends on the initial concentrations. Solving for this fixed point yields the following relationships:
where we see that the fixed point component values are related by the ratio of the forward to the backward rates. See figure 7 b), where at the end of the phase the states are approaching equilibrium, and z1 > z0 and z3 > z2, e.g. [GA] > [A], [G2A*] > [G2A].
For the remainder of the reaction we assume that diffusion of free glutamate occurs rapidly enough to remove it as quickly as it is released, so that the forward glutamate binding terms in the equations are negligible and [G] can be set to zero. We then rescale time by k–1, and the concentrations of the reactants by the total amount of receptors A0. The resulting equations are
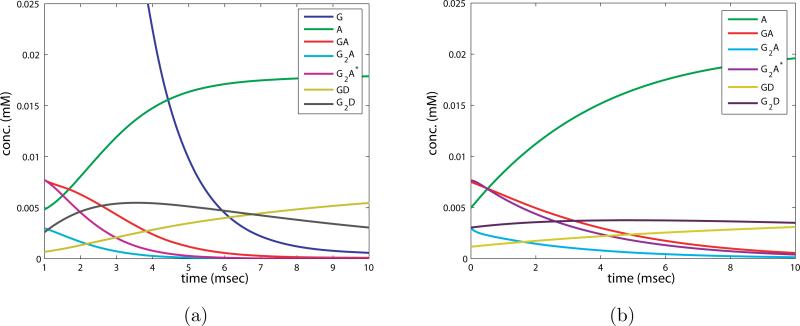
where the zi's are as defined for first phase, and p̃ = p/k–1. This phase of the reaction can be further divided into 3 epochs. During the first epoch the quantities [GA], [G2A], [G2A*] decay, while [GD] grows initially and then decays as [G2D] is formed. The concentration of free receptors, [A], also grows as glutamate unbinds and is removed by diffusion. We can approximate the dynamics during this epoch by noticing that the backward rates of desensitization k̃–d1, k̃–d2 are one to two orders of magnitude smaller than the other reaction rates. We therefore neglect those terms to arrive at
| (2.9) |
The structure of these equations is sufficiently simple to allow us to solve them analytically. First the two coupled equations for z2 and z3 can be solved, and the result for z2 is used to solve the ODEs for z1 and z4. z5 and z0 can be computed by direct integration once z1 and z4 are determined. The result is plotted in figure 8 b), to be compared with a simulation of the full equations during this epoch in figure 8 a).
Figure 8.
a) Numerical simulation of full system of ODEs (2.5) for the second phase, first epoch of the AMPAR reaction. Note the time shift that leaves out the first ms. b) Solution to approximate system of ODEs (2.9) for the second phase, first epoch, of the AMPAR reaction.
We see that the essentials of the reaction are captured by the approximation, but perhaps it is more informative to examine the decay rates of the different species, as determined analytically. For instance, the decay rates for z2 and z3 are -0.6 and -15.75 respectively. The larger rate corresponds to a time constant of 0.025 msec, which is not resolved at this scale. The smaller rate governs the longer term decay with a time constant of 1.66 (or 0.833 in msec). Moving to z1, the solution will necessarily have decay rates from the z3 solution and 1 – k̃d2 = 1 – 0.16/2 = 0.92 = 0.46 msec–1, which is roughly half the smaller decay rate of z3 and z2, hence the slightly longer decay profile. z0 can be determined by direct integration of z1, and so is governed by the same rates, although in this case they are growth rates as the unbound receptor is recovered over time. The solution to the ODE for z5 is found by solving another first order linear ODE, driven by z1, so it will inherit those rates, but what is evident from the figure is the much slower rate of k̃–3 = 0.057 msec–1, which determines the long-term growth of z5 toward a stationary value.
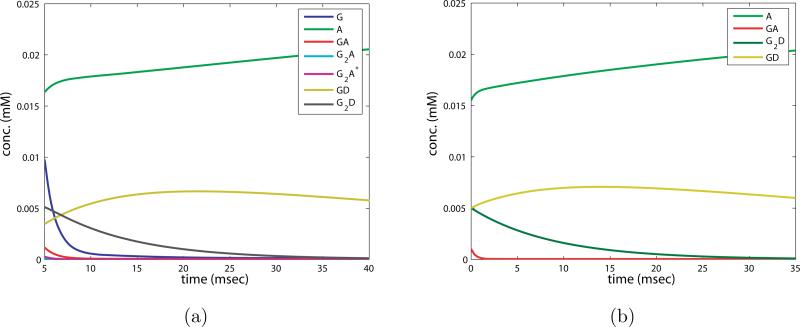
The second epoch in phase two occurs for 5 < t < 30 milliseconds, and is characterized by the decay of [G2D], growth and slow decay of [GD], and subsequent growth of [A]. Interestingly, the concentration of [GA] decays to almost zero and remains near zero through the rest of the reaction, though it is necessarily populated as [A] is formed from [GD].
We consider the rescaled equations from the first epoch:
First we assume z2 and z3 remain zero for all time, which is consistent with the z3 ODE. For the z2 ODE, k̃–d1 (which multiplies z4) is several orders of magnitude less than the other parameters and thus can be ignored. That small backward rate effectively blocks one pathway of the reaction, but does not appear appreciably in the actual solution for any of the species. Ignoring the terms multiplied by k̃–d1 in the remaining ODEs creates the following system:
This system has a conserved quantity, and we use that to determine the solution for z0, e.g. z0 = 1 – z1 – z4 – z5. The ODE for z4 is uncoupled and yields the solution
With this, the equations for z1 and z5 are a set of coupled, linear non-homogenous ODEs, which can be solved exactly. Doing so via Maple generates an intractable expression, so to simplify it we substitute the rescaled parameter values, and choose as initial conditions the values from the end of the first epoch from figure 8 b). The result is:
| (2.10) |
This approximation is plotted in figure 9 b) (in the original variables), to be compared with the full simulation in figure 9 a). The approximation captures the essential features of the reaction, that is, decay of G2D, slow growth and decay of GD, and recovery of A. Note that GA, which must be populated, is so at a very low level. The relatives rates k–d2 << k–1 ensures that the transition to A from GA happens very rapidly compared to the recovery from the desensitized state, so GA never has a chance to accumulate.
Figure 9.
a) Numerical simulation of full system of ODEs 2.5for the AMPAR reaction showing the second epoch of the second phase. b) Solution to approximate system of ODEs 2.10for the AMPAR reaction in the second epoch of the second phase.
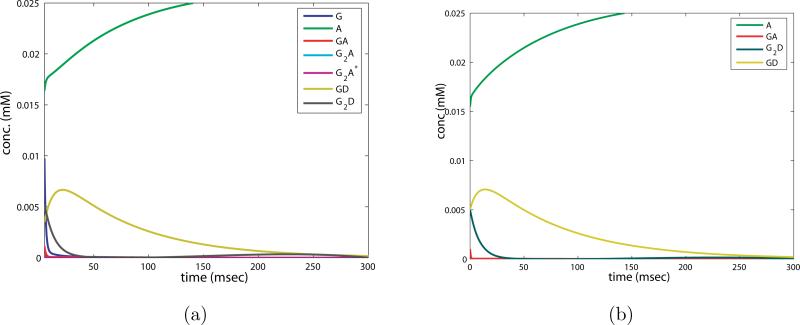
This approximation is also valid on the longest time scale, which we illustrate in figure 10 a) and b). The recovery of all receptors to the deactivated state occurs on a much longer time scale than that of the paired pulse experiments in question, where the inter-pulse interval is 50 msec.
Figure 10.
a) Numerical simulation of full system of ODEs for AMPAR in the third epoch of phase two. b) Solution to approximate system of ODEs for AMPAR in the third epoch of phase two.
The additional desensitized state and the relative size of the reaction rates creates a different signalling behavior in AMPAR than NMDAR, namely a significant proportion of the receptor population can be caught in a desensitized state over a much longer time period for AMPAR. With a large pulse of glutamate there is first a spike in the “on” receptor state, but the rebound reaction is preferentially through the pathway of the desensitized states, which recover to the deactivated state at a very slow rate. In the next section we will contrast this with what occurs when a long low profile of glutamate is imposed upon the receptors.
3. Results
3.1. Paired Pulse Experiments
Synapses in which paired pulse facilitation occurs are thought to possess an increased release probability (through the presence of an elevated level of calcium) and hence an increase in the number of active release sites when a second stimulus closely follows the first. Our linear analysis indicates that synapse-level effects near the stable equilibrium cannot capture the observed behavior in the experiments, since removing the transporters does not, and cannot, change the slower decay rates of the signal. We confirm this with numerical simulations of the paired pulse experiment.
For these, we use the linked kinetic equations for the receptor states, transporter states and glutamate to represent the average behavior in a single synapse (2.5). The concentration of “on” receptors (sum of [G2A*] and [G2N*]), is presumed to be proportional to the observed signal from the field recordings. Since the field recordings are essentially averaging the response over many neurons with many thousands of synapses, we feel that this is a reasonable way to model the data in these sub-threshold experiments (i.e. no action potential is created). Furthermore, we normalize the amplitude of the experimental signal by the peak amplitude of the response to the first stimulation, so the peak amplitude of the second gives the paired pulse ratio directly. The simulation responses are similarly normalized, which makes data fitting and parameter estimation straight-forward, as it removes the constant of proportionality between the concentration of the activated states and the signal.
In paired pulse experiments the brain slice is stimulated twice with an electrical input at one position (in our experiments it is the stratus radium), and the response is measured at another location (the CA1 pyramidal cell dendrites). If the second response is larger than the first (facilitation), the number of activated synapses is presumed to have increased. This effect depends on the length of the time interval between the pulses. The fractional amount of facilitation is used by experimentalists to measure the increase in so-called probability of release of glutamate. An action potential arriving at the presynaptic membrane of a terminal bouton may or may not trigger release of a vesicle of glutamate into the synaptic cleft, hence the probabilistic component. The probability of release in the simulations is controlled by the fraction of activated synapses that release glutamate. We perform simulations of receptors and transporters responding to glutamate release, under varying conditions, corresponding to the different experimental protocols. Glutamate vesicle release is modeled by including a pulse of glutamate concentration to the state equations, as described in the modeling section. Two such increases in glutamate occur 50 ms apart, mimicking the paired pulse stimulation protocol. Initially all the receptors and transporters are in their unbound state.
Since there is a different release probability in response to the first and second pulses, to capture the field response to this stimulation three separate pools of target molecules (each containing AMPAR, NMDAR and transporters) are created. One receives a pulse of glutamate upon the first stimulus only, another upon the second stimulus only, and a third upon both the first and second stimuli. The measured signal is made up of activated receptor concentrations from these pools in fractions that represent the probability of release in each instance. E.g., if the probability of release is p1 for the first pulse and p2 for the second pulse (p1 and p2 ∈ [0, 1]), and the concentration of activated receptors (both NMDAR and AMPAR) for the three pools is r1 for first pulse only, r2 for second pulse only, and r3 for the receiving both the first and second pulse, the signal would be proportional to p1r1 + p1p2r2 + p2(1 – p1)r3. This is a general expression, in these experiments it is assumed that r1 = r2.
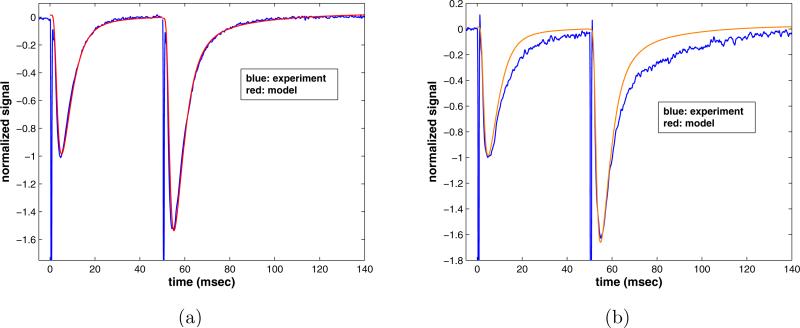
A control simulation, with initial transporters and receptors in the concentrations listed in table II, is shown in figure 11. The signal is the sum of the concentrations of activated NMDAR and AMPAR. To correspond to the experimental data, the amplitude of this sum is scaled by the peak response to the first glutamate pulse. The increased amplitude of the response is achieved by increasing p2. For the control run this increase from the first to the second pulse is roughly two-fold. The initial concentrations of free receptors and glutamate are as in section 2, e.g. the total amount of glutamate released is 1 mM and the rate constant γ is 0.85 msec–1. The total number of transporters is considered to be an order of magnitude larger than that of the receptors. Another important fitting parameter is the linear diffusion coefficient, δ, set at 0.8 (msec–1) for all of the following runs. This corresponds to an almost complete removal of free glutamate in about 5 msec, which, as pointed out in section 2, is consistent with the work of Clements et al. [5]. The simulation, thus tuned, is compared to the experimental signal in figure 11 a).
Figure 11.
a) Control experimental data set overlaid with paired pulse simulation, parameters listed in tables I and II. b) Transporters blocked: Model run with the same parameters, but with T (0) = 0.0.
Next we determine the effect of pharmacologically blocking the transporter molecules. Leaving all other simulation parameters unchanged, the concentration of transporters is set to zero, and the simulation repeated. The resulting signal is shown in figure 11 b), compared with the experimental data from a typical run with transporters blocked. From this it is evident that removing the transporters does not create the extended response seen after the second stimulus of the experiment. Recall that it cannot, since the slow decay rates occur in an invariant subspace that does not involve the transporters. The structure of the equations, which reflects the fact that the receptors and transporters are linked only through shared glutamate, subdivides the phase space into invariant subspaces associated with each molecule type, plus glutamate. The linear analysis of these subspaces in section 4 demonstrates that the slowest decay rates occur in directions restricted to the NMDAR-Glutamate subspace, so that the slowest decay is entirely NMDAR dependent. This is consistent with the experimental result that when the NMDAR are blocked by APV, the extended decay after the second stimulation is removed.
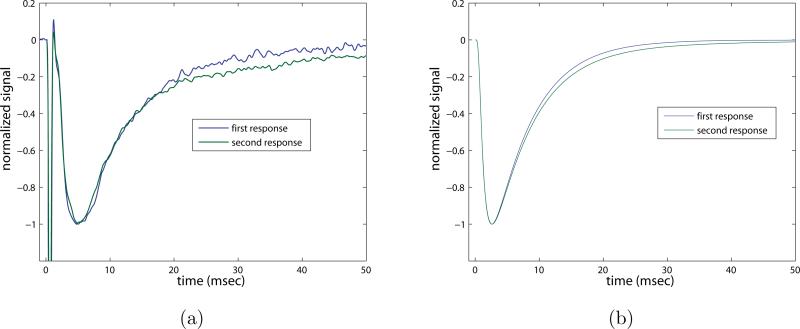
To further highlight this result we plot the first and second pulses overlaid, each rescaled to have a (negative) peak amplitude equal to unity, in order to compare the decay rates. Figure 12 a) shows the data set, while figure 12 b) plots the model simulation results. Removing the transporters in the model clearly does not result in the same prolongation seen in the experiments with the transporters blocked. The inability of this computational model to capture the experimental phenomenon illustrates the theoretical result that simple competition for glutamate between receptors and transporters at or near the synapse cannot be responsible for the prolonged response seen in the experiments.
Figure 12.
Overlaid first response and second response, rescaled to same minimum value in order to compare decay rates. a) Data set from experiment with transporters blocked, b) model with zero transporter concentration (parameters as in Table II).
If a well-mixed population of transporters and receptors and glutamate, presumably within or near a synaptic cleft, cannot reproduce the experimental data, some other mechanism must be responsible. If we believe that the transporters and receptors are linked only through their dependence on shared free glutamate, a non-homogeneous/spatial effect should be invoked to explain the experiment. In the next section we show that the inclusion of a pool of receptors that receives a long low concentration profile of imposed glutamate upon the second stimulus is sufficient to fit the experimental result. This could be caused by leaking glutamate for high release probability events, in other words, spill-over after the second stimulus.
3.2. Numerical Results: Adding Spill-over
In section 3.1 we showed that simply blocking transporters in the simulations could not duplicate the experimental results, the prolonged decay upon the second pulse was only marginally affected. This confirms the results of our linear analysis in section 2. However, if the neuronal transporters are blocked and a long low concentration profile of glutamate is then imposed on the receptors, we can demonstrate prolonged decay of the signal upon the second stimulation. The prolonged low concentration profile of glutamate is presumed to be the result of neurotransmitter from other release sites reaching the modeled synapses due to the simultaneous block of glial transporters. The transporters would act to keep this leaking glutamate from reaching other neighboring sites, hence unblocking the transporters turns off the leak. We do not see a sizable increase in the amplitude of the second response when the transporters are blocked, so this leak must affect the receptors in such a way that the fast responding AMPARs (responsible for the large fast peak) do not create a significant signal. This, in turn, is due to the different reaction mechanisms of the two receptors, which make NMDAR much more sensitive to a long low influx of glutamate.
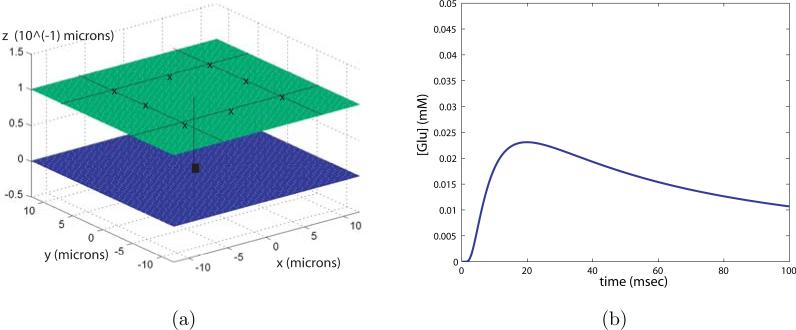
To generate a long low glutamate profile, the solution to the diffusion equation in a domain between by two parallel planes of infinite extent, with no-flux boundary conditions on the planes, e.g.
is computed. We consider 8 sources of diffusing glutamate, located on the corners and the middle of each side of a square on one plane (z = 0). The concentration of glutamate is measured at a point in the middle of this square, on the opposing plane (z = w). Referring to electron micrograph images of the CA1 region of the hippocampus by Ventura and Harris [36], the spacing between neighboring synapses generally is less than a micron, and the extracellular space itself is on the order of a tenth of a micron. In what follows we vary the spacing between leaking synapse sites, essentially altering the number of synapses that release glutamate after receiving the stimulus. In figure 13 a) we illustrate this geometry with the leak sources at a spacing of 6.0 microns, and the width of the gap (w) of 0.1 micron.
Figure 13.
a) Geometrical space of diffusion simulation, x's are leak sites, filled central square is the point at which glutamate concentration is measured. b) Glutamate concentration at the center point as a function of time.
This mimics diffusion in a narrow extracellular space, but physiologically it could be convoluted and contain barriers. Following Barbour and Häusser [4], to account for the tortuosity, we adopted an effective diffusion constant, D = D̃/λ2, where D̃ is the diffusion constant for glutamate in water, and λ > 1 is the ratio of the average diffusion path compared to unrestricted diffusion, or tortuosity factor. Modeling the extracellular space as a narrow region avoids the complication of adding barriers to diffusion, hence we don't include a volume fraction factor. The solution can be expressed in terms of Fourier Series as
| (3.1) |
M is the number of Fourier modes taken in the approximation, N is the number of release sites, xi, yi and zi are the coordinates of the ith release site and Q is the number of glutamate molecules leaking out of each release site.
In the synapse simulations in the next section the amount of glutamate leaking from each site ranges between 20-50 molecules. The distance between release sites in such a region of the hippocampus will be variable, but is expected to be in the range of single digit microns, depending on how many sites are active during an EPSC. The parameter D is estimated to be less than the diffusion constant for glutamate in free solution of 0.75 [20], around 0.6 microns–2s–1. This follows the results of Cory et al. [8], who use molecular dynamics simulations to determine how spatial confinement and membrane charges affect the diffusion constants of glutamate in a gap similar to a synaptic cleft. They concluded that the diffusion of glutamate is slower than its free diffusion in water only if the cleft is very narrow (< 5 nm). The extracellular space between the two planes is wider than that, hence glutamate diffusion should not be significantly slowed by confinement.
At this point it is necessary to make a comment about the uniqueness of the parameter set used to generate the glutamate profile. The variables of space and time and the diffusion constant in the equation cannot be independently varied, which can be confirmed by simple scaling arguments. Time can be made dimensionless by creating the variable , where l is a representative length in the problem. Hence a change in D can be compensated for by a reciprocal change in l2. In the same vein, if the spacing between release sites is increased and the width of the space is decreased in such a way as to keep the distance between the release site and the measurement point the same, the resulting profile will be unaltered. Hence we cannot claim to unambiguously resolve the physical space and diffusion constant required to generate a certain profile of diffusing glutamate, we can only be guided by known physiological constraints on these values.
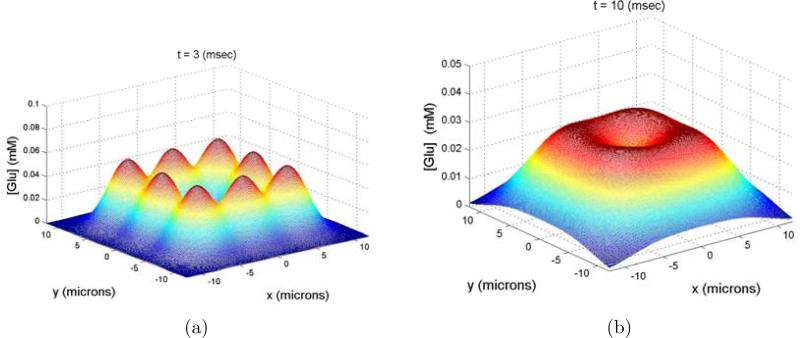
That said, the concentration of glutamate at the center location as a function of time for the release of 60 molecules is shown in figure 13 b). The distance between the release sites is 6.0 microns, the width of the gap is 0.1 micron and the corrected diffusion constant is 0.6. For a more complete picture of the glutamate concentration in space see figure 14 where the concentration of glutamate on the plane opposing the leak sites is plotted at t = 3 and t = 10 msec.
Figure 14.
Concentration of glutamate on the plane opposing the leak sites (z = w), a) t = 3 msec. b) t = 10 msec.
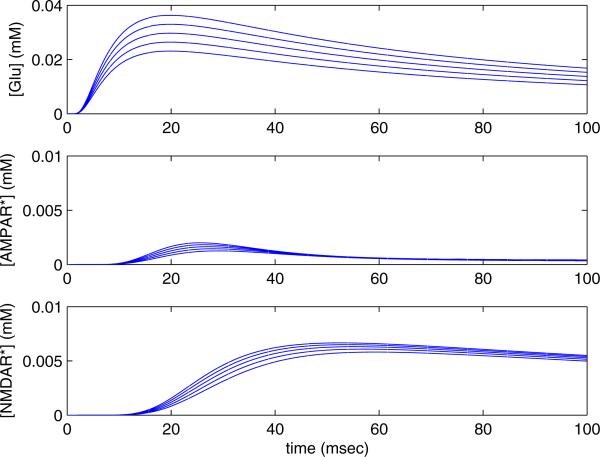
We next examine the response of the receptors to this leaking glutamate profile. In figure 15 a) we plot a series of such applied glutamate profiles, the total amount of glutamate ranging between 20-50 molecules. The activated b) AMPAR and c) NMDAR concentration vs. time, responding to the applied glutamate profiles are also shown. The initial concentration of free NMDAR and AMPAR receptors is 0.03 mM. From these plots it is clear that the NMDAR are preferentially stimulated by long low glutamate profiles, which plays a key role in explaining the experimental results. To understand this further we examine the population of the different states of each receptor exposed to this profile.
Figure 15.
Varying intensity of leaking glutamate. a) Profile of applied glutamate concentration, varying total amount, b) corresponding activated AMPAR concentration [AMPAR*] vs. time, c) corresponding activated NMDAR concentration [NMDAR*] vs. time.
3.2.1. AMPAR: Effect of leaking glutamate
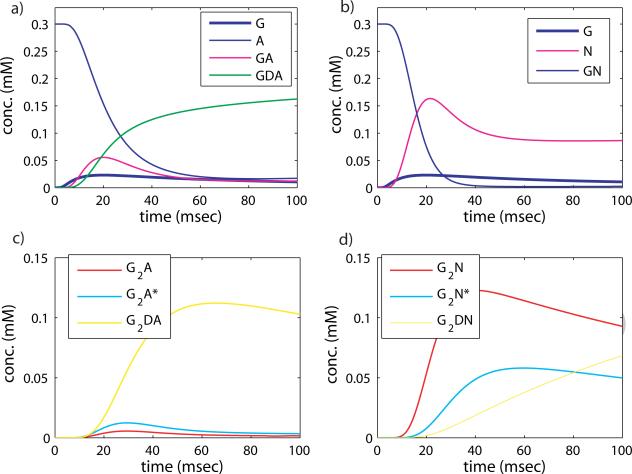
We analyze the time evolution of the AMPAR states in figure 16 b) by decomposing the reaction into phases. The fastest nonlinear phase of the response is missing, because the concentration of glutamate initially is very low. Since glutamate binding proceeds more slowly, as GA is formed the conversion to GD can compete effectively with the formation of G2A. The back reaction from GDA to GA occurs at a much slower rate than the forward reaction, and GDA accumulates. GDA can also add glutamate to become G2DA, further tying up the receptor in desensitized states. Subsequently a much smaller amount of G2A and G2A* is created. This is illustrated in the time course of the reaction, where the states with the smallest concentrations are G2A and G2A*. Note also that the imposed glutamate profile is not sufficient to saturate the receptor, a large fraction remains in an unbound state.
Figure 16.
Receptor states upon stimulation with a prolonged low concentration of glutamate. a), c) AMPAR states, b), d) NMDAR states. The AMPAR ‘on’ concentration is an order of magnitude less than NMDAR ‘on’ concentration for the same total receptor concentration and imposed glutamate profile.
To compare this quantitatively to the response of the NMDAR we analyze the reaction dynamics when a constant concentration of glutamate is added at a level much less than that of the concentration of receptors. Hence we begin with the equations for the receptor states (2.5), and set [G] = G0 < A0 arriving at
The forward reaction from A to GA now proceeds much more slowly than the back reaction, since the rate is k1G0, and if G0 < A0, k1G0 < 8 × 0.0265 = 0.212 msec–1 while k–1 = 2 msec– . Also, the rate from [GA] to [GDA], kd2 = 0.16 msec–1, now competes effectively with the rate that takes [GA] to [G2A], which is less than 4 × 0.0265 = 0.106 msec–1, hence the accumulation in the desensitized state. To quantify how these rates determine which state “wins” this competition, we compute the fixed point for the above set of ODEs analytically. The symbolic expression is intractable, so we present it evaluated with physiological parameter values and G0 = 0.01: [A] = 0.6118A0, [GA] = 0.0244A0, [G2A] = 0.0003A0, [G2A*] = 0.0007A0, [GDA] = 0.2694A0, [G2DA] = 0.0932A0. From this it is clear that [A], [GDA], and [G2DA] dominate, and the concentration of “on” receptors is several orders of magnitude lower. This result is reflected in the relative sizes of the states in the simulation shown in figure 16 a). The low concentration of glutamate drives the receptor into desensitized states at a greater rate than it turns it “on”.
3.2.2. NMDAR: Effect of leaking glutamate
Next we take up the response of NMDAR to the same long low profile of glutamate. Since NMDAR is postulated to become desensitized only when two molecules of glutamate are bound, there is no initial accumulation of a desensitized state. Thus the dynamics of NMDAR very different from that of AMPAR. In the simulation shown in figure 16 c) we see an initial growth of GN and G2N, followed by a shift to G2N* and finally an accumulation of G2DN. The peak concentration of G2N* is a factor of 10 greater than that of G2A* in the same experiment, and it persists over the duration of the simulation.
Taking the reaction equations for NMDAR in (2.5) with [G] = G0 a constant, the resulting linear system is reduced from five to four equations.
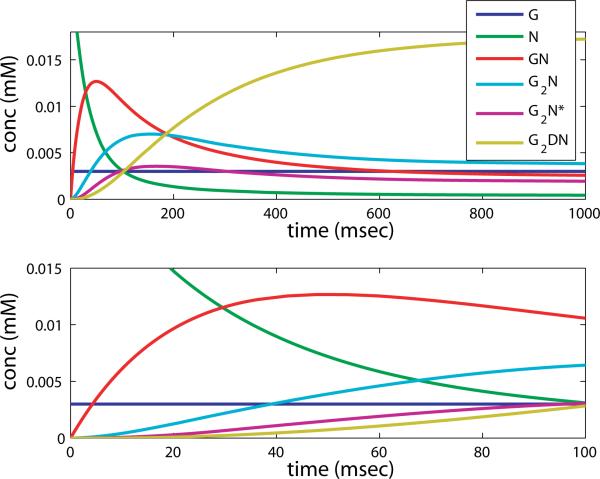
The fixed point for the above set of ODEs is computed analytically and again the symbolic expression is intractable, so we present it evaluated with physiological parameter values, and G0 = 0.01mM: [N] = 0.0016N0, [GN] = 0.03N0, [G2N] = 0.16N0, [G2N*] = 0.08N0, [G2DN] = 0.73N0. In this case the forward reaction rates are such that very little [N] and [GN] remain, and because a is half b, [G2N*] is roughly half [G2N]. Both are much smaller than [G2DN], but still two orders of magnitude larger than the steady state AMPAR “on” concentration. However, for NMDAR the fixed point is approached over the time scale of hundreds of msec, and because the imposed glutamate profile is effectively zero after 50 msec, this fixed point is not evident in the paired pulse simulation. Instead, see figure 17 where we show a simulation with constant glutamate concentration over 1000 msec and 100 msec, under similar conditions to those in figure 16 b).
Figure 17.
Simulation of NMDAR reaction with an imposed constant concentration of glutamate, over long time (1000 msec, top) and shorter time (100 msec, bottom).
3.2.3. Fitting the Paired Pulse Data
We next repeat the paired pulse simulations including a diffusing glutamate component. This is administered to receptors upon the second pulse, mimicking spill-over to adjacent sites for high release probability events. The simulation has three more pools of receptors: one that receives leaking glutamate upon the first pulse, one that receives leaking glutamate upon the second pulse, but no direct glutamate release upon the first pulse, and one that is activated upon the first pulse, and then receives a leak upon the second pulse. It is assumed the effect of the leaking glutamate upon sites that simultaneously receive a direct pulse is small enough to be neglected. The fraction of the signal made up from these pools is related to the probability of release, and an additional scaling factor that represents the relative size of these pools compared to those encountering a direct release of glutamate.
Four data sets are fitted: control, transporters blocked with L-TBA, NMDAR blocked with APV, and both transporters and NMDAR blocked (L-TBA+APV). We use the kinetic parameters for the receptors from before. The common parameters for all four data sets are summarized in the following table.
The initial transporter concentration is set to 0.0 mM for the cases with L-TBA applied, and the initial free NMDAR concentration is set to 0.0 mM when APV is applied. The proportion of receptors receiving a leaking component of glutamate varies between the first and second pulse. Denoting the proportion for the first pulse as γ1, and the second pulse as γ2, the following table shows the values used in fitting the four experiments. These were determined by a combination of hand identification of potential ranges of parameters, and the nonlinear fitting program lsqnonlin, in Matlab.
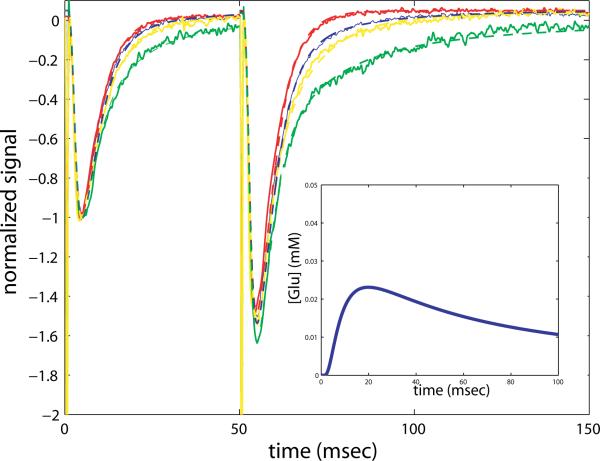
With these parameter choices the data can be very closely fit, as seen in figure 18. Note that some leaking glutamate is also present upon the first pulse. This result is meant as a proof of principle: glutamate diffusing from other sites could be responsible for the prolongation of the response to the second pulse. We cannot say precisely what time course of glutamate would be necessary for this, since the response is tuned by the exact receptor parameters, and the diffusion constant for glutamate. Furthermore, we cannot say what exact geometry of the release sites is necessary to create a given time course. There an infinitude of configurations that could create a single time course. For instance, if the width of the space is decreased, the spacing between sites can be increased to compensate, or the number of molecules or number of sites could be decreased, resulting in the same profile of glutamate seen at the central site. However, the parameters we have chosen are physiologically reasonable, so it is plausible that glutamate released from adjacent sites and diffusing to other synapses or extra-synaptic receptors, could be occurring in these experiments. Our mathematical analysis demonstrates that dynamics at the local synaptic level only cannot be responsible, and something else (such as “leaking glutamate”) is required.
Figure 18.
Paired pulse experiment compared with simulation in four cases: with transporters blocked by BA (green, model- dashed), and NMDAR blocked by APV (red, model- dashed), transporters blocked by BA and NMDAR blocked by APV (yellow, model-dashed), and control (blue, model-dashed). The imposed glutamate concentration profile shown as an inset on the second response with a solid blue line. Details of the simulation runs can be found in the text.
4. Discussion
While the existence of neurotransmitter spill-over at different synapses in the central nervous system is taken for a fact [1, 4, 7, 11, 12, 13], the experimental evidence for it is generally indirect. A prolonged response to a sequence of stimuli in subthreshold electrophysiological experiments is one such indirect indicator of spill-over. An example of more direct evidence is the recent work of Okubo et al. [24], where fluorescent markers for glutamate have been developed and used in experiments on cultured neurons, in slice preparations, and in vivo. However, because the kinetics of the marker are slow, deconvolution is required to resolve the signal, and the time course of glutamate in the extracellular regions cannot be precisely resolved. Furthermore, the marker is not evident within the synapse itself.
Using an average synapse model, we tested the assumption that a prolonged response to a second pulse in a paired pulse experiment is a hallmark of glutamate spill-over. The data being field potential measurements, average the electrical activity of many cells and many thousands of synapses. The paired pulse protocol is given repeatedly (on the order of 20 times) on a single slice, and the traces are averaged. The experiment is then repeated with several slices (4-8), and those results are also averaged. It is because of this averaging that the data are comparatively smooth, and we feel justified in using an average synapse representation of the dynamics. There is obviously a stochastic component to the process, which is represented by the probability of release of vesicles at an individual synapse. Hence we invoke different pools of synapses in creating the signal, e.g., those that have released glutamate only once or twice during a paired pulse stimulation.
Through analysis of the components in the average synapse model, we show that the phenomena observed cannot be explained by a local mechanism. Linear analysis of the fixed point to which the dynamics decays establishes that the addition or removal of local (synaptic) transporters cannot effect the decay rate on the longest time scales, hence the prolongation of the response upon the second stimulus cannot be due to the inactivity of transporters located within or very near the synapse. Recently, the density of neuronal transporters has been shown to be quite low, [10], which is consistent with the analysis. However, a secondary source of glutamate, potentially from spill-over from adjacent synapses, that is limited by extra-synaptic transporters, can account for the prolongation. Nonlinear analysis of the receptor reaction mechanisms demonstrates why the peak response remains unchanged upon transporter blockage, and highlights the importance of the AMPAR's second desensitized state, and relative reaction rates, in its signalling signature.
Because the linear analysis sets the basis for our assertion that this experiment must be explained by something other than local effects, we have not carried out extensive parameter sensitivity testing for our model. Certainly there are more than one parameter set that fit the data as presented, both at the receptor level, and the model of the paired pulse experiment and glutamate spill-over. In particular, we make no claims of being able to deconvolve the glutamate profile in spill-over, this is clearly not a well-posed problem. However, the results of the diffusion model do not contradict other direct measurements of spill-over, see for instance [15]. The glutamate profile interacts non-trivially with the receptor dynamics, which emphasizes the importance of having the two types of receptors to shape the temporal response at these synapses.
The relative simplicity of the model allows to us understand the dynamic effect of removing or adding components in a structured way. We conclude that, consistent with the results in [32], non-local glial transporters are primarily responsible for limiting spill-over of synaptically released glutamate, and we establish mathematically that a model of co-localized transporters and receptors (as would be the case with neuronal transporters) cannot reproduce the paired pulse experimental results with L-TBA.
5. Conclusion
The study of the action of neurotransmitter in and around the synaptic cleft of neurons in the central nervous system is crucial to the understanding of brain function and neuronal organization. Elucidating how the levels of glutamate are regulated in the extracellular space is central to the study of both glutamate-mediated neuronal signaling and glutamate-mediated neuropathology. Cellular transporters rapidly translocate extracellular glutamate into neurons and glia, contributing to signal termination, and the maintenance of sub-pathological levels of glutamate. An interplay between dynamics of receptors that signal the presence of glutamate, and the glutamate transporters, determines both the spatial and temporal signalling characteristics of neurons.
Prolongation of decay rates of synaptic currents and potentials are often seen as hallmarks of spill-over of neurotransmitter, especially in the case where transporters that remove excess neurotransmitter are disabled or blocked. This implies that a spatial component is necessary to explain the result, and that cross-talk between synapses is at work. But are there alternative explanations of the experimental results that cannot be ruled out? For instance, could direct competition for glutamate between receptors and transporters in or near the synapse be responsible for the result, without invoking any sort of spatially extended spill-over of neurotransmitter? The transporters are clearly shaping the response of the neurons in conditions of increased probability of glutamate release, but is it through the re-uptake of diffusing glutamate, or the fast buffering and removal of glutamate within the synaptic cleft?
The paired pulse experiment that we study, with its controls, outlines a clear modeling pathway for testing the spill-over hypothesis. In this paper we determine what aspects of the simplest mathematical model are required to explain the experimental results. In the process we show that simple competition for glutamate between receptors and transporters is not consistent with these results, and that an additional factor is required. Modeling spill-over as a prolonged glutamate concentration profile, we are able to fit the experimental data in control, with transporters and NMDAR pharmacologically blocked, in way that is not possible with simple pulses of glutamate that mimic vesicular release at each synapse. We establish analytically that homo-synaptic processes cannot account for the observed receptor behavior, and postulate a probable mechanism for the observed results. Moreover, the result hinges on the different reaction mechanisms employed by the AMPAR and NMDAR receptors. The two reaction mechanisms allow for the differentiation of a single spike in neurotransmitter concentration from an extended low concentration profile, characteristic of inter-synaptic spill-over.
Highlights.
Field measurements in a hippocampal slice experiment are studied.
The existence of glutamate spillover is tested with a synapse level model.
The specific reaction mechanisms of NMDA and AMPA receptors are analyzed.
It is established analytically that non-local effects (spillover) are required.
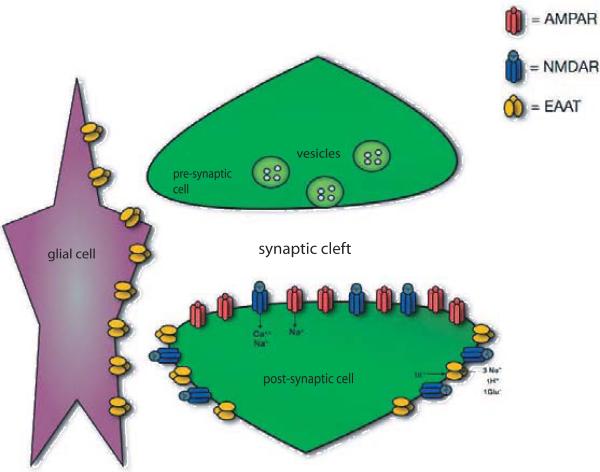
Figure 2.
Components of synaptic transmission: pre- and post-synaptic neurons and a glial cell. Vesicles filled with neurotransmitter (glutamate) fuse with the pre-synaptic membrane and release their contents into the synaptic cleft. The neurotransmitter binds with receptors (NMDA and AMPA) on the post-synaptic membrane and is taken up by transporters (EAATs) in the postsynaptic membrane and glial cells membranes.
Table V.
| parameter name | value |
|---|---|
| concentration of AMPAR | 0.0265 mM |
| total concentration of Glu released directly | 1.0 mM |
| rate constant for direct release of Glu | 0.85 msec–1 |
| probability of release for first pulse | 0.2 |
| probability of release for second pulse | 0.36-0.38 |
| distance of release grid | 6.0 micron |
| w | 0.1 micron |
| D/λ 2 | 0.6 |
| Q | 60 |
Table VI.
| experiment | T(0) | N(0) | γ 1 | γ 2 |
|---|---|---|---|---|
| control | 0.1 | 0.003 | 0.0 | 0.0 |
| APV | 0.1 | 0.0 | 0.0 | 0.0 |
| L-TBA | 0.0 | 0.003 | 0.12 | 0.3 |
| L-TBA+APV | 0.0 | 0.0 | 0.12 | 0.3 |
Acknowledgements
E.S. would like to acknowledge the support of NSF-DMS-IGMS number 0621830. This project was supported by NIH grants numbered P20RR015583 and R01 NS033270.
Footnotes
Publisher's Disclaimer: This is a PDF file of an unedited manuscript that has been accepted for publication. As a service to our customers we are providing this early version of the manuscript. The manuscript will undergo copyediting, typesetting, and review of the resulting proof before it is published in its final citable form. Please note that during the production process errors may be discovered which could affect the content, and all legal disclaimers that apply to the journal pertain.
Contributor Information
Emily Stone, Department of Mathematical Sciences The University of Montana Missoula, MT 59812.
Katie Hoffman, Center for Structural and Functional Neuroscience The University of Montana Missoula, MT 59812.
Michael Kavanaugh, Center for Structural and Functional Neuroscience The University of Montana Missoula, MT 59812.
References
- 1.Arnth-Jensen N, Jabaudon D, Scanziani M. Cooperation between independent hippocampal synapses is controlled by glutamate uptake. Nature Neuroscience. 2002;5:325. doi: 10.1038/nn825. [DOI] [PubMed] [Google Scholar]
- 2.Attwell D, Gibb A. Neuroenergetics and the Kinetic Design of Excitatory Synapses. Nature Reviews. 2005;6:841. doi: 10.1038/nrn1784. [DOI] [PubMed] [Google Scholar]
- 3.Asztely F, Erdemli G, Kullmann DM. Extrasynaptic glutamate spillover in the hippocampus: dependence on temperature and the role of active glutamate uptake. Neuron. 1997;18:281. doi: 10.1016/s0896-6273(00)80268-8. [DOI] [PubMed] [Google Scholar]
- 4.Barbour B, Hausser M. Intersynaptic diffusion of neurotransmitter. TINS. 1997;20(9):377. doi: 10.1016/s0166-2236(96)20050-5. [DOI] [PubMed] [Google Scholar]
- 5.Clements JD, Lester RA, Tong G, Jahr CS, Westbrook GL. The time course of glutamate in the synaptic cleft. Science. 1992;258(5087):1498. doi: 10.1126/science.1359647. [DOI] [PubMed] [Google Scholar]
- 6.Clements JD. Transmitter timecourse in the synaptic cleft: its role in central synaptic function. TINS. 1996;19:163. doi: 10.1016/s0166-2236(96)10024-2. [DOI] [PubMed] [Google Scholar]
- 7.Coggan J, Bartol T, Esquenazi E, Stiles J, Lamont S, S., Martone M, Berg D, Ellisman M, Sejnowski T. Evidence for ectopic neurotransmission at a neuronal synapse. Science. 2005;309(5733):446. doi: 10.1126/science.1108239. [DOI] [PMC free article] [PubMed] [Google Scholar]
- 8.Cory SM, Glavinovik MI. Molecular dynamics simulations of glutamate diffusion in synaptic cleft. Crit. Rev. Neurobiol. 2006;18:61. doi: 10.1615/critrevneurobiol.v18.i1-2.70. [DOI] [PubMed] [Google Scholar]
- 9.Danbolt NC. Glutamate Uptake. Prog. Neurobiol. 2001;65(1):1. doi: 10.1016/s0301-0082(00)00067-8. [DOI] [PubMed] [Google Scholar]
- 10.Holmseth S, Dehnes Y, Huang Y, Follin-Arbelet B, Grutle N, Mylonakou M, Paches C, Zhou Y, Furness D, Bergles D, Lehre K, Danbolt N. The density of EAAC1 (EAAT3) glutamate transporters expressed by neurons in the mammalian CNS. J. Neuroscience. 2012;32:6000. doi: 10.1523/JNEUROSCI.5347-11.2012. [DOI] [PMC free article] [PubMed] [Google Scholar]
- 11.Diamond J. Neuronal glutamate transporters limit activation of NMDA receptors by neurotransmitter spillover on CA1 pyramidal cells. J. Neuroscience. 2001;21:8328. doi: 10.1523/JNEUROSCI.21-21-08328.2001. [DOI] [PMC free article] [PubMed] [Google Scholar]
- 12.Diamond J. A broad view of glutamate spillover. Nature Neuroscience. 2002;5:291. doi: 10.1038/nn0402-291. [DOI] [PubMed] [Google Scholar]
- 13.DiGregorio D, Nusser Z, Silver R. Spillover of glutamate onto synaptic AMPA receptors enhnaces fast transmission at a cerebellar synapse. Neuron. 2002;35:521. doi: 10.1016/s0896-6273(02)00787-0. [DOI] [PubMed] [Google Scholar]
- 14.Hartzell H, Kuffler S, Yoshikami D. Post-synaptic potentiation: interaction between quanta of acetylcholine at the skeletal neuromuscular synapse. J. Physiol. 1975;251:427. doi: 10.1113/jphysiol.1975.sp011102. [DOI] [PMC free article] [PubMed] [Google Scholar]
- 15.Hires S, Yongling Z, Tsien R. Optical measurement of synaptic glutamate spillover and reuptake by linker optimized glutamate-sensitive fluorescent reporters. PNAS. 2008;105(11):4411. doi: 10.1073/pnas.0712008105. [DOI] [PMC free article] [PubMed] [Google Scholar]
- 16.Isaacson JS, Solis JM, Nicol RA. Local and diffuse synaptic actions of GABA in the hippocampus. Neuron. 1993;10:165. doi: 10.1016/0896-6273(93)90308-e. [DOI] [PubMed] [Google Scholar]
- 17.Jonas P, Major G, Sakmann B. Quantal components of unitary EPSCs at the mossy fibre synapse on CA3 pyramidal cells of rat hippocampus. J. Physiol. 1993;472:615. doi: 10.1113/jphysiol.1993.sp019965. [DOI] [PMC free article] [PubMed] [Google Scholar]
- 18.Kullman D, Asztely F. Extrasynaptic glutamate spillover in the hippocampus: evidence and implications. TINS. 1998;21(1):8. doi: 10.1016/s0166-2236(97)01150-8. [DOI] [PubMed] [Google Scholar]
- 19.Llano I, Marty A, Armstrong CM, Konnerth A. Synaptic- and agonist-induced excitatory currents of Purkinje cells in rat cerebellar slices. J. Physiol. 1991;434:183. doi: 10.1113/jphysiol.1991.sp018465. [DOI] [PMC free article] [PubMed] [Google Scholar]
- 20.Longsworth LG. Diffusion measurements, at 25, of aqueous solutions of amino acids, peptides and sugars. J Am Chem Soc. 1958;75:5705. [Google Scholar]
- 21.Lozovaya NA, Kopanitsa MV, Boychuk VA, Krishtal OA. Enhancement of glutamate release uncovers spillover-mediated transmission by N-methyl-D-aspartate receptors in the rat hippocampus. J. Neuroscience. 1999;91:1321. doi: 10.1016/s0306-4522(98)00638-1. [DOI] [PubMed] [Google Scholar]
- 22.Magleby K, K., Terrar D. Factors affecting the time course of decay of end-plate currents: a possible cooperative action of acetylcholine on receptors at the frog neuromuscular junction. J. Physiol. 1975;244:467. doi: 10.1113/jphysiol.1975.sp010808. [DOI] [PMC free article] [PubMed] [Google Scholar]
- 23.Mitchell C, Feng S, Lee R. An analysis of glutamate spillover on the N-methyl-D-aspartate receptors at the cerebellar glomerulus. J. Neural Engineering. 2007;4:276. doi: 10.1088/1741-2560/4/3/013. [DOI] [PubMed] [Google Scholar]
- 24.Okubo Y, Sekiya H, Namiki S, Sakamoto H, Iinuma S, Yamaksaki M, Watanabe M, Hirose K, Iino M. Imaging extrasynaptic glutamate dynamics in the brain. Proc. Nat. Acad. Sci. USA. 2010;107:6526. doi: 10.1073/pnas.0913154107. [DOI] [PMC free article] [PubMed] [Google Scholar]
- 25.Okubo Y, Iino M. Visualization of glutamate as a volume transmitter. J. Physiol. 2011;589.3:481. doi: 10.1113/jphysiol.2010.199539. [DOI] [PMC free article] [PubMed] [Google Scholar]
- 26.Otis T, Kavanaugh M. Isolation of current components and partial reaction cycles in the glial glutamate transporter EAAT2. J. Neuroscience. 2000;20:2749. doi: 10.1523/JNEUROSCI.20-08-02749.2000. [DOI] [PMC free article] [PubMed] [Google Scholar]
- 27.Perkel DJ, Hestrin S, Sah P, Nicoll RA. Excitatory synaptic currents in Purkinje cells. Proc. Roy. Soc. Ser. B. 1990;241:116. doi: 10.1098/rspb.1990.0074. [DOI] [PubMed] [Google Scholar]
- 28.Riveros N, Fiedler J, Lagos N, Munoz C, Orrego F. Glutamate in rat brain cortex synaptic vesicles: influence of the vesicle isolation procedure. Brain Res. 1986;386:405. doi: 10.1016/0006-8993(86)90181-2. [DOI] [PubMed] [Google Scholar]
- 29.Rusakov D, Kullman D. Extrasynaptic glutamate diffusion in the hippocampus: ultrastructural constraints, uptake, and receptor activation. J. Neuroscience. 1998;18:3158. doi: 10.1523/JNEUROSCI.18-09-03158.1998. [DOI] [PMC free article] [PubMed] [Google Scholar]
- 30.Scimemi A, Tian H, Diamond J. Neuronal transporters regulate glutamate clearance, NMDA receptor activation, and synaptic plasticity in the hippocampus. J. Neuroscience. 2009;29:14581. doi: 10.1523/JNEUROSCI.4845-09.2009. [DOI] [PMC free article] [PubMed] [Google Scholar]
- 31.Squire L, Bloom F, McConnell S, Roberts J, Spitzer N, Zigmond M. Fundamental Neuroscience. Academic Press; San Diego, CA: 2003. [Google Scholar]
- 32.Sun W, Hoffman K, Holley D, Kavanaugh M. Specificity and actions of an arylaspartate inhibitor of glutamate transport at the Schaffer collateral-CA1 pyramidal cell synapse. PLoS ONE. 2011;6:e23765. doi: 10.1371/journal.pone.0023765. [DOI] [PMC free article] [PubMed] [Google Scholar]
- 33.Szapiro G, Barbour B. Multiple climbing fibers signal to molecular layer interneurons exclusively via glutamate spillover. Nat. Neurosci. 2007;10:735. doi: 10.1038/nn1907. [DOI] [PubMed] [Google Scholar]
- 34.Tsukada S, Lino M, Takayasu Y, Shimamoto K, Ozawa S. Effects of a novel glutamate transporter blocker, (2S, 3S)-3-3-4-trifluoromethyl-benzoylamino- benzyloxyaspartate (TFB-TBOA), on activities of hippocampal neurons. Neuropharmacology. 2005;48:479. doi: 10.1016/j.neuropharm.2004.11.006. [DOI] [PubMed] [Google Scholar]
- 35.Tzingounis A, Wadiche J. Glutamate transporters: confining runaway excitation by shaping synaptic transmission. Nat. Rev. Neurosci. 2007;8:935. doi: 10.1038/nrn2274. [DOI] [PubMed] [Google Scholar]
- 36.Ventura R, Harris K. Three-dimensional relationships between hippocampal synapses and astrocytes. J. Neuroscience. 1999;19:6897. doi: 10.1523/JNEUROSCI.19-16-06897.1999. [DOI] [PMC free article] [PubMed] [Google Scholar]
- 37.Ventriglia F, Di Maio V. A Brownian simulation model of glutamate synaptic diffusion in the femtosecond time scale. Biol. Cybern. 2000;83:93. doi: 10.1007/s004220000150. [DOI] [PubMed] [Google Scholar]
- 38.Vogt KE, Nicoll RA. Glutamate and gamma-aminobutyric acid mediate a heterosynaptic depression at mossy fiber synapses in the hippocampus. Proc. Nat. Acad. Sci. 1999;96:1118. doi: 10.1073/pnas.96.3.1118. [DOI] [PMC free article] [PubMed] [Google Scholar]
- 39.Zerangue N, Kavanaugh MP. Flux coupling in a neuronal glutamate transporter. Nature. 1996;383(6601):634. doi: 10.1038/383634a0. [DOI] [PubMed] [Google Scholar]
- 40.Zheng K, Scimemi A, Rusakov D. Receptor actions of synaptically released glutamate: the role of transporters on the scale from nanometers to microns. Biophysical J. 2008;95:4584. doi: 10.1529/biophysj.108.129874. [DOI] [PMC free article] [PubMed] [Google Scholar]


