Abstract
Unipolar brush cells (UBCs) are excitatory cerebellar granular layer interneurons whose brush-like dendrites receive one-to-one mossy fiber inputs. Subclasses of UBCs differ primarily by expressing metabotropic glutamate receptor (mGluR) 1α or calretinin. We used GENSAT Tg(Grp-EGFP) BAC-transgenic mice, which selectively express EGFP in mGluR1α-positive UBCs to compare the functional properties of the two subclasses. Compared to EGFP-negative UBCs, which include the calretinin-positive cells, EGFP-positive UBCs had smaller somata (diameter 18 vs. 21 μm), lower specific membrane resistance (6.4 vs.13.7 KΩ*cm2), were less prone to intrinsic firing and showed more irregular firing (in cell-attached ~49% were firing vs. ~88%, and the CV was 0.53 vs. 0.32 for EGFP-negative cells). Some of these differences are attributable to higher density of background K+ currents in EGFP-positive cells (at −120 mV the barium-sensitive current was 94 pA, vs 37 pA in EGFP-negative cells); Ih, on the contrary, was more abundantly expressed in EGFP-negative cells (at −140 mV it was −122 pA vs. −54 pA in EGFP-positive neurons); furthermore, while group II mGluR modulation of the background potassium current in EGFP-negative UBCs was maintained after intracellular dialysis, mGluR modulation in EGFP-positive UBCs was lost in whole cell recordings. Finally, cell-attached firing was reversibly abolished by the GABAB activation in EGFP-positive, but not in EGFP-negative UBCs. Immunohistochemistry showed that EGFP-negative UBCs express GIRK2 at high density, while mGluR1 UBCs are GIRK2-negative, suggesting that GIRK2 mediates the mGluR-sensitive current in EGFP-negative UBCs. These data suggest that the two subclasses perform different functions in the cerebellar microcircuits.
Keywords: calretinin, GABAB, GIRK, mGluR1α, modulation, vestibulocerebellum
Introduction
The cerebellar unipolar brush cells (UBCs) and the granule cells are the only excitatory glutamatergic interneurons of the cerebellar cortex [1, 2]. UBCs are particularly enriched in the granular layer of the vestibulo-cerebellum and the vermis, where they receive one-to-one afferent inputs from vestibular mossy fibers [3, 4]. Based on chemical properties [1, 5, 6] and time of origin [7], UBCs are classified into two main subclasses. The major UBC subclass, which makes up approximately two thirds of the population, is represented by cells expressing the metabotropic glutamate receptor subtype mGluR1α (mGluR1α+), and the second subclass by cells expressing the calcium binding protein calretinin (CR+) [1].
Basic electrophysiological properties set UBCs apart from neighboring cells. In particular, input resistance and capacitance are very different from either Golgi or granule cells [8-11]. The firing properties, arguably the single most important neuronal electrophysiological parameter as it determines the neuronal signal transfer function, also distinguish UBCs from neighboring granule cells, although differences exist in the published data concerning the UBC firing phenotype. In particular, in vitro studies showed the UBCs to be either T-type calcium current-dependent bursting cells that are mostly silent at rest [12] or intrinsically spiking neurons that fire at low, regular frequency [10, 11]. In vivo recordings also found that UBCs may be either regularly firing at 10-30 Hz or bursting [13, 14]. Although no other morphological or functional differences have been identified between the two UBC subtypes so far, it could be suggested that the different electrophysiological properties attributed to UBCs in general may correspond to recordings from one or the other of two distinct neuronal subclasses. By taking advantage of gastrin-releasing peptide (Grp)-EGFP BAC-transgenic mice (Tg(Grp-EGFP)DV197Gsat) [15], in which the green fluorescent marker (EGFP) is expressed in the mGluR1α+ UBCs, this study shows that murine UBCs consist of two subsets of cells with different somatic size and functional properties. We show that the CR+ UBCs are larger, intrinsically and regularly firing, electronically tighter, express relatively large Ih and have GIRK2 channels that are modulated by group II mGluRs even after intracellular dialysis. The EGFP-positive (mGluR1α+) UBCs are depolarized by group I mGluR activation, have smaller soma size, show bursting phenotype, low Ih expression; they also display larger background potassium currents that are not mediated by GIRK2 subunits and are modulated by GABAB and group II mGluR activation but only in intact cell recordings. The possible functional consequences of these differences are discussed.
Materials and Methods
Animals
This study was carried out on mice in accordance with the guidelines issued by the National Institutes of Health and the Society for Neuroscience to minimize the number of animals used and their suffering.
Tg(Grp-EGFP)DV197Gsat mice generated by the GENSAT project [15, 16] were obtained from Drs. J.P. Doyle, J.D. Dougherty and N. Heintz (Rockefeller University, New York). The animals were bred and housed in the barrier-level mouse vivarium in the Center for Comparative Medicine at Northwestern University Feinberg School of Medicine. Multiple cycles of random mating within the subcolony, without the re-introduction of exogenous breeders, produced a closed subline in which transgene expression was largely restricted to the cerebellum and the cochlear nuclear complex. Genomic DNAs obtained from ear punches were tested by PCR using EGFP forward primer 5′-CCT ACG GCG TGC AGT GCT TCA GC-3′ and reverse primer 5′-CGG CGA GCT GCA CGC TGC GTC CTC-3′ (IDT). Mice positive for the transgene were mated to each other. Homozygous and heterozygous animals were used in the experiments and adult mice negative for the transgene were used as controls. In both homozygous and heterozygous mice EGFP was expressed in the UBCs. EGFP-positive and EGFP-negative mice at postnatal day 28 (P28) and P60 were used for histological evaluation and quantification, while EGFP-positive P21-35 mice were used for electrophysiological recording.
Immunohistochemistry
Deeply anesthetized mice (sodium pentobarbital, 60 mg/kg body weight) were perfused through the ascending aorta with 4% freshly depolymerized paraformaldehyde in 0.12 M phosphate buffer. The cerebella were dissected out and were either embedded in paraffin or cryoprotected for cryosectioning. Sagittal or coronal cerebellar sections from the paraffin embedded blocks were cut at 8 μm, deparaffinized in xylenes, and rehydrated in descending series of ethyl alcohols. Sections were subjected to antigens retrieval, using a pressure cooker with a 1x Rodent Decloacker solution (Biocare Medical) at 125°C for 20 minutes followed by a 10 minutes treatment with 0.1% sodium borohydride in Tris-buffered saline (TBS; 100 mM Tris, 150 mM NaCl; pH 7.4). Cryoprotected cerebella were sectioned serially in the sagittal or coronal planes at 24 μm on a freezing-stage microtome and collected in multiwell plates.
For immunohistochemistry in bright field microscopy sections were processed for immunohistochemistry according to an avidin/biotin amplification protocol. Briefly, the endogenous peroxidase activity was blocked in 0.3% H2O2 and 10% methanol in TBS and unspecific binding was suppressed in a blocking solution containing 5% normal goat serum (NGS) and 1% bovine serum albumin (BSA) in TBS with 0.2% Triton X-100. Sections were then incubated with primary antibodies overnight or up to 2 days at 4°C. Bound antibodies were detected using biotinylated anti-mouse or anti-rabbit IgG (GE Healthcare), ABC Elite kit (Vector) and diaminobenzidine (Sigma). For immunofluorescence sections were blocked with 5% NGS and 1% BSA in TBS with 0.2% Triton X-100 followed by incubation with the primary antibodies. Bound primary antibodies were visualized by secondary antibodies coupled to Alexa 488 or Alexa 594 (Invitrogen).
For this study, we used the following primary antibodies: mouse anti-CR (1:1000; Millipore, or 1:2000; Swant), rabbit anti-CR (1:5000; Swant), mouse anti-EGFP (1:1000; Millipore), rabbit anti-EGFP (1:5000; Invitrogen), rabbit anti-GIRK2 (Kir3.2; 1:200; Alomone, or 1:100-500; Millipore), mouse anti-mGluR1α (1:800-1000; Pharmingen or 1:150 Histopathology Ltd., Hungary), rabbit anti-mGluR1α (1:1500; from Dr. R. Shigemoto, SORST-JST, Myodaiji, Okazaki, Japan), and rabbit anti-Tbr2 (1:2000; from Dr. R.F. Hevner, University of Washington, Seattle). Specificity of the antibodies was confirmed by the absence of immunoreaction signal in control sections incubated without primary antibodies (data not shown).
Immunofluorescence images of cerebellar sections were acquired with a Spot RT CCD video-camera (Diagnostic Instruments) mounted on a Nikon Eclipse E800 microscope. Laser scanning confocal images were obtained with a Nikon PCM 2000 Confocal Microscope System using Simple PCI Program. Images were analyzed individually or in z-stacks of different depths. For co-localization experiments, type DF immersion oil (Fryer) was used with either a 40x plan-fluor lens (numerical aperture 1.3) or a 60x plan-apochromatic lens (numerical aperture 1.4). To minimize channel spillover the images were sequentially acquired. All images were processed with Adobe Photoshop CS2. Brightness and contrast were adjusted.
Cell Size Measurements
The cell body sizes of mGluR1α+ UBCs and CR+ UBCs were measured in neighboring sections double-stained with antibodies recognizing mGluR1α and EGFP or CR and EGFP, respectively. Confocal z-stack images of UBCs localized in lobules IX and X were taken with oil immersion objective lenses at 40×3 (CR) and 60×3 (mGluR1α) magnification. A total of 250 mGluR1α+ UBC and 250 CR+ from 5 mice (50 cell/each animal) were measured. Only cells with a brush and a soma within the same plane (within ~5μm depth) were used for measurements. Tiff images were transferred to NIH ImageJ program (available on the Internet at http://rsb.info.nih.gov/ij/), where the UBC somata were outlined using the freehand selection tool. The outlined area was automatically calculated by ImageJ program. Data were analyzed using Instat 3.0 (GrapPad Software).
Electrophysiological recordings
Homozygous and heterozygous Tg(Grp-EGF) mice were deeply anesthetized with isoflurane (0.3 ml in 1,000 ml administered for ~90 sec.) and killed by decapitation. The cerebella were quickly ablated and placed in ice-cold modified artificial cerebrospinal fluid containing (in mM): 125 NaCl, 25 NaHCO3, 2.5 KCl, 1.25 NaH2PO4, 0.2 CaCl2, 7 MgCl2 and 25 glucose and 2 kynurenic acid, saturated with 95% O2 and 5% CO2. Parasagittal slices, 300 μm-thick, were cut from the median cerebellum using a vibrating blade microtome (Microm). Slices were incubated in a sucrose-rich solution containing (in mM): 87 NaCl, 25 NaHCO3, 2.5 KCl, 1.25 NaH2PO4, 0.5 CaCl2, 7 MgCl2, 75 sucrose, 25 glucose, bubbled with 95% O2 and 5% CO2 for 20-30 minutes at 35°C and then at room temperature. For electrophysiological measurements, slices were transferred to a recording chamber at room temperature and were visualized with an Axioskop FS (Zeiss) upright microscope using infrared differential interference contrast videomicroscopy under a water-immersion 40X objective lens. During recordings, slices were continuously superfused with physiological extracellular solution containing (in mM): 125 NaCl, 25 NaHCO3, 2.5 KCl, 1.25 NaH2PO4, 1.5 CaCl2, 1 MgCl2 and 25 glucose, saturated with 95% O2 and 5% CO2. All recordings were performed from lobule IX and lobule X. EGFP-tagged UBCs were identified using epifluorescence illumination (X-cite Mississauga, Ontario, Canada). EGFP-negative UBCs included all the CR+ UBCs and an undetermined proportion of the mGluR1α+ UBCs. EGFP-negative UBCs were visually selected based on size and shape. Typically, EGFP-negative UBCs had a capacitance of 21.2 ±0.74 pF, much larger than granule cells [10] and smaller than Golgi cells [8, 9]; their identification as UBCs was confirmed by observation of the characteristic brush upon intracellular dialysis with the fluorescent dye Alexa-fluor 488 (1mg/ml) or Lucifer yellow (1 mg/ml). The presence of intrinsic firing was tested in cell-attached configuration in the presence of 2 mM kynurenic acid, 100 μM picrotoxin and 1 μM strychnine to block fast synaptic transmission.
Pipettes were pulled from Dagan SG16 glass (OD 1.65 mm; ID 0.75 mm) using a horizontal puller (P97, Sutter). For whole-cell recordings, pipettes were filled with internal solution consisting of (in mM): K-gluconate 130, NaCl 10, MgCl2 2, EGTA 0.1, Na2ATP 2, NaGTP 0.1, HEPES 5, pH 7.3 with KOH. Pipette tip resistances in working solutions ranged from 5 to 8 MΩ yielding series resistances of <50 MΩ that were compensated 40 to 60%. For cell-attached recordings the resistance of the pipettes was in the same range as used for whole-cell recordings. The internal solution for cell-attached recordings was extracellular HEPES-buffered ACSF (1.5 mM [Ca2+]O) for the recordings shown in figures 2, 10 and 11, and it was K-gluconate for data in figure 6.
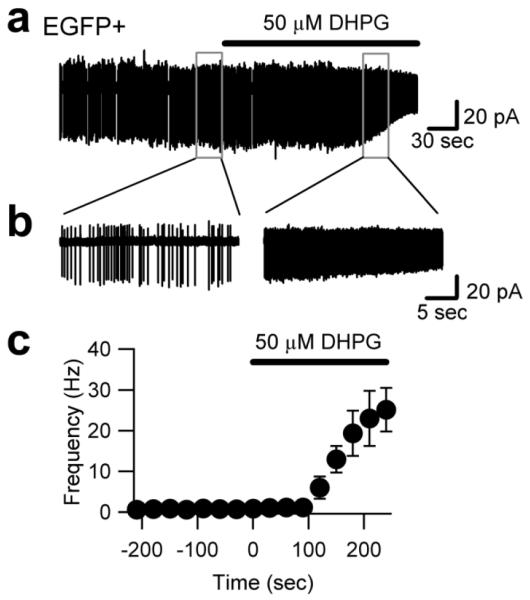
Figure 2. Type I mGluR activation depolarizes EGFP-positive UBCs.
a, Cell-attached recording from a EGFP-positive cerebellar UBC in an acute mouse slice in the presence of blockers of fast synaptic transmission. Type I mGluR agonist DHPG increased the frequency of intrinsic firing, while decreasing the spike amplitude, in keeping a depolarizing effect. The trace segments within the boxes are shown on an enlarged time-scale in b, c. Summary of the effect of DHPG on the firing frequency of 8 neurons.
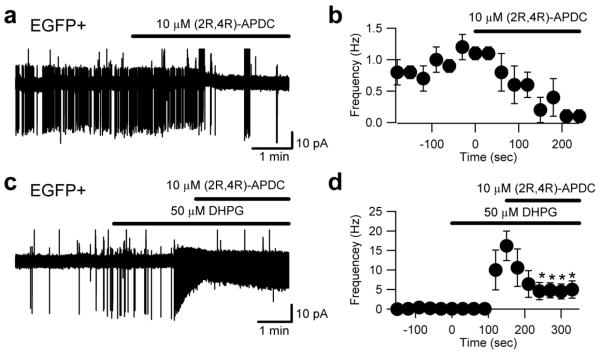
Figure 10. Cell-attached recordings reveal a group II mGluR-dependent modulation of EGFP-positive UBC firing.
a, Cell-attached recording from an EGFP-positive UBC in control conditions and in the presence of the group II agonist (2R,4R) APDC (bar above the trace); note that APDC almost completely abolished intrinsic firing. The graph in (b) reports pooled data from 4 cells. In order to test the effect of group II mGluR activation in many EGFP-positive UBCs that show little or no spontaneous activity, the cells were first stimulated with DHPG and then APDC was co-applied (c). Panel (d) illustrates data pooled from 4 such experiments and shows that APDC significantly reduced the increase in firing frequency elicited by DHPG.
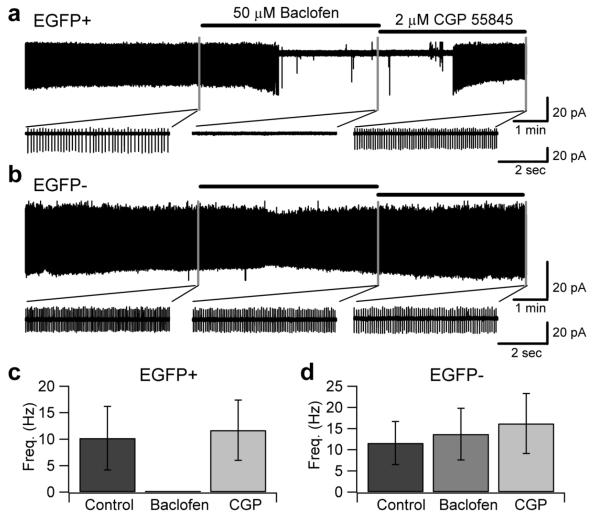
Figure 11. GABAB receptor activation modulates background potassium currents in EGFP-positive, but not in EGFP-negative UBCs.
a, Voltage clamp recordings of intrinsically firing EGFP-positive UBCs in cell-attached configuration. Bath application of 50 μM baclofen, a GABAB agonist, hyperpolarized EGFP-positive UBCs and stopped intrinsic firing. The baclofen effect was reversed by washout with ACSF including 2 μM CGP 55845. In 2 μM CGP 55845 intrinsic firing of EGFP-positive UBCs was unaltered compared to the control condition. b, Intrinsic firing of EGFP-negative UBCs was not affected by bath application of baclofen and CGP 55845.
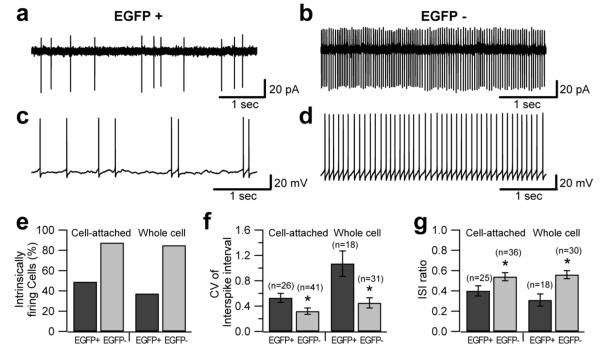
Figure 6. Intrinsic firing patterns differ in EGFP-positive and EGFP-negative UBCs.
a-d, Voltage clamp cell-attached recordings (a, b) and whole-cell current clamp recordings (c, d, no current injection) of intrinsic firing in UBCs. EGFP-positive cells (a, c) exhibited spontaneous bursting, while EGFP-negative cells (b, d) fired more regularly. e, Bar chart summarizing the fraction of intrinsically firing cells in the two populations: 88% and 85% of EGFP-negative UBCs were intrinsically firing in cell-attached (48 total recordings) and whole-cell recording (40 total recordings), respectively. For EGFP-positive UBCs, the fraction of intrinsically firing cells was 49% in cell-attached and 37% in whole-cell (55 and 51 recordings, respectively). f, Coefficient of variation of the interspike interval in the two cell types. In the cell-attached the values were 0.53 for EGFP-positive UBCs and 0.32 for EGFP-negative UBCs. In whole-cell the values were 1.07 for EGFP-positive UBCs and 0.45 in EGFP-negative UBCs (p<0.05). g, Interspike interval ratio (obtained by dividing the shortest interspike interval in the recording by the average interspike interval) measured in cell-attached and whole-cell in the two UBC subpopulations.
All recordings were performed at 22-24°C using an Axopatch 200B amplifier (Axon Instruments). Current signals were low-pass filtered at 2 or 5 KHz (4-pole low-pass Bessel filter on amplifier) and digitized (10 KHz) using a Digidata 1321A controlled by pClamp8 software interface (Axon instruments). Signals from current-clamp recordings were sampled at 20 KHz and filtered at 10 KHz.
Drugs and chemicals were from Sigma, except picrotoxin, DHPG, APDC, baclofen, CGP55845 and t-ACPD that were from Tocris; they were bath applied. All recorded cells were filled for post-hoc anatomical examination. At the end of the recording, slices were fixed in 4% paraformaldehyde in 0.1 M PB for 24 hours. After fixation slices were rinsed in PB several times. Finally slices were coverslipped with Mowiol (Aldrich) based antifading mounting medium.
Statistical analysis
Comparisons between different samples were performed using ANOVA; comparisons of individual cells before and after treatment were performed using paired t-tests. Statistical significance was evaluated at the level of p<0.05. All data are expressed as mean and SEM. Error bars in the figures also represent SEM. Multivariate analysis: Principal component analysis [17] was performed using commercially available software (MVSP). Data were standardized into z scores and the four variables reduced to two dimensions. The two axes accounted for >80% of the total sample variance. For cluster analysis, a similarity matrix between each pair of cases was calculated. The hierarchical dendrogram was then constructed using a minimum variance algorithm.
Results
To validate the expression pattern of the cellular markers mGluR1α, CR and EGFP in our closed, Tg(Grp-EGFP) mouse subcolony, cerebellar sections of homozygous and heterozygous transgenic mice were analyzed by single and double-immunofluorescence with antibodies of proven specificity.
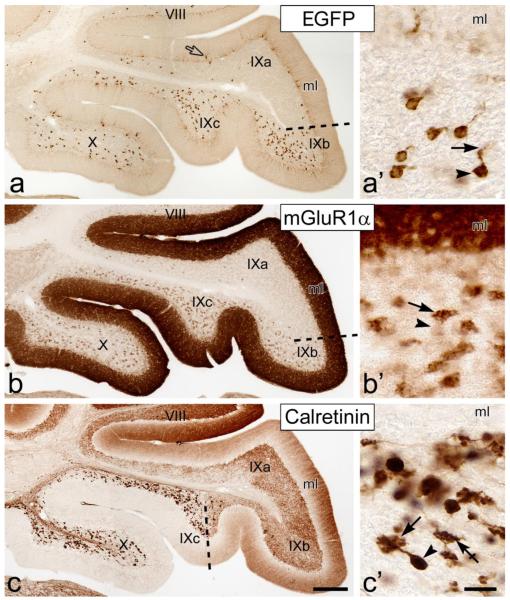
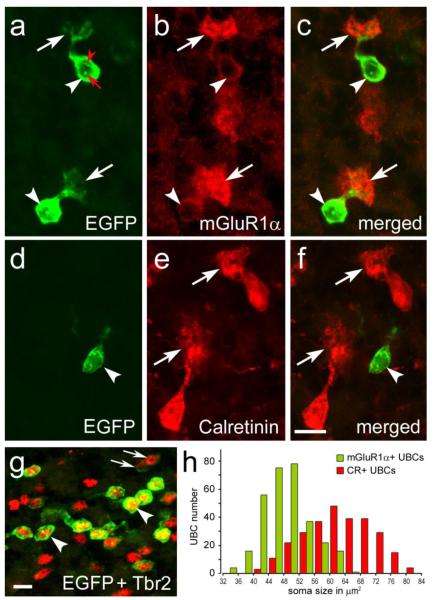
Immunohistochemistry in adult mice with antibodies to EGFP, mGluR1α and CR using an immunoperoxidase staining confirmed that the lobular distribution of EGFP-positive neurons throughout the cerebellar cortex in general (data not shown) and in lobules IX and X in particular (Fig. 1a-c) was fully congruent with that of the mGluR1α+ UBCs. Additionally, every EGFP-positive neuron tested responded to application of the type I mGluR agonist DHPG (50 μM, 8 cells) with an increase in firing frequency (Fig. 2). The regional positioning of the EGFP-positive UBCs did not match, albeit it partially overlapped, that of the CR+ UBCs (compare Fig. 1a with Fig. 1c). At the single cell level, EGFP immunoreactivity appeared more intense in the cell body than in the dendritic compartment (Figs. 1a’ and 3a, d, g) and was usually absent from the axon (Fig. 1a’), except in the initial segment (data not shown). The identification of EGFP-positive neurons with the mGluR1α+ UBCs (Fig. 3a-c) was unmistakable, in spite of the fact that the brushes were faintly EGFP-immunoreactive and intensely mGluR1α+ while the cell bodies distinctly EGFP-immunoreactive and only faintly mGluR1α+ (see also Fig.1a’, b’). By contrast, the CR+ UBCs appeared intensely immunoreactive in the entire somatodendritic compartment (Figs. 1c’ and 3e, f) and in the axonal compartment (data not shown), as previously demonstrated [1, 18, 19]. The CR+ UBCs were not immunolabeled by EGFP antisera (Fig. 3d-f). Double-labeling with antibodies to EGFP and Tbr2 (a marker for the entire UBC population [20, 21]) further confirmed that all EGFP-labeled cells were UBCs (Fig. 3g). In the EGFP-positive UBCs the nucleoli were usually densely stained (Fig. 3a, d, g) and in some UBCs nuclear infoldings were also detectable (Fig. 3a).
Figure 1. Distribution of UBC subclasses in the Tg(Grp-EGFP) BAC-transgenic mice cerebellum.
Images from parasagittal cryosections immunoreacted with antibodies to EGFP, mGluR1αand CR (as indicated) show the two lobules (lobule X – the nodulus, and vermal lobule IX –the uvula) that contain the highest UBC densities. ac, Dash-lines mark the border of the region enriched with EGFP-positive, mGluR1α+, and CR+ UBCs. The distributions of EGFP-positive and mGluR1α+ UBCs are in register, and overlap only partially with the CR+ UBCs. There is slight expression of EGFP in the Golgi-Bergmann glia, (open arrow in panel a) as previously reported. In the molecular layer (ml), strong mGluR1α immunoreactivity is localized to the Purkinje cell dendrites (b), whereas CR immureactivity is localized to ascending granule cell axons and their parallel fibers (c). a’-c’, Higher magnification images of UBCs from lobule X showing differential immunostaining of the UBC soma (arrowhead) and brush (arrow) with antibodies to EGFP (a’), mGluR1α (b’) and calretinin (c’). Crossed-arrow in panel c’ indicates CR+ mossy fiber terminal. Scale bars: a-c, 200 μm; a’-c’, 20 μm.
Figure 3. Immunofluorescence of chemically distinct UBC subclasses in the cerebellum of Tg(Grp-EGFP) BAC-transgenic mice.
a-g, Confocal images from two-color immunolabeled cryosections. EGFP-positive UBCs are mGluR1α+ (a-c), but CR-negative (d-f). In panels a-f arrowheads indicate cell bodies and arrows point to brushes; the nucleoli of EGFP-positive UBCs are conspicuously labeled (red arrow) and a nuclear infolding is labeled by red arrowhead. EGFP is intensely expressed in many UBCs labeled by Trb2 (arrowhead); faintly EGFP-positive UBCs are indicated by arrows (g). h, Bar graph illustrates cell subclass differences in the soma size of mGluR1 + and CR+ UBCs. Scale bars: a-g, 10 μm.
EGFP-expression highlighted the cell body of mGluR1α+ UBCs and generated the overall visual impression that the EGFP/mGluR1α-immunoreactive UBCs have smaller soma size than the CR+ UBCs (compare Figs. 1a’ and 3c to 1c’ and 3f, respectively). To validate this difference we measured the cell bodies of 250 UBCs in each of the two subclasses after immunostaining with anti-EGFP paired with anti-mGluR1α or anti-CR. As shown in Figure 3h, the average somatic area of EGFP-immunoreactive mGluR1α+ UBCs was 48.3±0.4 (range: 33.1 to 66.4) μm2, while it was 63.2±0.6 (range: 42.4 to 83.3) μm2 for CR+ UBCs (p<0.05).
The intensity of EGFP expression varied among UBCs. Strong EGFP signal was easily detectable by standard fluorescence microscopy, while low signal required confocal microscopy (Fig. 3g). Notably, the proportion of intensely fluorescent UBCs was higher in presumed homozygotes than in heterozygotes as previously reported [15] although it never encompassed the entire mGluR1α+ UBC population. To ascertain that EGFP was indeed expressed by mGluR1α+ UBC we analyzed coexpression of the two proteins in confocal images. We found that 99.9% of EGFP expressing UBCs were labeled by mGluR1α antiserum; out of 1098 EGFP-positive cells (N=3 mice), only 2 UBCs were mGluR1α-.
In Tg(Grp-EGFP) mice mGluR1α+ UBCs and CR+ UBCs formed two largely non-overlapping populations (data not shown) as previously reported in adult CD1 mice [1]. UBCs immunoreactive for both cellular markers were extremely rare, in agreement with previous studies in rat and other mammals [2, 20], although the number of such cells was slightly more frequent in P22-24 TG (Grp-EGFP) mice than in the adults, presumably as a consequence of the still ongoing maturation process; however, the number of such neurons was still negligible (3-5%; data not shown). Moreover, the rare EGFP/CR double-labeled UBCs were only faintly EGFP-immunofluorescent (not shown), in contrast to the single-labeled (EGFP-positive) UBCs, which showed intense fluorescence labeling. The data indicated that Tg(Grp-EGFP) mice can be advantageous to reliably identify one of the two UBC subsets in fresh slices and determine its electrophysiological properties, as a step towards the functional definition of both UBC subtypes.
The electrophysiological phenotype of the two neuronal populations was studied using patch clamp recordings in acute slices. For these experiments we used 21-35 day-old mice and we selected UBCs that displayed either an unmistakable intrinsic fluorescence or lacked fluorescent signal altogether, with the caveat that a small number of the latter may represent mGluR1α+ UBCs (for more details see Material and Methods and data discussed in Figure 13). The recordings were performed in the presence of blockers of fast synaptic transmission (2 mM kynurenic acid, 100 μM picrotoxin and 1 μM strychnine). Cells belonging to the two groups showed different response to injection of negative and positive currents (Fig. 4a, b). In keeping with the anatomical analysis showing different cell size, EGFP-positive and EGFP-negative UBCs had different capacitance (16.6 ± 0.7 pF and 20.2±0.7 pF n=51 and 42 respectively, p<0.05; Fig. 4c); the input resistance also differed (it was 6.4±0.5 kΩ*cm2 and 13.7±0.9 kΩ*cm2, respectively, p<0.05; Fig. 4d), suggesting a differential expression of background current between the two cell types.
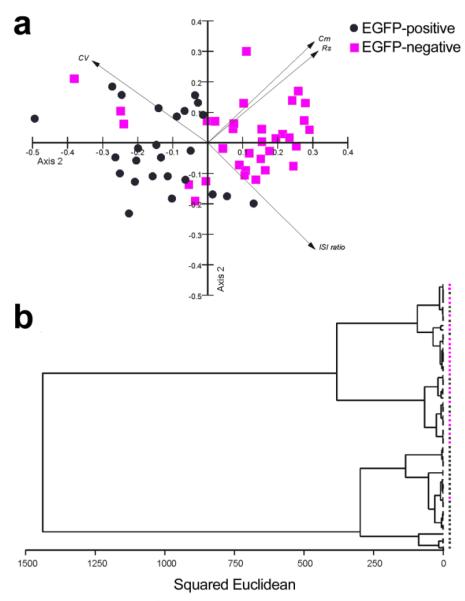
Figure 13. Multivariate analysis confirms the existence of two distinct populations of UBCs.
a, Principal component analysis of four variables obtained from recorded UBCs. The variables were: capacitance, specific membrane resistance, spike coefficient of variation (in cell-attached) and inter-spike interval ratio (in cell-attached). The two axes accounted for 80% of the variance in the sample. The eigenvector loading of the variables was 0.485; 0.502; −0.525; 0.488 on the first and 0.528; 0.479; 0.428; −0.556 for the second axis, respectively. Note that EGFP-positive and EGFP-negative UBCs form two clouds with minimal contamination. Notably, all three the major outlayers (three squares in the second quadrant) were EGFP-negative cells, suggesting that they may represent false-negatives in which the EGFP-expression was below detection. b, Cluster analysis on the same data set also shows two main clusters, one formed by EGFP-positive and the other by EGFP-negative UBCs.
Figure 4. Distinctive Intrinsic properties of EGFP-positive and EGFP-negative UBCs.
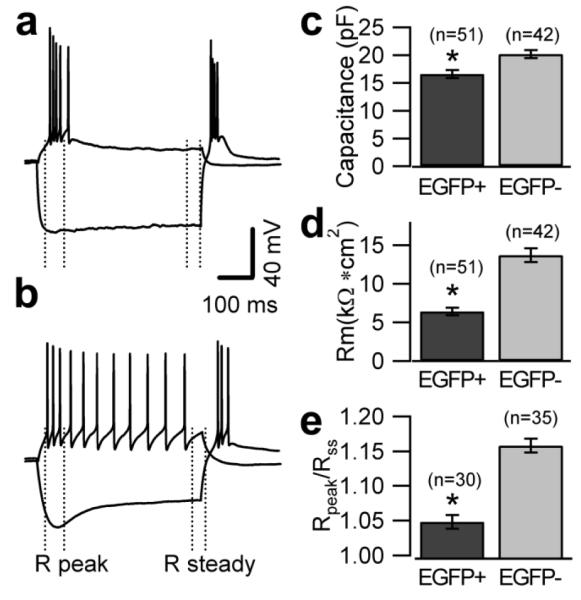
a, b, Voltage recordings from one EGFP-positive (a) and one EGFP-negative (b) UBC in response to 500 ms-long injections of hyperpolarizing (−220 pA for EGFP-positive UBC and −80 pA for EGFP-negative UBC) and depolarizing current (40 pA for EGFP-positive UBC and EGFP-negative UBC). The injected hyperpolarizing current was tuned to produce equal peak voltage responses (−130 mV) in the two cells. The dotted lines indicate the trace segments used for the determination of peak and steady state input resistance. c, Bar chart comparing the value of the capacitance in two cell types. Capacitance values were 16.6±0.7 pF in EGFP-positive and 20.2±0.7 pF in EGFP-negative UBCs (n= 51 and 42, respectively, p<0.05). d, Bar chart comparing the value of the specific membrane resistance in two cell types. Specific resistance was determined assuming specific membrane capacitance of 1 μF/cm2. EGFP-positive UBCs have lower specific resistance than EGFP-negative UBCs (6.4±0.5 kΩ*cm2 and 13.7±0.9 kΩ*cm2, n=51 and 42, respectively, p<0.05). e, Bar chart showing the ratio of the peak to steady state input resistance in the two cell types. The ratio was 1.16±0.01 in EGFP-negative UBCs and 1.05±0.01 in EGFP-positive UBCs (n=35 and 30, respectively, p<0.05).
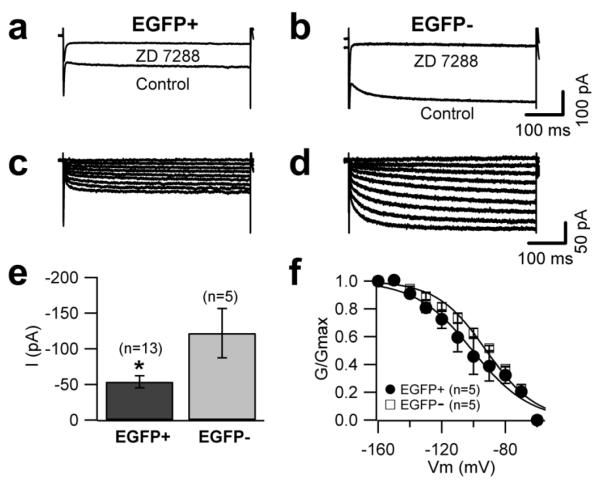
Current clamp recordings in response to injection of hyperpolarizing currents showed that the amplitude of the membrane potential “sag” elicited by hyperpolarizations from −70 mV to −130 mV was larger in EGFP-negative than in EGFP-positive UBCs. The ratio of the peak to steady state input resistance was 1.16±0.01 in EGFP-negative and 1.05±0.01 in EGFP-positive UBCs (n=35 and 30, respectively, p<0.05; Fig. 4a, b, e). Voltage-clamp recordings were then performed to better characterize this difference. Hyperpolarization-activated currents were recorded in control condition and in the presence of the Ih blocker ZD7288 (100 μM); in keeping with the current clamp data, the size of Ih was larger in EGFP-negative neurons (−121.9±34.6 vs −53.7±8.4 pA at −140 mV; p<0.05, Fig. 5c). No differences were found in the voltage-dependence of Ih activation between the two UBC subtypes (Fig. 5d)
Figure 5. Differential Ih expression in EGFP-positive and EGFP-negative UBCs.
Representative traces of currents recorded in EGFP-positive (a) and EGFP-negative (b) UBCs in response to 500 ms-long voltage steps in control conditions and after bath application of 100 μM Zd7288 (at −140 mV). c, d, Traces of the ZD7288-sensitive current obtained by digital subtraction. Cells were held at −60 mV and clamped at potentials between −60 and −160 mV in 10 mV steps. The bar chart in (e) represents the size of ZD7288 sensitive currents (at −140 mV) in EGFP-positive and EGFP-negative UBCs; Ih was larger in EGFP-negative UBCs. f, Conductance-voltage relationship of the ZD7288 sensitive current. The data points were fit with a Boltzmann equation. Half points and slopes of the fits were not statistically different between the two populations.
The firing phenotype, recorded in the whole-cell configuration, also differentiated the two cell populations (Fig. 6). EGFP-positive UBCs showed bursting behavior and in 63% of the cases were silent without current injection (Vm was −60.5±0.8 mV, n=32, Fig. 6a, e), partly resembling the phenotype described by Diana et al. [12] in rat slices, while the vast majority of EGFP-negative cells (85%, in whole-cell recordings) were spontaneously and regularly firing (Fig. 6b, d, e), similar to what previously reported in wild type mice by Russo et al. [10]. The diverse firing pattern of the two populations was apparent in the coefficient of variation of the instantaneous firing frequency (CV), which was considerably higher in EGFP-positive UBCs. In whole cell recordings, the CV was 1.07±0.2 for EGFP-positive cells and 0.45±0.08 for EGFP-negative cells (n=18 and 31; Fig. 6f; P <0.05). Intracellular dialysis might affect the delicate conductance equilibrium that controls action potential generation; therefore, the presence and regularity of intrinsic firing was also studied using extracellular recordings (cell-attached) to avoid interfering with the intracellular milieu. In this configuration, the results were similar to those in whole cell; 49% of the EGFP-positive and 88% of the EGFP-negative UBCs were spontaneously firing, and the CVs were 0.53±0.07 and 0.32±0.03, respectively (n=26 and 41; p<0.05, Fig. 6e, f).
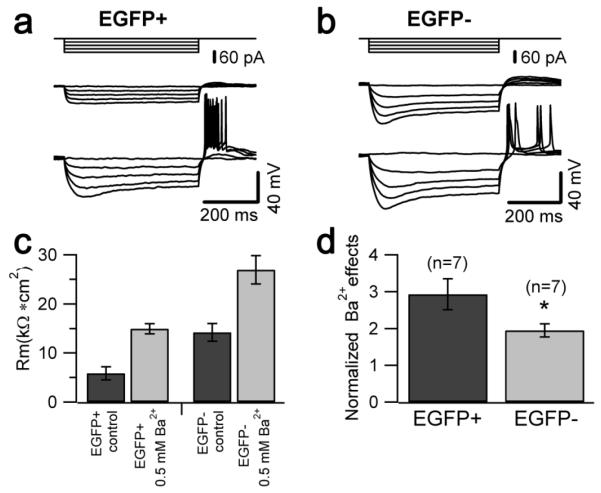
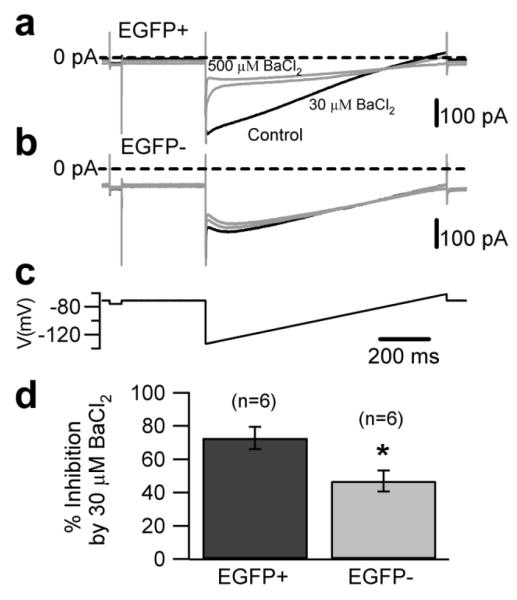
What could be the mechanism underlying the different input resistance in the two populations? We previously showed that intrinsic UBC firing is regulated by group II mGluR receptor-coupled inward rectifier potassium currents [10]. Thus, we hypothesized that the differences between the properties of the two cell types could be mediated, at least in part, by differential expression of these channels. To test this hypothesis we compared the effect of extracellular barium (0.5 mM), a broad spectrum blocker of inward rectifier currents, in the two cell populations. Figure 7 shows that the barium-sensitive current was larger in EGFP-positive UBCs (at −120 mV the current was −93.9±15.1 pA and −36.9±12.6 pA in EGFP-positive and negative UBCs, respectively, 6 cells in each group, p<0.05; Fig. 7d). Accordingly, the effect of barium on the input resistance was larger in EGFP-positive cells (3 fold, vs. 2 fold in EGFP-negative cells, Fig. 7e), supporting the hypothesis that background potassium channels, whose identity still needs to be characterized, are more prominently expressed in EGFP-positive cells. Interestingly, barium (0.5 mM, in the bath) appeared to act more slowly in EGFP-negative cells (not shown); the most conservative explanation for the slow onset of the effect is that the saturating barium concentration is lower in EGFP-positive than in EGFP-negative UBCs. In keeping with this hypothesis, 30 μM barium blocked 72.8±6.7% of the current blocked by 0.5 mM barium in EGFP-positive cells, but only 47±6.3% in EGFP-negative cells (6 cells in each group, p<0.05; Fig. 8), suggesting that the background currents in the two cell types differ not only in density, but also in their molecular composition.
Figure 7. Differential effects of Ba2+ on EGFP-positive and EGFP-negative UBCs.
a, b, Voltage traces recorded in an EGFP-positive (a) and an EGFP-negative UBC (b) in response to 500 ms-long hyperpolarizing current injections (from 0 to −80 pA, 20 pA steps, upper traces) in control conditions (middle traces) and after bath application of Ba2+ (lower traces). c, Bar chart summarizing the effect of 0.5 mM Ba2+ on membrane resistance in EGFP-positive and EGFP-negative UBCs (n=7). Specific membrane resistance in EGFP-positive UBCs was 5.86±1.33 kΩ*cm2 in control condition (n=7) and increased following Ba2+ application (14.95±1.05 kΩ*cm2), whereas resistance was increased from 14.21±1.82 kΩ*cm2 (control condition, n=7) to 26.97±2.89 kΩ*cm2 (Ba2+ application) in EGFP-negative UBCs. d, Bar chart of the fractional effect of Ba2+ on the specific membrane resistance in each cell type. The fractional effect of Ba2+ was significantly larger in EGFP-positive than in EGFP-negative UBCs.
Figure 8. Background currents have different properties in the two UBC subtypes.
a, b, Whole-cell recordings of background potassium currents in control condition (black traces) and in the presence of 30 and 500 μM BaCl2 (gray traces) in an EGFP-positive (a) and an EGFP-negative UBC (b). c, d The currents were obtained in response to a slow voltage ramp (c, from −140 mV to −65 mV, 1 second duration). The bar chart in d, compares the fractional block induced by 30 μM BaCl2 in EGFP-positive and EGFP-negative UBCs. Fractional block was calculated assuming that 500 μM BaCl2 blocks 100% of the barium-sensitive current.
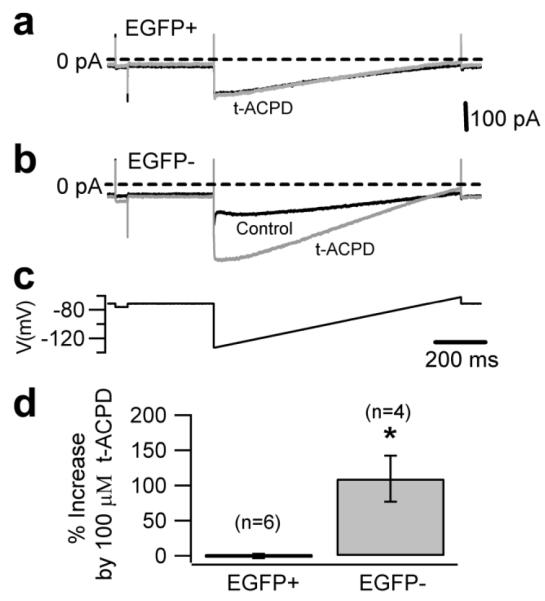
We had previously shown that the GIRK current in UBCs is heavily regulated by activation of group II mGluRs [11]. Thus, we tested whether potassium current modulation by type 2 mGluRs is detectable in both the UBC subtypes. As expected, in whole-cell configuration the current of EGFP-negative cells was strongly increased (by 109.5±32.6%, n=4) by the broad spectrum mGluR agonist t-ACPD (100 μM); surprisingly, however, the current of the EGFP-positive cells was not affected (the current in t-ACPD decreased by 0.2±3.3%; 6 cells, Fig. 9). This was unexpected because we had also suggested that group II mGluRs are expressed by all UBCs. Therefore we performed additional experiments in which EGFP-positive UBCs were recorded in the cell attached configuration, which preserves intact all intracellular pathways. Notably, all (8/8) of the EGFP-positive cells measured showed a strong response to application of the group II mGluR agonist APDC (10 μM), which completely abolished intrinsic firing in control conditions and after it was stimulated by activation of group I mGluRs with DHPG (Fig. 10), thus confirming that all UBCs express group II mGluRs, although the coupling with ion channels appears to be mediated by pathways that, contrary to the EGFP-negative cells, are sensitive to intracellular dialysis.
Figure 9. Metabotropic glutamate receptors differentially modulate the whole cell background potassium currents in UBCs.
a, Whole-cell recording of the background potassium current in EGFP-positive UBCs in control conditions (black traces) and in the presence of 100 μM t-ACPD (gray traces). The whole-cell current in EGFP-positive UBCs was not affected by 100 μM t-ACPD. b, Bath application of 100 μM t-ACPD increased the background potassium current in EGFP-negative UBCs by 109.5±32.6 % compared to control (at −120 mV). The background potassium currents were recorded in response to a slow voltage ramp from −140 mV to −65 mV for 1 second (c).
Because GIRK channels can be coupled to GABAB receptors, we tested whether this was also the case in UBCs. In whole-cell recordings neither the GABAB agonist baclofen (50 μM), nor the antagonist CGP55845 (2 μM) had any significant effect on the current of EGFP-positive cells (when data from all 6 recorded cells were pooled together; data not shown). However, in one of 6 EGFP-positive cells a clean, reversible, effect of baclofen was detected. This observation could have two main explanations: i) a cellular heterogeneity within the EGFP-positive UBC population; ii) a current rundown due to the intracellular dialysis in whole-cell configuration. To solve this riddle we performed cell-attached recordings to maintain intact the intracellular milieu. In this configuration, all (6/6) EGFP-positive cells showed a clear response to baclofen, which reversibly reduced or stopped intrinsic firing (Fig. 11a), while none of the tested EGFP-negative cells responded to baclofen (Fig. 11b; n= 5).
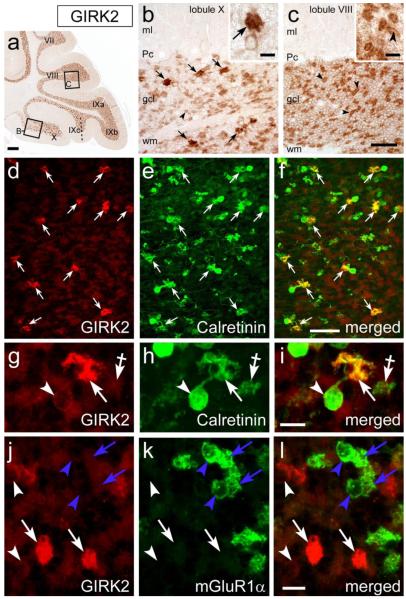
These data show that background potassium currents, most likely mediated by KCNJ subunits, differ in their size and modulation between the two UBC subtypes. We hypothesized that this difference could be correlated with the type of KCNJ subunit expressed in the two cell types. In sections labeled by antibody to GIRK2 (KCNJ6) granule cells and glomeruli were distinctly immunostained (Fig. 12a). Upon close inspection of lobules X and IX, however, several UBC somata and brushes appeared more prominently labeled than granule cells (Fig. 12b, c). The GIRK2-labeled UBCs matched the CR+ UBC in distribution (compare Fig. 1c with 12a). Double-immunostaining and confocal imaging showed that only 1 out of 689 CR+ UBCs (N=3mice) lacked GIRK2 immunolabeling. All GIRK2-positive UBC were CR+ (Fig. 12di), whereas mGluR1α+ (EGFP-positive) UBCs were unlabeled (Fig. 12j-l). Thus, the dialysis-resistant coupling of the UBC background current to group II mGluR appears correlated with the expression of the GIRK2 subunit, as this is only expressed in EGFP-negative cells, while the dialysis-sensitive coupling to both GABAB and type 2 mGluRs is probably correlated with the expression of some other still unidentified channel subunit.
Figure 12. The brushes of CR+ UBCs are intensely labeled by GIRK2 antibody.
ac, Images from deparaffinized, DAB immunoreacted parasagittal sections of wild-type mouse cerebellum. At low magnification GIRK2 immunoperoxidase labeling is evenly localized to the granular layer across the cerebellar lobules. In addition, the granular layer of folium IXc and lobule X contains GIRK2-positive UBCs, whose brushes are much more intensely labeled than the parent cell bodies. (arrows in panel b and inset b). Granule cells are much less intensely anti-GIRK2 immunoreative in lobule X and folium IXc (compare panel b to panel c) than in other vermal lobules. Panels b and c show boxed areas from panel a. Molecular layer, ml; Purkinje cell layer, Pc; white matter, wm. d-l, Confocal immunofluorescence images from cerebellar cryosections of wild type (d-i) and Tg(Grp-EGFP) mice (j-l). Intense GIRK2 immunoreactivity is present in the brushes (white arrows) of CR+ UBCs (white arrowheads indicate UBCs cell bodies), By contrast, mGluR1 + UBCs are at background level (blue arrowheads and arrows in panels j-l). Crossed-arrows in panels g-i, point to a CR+/GIRK2-negative mossy fiber terminal. Scale bars: a, 200 μm; b-f, 50 μm; g-l and insets in b, c, 10 μm.
Discussion
We performed immunocytochemical studies and whole cell patch clamp recordings in lobules IX and X of slices from transgenic mice in which EGFP expression linked to the Grp promoter allows the identification of mGluR1α+ UBCs. Our morphological data confirm the differential distribution of mGluR1α+ vs. CR+ UBCs in the GENSAT Tg(Grp-EGFP) mice and demonstrate that CR+ (EGFP-negative) and mGluR1α+ (EGFP-positive) UBCs differ significantly in cell body size. Moreover, our electrophysiological data show that these two UBC populations also differ with regard to input resistance, Ih expression, firing phenotype, and in the size and pharmacological profile of the background potassium conductance (summarized in Table 1), supporting the notion of a profound diversity between the two UBC populations. This notion is further supported by multivariate statistical analysis performed on the whole set of recorded UBCs using four variables (specific membrane resistance, capacitance, inter-spike interval ratio and coefficient of variation of firing; Fig. 13). Both principal component and cluster analysis show an almost perfect separation of EGFP-negative and EGFP-positive UBCs, supporting the idea that they identify two separate neuronal populations. Notably the few points that seem misplaced all represent EGFP-negative neurons, suggesting that they may have been mGluR1α+ UBCs in which EGFP expression was too low to be detected.
Table 1.
Synopsis of UBC properties
| UBC subset | Size (μm2) |
Cap (pF) |
Rm (kΩ*cm2) |
Intrinsic firing (%) |
ISI ratio (WCR) |
Firing CV (WCR) |
Modulation |
|---|---|---|---|---|---|---|---|
|
EGFP-positive
(mGluR1α+) |
48.3±0.4 (n=250) |
16.6 ±0.7 (n=51) |
6.4 ±0.5 (n=51) |
49.1 (c- att.) 37.3 (wcr) |
0.3±0.1 (n=46) |
1.07±0.20 (n=18) |
GroupII mGluR GABAB (c-att. only) |
|
EGFP-negative
(Calretinin+) |
63.2±0.6 (n=250) |
20.2 ±0.7 (n=42) |
13.7 ± 0.9 (n=42) |
87.5 (c- att.) 85.0 (wcr) |
0.56±0.04 (n=41) |
0.45±0.08 (n=31) |
GroupII mGluR (wcr) |
c-att. – cell-attached recording; wcr – whole cell recording
As our electrophysiological measurements were performed on both homozygous and heterozygous Tg(Grp-EGFP) mice, and thus the subset of EGFP-negative UBCs might have included some mGluR1α+ UBCs (expressing EGFP below detection level) in addition to CR+ UBCs, the cell subclass-specific functional differences between UBCs may actually be even larger than we observed. Indeed, figure 13 suggests that a few (3-4) EGFP-negative cells might have been mGluR1α+ UBCs in which EGFP expression was below detection; if these cells were removed from the average data, the differences between the two classes would be even stronger. Additionally, the known relationship between size of the neuronal somatodendritic compartment and the axonal volume and axonal branching [22, 23] suggests that mGluR1α+ UBCs and CR+ UBCs may also differ with regard to the divergence of their outputs.
Distinct subpopulation properties may help reconcile previous findings
While the capacitance value in UBCs was always larger than in granule cells, it differed significantly between the two UBC subpopulations. This observation may help reconcile some of the differences in UBC firing phenotypes that were previously reported. Diana et al. [12] described rat UBCs as bursting neurons with capacitance between 8 and 15 pF (the same group previously reported capacitance values between 10 and 20 pF, [24]), while Russo et al. [10] described murine UBCs as intrinsically firing, non adapting neurons with capacitance of 23±1 pF.
In the present study we show that EGFP-negative UBCs, which by and large correspond to the CR+ UBCs, have capacitance of 21.2±0.7 pF (similar to the 23±1 pF, p>0.05), while the EGFP-positive UBCs, which represents a substantial proportion of the mGluR1α+ UBCs have capacitance of 17.6±0.6 pF. Thus it is reasonable to propose that the differences between the results from the two groups of investigators are, at least in part, the consequence of a cell selection bias leading each group to study almost exclusively cells belonging to only one of the sub-types, although differences in factors such as recording temperature, animal age or species may also contribute. The hypothesis that the two labs focused on different UBC subpopulations is further supported by the observation that, in the present study, the firing pattern of EGFP-negative UBCs closely resemble that described by Russo et al. [10, 11], while the EGFP-positive UBCs showed more irregular, burst-like, firing reminiscent of that described by Diana et al. [12]. The similarity of the present results with those obtained in wild type CD-1 mice by Russo et al. [10, 11] also suggests that the potential effects, if any, of the EGFP-transgene expression on the cell size and electrophysiological properties are negligible.
Modulation of background potassium current is cell-type specific
Potassium channels mediate a large fraction of the background current in UBCs. Expression of GIRK currents within the UBC population had been reported previously, albeit without definition of the UBC subclasses. Knoflach and Kemp [25] described G-protein-coupled inwardly rectifying potassium currents sensitive to the group II mGluR agonists DCG-IV and LY354740 in acutely dissociated UBCs. GIRK2 immunoreactivity in CR+ UBCs, validated by lack of expression in Girk2 knockout mice, was further shown in a Down syndrome mouse model by Harashima et al. [26]; moreover, Aguado et al. [27] reported that virtually all the UBCs that express GIRK2 also express GIRK3. Additionally, Russo et al. [11] showed that GIRK channel modulation through group II metabotropic glutamate receptors regulates the firing phenotype in UBCs (most likely CR+). Our immunocytochemical analysis shows that expression of GIRK2 was only detectable in CR+ (EGFP-negative) UBCs, whose current was sensitive to modulation by group II mGluR. This finding suggests that the GIRK2 subunit provides most of the background current in EGFP-negative UBCs and is selectively modulated in a cell dialysis-resistant manner by group II mGluR. Interestingly, in the weaver mouse KCNJ6 - the gene coding for GIRK2 – undergoes an amino acid substitution in the pore-forming region that results in the loss of GIRK2 currents; the mutation leads to degeneration of granule cells in the median cerebellum and dopaminergic neurons in the substantia nigra pars compacta [28, 29]. Consequently, the apparent lack of GIRK2 expression in the mGluR1α+ UBCs may suggest that this UBC subclass would be spared in homozygous weaver mutant mice, whereas most CR+ UBCs might undergo cell death.
In keeping with the idea that the group II mGluR modulation observed in whole-cell recordings is selective for GIRK2-containing channels, the potassium current in the mGluR1α+ UBCs was insensitive to group II mGluR activation in this configuration. However, in cell-attached configuration, in which the intracellular pathways are intact, the firing of EGFP-positive UBCs, which do not express GIRK2, was down-modulated both by group II mGluR and GABAB receptor activation, suggesting the activation of a inhibitory current, most likely carried by potassium ions. GABAB modulation, on the contrary, was not observed in EGFP-negative cells, suggesting that GIRK2 channels are not coupled to GABAB in UBCs. However, this selective coupling does not represent general rule, because GIRK2 mediated currents are activated by GABAB in neurons of the substantia nigra [30].
A final consideration concerns the pathways involved in mGluR and GABAB signaling in EGFP-positive UBCs. In whole-cell recordings, GABAB activation had detectable effects in only 1 of 6 cells and no effect of mGluRs was detected; however, all of the EGFP-positive cells recorded in cell-attached were modulated by activation of these metabotropic receptors. This result was unexpected because activation of GIRK channels is thought to be mediated by direct binding of Gβγ dimers to the channels [31, 32] and therefore should withstand intracellular dialysis. Thus, our data may suggest an unusual coupling between the metabotropic receptors and the GIRK channels in UBCs. More studies will be needed to identify the pathways involved in this still undefined signaling cascade.
Diverse electrophysiological properties suggest peculiar roles of UBC subpopulations
Intrinsically firing cells provide fine output modulation in response to diverse inputs. In particular, EGFP-negative UBCs, which according to our immunohistochemical data are in large part CR+, show a nearly monotonic input/output function over a relatively large input range [10]. Thus such cells, while amplifying the vestibular input as a consequence of their divergent synapses onto their postsynaptic targets, provide a fine-tuned amplification that follows almost linearly the input properties. Bursting neurons, such as the EGFP-positive UBCs, on the other hand, may be ideally suited to act as supra-linear signal amplifiers because any input large enough to cross threshold will lead to a burst of action potentials, thus enhancing the signal downstream.
Moreover, a bursting phenotype allows temporal separation, and possibly also organization of temporally randomly distributed inputs, as action potential bursts may lead to inactivation of sodium channels and activation of calcium-dependent potassium channels, creating a refractory period at the end of the burst and leading to clear temporal segregation of inputs. The fact that the presence of CR+ UBCs is by and large limited to a relatively well defined portion of the mouse cerebellum (lobule X and IXc; Fig. 1) is intriguing and suggests a selective function of these cells in cerebellar circuitries. Possible correlations between this function and a specific connectivity or any other functional and/or morphological property of this particular cerebellar area remain to be assessed. Whereas it has been demonstrated that primary vestibular fibers innervate CR+ UBCs [3], the inputs of mGluR1α+ UBCs remain to be established. The differential modulation of the background current suggests that the inputs to the two cell populations may also differ. Moreover, the divergence and mode of distribution of the axons originating from the smaller mGluR1α+ UBCs and the larger CR+ UBCs are still unknown.
An additional step in the elucidation of the function of cerebellar UBCs will therefore require a more detailed study of their synaptic properties to determine whether the two UBC subpopulations share the same inputs and show any type of synaptic plasticity, and the extent by which the differences between their somatodendritic compartments extend to their axonal compartments.
In conclusion, morphological, immunocytochemical, and electrophysiological data cumulatively provide a strong body of evidence suggesting that the mGluR1α+ and the CR+ UBC subpopulations perform different functions in the cerebellar microcircuits.
Acknowledgments
This work was supported by NIH grant RO1 09904. Paraffin embedding and sectioning of the paraffin embedded blocks was performed by Northwestern University Mouse Histology and Phenotyping Laboratory, which is supported by a Cancer Center Support Grant (NCI CA060553). The authors wish to thank Drs. Joe P. Doyle, Joseph D. Dougherthy and Nataniel Heintz, The Rockefeller University, New York, NY, for breeding pairs of Tg(Grp-EGFP)DV197 mice.
Footnotes
Conflict of interest No conflict of interest exist for any of the authors.
References
- 1.Nunzi MG, Shigemoto R, Mugnaini E. Differential expression of calretinin and metabotropic glutamate receptor mGluR1alpha defines subsets of unipolar brush cells in mouse cerebellum. J Comp Neurol. 2002;451:189–99. doi: 10.1002/cne.10344. [DOI] [PubMed] [Google Scholar]
- 2.Mugnaini E, Sekerková G, Martina M. The unipolar brush cell: a remarkable neuron finally receiving deserved attention. Brain Res Rev. 2010;66:220–45. doi: 10.1016/j.brainresrev.2010.10.001. [DOI] [PMC free article] [PubMed] [Google Scholar]
- 3.Diño MR, Perachio AA, Mugnaini E. Cerebellar unipolar brush cells are targets of primary vestibular afferents: an experimental study in the gerbil. Exp Brain Res. 2001;140:162–70. doi: 10.1007/s002210100790. [DOI] [PubMed] [Google Scholar]
- 4.Jaarsma D, Diño MR, Cozzari C, Mugnaini E. Cerebellar choline acetyltransferase positive mossy fibres and their granule and unipolar brush cell targets: a model for central cholinergic nicotinic neurotransmission. J Neurocytol. 1996;25:829–42. doi: 10.1007/BF02284845. [DOI] [PubMed] [Google Scholar]
- 5.Nunzi MG, Russo M, Mugnaini E. Vesicular glutamate transporters VGLUT1 and VGLUT2 define two subsets of unipolar brush cells in organotypic cultures of mouse vestibulocerebellum. Neuroscience. 2003;122:359–71. doi: 10.1016/s0306-4522(03)00568-2. [DOI] [PubMed] [Google Scholar]
- 6.Nunzi MG, Mugnaini E. Aspects of the neuroendocrine cerebellum: expression of secretogranin II, chromogranin A and chromogranin B in mouse cerebellar unipolar brush cells. Neuroscience. 2009;162:673–87. doi: 10.1016/j.neuroscience.2009.02.017. [DOI] [PubMed] [Google Scholar]
- 7.Sekerková G, Ilijic E, Mugnaini E. Time of origin of unipolar brush cells in the rat cerebellum as observed by prenatal bromodeoxyuridine labeling. Neuroscience. 2004;127:845–58. doi: 10.1016/j.neuroscience.2004.05.050. [DOI] [PubMed] [Google Scholar]
- 8.Dieudonné S. Submillisecond kinetics and low efficacy of parallel fibre-Golgi cell synaptic currents in the rat cerebellum. J Physiol. 1998;510(Pt 3):845–66. doi: 10.1111/j.1469-7793.1998.845bj.x. [DOI] [PMC free article] [PubMed] [Google Scholar]
- 9.Forti L, Cesana E, Mapelli J, D’Angelo E. Ionic mechanisms of autorhythmic firing in rat cerebellar Golgi cells. J Physiol. 2006;574:711–29. doi: 10.1113/jphysiol.2006.110858. [DOI] [PMC free article] [PubMed] [Google Scholar]
- 10.Russo MJ, Mugnaini E, Martina M. Intrinsic properties and mechanisms of spontaneous firing in mouse cerebellar unipolar brush cells. J Physiol. 2007;581:709–24. doi: 10.1113/jphysiol.2007.129106. [DOI] [PMC free article] [PubMed] [Google Scholar]
- 11.Russo MJ, Yau HJ, Nunzi MG, Mugnaini E, Martina M. Dynamic metabotropic control of intrinsic firing in cerebellar unipolar brush cells. J Neurophysiol. 2008;100:3351–60. doi: 10.1152/jn.90533.2008. [DOI] [PMC free article] [PubMed] [Google Scholar]
- 12.Diana MA, Otsu Y, Maton G, Collin T, Chat M, Dieudonné S. T-type and L-type Ca2+ conductances define and encode the bimodal firing pattern of vestibulocerebellar unipolar brush cells. J Neurosci. 2007;27:3823–38. doi: 10.1523/JNEUROSCI.4719-06.2007. [DOI] [PMC free article] [PubMed] [Google Scholar]
- 13.Ruigrok TJ, Hensbroek RA, Simpson JI. Spontaneous activity signatures of morphologically identified interneurons in the vestibulocerebellum. J Neurosci. 2011;31:712–24. doi: 10.1523/JNEUROSCI.1959-10.2011. [DOI] [PMC free article] [PubMed] [Google Scholar]
- 14.Simpson JI, Hulscher HC, Sabel-Goedknegt E, Ruigrok TJ. Between in and out: linking morphology and physiology of cerebellar cortical interneurons. Prog Brain Res. 2005;148:329–40. doi: 10.1016/S0079-6123(04)48026-1. [DOI] [PubMed] [Google Scholar]
- 15.Doyle JP, Dougherty JD, Heiman M, Schmidt EF, Stevens TR, Ma G, et al. Application of a translational profiling approach for the comparative analysis of CNS cell types. Cell. 2008;135:749–62. doi: 10.1016/j.cell.2008.10.029. [DOI] [PMC free article] [PubMed] [Google Scholar]; Cell. 2009;139:1022. Erratum in: [Google Scholar]
- 16.Gong S, Zheng C, Doughty ML, Losos K, Didkovsky N, Schambra UB, et al. A gene expression atlas of the central nervous system based on bacterial artificial chromosomes. Nature. 2003;425:917–25. doi: 10.1038/nature02033. [DOI] [PubMed] [Google Scholar]
- 17.Pearson K. On lines and places of closest fit to systems of points in space. Philosophical Magazine. 1901;2:559–72. [Google Scholar]
- 18.Diño MR, Willard FH, Mugnaini E. Distribution of unipolar brush cells and other calretinin immunoreactive components in the mammalian cerebellar cortex. J Neurocytol. 1999;28:99–123. doi: 10.1023/a:1007072105919. [DOI] [PubMed] [Google Scholar]
- 19.Floris A, Diño M, Jacobowitz DM, Mugnaini E. The unipolar brush cells of the rat cerebellar cortex and cochlear nucleus are calretinin-positive: a study by light and electron microscopic immunocytochemistry. Anat Embryol (Berl) 1994;189:495–520. doi: 10.1007/BF00186824. [DOI] [PubMed] [Google Scholar]
- 20.Diño MR, Mugnaini E. Distribution and phenotypes of unipolar brush cells in relation to the granule cell system of the rat cochlear nucleus. Neuroscience. 2008;154:29–50. doi: 10.1016/j.neuroscience.2008.01.035. [DOI] [PMC free article] [PubMed] [Google Scholar]
- 21.Englund C, Kowalczyk T, Daza RA, Dagan A, Lau C, Rose MF, et al. Unipolar brush cells of the cerebellum are produced in the rhombic lip and migrate through developing white matter. J Neurosci. 2006;26:9184–95. doi: 10.1523/JNEUROSCI.1610-06.2006. [DOI] [PMC free article] [PubMed] [Google Scholar]
- 22.Chklovskii DB. Synaptic connectivity and neuronal morphology: two sides of the same coin. Neuron. 2004;43:609–17. doi: 10.1016/j.neuron.2004.08.012. [DOI] [PubMed] [Google Scholar]
- 23.Peters A, Palay S, Webster dF. The fine structure of the nervous system: the neurons and supporting cells. Saunders; Philadelphia: 1976. [Google Scholar]
- 24.Dugué GP, Dumoulin A, Triller A, Dieudonné S. Target-dependent use of co-released inhibitory transmitters at central synapses. J Neurosci. 2005;25:6490–8. doi: 10.1523/JNEUROSCI.1500-05.2005. [DOI] [PMC free article] [PubMed] [Google Scholar]
- 25.Knoflach F, Kemp JA. Metabotropic glutamate group II receptors activate a G protein-coupled inwardly rectifying K+ current in neurones of the rat cerebellum. J Physiol. 1998;509(Pt 2):347–54. doi: 10.1111/j.1469-7793.1998.347bn.x. [DOI] [PMC free article] [PubMed] [Google Scholar]
- 26.Harashima C, Jacobowitz DM, Stoffel M, Chakrabarti L, Haydar TF, Siarey RJ, et al. Elevated expression of the G-protein-activated inwardly rectifying potassium channel 2 (GIRK2) in cerebellar unipolar brush cells of a Down syndrome mouse model. Cell Mol Neurobiol. 2006;26:719–34. doi: 10.1007/s10571-006-9066-4. [DOI] [PMC free article] [PubMed] [Google Scholar]
- 27.Aguado C, Colón J, Ciruela F, Schlaudraff F, Cabañero MJ, Perry C, et al. Cell type-specific subunit composition of G protein-gated potassium channels in the cerebellum. J Neurochem. 2008;105:497–511. doi: 10.1111/j.1471-4159.2007.05153.x. [DOI] [PubMed] [Google Scholar]
- 28.Patil N, Cox DR, Bhat D, Faham M, Myers RM, Peterson AS. A potassium channel mutation in weaver mice implicates membrane excitability in granule cell differentiation. Nat Genet. 1995;11:126–9. doi: 10.1038/ng1095-126. [DOI] [PubMed] [Google Scholar]
- 29.Surmeier DJ, Mermelstein PG, Goldowitz D. The weaver mutation of GIRK2 results in a loss of inwardly rectifying K+ current in cerebellar granule cells. Proc Natl Acad Sci U S A. 1996;93:11191–5. doi: 10.1073/pnas.93.20.11191. [DOI] [PMC free article] [PubMed] [Google Scholar]
- 30.Koyrakh L, Luján R, Colón J, Karschin C, Kurachi Y, Karschin A, et al. Molecular and cellular diversity of neuronal G-protein-gated potassium channels. J Neurosci. 2005;25:11468–78. doi: 10.1523/JNEUROSCI.3484-05.2005. [DOI] [PMC free article] [PubMed] [Google Scholar]
- 31.Misgeld U, Bijak M, Jarolimek W. A physiological role for GABAB receptors and the effects of baclofen in the mammalian central nervous system. Progress in Neurobiology. 1995;46:423–62. doi: 10.1016/0301-0082(95)00012-k. [DOI] [PubMed] [Google Scholar]
- 32.Reuveny E, Slesinger PA, Inglese J, Morales JM, Iniguez-Lluhi JA, Lefkowitz RJ, et al. Activation of the cloned muscarinic potassium channel by G protein beta gamma subunits. Nature. 1994;370:143–6. doi: 10.1038/370143a0. [DOI] [PubMed] [Google Scholar]


