Abstract
Evaluation of the existence of a diurnal pattern of glucose tolerance after mixed meals is important to inform a closed-loop system of treatment for insulin requiring diabetes. We studied 20 healthy volunteers with normal fasting glucose (4.8 ± 0.1 mmol/L) and HbA1c (5.2 ± 0.0%) to determine such a pattern in nondiabetic individuals. Identical mixed meals were ingested during breakfast, lunch, or dinner at 0700, 1300, and 1900 h in randomized Latin square order on 3 consecutive days. Physical activity was the same on all days. Postprandial glucose turnover was measured using the triple tracer technique. Postprandial glucose excursion was significantly lower (P < 0.01) at breakfast than lunch and dinner. β-Cell responsivity to glucose and disposition index was higher (P < 0.01) at breakfast than lunch and dinner. Hepatic insulin extraction was lower (P < 0.01) at breakfast than dinner. Although meal glucose appearance did not differ between meals, suppression of endogenous glucose production tended to be lower (P < 0.01) and insulin sensitivity tended to be higher (P < 0.01) at breakfast than at lunch or dinner. Our results suggest a diurnal pattern to glucose tolerance in healthy humans, and if present in type 1 diabetes, it will need to be incorporated into artificial pancreas systems.
A better understanding of the factors involved in glucose homeostasis is crucial to develop physiological models that can be incorporated into an optimal personalized artificial endocrine pancreas to improve glucose control, minimize glucose variability, and thus reduce morbidity and target-organ complications in individuals with diabetes mellitus, especially type 1 diabetes. These factors include, but are not limited to, variabilities introduced by diurnal differences in postprandial insulin secretion and action, timing and pattern of meal glucose appearance, and changes in physical activity.
Investigations evaluating diurnal pattern of glucose excursions have provided conflicting and confusing results. Although earlier studies (1) showed higher postprandial insulin concentrations in the morning than evening without any differences in postprandial glucose concentrations, subsequent studies (2) showed higher postprandial glucose excursion in the evening. In healthy individuals, some (2–4) but not all (1) studies suggest that postprandial glucose excursion is greater in the evening than morning. Both diminished insulin secretion and action have been considered responsible for decreased glucose tolerance in the evening (5). The reverse pattern has been observed in people with type 2 diabetes (6) and obesity (7). However, these studies (8) controlled for neither meal size, composition, and caloric content nor for levels of physical activity, all of which influence postprandial glucose excursions. Moreover, because these studies did not use glucose tracers and modeling techniques, hepatic and peripheral insulin action, meal glucose appearance, and postprandial insulin secretion were not assessed.
The purpose of this study was to determine if there are diurnal changes in postprandial glucose tolerance, insulin action, insulin secretion, and meal glucose appearance in nondiabetic subjects using the triple-tracer technique (9) while controlling for meal macronutrient composition and caloric content and levels of physical activity. We report that in healthy volunteers, glucose tolerance declines as the day advances.
RESEARCH DESIGN AND METHODS
After approval from the Mayo institutional review board and collection of signed informed consent, 20 nondiabetic subjects were recruited. Inclusion criteria were age 18–60 years, BMI <40 kg/m2, HbA1c ≤5.5%, creatinine ≤1.5 mg/dL, normal fasting glucose, and standard 75-g oral glucose tolerance test (OGTT) and normal gastric emptying to solids and liquids. Exclusion criteria were significant gastrointestinal symptoms by questionnaire, documented recent upper gastrointestinal disorder, medications affecting gastric motility (e.g., erythromycin), pregnancy or breastfeeding, or other comorbidities precluding participation. Medications (except stable thyroid hormone or hormone replacement therapy) that could influence glucose tolerance, history of diabetes in first degree family members, or prior history of diabetes were also exclusionary. Subjects did not engage in regular vigorous physical activities for 72 h before screen and study visits. Each subject underwent two screen visits.
Screen visit 1.
Subjects reported in the morning after an overnight fast to the Clinical Research Unit (CRU) of the Mayo Center for Translational Science Activities for a history, physical examination, screening laboratory tests, a 75-g standard OGTT, standard urinalysis, and resting electrocardiogram. All women of childbearing potential had a negative pregnancy test within 24 h of study visit. A dietary history was taken to ensure adherence to a weight maintaining diet consisting of at least 200 g of carbohydrates per day and that diet met American Diabetes Association guidelines for protein, fat, and carbohydrates. Body composition was also measured using dual energy X-ray absorptiometry (10).
Screen visit 2.
With the use of established scintigraphic techniques (11), gastric emptying of solids and liquids were assessed in all subjects who were eligible after the first screening visit; results were summarized as the time required for 50% of solids and separately liquids to empty (GE T1/2). Thereafter, subjects who had normal gastric emptying for solids and liquids proceeded to the inpatient study visit within 3 weeks of the second screening visit.
In-patient study visit.
All subjects spent 3 days and 4 nights in the CRU. Subjects reported at ∼1600 h on the evening before the first study day. Continuous glucose sensor and triaxial accelerometer devices were placed. They consumed a standard 10 kcal/kg meal (55% carbohydrate, 15% protein, and 30% fat) between 1700 and 1730 h. No additional food was eaten until the next morning. All subjects were provided with breakfast (B) at 0700 h, lunch (L) at 1300 h, and dinner (D) at 1900 h for 3 consecutive days. An 18-gauge intravenous catheter was inserted ∼3 h before start of each labeled mixed meal study for infusion of tracer during the triple-tracer studies. Another intravenous cannula was inserted into a forearm vein in a retrograde fashion, and the hand was placed in a heated Plexiglass box as described before (10), to draw arterialized venous blood for hormone, glucose concentrations, and tracer enrichment periodically for 6 h after initiation of the labeled meal each day.
Study meals.
All meals were provided by the CRU metabolic kitchen. Study participants received 3 days of weighed meals, three meals each day (0700, 1300, and 1900 h) with each meal comprising 33% of total estimated calorie intake based on Harris Benedict calorie requirements with ∼50 g of carbohydrate in each meal adjusted for a low level of physical activity. The macronutrient contents for the labeled meals and the six unlabeled meals that each participant consumed were identical. No snacks or calorie-containing drinks were permitted between meals. Unfinished food was weighed and excluded from calculated caloric intake. One meal daily was randomly selected per Latin square design to include 50 g of glucose labeled with [1-13C]glucose in Jell-O as the carbohydrate component. The randomization sequence for the Latin square design was restricted to three potential sequences to maximize the time between tracer meals (i.e., minimize carryover effects). This design was specifically chosen to remove confounding effects of unequal glycogen labeling and carryover effects of residual tracer glucose plasma concentrations on postprandial glucose fluxes that would have occurred if all three successive meals were labeled within a 24-h period. Furthermore, a 1-day study design would have necessitated the subjects to be resting in bed the entire day, which is not representative of daily living. While we realize that meals were not evenly spaced (every 8 h), we wished to maintain a real-world approach to our study design by timing the meals in a pragmatic fashion, i.e., breakfast at 0700 h, lunch at 1300 h, and dinner at 1900 h.
Triple-tracer mixed meal.
A primed-continuous infusion of [6,6-2H2]glucose (11.84 mg/kg free fat mass prime; 0.1184 mg/kg free fat mass/min continuous; Mass-Trace, Woburn, MA) was started 3 h (−180 min) before the first bite of the mixed meal used to estimate postprandial glucose kinetics (9). Jell-O containing [1-13C]glucose was consumed within 15 min along with the rest of the mixed meal of eggs and Canadian bacon/steak. An infusion of [6-3H]glucose was started at time 0, and the rate varied to mimic the anticipated rate of appearance of the [1-13C]glucose contained within the meal. Simultaneously, the rate of infusion of [6,6-2H2]glucose was altered to approximate the anticipated pattern of change in endogenous glucose production (EGP) (10). Blood was sampled at −180, −30, 0, 5, 10, 20, 30, 60, 90, 120, 150, 180, 270, and 360 min for measurement of tracer-to-tracee ratios, glucose, insulin, glucagon, and C-peptide concentrations.
Physical activity protocol.
We used triaxial accelerometers (Physical Activity Monitoring System) that captured data on body posture and movement in duplicate every 0.5 s. Activity data were captured using one device for each half of the body and attached over the base of the spine. The participants were given a carefully planned physical activity protocol, adherence to which was captured using the Physical Activity Monitoring System. Subjects walked 5 to 6 h each day during the study period; the distribution of their active and nonactive time varied depending upon labeled meal schedules. Walking velocity of 1.2 mph was chosen (12) totaling to about 3.5 to 4.2 miles walked during the active times mimicking activities of daily living. The activity performed was ∼2.2 metabolic equivalents while walking and averaged about 1.7 metabolic equivalents during the active times. Caloric requirements of each participant were assessed by measurement of resting and walking energy expenditure during the physical activity program. Each of the labeled meals was preceded by at least 3 h and followed by 6 h of inactivity when the subjects were resting in bed to enable periodic blood draws. By design, there was a longer period of inactivity before breakfast than the other two meals.
Analytical techniques
Hormone analyses.
C-peptide was measured on the Cobas e411 (Roche Diagnostics, Indianapolis, IN) using a two-site electrochemiluminescence immunometric assay. Insulin was measured by a two-site immunoenzymatic assay performed on the DxI automated system (Beckman Instruments, Chaska, MN) and glucagon by a direct, double antibody radioimmunoassay (Linco Research, St. Charles, MO) (10).
Glucose tracers.
Plasma samples were placed on ice, centrifuged at 4°C, separated, and stored at −80°C until assay. Plasma glucose concentration was measured using a glucose oxidase method (YSI, Yellow Springs, OH). Plasma [6-3H]glucose specific activity was measured by liquid scintillation counting as described (10). Plasma enrichment of [1-13C]glucose and [6,6-2H2]glucose were measured using gas chromatography–mass spectrometry (Thermoquest, San Jose, CA) to simultaneously quantitate C1,2 and C3–6 fragments (9).
Calculations
Glucose kinetics.
Fasting and postprandial rates of glucose turnover were calculated as described (9). The systemically infused [6-3H]glucose was used to trace the systemic rate of appearance of [1-13C]glucose contained in the meal, whereas [6,6-2H2]glucose was used to trace the rate of appearance of endogenously produced glucose. The ratio of plasma concentration of [6-3H]glucose to [1-13C]glucose was used to calculate the rate of appearance of ingested [1-13C]glucose, and the ratio of plasma concentration of [6,6-2H2]glucose to endogenously produced glucose was used to calculate EGP. The plasma concentration of endogenously produced glucose was calculated by subtracting the concentration of exogenously derived (ingested)glucose (i.e., plasma [1-13C]glucose concentration multiplied by meal [1-13C]glucose enrichment) from total plasma glucose concentration (9).
Meal indices.
The oral glucose minimal model (13,14) was used to interpret plasma glucose and insulin concentrations measured during the meal test. The model assumes that insulin action on glucose production and disposal emanates from a compartment remote from plasma, which is usually identified with the interstitium. The most important parameter of the model, estimated from data, is net insulin sensitivity, Si , which measures the overall effect of insulin to stimulate whole-body (liver and periphery) glucose disposal and inhibit glucose production. The oral C-peptide minimal model (15) was used together with the oral insulin minimal model (16) to interpret the interaction of plasma glucose with C-peptide and insulin, respectively. The oral C-peptide minimal model provides indices of dynamic (Φd) and static (Φs) β-cell responsivity to glucose, which measure the ability of rate of change of plasma glucose and plasma glucose concentration, respectively, to stimulate pancreatic insulin secretion. An index of total β-cell responsivity (Φtotal) can then be derived. The static component is derived from the ratio of the insulin secretion rate and the glucose concentrations above a threshold level at steady state. The dynamic index is a measure of the stimulatory effect of the rate at which glucose changes upon secretion of stored insulin. It is defined as the quantity of insulin released in response to maximum glucose concentration achieved during the meal normalized to the glucose increase from baseline. The total index is defined as the average increase over basal of insulin secretion over the average glucose stimulus above threshold level. The oral insulin minimal model, coupled with the C-peptide minimal model, provides estimates of both basal (HEb) and total (HE) hepatic insulin extraction. C-peptide is secreted in equimolar amounts to insulin from the β-cells, but while insulin is extracted by the liver, C-peptide is not. Hence, the simultaneous integration and modeling of insulin secretion rate from C-peptide data and insulin delivery rate to the systemic circulation from the insulin data after its passage through the liver provides an estimate of hepatic insulin extraction. In addition, a composite measure of insulin secretion appropriate to the prevailing degree of insulin resistance can be obtained by calculating dynamic (DId; composite of SI and ϕd), static (DIs; composite of SI and ϕs), and total (DItotal) disposition indices, from the product of insulin sensitivity (Si) and respective indices of β-cell responsivity (ϕ indices). All of the above models have been described in detail in the Supplementary Data.
Statistical analyses.
The experimental design translated statistically into a three-treatment (meals), three-period (study days) crossover study. SAS PROC Mixed (Cary, NC) was used to test for carryover effects and period effects using the methodology of Brown and Prescott (17). Carryover effects were presumed to be negligible given the short half-life of glucose and glucose tracers and the restricted randomization process. This assumption was supported by the statistical modeling and by the critical observation that there were no detectable glucose tracers in plasma from the prior labeled meals on days 2 and 3 in any subject. A period effect, however, was observed in the data for some outcome variables. As such, model-based estimates (least squares [LS] means) were calculated to provide an average effect over the study period. This analysis was supplemented with a sensitivity analysis of the first treatment period (i.e., similar to a parallel group design). These results were consistent with the full dataset (data not shown), so the results of the full experimental design were reported. Distributional assumptions for the mixed model were assessed using graphical displays and numerical summaries by meal-study day. Longitudinal summary statistics (18) were used to synthesize the serial measurements into a single index. Area under the curve (AUC) and incremental AUC (AUC after subtraction of the baseline area) were calculated by the trapezoidal rule. Post hoc comparison of postprandial states after meals (breakfast, lunch, and dinner) was tested at the 0.05 level of significance using the Tukey-Kramer correction factor. The overall effect of meal (i.e., a Type III analysis) was conducted using the Kenward-Rogers approach for determining degrees of freedom (19). Measures of insulin action (DI and Si ) had residuals that were mildly heteroscedastic, so the natural log-transformed values were reanalyzed as a sensitivity analysis.
RESULTS
Subject characteristics.
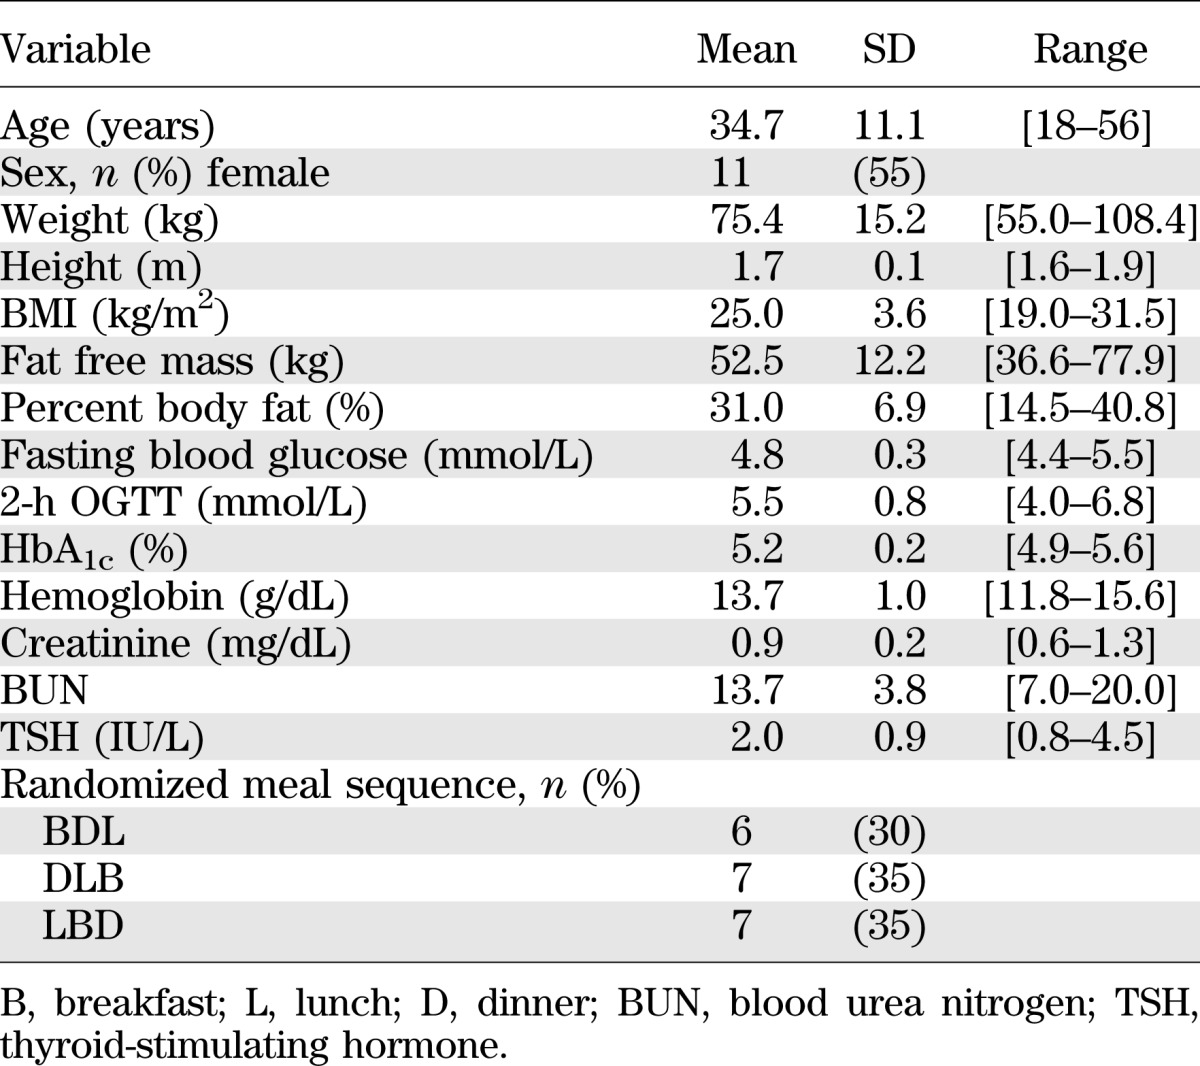
A total of 32 participants were screened for the study. There were eight screen failures (6 abnormal OGTT, 1 low hemoglobin, and 1 did not return for screen visit 2). Four additional participants were withdrawn after being successfully screened because of the inability to obtain IV access. The remaining 20 subjects completed the study and comprised the study group. Subject characteristics are provided in Table 1. Fasting glucose concentrations, HbA1c, and OGTT were normal. Physical activity levels, measured in Accelerometer Units (AU), did not differ among the 3 days. Gastric emptying rates for liquids (T1/2: M = 24.6, SD = 13.1 min) and solids (T1/2: M = 112.0, SD = 32.5 min) were normal in all subjects.
TABLE 1.
Baseline characteristics of the participants completing the three meal study (n = 20): subject anthropometric characteristics
Glucose, insulin, C-peptide, and glucagon concentrations.
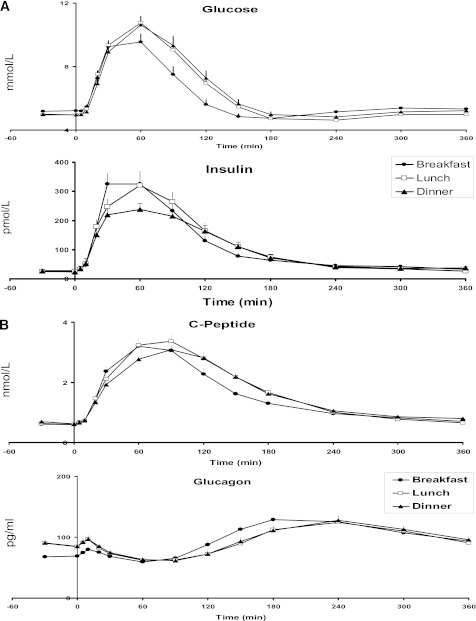
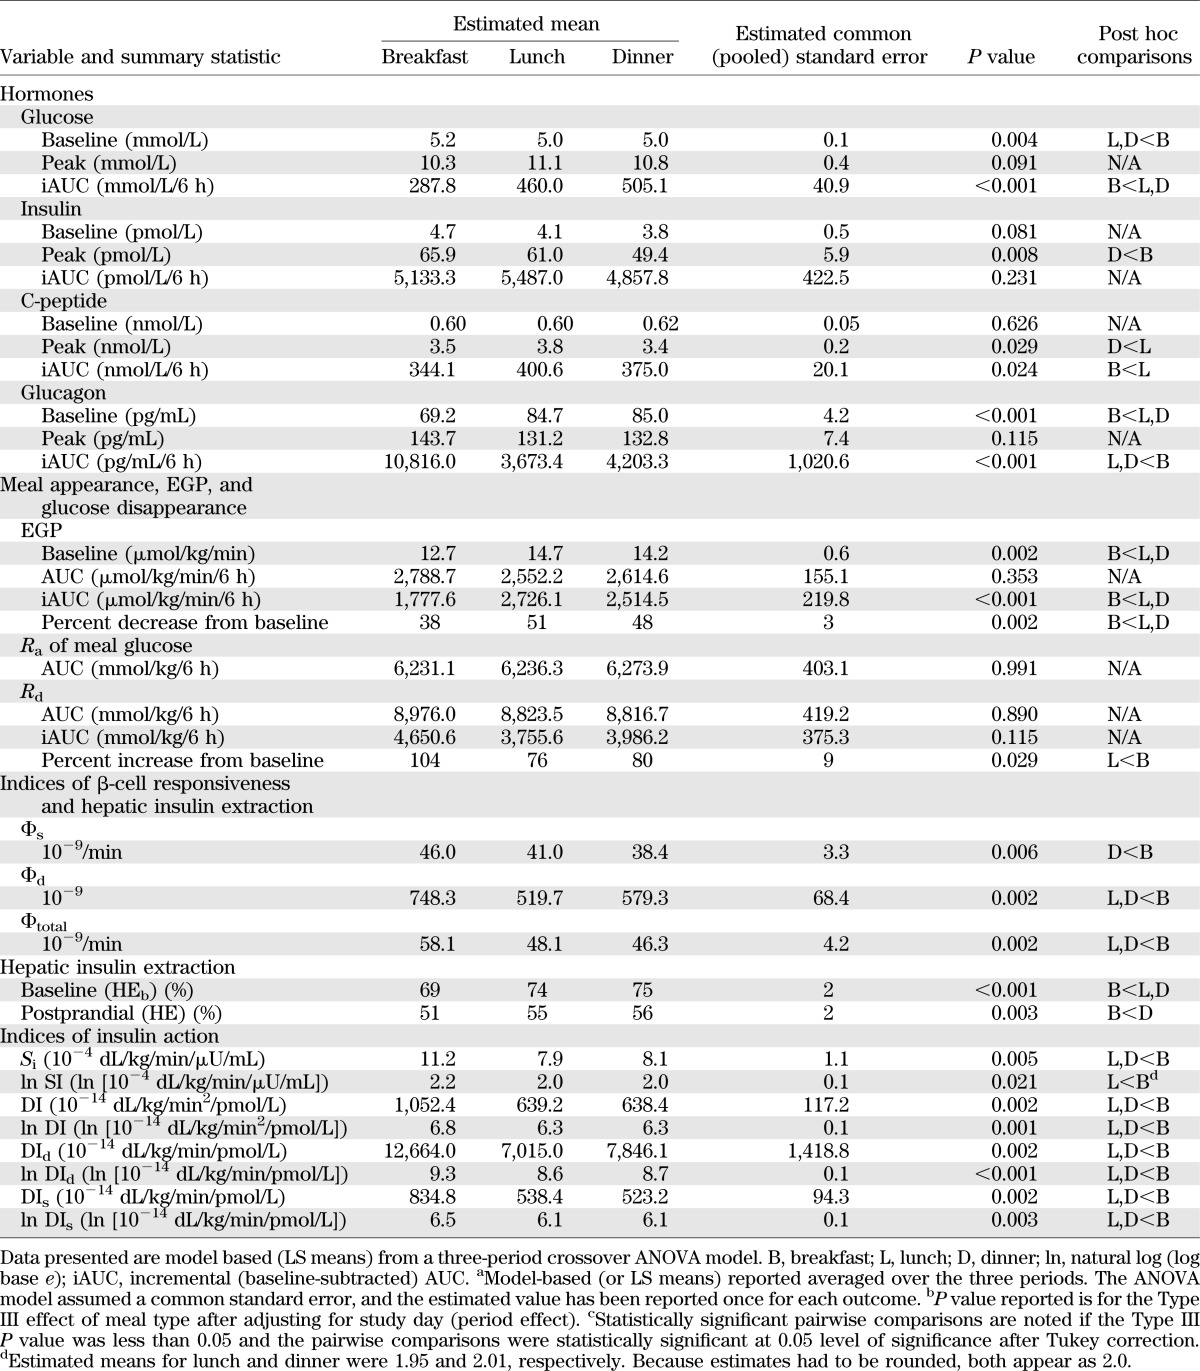
In Fig. 1, preprandial plasma glucose concentrations were statistically different across the three meals (P = 0.004) with higher values at breakfast than at lunch or dinner (Table 2). Postprandial peak glucose concentrations were not different among the three meals (P = 0.09). The area above baseline of postprandial glucose excursion, however, was different (P < 0.001) with the lowest values occurring at breakfast, which indicated better glucose tolerance at breakfast than at lunch or dinner. In contrast, postprandial glucose excursions were not different between lunch and dinner.
FIG. 1.
A: Plasma glucose and insulin concentrations obtained after labeled breakfast, lunch, and dinner. B: Plasma C-peptide and glucagon concentrations obtained after labeled breakfast, lunch, and dinner.
TABLE 2.
Outcome measures of 3-day meal sequence
Preprandial plasma insulin concentrations did not differ among meals (P = 0.081), whereas postprandial peak insulin concentrations did (P = 0.008). In post hoc comparisons, peak insulin levels at dinner were less than those at breakfast (P < 0.05 after Tukey adjustment). Insulin area above baseline did not differ between meals (P = 0.23). Similarly, C-peptide concentrations did not differ among meals at baseline (P = 0.63) and were different with respect to the peak value (P = 0.029). In contrast with insulin concentrations, the area above baseline was different across meals (P = 0.024). Notably, the C-peptide concentrations over the postprandial period were over 16% higher at lunch relative to breakfast (P < 0.05 after Tukey adjustment).
Preprandial plasma glucagon concentrations and the postprandial area above basal were different among the meals (P < 0.001 for both). Interestingly, the preprandial glucagon levels at breakfast were approximately 20% less than at lunch or dinner (P < 0.05 after Tukey adjustment), but the postprandial area under the curve was over 2.5 times higher at breakfast than at lunch or dinner (P < 0.05 after Tukey adjustment).
Meal appearance, EGP, and glucose disappearance.
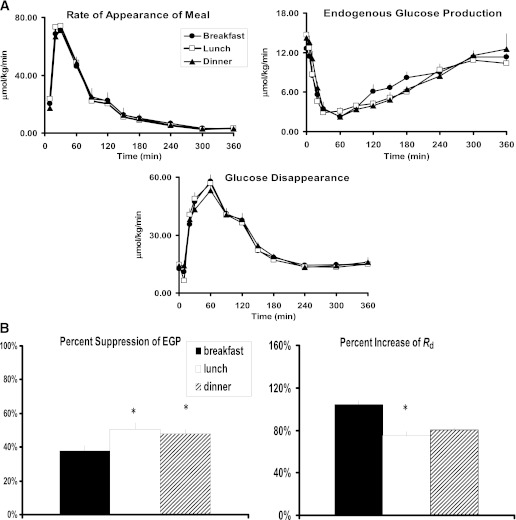
In Fig. 2A and B, there were no differences in Ra of meal glucose between the three meals (P = 0.99, Table 2), indicating that the differences in postprandial plasma glucose concentration between meals were not the result of differences in the Ra of meal glucose. Preprandial rate of EGP was different among the meals (P = 0.002) with lower production at breakfast than lunch or dinner. The incremental area below baseline of postprandial EGP was different among meals (P < 0.001), as was the percent suppression of EGP from baseline (P < 0.001). For both measures, breakfast was lower than lunch and dinner (P < 0.05 for both end points after Tukey correction). Likewise, the integrated Rd did not differ among meals (P = 0.89); however, percent increase in rates of Rd from baseline were different across meals (P = 0.029). The percent increase at breakfast was approximately 30% higher than at lunch or dinner (P < 0.05 for both after Tukey correction).
FIG. 2.
A: Ra of meal glucose, rate of EGP, and rate of Rd obtained after labeled breakfast, lunch, and dinner. B: Percent suppression of EGP and percent increase in Rd obtained after labeled breakfast, lunch, and dinner. *P < 0.05 vs. breakfast.
Indices of β-cell responsiveness and hepatic insulin extraction.
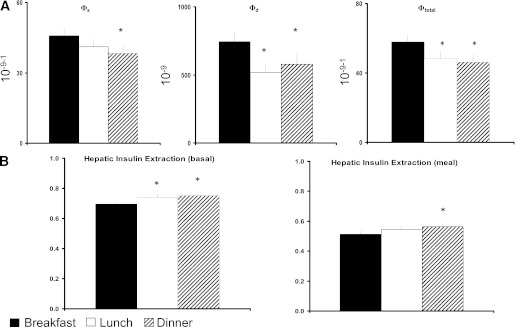
In Fig. 3, the index of β-cell responsiveness to a given glucose concentration (Φs) was higher at breakfast than at dinner but did not differ from lunch (P = 0.006), and β-cell responsiveness to a change in glucose concentration (Φd) was also higher at breakfast than at both lunch and dinner (P = 0.002, Table 2). Taken together, total β-cell responsivity (Φtotal) was over 20% higher at breakfast than at lunch and dinner (P = 0.002). Hepatic insulin extraction at baseline (HEb) was lower at breakfast than both lunch and dinner (P < 0.001). Likewise postprandial hepatic insulin extraction (HE) was also lower at breakfast than at lunch and dinner (P = 0.003). None of these indices differed between lunch and dinner.
FIG. 3.
A: Indices of β-cell responsiveness Φs, Φd, and Φtotal obtained after labeled breakfast, lunch, and dinner. *P < 0.05 vs. breakfast. B: Indices of hepatic insulin extraction (basal and total) were obtained after labeled breakfast, lunch, and dinner. *P < 0.05 vs. breakfast.
Indices of insulin action.
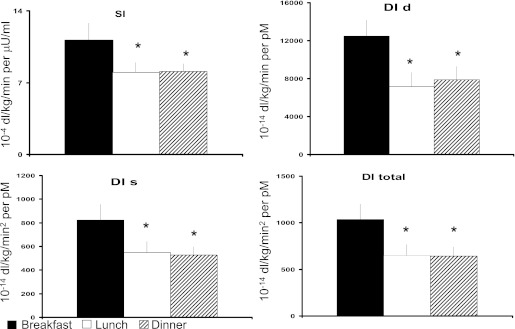
In Fig. 4, Si was higher at breakfast when compared with lunch and dinner (P < 0.05 after Tukey adjustment). Si did not differ between lunch and dinner. Likewise, disposition index (DI), DId, DIs were higher (P < 0.05) at breakfast than at lunch or dinner. As with many of the prior results, none of the indices differed between lunch and dinner. In the sensitivity analysis using natural log-transformed indices, all results remained the same except one. The transformed Si at dinner was no longer statistically different from baseline (P = 0.08 after Tukey correction). The details of the models applied including the weighted residuals are provided in the Supplementary Data online.
FIG. 4.
Si, DI static, DI dynamic, and DI total obtained after labeled breakfast, lunch, and dinner. *P < 0.05 vs. breakfast.
Si and DI distribution.
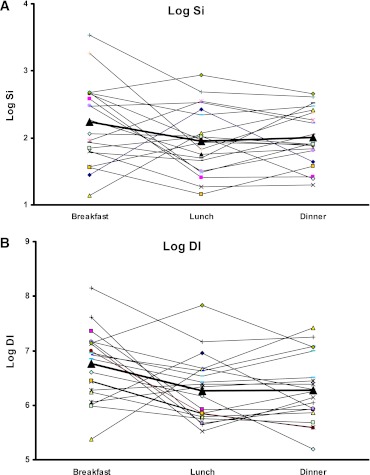
In Fig. 5, the individual patterns of Si and DI are depicted in log-transformed scale for the three meals. As shown in five of the 20 subjects, the diurnal pattern of Si and DI (high-low-low) was not maintained, reflecting the heterogeneity of responses.
FIG. 5.
A: Model-based Si for all subjects for each meal shown individually with log-transformed data. The boldface line indicates the average estimates for each meal. B: Model-based DI total for all subjects for each meal shown individually with log-transformed data. The boldface line indicates the average estimates for each meal. (A high-quality color representation of this figure is available in the online issue.)
DISCUSSION
Understanding diurnal patterns in glucose tolerance is critical for informing closed-loop control algorithm of insulin delivery to treat diabetes. However, to determine the existence of such a pattern, care needs to be taken to minimize confounding effects of variability in meal size, meal composition, and degree of physical activity, major factors that influence postprandial glucose tolerance. Our observations showing lower postprandial glucose excursion at breakfast than at lunch and dinner suggest the presence of a diurnal pattern to glucose tolerance in healthy nondiabetic subjects under carefully controlled conditions. This is characterized by a trend to reduced β-cell responsiveness and insulin action with increasing hepatic insulin extraction after lunch and dinner than at breakfast.
Although premeal physical activity could influence postprandial insulin action and hence glucose tolerance, our results demonstrating that postprandial glucose excursion was significantly lower at breakfast (preceded by a longer duration of inactivity) than at lunch or dinner support our case for a diurnal decline in glucose tolerance.
The primary observation of our study is that postprandial glucose excursion was lower at breakfast than at lunch or dinner. Diurnal variation in postprandial glucose excursions may result from changes in Ra of meal glucose, EGP, Rd, or a combination of these fluxes that were calculated with the triple-tracer approach (20). The Ra of meal glucose of ingested glucose did not differ between the three meals, thus eliminating alterations in glucose absorption and/or splanchnic uptake of meal glucose contributing to the observed changes in glucose tolerance. Moreover, these data suggest that the Ra of meal glucose, a reflection of net balance between rate of glucose absorption and splanchnic retention of meal glucose and by extension glucokinase activity (21,22), do not follow a diurnal pattern. Our data show that Si, reflecting composite effect of insulin on the rate of EGP and the rate of whole-body (liver and periphery) glucose disappearance, tended to be greater at breakfast than at lunch or dinner. However, in the sensitivity analysis using the log-transformed Si, statistical significance between breakfast and dinner was lost (P = 0.08). We are unable to directly calculate hepatic insulin action. However, because meal-derived glucose appearance did not differ between meals and because meal glucose contents were identical, it implies that splanchnic/hepatic glucose uptake (component of whole-body glucose disappearance) did not differ between meals. Therefore, it is reasonable to propose that the primary reason for greater Si at breakfast was an improved peripheral glucose disappearance although there were no detectable differences in whole-body Rd between meals. EGP was less suppressed at breakfast than at lunch or dinner likely because of the lower portal insulin concentrations (reflected by the lower C-peptide levels at breakfast) and lower plasma glucose concentrations. However, postprandial glucose disappearance did not differ at breakfast compared with lunch or dinner despite lower glucose concentrations, thereby providing support to our conclusion of improved insulin action (Si) during this meal.
With that said, it is important to underscore the limitations in the measurements of the various components of glucose turnover (i.e., Ra of meal glucose, Rd, and EGP) and meal indices (Si, DI) that do not consistently provide mechanistic insights and explanation to the primary observation of reduced postprandial glucose excursion at breakfast. This shortcoming likely reflects the relative imprecision of the estimation of both the meal indices and glucose flux calculations when compared with actual plasma glucose measurements, despite our rigorous study design applying state-of-the-art mathematical models (as detailed in the Supplementary Data online). For example, although Si (composite effect of insulin on both EGP and Rd) appeared to be higher at breakfast, the integrated responses of postprandial EGP and Rd were discordant. Specifically, although Si was higher, insulin suppression of EGP was lower at breakfast than the later meals. Additionally, fasting glucose concentrations were statistically slightly higher at breakfast despite slightly lower baseline EGP than the other two meals (Table 2). These observations are contradictory and reflect limitations in estimation of glucose turnover when compared with the precision in measurement of plasma glucose concentrations.
Our study was powered to detect differences in postprandial glucose excursions but underpowered to detect differences in the components of glucose turnover between meals. Furthermore, it is important to stress that our study did not investigate the repeatability of pattern of glucose tolerance within a subject over multiple 24-h periods. Such a study would be difficult to execute. Therefore, we cannot draw any conclusions regarding existence of a true circadian pattern to insulin secretion or action, nor was this study designed to test it.
Indices of β-cell responsiveness were higher after breakfast than after lunch or dinner, suggesting the presence of a diurnal pattern to β-cell responsiveness to absolute and changing glucose concentrations. This observation was further enhanced by the intriguing finding that hepatic insulin extraction also followed a diurnal pattern with the lowest extraction after breakfast than after lunch or dinner. The observation that lower hepatic insulin extraction at breakfast is associated with higher Si is corroborated by prior reports (23,24) showing similar observations between postprandial hepatic insulin extraction and whole-body insulin action.
DI was significantly higher at breakfast than at lunch or dinner, thus suggesting a diurnal pattern to this index. Likewise, Si, an index of insulin action, was higher at breakfast than the other two meals. As alluded to earlier and recorded in Table 2, sensitivity analyses of log-transformed DI did not reveal any changes to statistical significance, whereas for Si, statistical significance between breakfast and dinner was lost. Additionally, as shown in Fig. 5, there appears to be a degree of heterogeneity in the individual patterns to both DI and Si. In five subjects, the pattern shows low-high-low, whereas in the remaining fifteen subjects, the predominant pattern of high-low-low is maintained. Perhaps this heterogeneity of response patterns suggests diversity in demographic and/or physiological factors splitting the study population, although this was not evident on closer scrutiny of the demographic characteristics. However, we realize that in the limited sample size it would be unlikely to see tangible demographic differences in study cohorts. Furthermore, although our observations imply a diurnal pattern to postprandial insulin secretion, β-cell responsiveness, and insulin action in healthy people, the effect of other factors such as age, sex, adiposity, shift work, time-zone travel, and sleep-wake cycle disturbances on diurnal pattern will need to be investigated in future studies.
Our data also demonstrate, for the first time, an intriguing diurnal variation in postprandial plasma glucagon excursions. In contrast with insulin and C-peptide concentrations, preprandial glucagon concentrations were significantly lower at breakfast than at lunch or dinner. In contrast, postprandial glucagon excursion was significantly higher at breakfast than at lunch or dinner. It is possible that the longer (12 h) gap between dinner and breakfast (resulting in lower meal-derived amino acid concentrations) than the other two meals could explain the lower preprandial glucagon concentration at breakfast. However, this explanation is speculative at best. Additional studies are needed to determine the cause(s) of this observation.
In summary, this study demonstrates that under carefully controlled conditions of identical meal composition and physical activity in healthy individuals, postprandial glucose tolerance (as evidenced by lower postprandial glucose excursions) was better at breakfast than at lunch or dinner. This is in part the result of better β-cell responsiveness accompanied by a tendency to better insulin action and DI and lower hepatic insulin extraction at breakfast than later in the day. If a pattern in postprandial insulin action is observed in people with type 1 diabetes, this information will need to be incorporated into closed-loop systems of insulin delivery.
ACKNOWLEDGMENTS
The work was supported by Grant DK R01 085561 from the National Institutes of Health (NIH) and Grant UL1 RR024150-01 from the National Center for Research Resources (NCRR), a component of the NIH, and NIH Roadmap for Medical Research.
No potential conflicts of interest relevant to this article were reported.
A.S. and D.K.N. helped conduct the study and helped with data handling. C.D.M. and C.C. helped with the study design, data analyses, and manuscript review and editing. J.A.L., A.E.B., R.A.R., R.B., and R.E.C. helped with the study design and manuscript review and editing. Y.C.K. and A.B. helped with the study design, manuscript writing and editing, and researched data. A.B. is the guarantor of this work and, as such, had full access to all the data in the study and takes responsibility for the integrity of the data and the accuracy of the data analysis.
Parts of this study were presented at the 71st Scientific Sessions of the American Diabetes Association, San Diego, California, 24–28 June 2011, and at the 47th Annual Meeting of the European Association for the Study of Diabetes, Lisbon, Portugal, 12–16 September 2011.
The authors thank the research participants and the staff of the Mayo Clinic Center for Translational Science Activities CRU, the GI Motility Core, the CRU Mass Spectroscopy Laboratory, CRU Immunochemical Core Laboratory, Pamela Reich (research assistant), Betty Dicke (laboratory technician), Brent McConahey (research assistant), and Shelly McCrady Spitzer (research assistant). All people mentioned above are at the Endocrine Research Unit, Mayo Clinic (Rochester, MN).
Footnotes
This article contains Supplementary Data online at http://diabetes.diabetesjournals.org/lookup/suppl/doi:10.2337/db11-1478/-/DC1.
REFERENCES
- 1.Malherbe C, De Gasparo M, De Hertogh R, Hoet JJ. Circadian variations of blood sugar and plasma insulin levels in man. Diabetologia 1969;5:397–404 [DOI] [PubMed] [Google Scholar]
- 2.Van Cauter E, Shapiro ET, Tillil H, Polonsky KS. Circadian modulation of glucose and insulin responses to meals: relationship to cortisol rhythm. Am J Physiol 1992;262:E467–E475 [DOI] [PubMed] [Google Scholar]
- 3.Jarrett RJ, Baker IA, Keen H, Oakley NW. Diurnal variation in oral glucose tolerance: blood sugar and plasma insulin levels morning, afternoon, and evening. BMJ 1972;1:199–201 [DOI] [PMC free article] [PubMed] [Google Scholar]
- 4.Service FJ, Hall LD, Westland RE, et al. Effects of size, time of day and sequence of meal ingestion on carbohydrate tolerance in normal subjects. Diabetologia 1983;25:316–321 [DOI] [PubMed] [Google Scholar]
- 5.Morgan LM, Aspostolakou F, Wright J, Gama R. Diurnal variations in peripheral insulin resistance and plasma non-esterified fatty acid concentrations: a possible link? Ann Clin Biochem 1999;36:447–450 [DOI] [PubMed] [Google Scholar]
- 6.Peter R, Dunseath G, Luzio SD, Chudleigh R, Roy Choudhury S, Owens DR. Daytime variability of postprandial glucose tolerance and pancreatic B-cell function using 12-h profiles in persons with Type 2 diabetes. Diabet Med 2010;27:266–273 [DOI] [PubMed] [Google Scholar]
- 7.Lee A, Ader M, Bray GA, Bergman RN. Diurnal variation in glucose tolerance. Cyclic suppression of insulin action and insulin secretion in normal-weight, but not obese, subjects. Diabetes 1992;41:750–759 [DOI] [PubMed] [Google Scholar]
- 8.Waldhäusl W. Circadian rhythms of insulin needs and actions. Diabetes Res Clin Pract 1989;6:S17–S24 [DOI] [PubMed] [Google Scholar]
- 9.Basu R, Di Camillo B, Toffolo G, et al. Use of a novel triple-tracer approach to assess postprandial glucose metabolism. Am J Physiol Endocrinol Metab 2003;284:E55–E69 [DOI] [PubMed] [Google Scholar]
- 10.Basu A, Dalla Man C, Basu R, Toffolo G, Cobelli C, Rizza RA. Effects of type 2 diabetes on insulin secretion, insulin action, glucose effectiveness and postprandial glucose metabolism. Diabetes Care 2009;32:866–872 [DOI] [PMC free article] [PubMed] [Google Scholar]
- 11.Bharucha AE, Camilleri M, Forstrom LA, Zinsmeister AR. Relationship between clinical features and gastric emptying disturbances in diabetes mellitus. Clin Endocrinol (Oxf) 2009;70:415–420 [DOI] [PMC free article] [PubMed] [Google Scholar]
- 12.Levine JA, McCrady SK, Lanningham-Foster LM, Kane PH, Foster RC, Manohar CU. The role of free-living daily walking in human weight gain and obesity. Diabetes 2008;57:548–554 [DOI] [PubMed] [Google Scholar]
- 13.Dalla Man C, Caumo A, Cobelli C. The oral glucose minimal model: estimation of insulin sensitivity from a meal test. IEEE Trans Biomed Eng 2002;49:419–429 [DOI] [PubMed] [Google Scholar]
- 14.Dalla Man C, Caumo A, Basu R, Rizza R, Toffolo G, Cobelli C. Minimal model estimation of glucose absorption and insulin sensitivity from oral test: validation with a tracer method. Am J Physiol Endocrinol Metab 2004;287:E637–E643 [DOI] [PubMed] [Google Scholar]
- 15.Breda E, Cavaghan MK, Toffolo G, Polonsky KS, Cobelli C. Oral glucose tolerance test minimal model indexes of beta-cell function and insulin sensitivity. Diabetes 2001;50:150–158 [DOI] [PubMed] [Google Scholar]
- 16.Campioni M, Toffolo G, Basu R, Rizza RA, Cobelli C. Minimal model assessment of hepatic insulin extraction during an oral test from standard insulin kinetic parameters. Am J Physiol Endocrinol Metab 2009;297:E941–E948 [DOI] [PMC free article] [PubMed] [Google Scholar]
- 17.Ba P. Applied Mixed Models in Medicine. 2nd ed Hoboken, New Jersey, Wiley, 2006 [Google Scholar]
- 18.Der G, Everitt BS. Staistical Analysis of Medical Data using SAS. Boca Raton, Florida, Chapman and Hall/CRC, 2006 [Google Scholar]
- 19.Littell RC, Milliken GA, Stroup WW, Wolfinger RD, Scabenberger O. SAS for Mixed Models. Cary, NC, The SAS Institute, 2006 [Google Scholar]
- 20.Toffolo G, Basu R, Dalla Man C, Rizza R, Cobelli C. Assessment of postprandial glucose metabolism: conventional dual- vs. triple-tracer method. Am J Physiol Endocrinol Metab 2006;291:E800–E806 [DOI] [PubMed] [Google Scholar]
- 21.Basu A, Basu R, Shah P, et al. Effects of type 2 diabetes on the ability of insulin and glucose to regulate splanchnic and muscle glucose metabolism: evidence for a defect in hepatic glucokinase activity. Diabetes 2000;49:272–283 [DOI] [PubMed] [Google Scholar]
- 22.Basu A, Basu R, Shah P, et al. Type 2 diabetes impairs splanchnic uptake of glucose but does not alter intestinal glucose absorption during enteral glucose feeding: additional evidence for a defect in hepatic glucokinase activity. Diabetes 2001;50:1351–1362 [DOI] [PubMed] [Google Scholar]
- 23.Basu R, Dalla Man C, Campioni M, et al. Effects of age and sex on postprandial glucose metabolism: differences in glucose turnover, insulin secretion, insulin action, and hepatic insulin extraction. Diabetes 2006;55:2001–2014 [DOI] [PubMed] [Google Scholar]
- 24.Cobelli C, Toffolo GM, Dalla Man C, et al. Assessment of beta-cell function in humans, simultaneously with insulin sensitivity and hepatic extraction, from intravenous and oral glucose tests. Am J Physiol Endocrinol Metab 2007;293:E1–E15 [DOI] [PubMed] [Google Scholar]


