

Abstract
The incretin effect, reflecting the enhancement of postprandial insulin secretion by factors including the intestinal hormones glucagon-like peptide-1 (GLP-1) and glucose-dependent insulinotropic polypeptide, increases in proportion to meal size. However, it is unknown whether the incretin effect is dependent on ambient glucose. The goal of this study was to determine the effect of plasma glycemia on the incretin effect. Thirteen healthy subjects consumed 50 g oral glucose solution mixed with d-xylose during fixed hyperglycemia at 8 and 10.5 mmol/L, on 3 separate days, twice at lower glycemia (LOW) and once at higher values (HIGH). The relative increase in insulin release after glucose ingestion at fixed hyperglycemia, a surrogate for the incretin effect, was similar among all three studies. The GLP-1 response to oral glucose was significantly lower at higher plasma glycemia, as was the appearance of d-xylose after the meal. Between the two LOW studies, the reproducibility of insulin release in response to intravenous glucose alone and intravenous plus ingested glucose was similar. These findings indicate that the incretin contribution to postprandial insulin release is independent of glycemia in healthy individuals, despite differences in GLP-1 secretion. The incretin effect is a reproducible trait among humans with normal glucose tolerance.
Blood glucose concentrations in healthy humans are tightly regulated, such that circulating levels are maintained in the range of 4 to 8 mmol/L across a range of homeostatic challenges. Carbohydrate ingestion is the most common challenge to glucose homeostasis; yet under normal circumstances, intake of a wide range of glucose, from 25 to >100 g, causes only modest differences in glycemia (1–3). Central to the capacity to control blood glucose is the prompt release of insulin in amounts proportional to the ingested carbohydrate (3). Indeed, the normal insulin response to meals peaks before the maximum rise of blood glucose is reached (4). Taken in the context of the relatively weak correlation between postprandial glycemic and insulin responses, this indicates important β-cell stimulation by factors other than simply changes in blood glucose. It is widely accepted that this stimulation is provided by signals from the intestine, primarily glucose-dependent insulinotropic polypeptide (GIP) and glucagon-like peptide 1 (GLP-1), which connect gut absorption of glucose to the islet β-cell response to meals. Previous studies have demonstrated that stimulation by GIP and GLP-1, collectively termed incretins, accounts for up to 70% of insulin secretion after meals (3).
Incretin augmentation of postprandial insulin secretion increases in proportion to the amount of glucose ingested (3,5). Because plasma concentrations of GLP-1 and GIP are proportional to meal size, the current model of the incretin effect holds that these peptides link the absorption of nutrients by the gut to the secretions of the endocrine pancreas. Consistent with this model are data demonstrating that at physiologic hyperglycemia, insulin secretion increases in proportion to infused amounts of GLP-1 and GIP (6). However, although there is a clear connection between the amount of ingested glucose and the incretin effect (3,5), the effect of glycemia per se on meal-enhanced insulin release has not been examined. It is therefore unclear whether the incretin effect is greater, unchanged, or even reduced at increasing plasma glucose concentrations. This relationship is of potential clinical significance because subject groups with higher postprandial glucose levels have different incretin effects—impaired in persons with type 2 diabetes (T2DM) and glucose intolerance (7,8) and enhanced in persons with Roux-en-Y gastric bypass (RYGB) (9,10). The incretin effects in these studies were determined at different plasma glucose levels in the subject groups under the assumption that the measure is not affected by glycemia. The experiments described herein were designed to compare the incretin effect of 50 g oral glucose at two distinct levels of plasma glycemia. A secondary goal was to determine the within-subject variability of the incretin effect. We hypothesized that in healthy subjects, the incretin effect would be greater at higher levels of blood glucose.
RESEARCH DESIGN AND METHODS
Subjects.
Thirteen healthy subjects, 10 men and 3 women, were recruited by advertisement for three separate studies each. The subjects had no personal or family history of diabetes, were free of chronic medical conditions, such as coronary artery disease, dyslipidemia, or hypertension, and received no medications that interfere with glucose metabolism. The subjects were a mean age of 31.4 ± 2.4 years (range 24–53), and their average BMI was 24.5 ± 0.8 kg/m2 (range 21–29); all were weight-stable for 2 to 3 months before and during the experiments. Normal glucose tolerance was confirmed in subjects aged >40 years by a 2-h venous plasma glucose level of <7.8 mmol/L after ingestion of 75 g oral glucose solution. The institutional review board of the University of Cincinnati approved the protocol, and all participants provided written informed consent before the studies.
Experimental protocols.
The subjects were instructed to consume at least 200 g carbohydrate daily for the 3 days before each visit and not to engage in strenuous physical activity during that period. Subjects were studied with an oral glucose tolerance test (OGTT) during a hyperglycemic clamp (11). On two occasions, blood glucose was clamped at 8 mmol/L, a level approximating peak glycemia in normal glucose-tolerant subjects during an OGTT (1); these tests of the day-to-day variability of intravenous and oral glucose-stimulated insulin release are termed LOW1 and LOW2. On a third day, blood glucose was clamped at relative hyperglycemia (10.5 mmol/L); this study is referred to as HIGH. The sequence of the LOW and HIGH studies was balanced among the subjects, and the three studies were completed within 4 to 8 weeks in all subjects except for one, whose HIGH study was performed 12 months after the two LOW studies.
For each study, subjects were admitted to the General Clinical Research Center at Cincinnati Children’s Hospital after an overnight fast. Intravenous catheters were placed in each forearm for the withdrawal of blood and the infusion of glucose; the arm used for blood sampling was continuously warmed with a heating pad to arterialize venous blood. After the fasting blood samples were removed, a square wave of hyperglycemia was produced and maintained at the target level (8 and 10.5 mmol/L in the LOW and HIGH studies) with a priming infusion of glucose over 10 min, followed by a variable rate of 20% glucose solution infusion thereafter (11).
Blood glucose concentrations were determined by the glucose oxidase method using a bedside glucose analyzer (YSI 2300 STAT Plus; Yellow Springs Instruments, Yellow Springs, OH). At 90 min, subjects ingested an oral glucose solution (50 g glucose mixed with 10 g d-xylose in 300 mL distilled water) within 5 min, and the rate of the intravenous glucose infusion was adjusted to maintain the blood glucose at the target rate for the rest of the experiment. Blood samples were drawn at time points shown in Fig. 1, and placed on ice. Plasma was separated within 60 min of removal and stored at −80°C until assay.
FIG. 1.

Blood glucose (top), glucose infusion rate (middle), and plasma insulin (bottom) in response to oral glucose solution ingestion are shown during three hyperglycemic clamps. Data are presented as mean ± SEM.
Assays.
Blood samples were collected in tubes containing heparin for determinations of insulin, d-xylose, and glucose. Tubes containing 50 mmol/L EDTA plus 500 kallikrein inhibitor units/mL aprotinin were used for measurement of GLP-1, GIP, and C-peptide. Insulin concentrations were determined with a previously described radioimmunoassay (12), and C-peptide was measured using commercial assay kit according to the manufacturer’s specifications (Millipore, Billerica, MA). d-Xylose was measured by colorimetric assay (13), and total GLP-1 (Meso Scale Diagnostics, LLC, Gaithersburg, MD) and total GIP (Millipore) were measured using enzyme-linked immunosorbent assay techniques according to the manufacturers’ instructions.
Calculations and analysis.
The stability of the hyperglycemic clamps was measured as the mean of coefficients of variation (CVs) of glucose levels for each study from 60 to 270 min. The similarity of the paired LOW clamps in each individual was calculated as the difference in mean glucose from 60 to 270 min.
Fasting values of blood glucose, insulin, and C-peptide were computed as the average of the three samples drawn from −15 to 0 min, and those of GIP and GLP-1 as the average of two samples from 80 to 90 min, the period immediately before glucose ingestion. The average values of glucose and the glucose infusion rate (GIR) were calculated for 60–90, 95–150, and 95–270 min, separately.
The insulin response to intravenous hyperglycemia alone was computed as the mean increments of insulin and C-peptide above fasting values from 60 to 90 min. The incretin effect, the contribution of nonglucose factors stimulated by glucose ingestion on the β-cell response, was calculated for each individual during the hyperglycemic clamps as:
where “Actual INS(95,270)” is the average plasma level of insulin from 95 to 270 min and “Predicted INS(95,270)” is the average predicted insulin levels from 95 to 270 min during an equivalent glucose clamp without glucose ingestion. This correction accounts for the steady rise of insulin release during a glucose clamp (14). The predicted levels of insulin were computed using the slope of insulin versus time during the periods of 30 to 60 min and 60 to 90 min.
Early incretin-augmented insulin response was calculated similarly for the values from 95 to 150 min.
The incretin responses to glucose ingestion are summed as the area under curve (AUC) over fasting values of GLP-1 from 95 to 180 min and GIP from 95 to 210 min. Insulin sensitivity during the clamp was computed as the glucose infusion rates from 60 to 90 min divided by plasma insulin levels from the corresponding time period. Reproducibility of values between the two LOW studies was computed as within-subject CVs calculated from the mean and SD of selected outcomes.
The ln-transformed parameters obtained from each subject in the three studies were compared using one-way repeated-measures ANOVA, with Bonferroni post hoc comparison examining the effect of glycemic levels and the study day on the outcome of interest. Association among variables of interest during the LOW studies and the day-to-day correlation of β-cell or gastrointestinal hormone response in each individual was assessed using Spearman correlation. Data are presented as the mean ± SEM. Analyses were performed using SPSS 20 software (Chicago, IL).
RESULTS
Fasting and clamped plasma glucose.
For each subject, fasting glucose levels were comparable among the three studies (Table 1, Fig. 1). Blood glucose concentrations were raised to the target level of hyperglycemia during each study and maintained before and after oral glucose ingestion (Table 1, Fig. 1). The average CV for blood glucose values from 60 to 270 min during the LOW1, LOW2, and HIGH clamp studies were 4.5 ± 0.3, 4.8 ± 0.3, and 4.3 ± 0.3%, respectively. The average glucose levels (60–270 min) during the two LOW studies were 8.05 ± 0.06 and 8.04 ± 0.06 mmol/L, respectively, with a mean difference of 0.02 ± 0.03 mmol/L. For the HIGH studies, the mean glucose concentration (60–270 min) was 10.50 ± 0.16 mmol/L, with a mean difference of 2.46 ± 0.15 mmol/L from the LOW studies.
TABLE 1.
Effect of oral glucose consumption on β-cell response and gastrointestinal peptides during three hyperglycemic clamps

The glucose infusion rate needed to reach the glycemic target during the two LOW studies did not differ but was higher during the HIGH study during the preprandial (60–90 min; P < 0.001) and postprandial (95–270 min; P < 0.001) periods (Table 1, Fig. 1). After glucose ingestion, glucose infusion rates were initially reduced in some individuals during LOW studies to compensate for the glucose flux from the intestine to the circulation but were increased over preprandial values by 2.7 ± 0.2-, 2.9 ± 0.3-, and 2.6 ± 0.2-fold by the end of the LOW1, LOW2, and HIGH studies, respectively (Table 1, Fig. 1). Insulin sensitivity, estimated from the GIR and mean plasma insulin concentration from 60 to 90 min, did not differ among the subjects on the 3 study days.
Effect of plasma glycemia on the incretin effect.
Fasting levels of insulin and C-peptide were similar in the three studies and rose significantly in response to intravenous hyperglycemia alone (60–90 min; Table 1, Fig. 1). In response to the 8 mmol/L glucose clamp, plasma insulin increased 4.1- and 3.9-fold, and during the 10.5 mmol/L clamp, increased 6.2-fold (P < 0.001 vs. the LOW studies; Table 1). The response for C-peptide paralleled those for insulin, with relative increases during the LOW studies of 3.2- and 3.4-fold and increases during the HIGH clamp of 4.3-fold (P < 0.001 vs. the LOW studies; Table 1).
Despite fixed levels of hyperglycemia, ingestion of glucose increased insulin concentrations significantly above preprandial values during all three studies (Fig. 1). During the LOW1, LOW2, HIGH clamps, plasma insulin levels increased 3.4-, 3.4-, and 3.5-fold for the first hour after glucose ingestion (P = 0.93) and were 3.3-, 3.3-, and 3.9-fold greater for the entire 95–270 min studies (P = 0.13); thus, the relative increase did not differ among the studies despite a higher absolute concentration of postprandial insulin levels during the HIGH studies (Table 1). The incretin effect during the LOW1, LOW2, and HIGH studies accounted for 47 ± 7, 47 ± 5, and 45 ± 6% of average insulin levels from 95 to 270 min, respectively (P = 0.98). Similarly, the early incretin effect did not differ among the three studies (61 ± 7, 59 ± 5, and 55 ± 5%) during the first hour (95–150 min) of the LOW1, LOW2, and HIGH studies, respectively (P = 0.43). The C-peptide response to oral glucose mimicked that of insulin (Table 1).
The within-subject CVs for fasting glucose, insulin, and C-peptide were 3.4 ± 1.0, 18.0 ± 3.4, and 23.2 ± 6.2, respectively, between the two LOW studies. Day-to-day variability of insulin sensitivity, the insulin response to intravenous glucose alone (AUCInsulin (60–90 min)), and meal plus hyperglycemia-stimulated insulin release (AUCInsulin (95–270 min)) between the LOW studies were 22.0 ± 3.8%, 20.2 ± 3.5%, and 20.9 ± 4.9%, respectively. Variability between the two LOW studies in the C-peptide response to intravenous glucose alone and intravenous plus oral glucose stimuli were similar to those for insulin, 20.1 ± 5.9 and 17.6 ± 3.9%, respectively. The CVs of the incretin effect computed for each subject during the first hour of meal ingestion of two LOW studies were 15 ± 4%.
Secretion of GIP and GLP-1 and plasma appearance of d-xylose.
Fasting concentrations of GLP-1 were comparable among individuals during the three studies and increased after glucose ingestion. However, the GLP-1 response to the test meal was significantly lower during the HIGH studies compared with the LOW studies in 12 of 13 subjects (Table 1, Fig. 2). In contrast to GLP-1 secretion, the GIP responses to liquid glucose ingestion were similar among the three studies (Table 1, Fig. 2). The GLP-1 responses to meal ingestion (AUCGLP-1 (95–180 min)) correlated significantly within subjects between the two LOW studies (r = 0.63, P = 0.002) and the LOW and HIGH studies (HIGH vs. LOW1: r = 0.74, P = 0.004; HIGH vs. LOW2: r = 0.79, P = 0.001). Similarly, GIP responses (AUCGIP (95–210 min)) correlated between the HIGH and LOW studies within individuals, although the correlation between the two LOW studies showed only a trend (HIGH vs. LOW1: r = 0.72, P = 0.01; HIGH vs. LOW2: r = 0.68, P = 0.02). Reproducibility of fasting or postmeal gastrointestinal hormone levels were similar (fasting GLP-1 and fasting GIP: 25 ± 3 and 30 ± 6%; AUCGLP-1 (95–180 min) and AUCGIP (95–210 min): 31 ± 7 and 24 ± 4%; peak GLP-1 and peak GIP: 18 ± 5 and 16 ± 4%, respectively).
FIG. 2.

Plasma GLP-1 (top) and GIP (middle) levels and d-xylose (bottom) appearance after oral glucose ingestion are shown during three hyperglycemic clamps. Data are presented as mean ± SEM. *P < 0.05 compared with LOW studies.
Plasma concentrations of d-xylose increased after oral glucose intake to a peak 50–180 min after ingestion. The plasma d-xylose values during the LOW studies and HIGH were significantly different in 11 of 13 subjects (Table 1, Fig. 2), indicating that the passage of the carbohydrate-containing solution from the stomach to the intestine was slightly delayed by the level of hyperglycemia.
Sample size calculations.
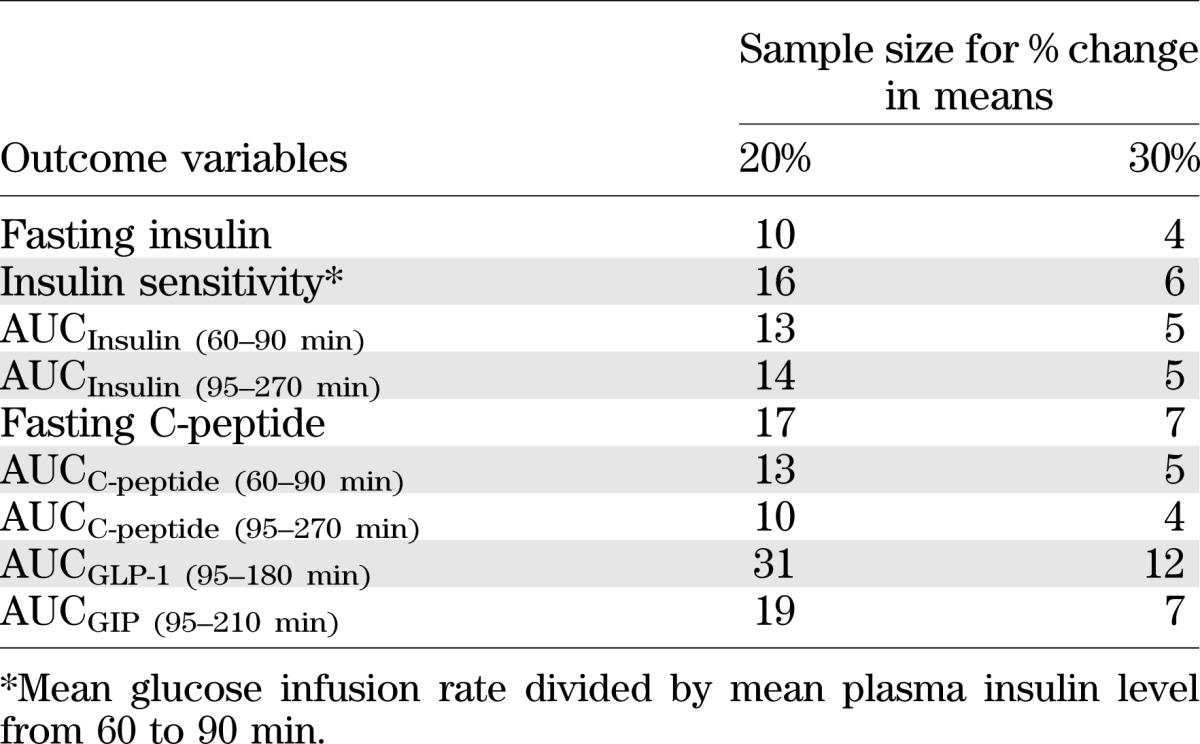
Sample size estimates were computed based on the within-subject CVs of measured outcomes from the LOW studies using a type I error of 0.05 and a power of 80% to detect a percentage change of 20 and 30% in means for two sample tests. The estimates that are listed in Table 2 indicate that a larger sample size is required for studies measuring incretin responses to glucose ingestion compared with insulin responses to glucose ingestion.
TABLE 2.
Sample size estimates based on within-subject CVs of insulin and incretin outcomes from the LOW studies
DISCUSSION
The incretin effect is necessary for normal glucose tolerance, and abnormalities in this process have been associated with pathologic glucose metabolism (7,8). In this study, we show that the relative enhancement of glucose-stimulated insulin release by glucose ingestion does not differ at two distinct levels of hyperglycemia in healthy subjects. In other words, there is no amplification of the incretin effect to compensate for higher plasma glucose. Of note, the incretin effect was maintained despite reduced concentrations of plasma GLP-1 in the presence of 10.5 mmol/L glucose. Day-to-day variability of glucose-stimulated β-cell response before and after oral glucose ingestion was similar between the two LOW studies, and incretin levels were likewise reproducible among individuals. These findings indicate that for a healthy subject, the incretin effect is tightly regulated, consistent, and not potentiated at elevated circulating glucose concentrations.
As in previous studies (11), we used an intravenous-oral hyperglycemic clamp to measure the incretin effect. This allows comparisons of the β-cell response to intravenous and oral glucose administration in one study, effectively eliminating day-to-day variation in these parameters. This approach, which has also been used by other investigators (15–18), differs from the classical approach that uses 2 days to determine the incretin effect by matching the glucose excursion of an OGTT with an isoglycemic intravenous glucose infusion. The latter is a proven method but one that compares insulin secretion for subjects over separate days of study. The intravenous-oral hyperglycemic clamp method permitted excellent control of glucose levels at the designated targets, allowing robust determinations of the effect of glycemia on the incretin effect, and its reproducibility. Moreover, the incretin effect measured with this technique, ∼50%, is comparable to what has been described for a 50-g glucose ingestion using the 2-day method (3).
The incretin effect is defined as meal-induced insulin secretion beyond what can be accounted for by hyperglycemia alone. The intravenous glucose-stimulated insulin release in this study was 1.5-fold greater during the HIGH than in the LOW clamps before glucose ingestion, whereas incremental insulin values after glucose ingestion over preprandial levels were similar in both HIGH and LOW studies, whether calculated for the first hour from glucose ingestion or for the entire 3-h entire study. Thus, the incretin effect in each individual was constant across circulating glucose levels of 8 to 10.5 mmol/L. These findings differ from what can be inferred from previous work in that insulin release stimulated by exogenous incretins increased at increasing levels of glycemia within the physiologic range (6). This previous study used infusions of exogenous GIP and GLP-1 during glucose clamps, and an extension of these results would support a model whereby endogenously released incretins also stimulate a greater β-cell response at higher levels of glucose. Our findings suggest that physiologic regulation of the incretin effect differs from what can be extrapolated from peptide infusion studies. One explanation for the maintenance of a constant incretin effect during the LOW and HIGH studies is the lower GLP-1 levels achieved during the 10.5-mmol/L clamp. Theoretically, decreases of circulating GLP-1 as glycemic stimulus increases could maintain the incretin effect across glucose levels. However, it is unlikely that the incretin effect is not entirely accounted for by GLP-1 and GIP effects, and neural factors likely have an important contribution (19). Regardless of the specific mechanism of action, the present findings indicate that the incretin effect is driven by glucose absorption in the gut and not by variation of plasma glycemia.
The ∼50% reduction in meal-induced GLP-1 seen in the HIGH study is consistent with the results in a recent publication by Vollmer et al. (20) showing a similar reduction in plasma GLP-1 at 9 mmol/L compared with fasting glycemia. In the current study, there was an association of reduced meal-induced GLP-1 secretion and delayed gastric emptying; the slower rise of plasma d-xylose in our subjects is consistent with delayed gastric emptying during the HIGH study. However, a solid meal rather than oral glucose solution was used as the nutrient stimulus in the Vollmer study, and the authors also reported a significant reduction of the GIP response, which was not seen in our subjects. Moreover, it is not clear whether the differences in plasma GLP-1 during the LOW and HIGH studies are meaningful because there is no previous work to measure the effects of GLP-1 using infusions to such low concentrations. Holst and Deacon (21) have recently summarized an increasingly common viewpoint questioning the role of circulating GLP-1 in the incretin effect and suggesting that the effects of GLP-1 are mediated by afferent neural pathways emanating from the gut. Consistent with this position, we have previously shown that GLP-1 action during meal tolerance tests did not correlate with the circulatory levels of GLP-1 in diabetic and nondiabetic obese controls (12). However, we cannot confirm or exclude a potential effect of plasma GLP-1 to regulate insulin responses during the studies reported here, and the regulation of l-cells and the incretin effect, by hyperglycemia or changes in neural signaling, is a possibility that will require specific studies.
We repeated the LOW protocol to examine the reproducibility of the incretin effect. In this cohort, within-subject variability for the insulin response to intravenous glucose before and after glucose ingestion and insulin sensitivity was comparable with previous studies (22,23). Consistent with this, there was a notable day-to-day correlation of GLP-1 and GIP secretion in each individual, indicating that incretin secretory responses and the incretin effect is a reproducible trait among individual subjects. Similarly to what has been published by Utzschneider et al. (22) for parameters of oral glucose tolerance, our study provides within-subject variability data for postprandial incretin secretion that could be useful for sample-size calculation in future studies (Table 2).
Specific changes in the incretin effect have been described among subjects with abnormal glucose homeostasis. To wit, the incretin effect has been reported as impaired in subjects with T2DM or impaired glucose tolerance (7,8) and enhanced in subjects after RYGB (9,10). Although these findings would seem at first to be incongruent with those reported here of a fixed incretin effect at different glycemic levels, this is not necessarily the case. In individuals with T2DM, abnormalities in the incretin effect seem to be due at least partially to the deleterious effects of chronic hyperglycemia on β-cell function, because near-normalization of hyperglycemia with several weeks of intensified insulin treatment improves the insulin response to exogenous GIP and GLP-1 (24). The improved incretin effect among subjects with RYGB, who have rapid, supranormal glucose excursions after eating (25), is best explained by the rapid flux of glucose from the gut and the enormous postprandial GLP-1 secretion and action characteristic of these individuals (10). Thus, in neither case does the absolute level of postprandial glycemia need to be invoked to explain the distinct incretin effects in diabetic or postsurgical subjects.
In summary, we have demonstrated that the incretin effect in healthy subjects is constant across a range of nondiabetic hyperglycemia and is a consistent response among individuals. GLP-1 secretion is also relatively reproducible among individuals and seems to be dependent, to some extent, on plasma glucose concentrations. These findings suggest that in healthy humans, control of the magnitude of the incretin effect is complex and occurs primarily at the level of the gastrointestinal tract.
ACKNOWLEDGMENTS
These studies were supported by National Institutes of Health Grants DK-57900 (D.A.D.) and DK-083554 (M.S.), in part by the U.S. Public Health Service, UL1 RR-026314 from the National Center for Research Resources, and by the Medical Research Service of the Department of the Veterans Affairs.
No potential conflicts of interest relevant to this article were reported.
M.S. designed the study, supervised the experiments and collection of data, performed data analysis, and wrote the manuscript. B.A. contributed to study design and to the performance of the glucose clamps. D.A.D. contributed to the study design, data analysis, and to reviewing and editing the manuscript. M.S. is the guarantor of this work and, as such, had full access to all the data in the study and takes responsibility for the integrity of the data and the accuracy of the data analysis.
Parts of this study were presented as a poster at the 68th Scientific Sessions of the American Diabetes Association, San Francisco, California, 6–10 June 2008.
The authors thank Kay Ellis, Clinton Elfers, Brianne Reedy, and Ron Bitner from the Department of Medicine of University of Cincinnati for their technical support, and the nursing staff from the Clinical Research Center of Cincinnati Children’s Hospital for their expert technical assistance. The authors owe a great debt to their research participants.
REFERENCES
- 1.Castro A, Scott JP, Grettie DP, Macfarlane D, Bailey RE. Plasma insulin and glucose responses of healthy subjects to varying glucose loads during three-hour oral glucose tolerance tests. Diabetes 1970;19:842–851 [DOI] [PubMed] [Google Scholar]
- 2.Förster H, Haslbeck M, Mehnert H. Metabolic studies following the oral ingestion of different doses of glucose. Diabetes 1972;21:1102–1108 [DOI] [PubMed] [Google Scholar]
- 3.Nauck MA, Homberger E, Siegel EG, et al. Incretin effects of increasing glucose loads in man calculated from venous insulin and C-peptide responses. J Clin Endocrinol Metab 1986;63:492–498 [DOI] [PubMed] [Google Scholar]
- 4.Tillil H, Shapiro ET, Miller MA, et al. Dose-dependent effects of oral and intravenous glucose on insulin secretion and clearance in normal humans. Am J Physiol 1988;254:E349–E357 [DOI] [PubMed] [Google Scholar]
- 5.Vilsbøll T, Krarup T, Sonne J, et al. Incretin secretion in relation to meal size and body weight in healthy subjects and people with type 1 and type 2 diabetes mellitus. J Clin Endocrinol Metab 2003;88:2706–2713 [DOI] [PubMed] [Google Scholar]
- 6.Vilsbøll T, Krarup T, Madsbad S, Holst JJ. Both GLP-1 and GIP are insulinotropic at basal and postprandial glucose levels and contribute nearly equally to the incretin effect of a meal in healthy subjects. Regul Pept 2003;114:115–121 [DOI] [PubMed] [Google Scholar]
- 7.Muscelli E, Mari A, Casolaro A, et al. Separate impact of obesity and glucose tolerance on the incretin effect in normal subjects and type 2 diabetic patients. Diabetes 2008;57:1340–1348 [DOI] [PubMed] [Google Scholar]
- 8.Nauck M, Stöckmann F, Ebert R, Creutzfeldt W. Reduced incretin effect in type 2 (non-insulin-dependent) diabetes. Diabetologia 1986;29:46–52 [DOI] [PubMed] [Google Scholar]
- 9.Laferrère B, Teixeira J, McGinty J, et al. Effect of weight loss by gastric bypass surgery versus hypocaloric diet on glucose and incretin levels in patients with type 2 diabetes. J Clin Endocrinol Metab 2008;93:2479–2485 [DOI] [PMC free article] [PubMed] [Google Scholar]
- 10.Salehi M, Prigeon RL, D’Alessio DA. Gastric bypass surgery enhances glucagon-like peptide 1-stimulated postprandial insulin secretion in humans. Diabetes 2011;60:2308–2314 [DOI] [PMC free article] [PubMed] [Google Scholar]
- 11.Salehi M, Vahl TP, D’Alessio DA. Regulation of islet hormone release and gastric emptying by endogenous glucagon-like peptide 1 after glucose ingestion. J Clin Endocrinol Metab 2008;93:4909–4916 [DOI] [PMC free article] [PubMed] [Google Scholar]
- 12.Salehi M, Aulinger B, Prigeon RL, D’Alessio DA. Effect of endogenous GLP-1 on insulin secretion in type 2 diabetes. Diabetes 2010;59:1330–1337 [DOI] [PMC free article] [PubMed] [Google Scholar]
- 13.Eberts TJ, Sample RH, Glick MR, Ellis GH. A simplified, colorimetric micromethod for xylose in serum or urine, with phloroglucinol. Clin Chem 1979;25:1440–1443 [PubMed] [Google Scholar]
- 14.Elahi D, Muller DC, McAloon-Dyke M, Tobin JD, Andres R. The effect of age on insulin response and glucose utilization during four hyperglycemic plateaus. Exp Gerontol 1993;28:393–409 [DOI] [PubMed] [Google Scholar]
- 15.Ferrannini E, Katz LD, Glickman MG, Defronzo RA. Influence of combined intravenous and oral glucose administration on splanchnic glucose uptake in man. Clin Physiol 1990;10:527–538 [DOI] [PubMed] [Google Scholar]
- 16.Henchoz E, D’Alessio DA, Gillet M, et al. Impaired insulin response after oral but not intravenous glucose in heart- and liver-transplant recipients. Transplantation 2003;76:923–929 [DOI] [PubMed] [Google Scholar]
- 17.Andersen DK, Elahi D, Brown JC, Tobin JD, Andres R. Oral glucose augmentation of insulin secretion. Interactions of gastric inhibitory polypeptide with ambient glucose and insulin levels. J Clin Invest 1978;62:152–161 [DOI] [PMC free article] [PubMed] [Google Scholar]
- 18.Elahi D, Andersen DK, Muller DC, Tobin JD, Brown JC, Andres R. The enteric enhancement of glucose-stimulated insulin release. The role of GIP in aging, obesity, and non-insulin-dependent diabetes mellitus. Diabetes 1984;33:950–957 [DOI] [PubMed] [Google Scholar]
- 19.D’Alessio DA, Kieffer TJ, Taborsky GJ, Jr, Havel PJ. Activation of the parasympathetic nervous system is necessary for normal meal-induced insulin secretion in rhesus macaques. J Clin Endocrinol Metab 2001;86:1253–1259 [DOI] [PubMed] [Google Scholar]
- 20.Vollmer K, Gardiwal H, Menge BA, et al. Hyperglycemia acutely lowers the postprandial excursions of glucagon-like peptide-1 and gastric inhibitory polypeptide in humans. J Clin Endocrinol Metab 2009;94:1379–1385 [DOI] [PubMed] [Google Scholar]
- 21.Holst JJ, Deacon CF. Glucagon-like peptide-1 mediates the therapeutic actions of DPP-IV inhibitors. Diabetologia 2005;48:612–615 [DOI] [PubMed] [Google Scholar]
- 22.Utzschneider KM, Prigeon RL, Tong J, et al. Within-subject variability of measures of beta cell function derived from a 2 h OGTT: implications for research studies. Diabetologia 2007;50:2516–2525 [DOI] [PubMed] [Google Scholar]
- 23.Bardet S, Pasqual C, Maugendre D, Remy JP, Charbonnel B, Sai P. Inter and intra individual variability of acute insulin response during intravenous glucose tolerance tests. Diabete Metab 1989;15:224–232 [PubMed] [Google Scholar]
- 24.Højberg PV, Vilsbøll T, Rabøl R, et al. Four weeks of near-normalisation of blood glucose improves the insulin response to glucagon-like peptide-1 and glucose-dependent insulinotropic polypeptide in patients with type 2 diabetes. Diabetologia 2009;52:199–207 [DOI] [PubMed] [Google Scholar]
- 25.Rodieux F, Giusti V, D’Alessio DA, Suter M, Tappy L. Effects of gastric bypass and gastric banding on glucose kinetics and gut hormone release. Obesity (Silver Spring) 2008;16:298–305 [DOI] [PubMed] [Google Scholar]