

Abstract
Background
The natural history model underlying the MGH Lung Cancer Policy Model (LCPM) does not include the two-stage clonal expansion model employed in other CISNET lung models. We used the LCPM to predict numbers of U.S. lung cancer deaths for ages 30–84 between 1975 and 2000 under 4 scenarios as part of the comparative modeling analysis described in this monograph.
Methods
The LCPM is a comprehensive microsimulation model of lung cancer development, progression, detection, treatment, and survival. Individual-level patient histories are aggregated to estimate cohort or population-level outcomes. Lung cancer states are defined according to underlying disease variables, test results, and clinical events. By simulating detailed clinical procedures, the LCPM can predict benefits and harms attributable to a variety of patient management practices, including annual screening programs.
Results
Under the scenario of observed smoking patterns, predicted numbers of deaths from the calibrated LCPM were within 2% of observed over all years (1975–2000). The LCPM estimated that historical tobacco control policies achieved 28.6% (25.2% in men, 30.5% in women) of the potential reduction in U.S. lung cancer deaths had smoking had been eliminated entirely. The hypothetical adoption in 1975 of annual helical CT screening of all persons aged 55–74 with at least 30 pack-years of cigarette exposure to historical tobacco control would have yielded a proportion realized of 39.0% (42.0% in men, 33.3% in women).
Conclusions
The adoption of annual screening would have prevented less than half as many lung cancer deaths as the elimination of cigarette smoking.
Keywords: Lung cancer, Tobacco control, Mass screening, Microsimulation modeling
1. INTRODUCTION
The MGH Lung Cancer Policy Model (LCPM) is a comprehensive microsimulation model of lung cancer development, progression, detection, treatment, and survival. Individual-level patient histories are aggregated to estimate cohort or population-level outcomes. Lung cancer states are defined according to underlying disease variables, test results, and clinical events. By simulating each clinical procedure in follow-up, staging and treatment algorithms, the LCPM can quantify benefits and harms attributable to a variety of changes in patient management practices. The LCPM was originally developed to evaluate the effectiveness of helical CT screening programs in specified cohorts.(1,2) More recently, the LCPM has been extended to assess the relative values of CT screening and smoking cessation programs, both alone and in combination.
The natural history model underlying the LCPM relies on a statistical prediction model and not the two-stage clonal expansion model(3–5) employed in many CISNET lung models (see McMahon, et al. in this monograph(6)). The LCPM used in the analyses described in this chapter and monograph is a dynamic cohort Population LCPM (LCPM version 2) with the capacity to model changes in smoking patterns and therefore lung cancer trends in the U.S. population.(7) The Population LCPM employs the Smoking History Generator common to other CISNET lung population models. Important differences between the Population LCPM and the original single cohort LCPM (LCPM version 1) used in prior analyses(1,2) include values of natural history parameters governing the increased risk of lung cancer for smoking; details are provided in the LCPM Model Profiler,(8) an online (archived) technical appendix. This chapter is meant to summarize the content provided in the profiler and to describe our participation in the joint base case.
In this chapter we used the Population LCPM to predict numbers of U.S. lung cancer deaths in men and women ages 30 to 84 that occurred or would have occurred between 1975 and 2000 under 3 scenarios as part of the joint base case (see Boer, et al. in this monograph(7)). Observed patterns of smoking habits (referred to in this monograph as “actual tobacco control”) was compared to two counterfactuals: absence of tobacco control since the early 1950s (“no tobacco control”) and cessation of all smoking in 1965 (“complete tobacco control”). Because our original interest was in evaluating screening as a means of reducing lung cancer deaths, we included (alongside the joint tobacco control scenarios) a hypothetical annual screening program, beginning in 1975, of persons aged 55 to 74 with at least 30 pack-years of cigarette smoke exposure. Intended as a best-case scenario to compare to the complete tobacco control scenario, we used assumptions highly favorable to screening; the screening test used had characteristics equivalent to present-day helical CT. Although hypothetical, the analysis offers insight into the reductions in lung cancer mortality possible with mass screening compared to smoking cessation programs.
2. METHODS
2.1 Approach/Model
The LCPM is a state-transition model, analyzed as Monte Carlo with a short (one-month) cycle length to allow for individual heterogeneity in risk factors and event rates. Figure 1 shows the5model states: general population, follow-up, diagnosis and staging, treatment and survival, and dead. Individuals in the general population state may have benign pulmonary nodules and undiagnosed lung cancers. A ‘true’ disease stage is assigned based on the individual’s simulated disease characteristics (tumor size, nodal involvement, distant spread) and updated every cycle. An observed disease stage is also assigned, based on the individual’s true disease characteristics, presence of any benign pulmonary nodules, and results from any diagnostic or staging tests performed. Observed and true stages may not match if a cancer is undiagnosed or mis-staged by a test result.
Figure 1.
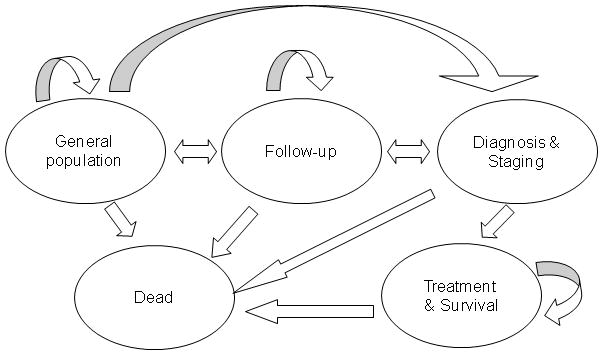
Detection of a pulmonary nodule suspicious for lung cancer may be prompted by symptoms or by incidental detection during a thoracic imaging examination for reasons unrelated to lung cancer (e.g., trauma) or on a screening examination (depending on the scenario being modeled). Patients with small pulmonary nodules are followed up with serial high-resolution CT examinations to detect growth. Nodules that exhibit no detectable growth after 2 years of follow-up are diagnosed as benign and require no further surveillance. Patients with symptoms, pulmonary nodules exhibiting growth, or nodules large enough for biopsy begin the next cycle in the diagnosis and staging state. Once the diagnosis of lung cancer is made, the cancer is staged and the person moves to the treatment and survival state. Cell type-specific (non-small cell vs. small cell) staging and treatment are modeled according to consensus practice guidelines.(9) Individuals can die of non-lung cancer causes from any state.
The natural history component occurs in every cycle of the model, so that new lung cancers may develop (and existing lung cancers grow and progress) throughout life. The natural history component has sub-components for lung cancer development, disease (tumor) growth, disease progression, and symptom detection. Benign pulmonary nodules are also simulated, because they are not always distinguishable from lung cancers on imaging exams and may prompt clinical workups with all attendant risks and costs. The risk of developing benign nodules is a function of age but not smoking history. See the Model Profile for details of the benign component of the LCPM.
To allow for multiple primary tumors of different cell types, patients can develop up to three primary lung cancers of different histologies: any of the 4 main types of lung cancer (adenocarcinoma, large cell, small cell, and squamous cell), plus a 5th type to represent Carcinoma, Not Otherwise Specified (ICD-O-2 code 80103). We modeled pure bronchioloalveolar carcinoma (BAC) as a subset of adenocarcinoma +/− some BAC, reflecting their differences yet typically mixed histology and misclassification. The LCPM employs a probabilistic model of cancer development (akin to a ‘tolerance’ model, in which cancer may only develop after an individual’s tolerance to risk factors has been exceeded). The monthly probability of developing the first malignant cell of cancer type k = 1, …, 5 is a logistic function with a type-specific intercept and type-specific coefficients for age, age2, years of cigarette exposure (smoke-years, SY), an interaction between age2 and SY, the average number of cigarettes smoked per day (cigarettes per day, CPD), and the years since quitting (YSQ) smoking, if applicable. We also allow for random individual variation (high risk, a proxy for genetic susceptibility), constant for all 5 types.
Indicators are assigned to each new cancer for cell type, size (initial diameter of 0.01 mm), lobe in the lung, and central or peripheral location (varied by type). We assume continuous Gompertzian tumor growth, assigning a growth parameter for each new cancer that is drawn from distributions specific for the 5 cell types of lung cancer. We also include a term to allow cancers in smokers to exhibit accelerated growth. The model assumes an irreversible (in the absence of resection) progression of lung cancer disease stages. The speed of progression varies greatly, however, so that some cancers would never be detected during life in the absence of screening. The growth of BACs was truncated at a maximum diameter of 1 cm (detectable by X-ray).
Disease progression of an existing lung cancer can occur via nodal involvement and distant metastasis. Risks of disease progression depend on characteristics of any cancers present, and random individual variation that allows for more or less aggressive cancers, given a cancer’s size and growth rate. For each individual, 8 threshold volumes are drawn randomly from distributions for each nodal stage (N1, N2, N3) and for distant spread (M1), stratified by cell type (NSCLC/SCLC). Threshold volumes are adjusted to allow variation by growth rate. In each cycle, development of metastases and involvement of lymph nodes occurs if and only if the current volume of the largest cancer is greater than the corresponding adjusted threshold volume.
Each month, individuals with distant metastases and/or a primary lung cancer may develop symptoms that result in lung cancer detection. The probability of symptom detection from primary cancers varies by location (central cancers have a greater propensity to cause symptoms, given size) and cell type (NSCLC vs. SCLC) and is a logistic function of the size of the largest cancer. We assume the minimum diameter for peripheral cancers to cause symptoms is 10mm, approximately the size at which airways are obstructed. The probability of symptom detection from metastases is a logistic function of the months since metastases developed (varied by NSCLC vs. SCLC).
Asymptomatic lung cancers and benign nodules can be detected incidentally during a chest imaging exam (CT or chest X-ray). The probability of incidental imaging exams is a function of age, sex, and race. Temporal trends in these background rates have not yet been explicitly incorporated. For screening scenarios (imaging or biomarker), individuals are screened if they are both 1) eligible for the screening program being modeled and 2) adherent. Screening programs can be specified by age range, minimum pack-years and/or maximum years since quitting, maximum number of screens, screen frequency, and details of the follow-up algorithm. Screening can in some cases lead to earlier death, even in those with benign disease; surgical and wedge resection and invasive examinations carry risks of operative mortality.
For any imaging exam, the probability of detection of asymptomatic cancers and benign nodules is a function of size, location (peripheral/central) and test characteristics (sensitivity and specificity). Imaging results are compared to results of prior imaging exams, if available.
Treatment consists of either removal of the primary lung cancer (i.e., resection) or systematic therapy. Only individuals assigned the status of operative candidate were eligible for surgical resection, regardless of stage. To account for patients who were not operative candidates, we estimated proportions of patients in SEER who were diagnosed NSCLC stage I and II and either refused surgery or had contraindications. A small proportion of operative candidates with stage LS (limited stage) SCLC underwent resection, with the remaining patients receiving chemoradiation. Operative candidates with NSCLC stages I through IIIa were assigned resection, with the remainder and all stage IIIb cases receiving chemoradiation. Stages IV (NSCLC) and ES (SCLC) were assigned chemotherapy. Tumors which respond to systemic therapy are reduced in size (diameter), following conventional guidelines for solid tumors(10), thereby delaying disease progression.
The comparative analysis in this monograph compares the estimated numbers of lung cancer deaths in the U.S. population from 1975 to 2000 among men and women aged 30 to 84 years, under alternate scenarios of tobacco control. Other population- or cohort-level outputs from the LCPM include incidence and mortality rates, as well as characteristics of incident cancers (stage, size and cell type distributions).
By simulating the same individuals (using common random numbers) under scenarios of screening and no screening, the LCPM can compare lung cancer outcomes and thereby predict effectiveness of screening programs.(1,2) Estimates of screening biases (length-time, lead-time, and over diagnosis) and screen-attributable reductions in lung cancer-specific or overall mortality are outputs of the model, not inputs. Screening scenario outputs include prevalence and incidence rates and stage shifts. Individual-level outputs include ages at detection and diagnosis, survival, and probabilities of false positive screening examinations.
2.2. Data
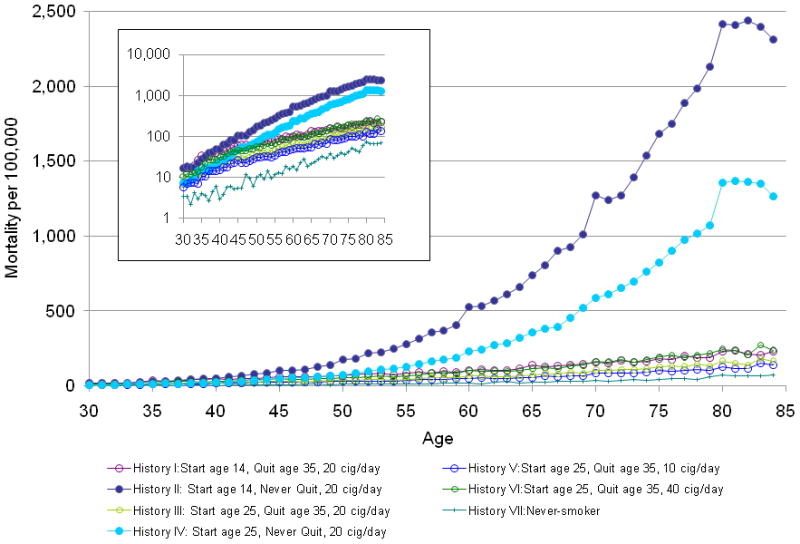
Intermediate endpoints useful for comparing CISNET models included predictions of age-specific lung cancer mortality rates as a function of smoking for seven hypothetical histories among men born in 1921. The histories varied by ages at starting and stopping smoking and daily dose, from never having smoked (History VII) to continued smoking of 20 cigarettes per day (Histories II and IV). One million individuals of each history were simulated.
In any lung cancer model, smoking is a critical parameter because of the strong relationship between exposure and lung cancer risk. Relatively small differences in smoking patterns used for inputs into the models could translate into large differences in lung cancer outcomes. Therefore, the Population LCPM used standardized inputs (see Burns, et al. and Holford, et al., in this monograph(11,12)). Similarly, to isolate changes in lung cancer outcomes from changes in competing causes of mortality, we used common inputs for competing mortality (see Rosenberg, et al. in this monograph(13)).
Inputs not common to the other CISNET lung models are described in the LCPM Model Profile. These include annual rates of incidental imaging exams (estimated from a large insurance claims database); published probabilities of partial and complete responses to systemic therapies; and calibration targets (see below) necessary for estimating natural history parameters. Estimated costs (treatments, patient and caregiver time) and utilities for health states are not relevant for analyses in this monograph and are described elsewhere.
2.3. Calibration and Validation
The calibration of the original single-cohort LCPM has been described in detail.(14) Briefly, a combination of grid search and simulated annealing was used to identify the parameter set that minimized the total sum of squared errors between model output and 8 primary calibration targets: age-specific incidence for a reference cohort (white males aged 60 in 1990) as observed in the SEER registry over the period 1990–2000; cell type, stage, and size distributions of incident cancers; and 4 stage-specific survival curves. Of the 25 parameter sets with the best fit to the primary calibration targets, we chose the set with the best fit to 4 secondary calibration targets: autopsy data; mortality in never-smokers; percent symptomatic at detection; lung cancer mortality. A revised set of parameters governing smoking-related risks of developing lung cancer were estimated by calibrating the Population LCPM (using standardized smoking histories) to the same reference cohort (white males aged 60 in 1990, as observed in the SEER registry from 1990–2000). In a separate, final calibration step, birth cohort and period terms (but not other natural history parameters) were calibrated such that the LCPM generated observed U.S. trends in lung cancer mortality over the period 1975–2000.
To account for observed trends in U.S. lung cancer mortality over the period 1975 to 2000, we added terms that modify the monthly risk of lung cancer development (all cell types): birth cohort terms were stratified by sex but period terms were identical for males and females. Remaining natural history parameters were held constant over (calendar) time.
The LCPM Model Profiler(8) provides additional detail of validation endpoints summarized here. Lung cancer incidence rates predicted by the LCPM were within the 95% confidence bands observed in the Health Professionals Follow-up Study of male physicians with similar smoking histories. Lung cancer mortality rates predicted by the LCPM were within calculated binomial 95% confidence bands in CPS II participants with similar smoking histories. The LCPM also reproduces observed endpoints in the CT screened arm of the Lung Screening Study.
3. RESULTS
3.1. Hypotheticals
The LCPM predicted lung cancer mortality rates at age 75 of 43 per 100,000 for non-smokers (History VII; Figure 2) that agreed with observed mortality rates for non-smoking males aged 75–79 from CPS I (49.4 per 100,000) and CPS II (44.0 per 100,000).(15) At age 75, predicted rates were 1,686 per 100,000 for the heaviest continuing smokers (History II; Figure 2). By comparison, quitting at age 35 reduced lung cancer mortality rates at age 75 to 184 per 100,000 (History I). Compared to never-smokers of the same age, the heaviest continuing smokers (History II) faced 15 to 20-fold higher risks for lung cancer death in their 50s, and over 40-fold higher risks in their 70s. A comparison of the LCPM predictions to those of the other lung cancer models is in McMahon et al. in this monograph.(6)
Figure 2.
3.2 Calibration and Validation
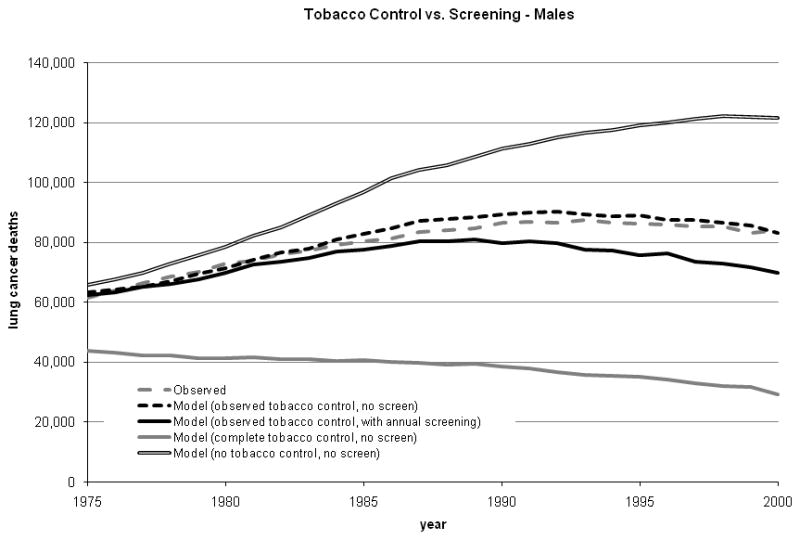
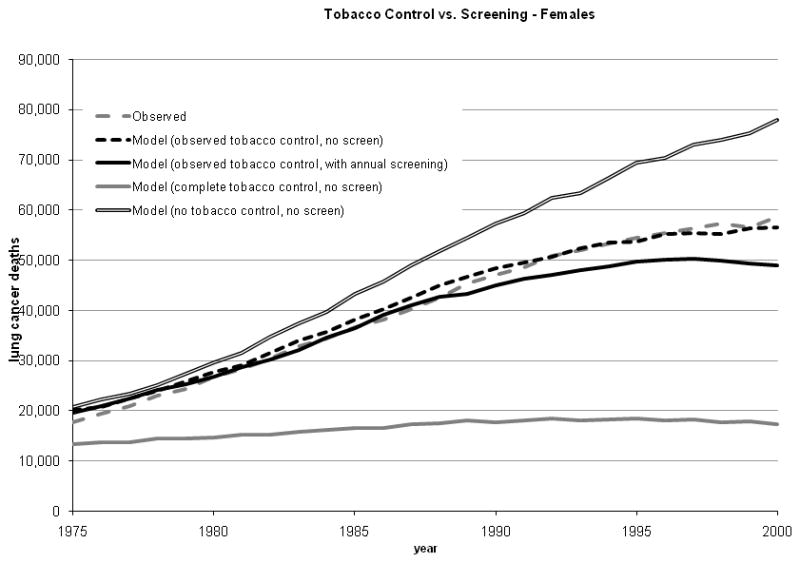
Under the scenario of actual tobacco control, the total numbers of deaths predicted by the calibrated Population LCPM were 2,109,266 (men) and 1,070,882 (women); both predictions were within 2% of observed over all years (1975 – 2000; Table I and Figure 3).
Table I.
Predicted numbers of lung cancer deaths avoided (1975 to 2000, all races) with tobacco control or tobacco control and annual CT screening. Potential refers to lung cancer deaths avoided with complete (‘best case’) versus no (‘worst case’) tobacco control. Realized refers to lung cancer deaths avoided with actual versus no tobacco control.
| Female | Male | Overall | |||||||
|---|---|---|---|---|---|---|---|---|---|
| Intervention | Realized | Potential | Proportion Realized | Realized | Potential | Proportion Realized | Realized | Potential | Proportion Realized |
| Tobacco Control | 214,829 | 854,112 | 25.2% | 487,262 | 1,597,733 | 30.5% | 702,092 | 2,451,845 | 28.6% |
| Tobacco Control and Annual Screening | 284,092 | 854,112 | 33.3% | 671,471 | 1,597,733 | 42.0% | 955,564 | 2,451,845 | 39.0% |
Figure 3.
Estimated birth cohort terms for males (range, 0.165 to 1.017) and females (range, 0.6 to 0.85) were larger in magnitude than period terms (range, 0.85 to 1.0).
3.3 Tobacco Control Scenarios
The LCPM estimated that tobacco control since the 1950s achieved 28.6% of the potential reduction in U.S. lung cancer deaths had smoking had been eliminated entirely (Table I and Figure 3). The 28.6% reduction corresponded to 487,262 deaths prevented in males (25.2% reduction) and 214,829 deaths prevented in females (30.5% reduction).
Using complete tobacco control as the best case scenario, the addition of annual helical CT screening to actual tobacco control would have increased the proportion realized to 39.0% overall (42.0% in men and 33.3% in women). The adoption of annual screening of all persons aged 55–74 with at least 30 pack-years of cigarette exposure would have prevented less than half as many lung cancer deaths as complete tobacco control.
4. DISCUSSION
Despite differences in model structure and fundamental approaches to modeling lung cancer natural history (see McMahon et al. in this monograph(6)), the CISNET lung models provide robust predictions regarding the benefits to the U.S. population from investments in tobacco control programs over the past half-century.(7)
As was the case for FHCRC and Yale models, calibration of LCPM natural history parameters to a selected cohort had to be followed by a second calibration of period and birth cohort terms to match population trends in U.S. lung cancer mortality. The three models employed different selected cohorts (see McMahon et al. in this monograph(6)) and yielded different period and birth cohort terms, suggesting that population trends are complex and incompletely captured by extrapolating from individual cohorts.
Results of our hypothetical comparison to screening (Figures 3a and 3b) show that modern helical CT screening – had it been in use from 1975 – would have provided less than half the reduction in lung cancer deaths achievable with complete tobacco control. Allowing for imperfect adherence to screening schedules by eligible persons, imperfect screening tests, and risks from radiation exposure would have reduced the effect of screening further. Insight into the relative magnitude of benefit from cessation and screening will be helpful for setting healthcare investment priorities and understanding how future trends in screening (if it becomes part of standard of care) and cessation will influence future trends in lung cancer mortality. Our findings suggest that lung cancer control interventions should continue to emphasize tobacco control, whether or not lung cancer screening is adopted.
Limitations of the analysis arise from assumptions inherent in the model. The natural history model simulates unobservable events, with parameters estimated by calibration. Comparative modeling approaches such as those described in this Monograph and elsewhere(16) are important tools for increasing the transparency of models used to inform policy.
Second-hand smoke exposure for the U.S. population is difficult to precisely quantify from surveys (if not impossible for birth cohorts going back to 1900) and was not explicitly modeled. We did include lung cancer mortality rates in a cohort of highly selected (i.e., volunteers with the American Cancer Society who experienced lower mortality than the U.S. population(17,18)) never-smokers as a calibration target,(8)but these individuals likely experienced some second-hand smoke exposure. A true, complete smoking ban in the U.S. would have eliminated second-hand smoke exposure and avoided an unknown number of additional lung cancer deaths than we predicted.
The cohort and period terms implicitly adjust for trends in both incidental imaging rates and staging and treatment practices, but analyses in this chapter simulate all lung cancer patients as receiving staging and treatment consistent with consensus practice guidelines in place in the 1990s. We did not consider financial costs of any of the scenarios in the analysis. Our analysis used non-lung cancer mortality rates adjusted for smoking history and included increased risks of death attributed to screening, but focused on lung cancer mortality and did not consider overall life-expectancy or quality-adjusted life expectancy. Finally, our analysis of screening relies on extrapolation from observational data, as randomized trials of helical CT screening have not yet published mortality endpoints.
Acknowledgments
Karen M. Kuntz, Sc.D., David C. Christiani, M.D., M.P.H., CISNET Lung investigators, the National Cancer Institute (R01 CA97337, R00 CA126147, U01CA152956), and the American Cancer Society (RSG 2008A060554). The National Electrical Manufacturers Association provided two authors (GSG, ACT) with funding for an unrelated project. GSG became a consultant to GE Healthcare in 2010.
Footnotes
None of the other authors has any conflicts of interest.
This study used only publicly-available, de-identified patient data.
References
- 1.McMahon PM, Kong CY, Johnson BE, Weinstein MC, Weeks JC, Kuntz KM, Shepard JO, Swensen SJ, Gazelle GS. Estimating long-term effectiveness of lung cancer screening in the Mayo CT screening study. Radiology. 2008;248(1):278–287. doi: 10.1148/radiol.2481071446. [DOI] [PMC free article] [PubMed] [Google Scholar]
- 2.McMahon PM, Kong CY, Weinstein MC, Tramontano AC, Cipriano LE, Johnson BE, Weeks JC, Gazelle GS. Adopting helical CT screening for lung cancer: potential health consequences during a 15-year period. Cancer. 2008;113(12):3440–9. doi: 10.1002/cncr.23962. [DOI] [PMC free article] [PubMed] [Google Scholar]
- 3.Moolgavkar SH, Knudson AG., Jr Mutation and cancer: a model for human carcinogenesis. J Natl Cancer Inst. 1981;66(6):1037–52. doi: 10.1093/jnci/66.6.1037. [DOI] [PubMed] [Google Scholar]
- 4.Hazelton WD, Clements MS, Moolgavkar SH. Multistage Carcinogenesis and Lung Cancer Mortality in Three Cohorts. Cancer Epidemiol Biomarkers Prev. 2005;14(5):1171–1181. doi: 10.1158/1055-9965.EPI-04-0756. [DOI] [PubMed] [Google Scholar]
- 5.Meza R, Hazelton WD, Colditz GA, Moolgavkar SH. Analysis of lung cancer incidence in the Nurses’ Health and the Health Professionals’ Follow-Up Studies using a multistage carcinogenesis model. Cancer Causes Control. 2008;19(3):317–28. doi: 10.1007/s10552-007-9094-5. [DOI] [PubMed] [Google Scholar]
- 6.McMahon PM, Hazelton WD, Kimmel M, Clarke LC. Chapter 13. CISNET lung models: Comparison of model assumptions and model structures. Risk Analysis. 2011 doi: 10.1111/j.1539-6924.2011.01714.x. Monograph: under review. [DOI] [PMC free article] [PubMed] [Google Scholar]
- 7.Boer R, et al. Impact of Tobacco Control on Lung Cancer Mortality in the U.S. Over the Period 1975–2000 -- Summary and Limitations. Risk Analysis. 2011 doi: 10.1111/j.1539-6924.2012.01827.x. Monograph. [DOI] [PMC free article] [PubMed] [Google Scholar]
- 8.McMahon PM, Kong CY, Gazelle GS. [Accessed May 6, 2010, ];Model profiler of the MGH-ITA Lung Cancer Policy Model: CISNET. http://cisnet.cancer.gov/profiles/
- 9.National Comprehensive Cancer Network. NCCN Clinical Practice Guidelines in Oncology. www.nccn.org.
- 10.Therasse P, Arbuck S, Eisenhauer E, Wanders J, Kaplan R, Rubinstein L, Verweij J, Van Glabbeke M, van Oosterom A, Christian M, Gwyther S. New guidelines to evaluate the response to treatment in solid tumors. J Natl Cancer Inst. 2000;92:205–216. doi: 10.1093/jnci/92.3.205. [DOI] [PubMed] [Google Scholar]
- 11.Burns DM, et al. Birth Cohort Specific Estimates of Smoking Behaviors for the U.S. Population. Risk Analysis. 2011 doi: 10.1111/j.1539-6924.2011.01703.x. Monograph. [DOI] [PMC free article] [PubMed] [Google Scholar]
- 12.Holford TR, et al. Counterfactual Smoking Histories. Risk Analysis. 2011 doi: 10.1111/j.1539-6924.2011.01759.x. Monograph. [DOI] [PMC free article] [PubMed] [Google Scholar]
- 13.Rosenberg M, et al. Cohort Life Tables By Smoking Status Removing Lung Cancer as a Cause of Death. Risk Analysis. 2011 doi: 10.1111/j.1539-6924.2011.01662.x. Monograph. [DOI] [PMC free article] [PubMed] [Google Scholar]
- 14.Kong CY, McMahon PM, Gazelle GS. Calibration of Disease Simulation Models Using an Engineering Approach. Value in Health. 2009;12(4):521–9. doi: 10.1111/j.1524-4733.2008.00484.x. [DOI] [PMC free article] [PubMed] [Google Scholar]
- 15.Thun M, Henley S, Burns D, Jemal A, Shanks T, Calle E. Lung cancer death rates in lifelong nonsmokers. J Natl Cancer Inst. 2006;98(10):691–9. doi: 10.1093/jnci/djj187. [DOI] [PubMed] [Google Scholar]
- 16.Berry DA, Cronin KA, Plevritis SK, Fryback DG, Clarke L, Zelen M, Mandelblatt JS, Yakovlev AY, Habbema JD, Feuer EJ Cancer Intervention and Surveillance Modeling Network (CISNET) Collaborators. Effect of screening and adjuvant therapy on mortality from breast cancer [see comment] New England Journal of Medicine. 2005;353(17):1784–92. doi: 10.1056/NEJMoa050518. [DOI] [PubMed] [Google Scholar]
- 17.Thun MJ, Myers DG, Day-Lally C, Namboodiri MM, Calle EE, Flanders D, Adams SL, Heath CW., Jr . NIH Publication No 97–4213. Washington, D.C: 1997. Chapter 5. Age and the exposure-response relationships between cigarette smoking and premature death in Cancer Prevention Study II. [Google Scholar]
- 18.Flanders WD, Lally CA, Zhu B–P, Henley SJ, Thun MJ. Lung Cancer Mortality in Relation to Age, Duration of Smoking, and Daily Cigarette Consumption: Results from Cancer Prevention Study II. Cancer Res. 2003;63(19):6556–6562. [PubMed] [Google Scholar]