

Abstract
Epilepsy is a disorder of recurrent seizures that affects 1% of the population. To understand why some areas of cerebral cortex produce seizures and others do not, we identified differentially expressed genes in human epileptic neocortex compared with nearby regions that did not produce seizures. The transcriptome that emerged strongly implicates MAPK signaling and CREB-dependent transcription, with 74% of differentially expressed genes containing a cAMP response element (CRE) in their proximal promoter, more than half of which are conserved. Despite the absence of recent seizures in these patients, epileptic brain regions prone to seizures showed persistent activation of ERK and CREB. Persistent CREB activation was directly linked to CREB-dependent gene transcription by chromatin immunoprecipitation that showed phosphorylated CREB constitutively associated with the proximal promoters of many of the induced target genes involved in neuronal signaling, excitability, and synaptic plasticity. A distinct spatial pattern of ERK activation was seen in superficial axodendritic processes of epileptic neocortex that colocalized with both CREB phosphorylation and CREB target gene induction in well demarcated populations of layer 2/3 neurons. These same neuronal lamina showed a marked increase in synaptic density. The findings generated in this study generate a robust and spatially restricted pattern of epileptic biomarkers and associated synaptic changes that could lead to new mechanistic insights and potential therapeutic targets for human epilepsy.
Introduction
Epilepsy is a disorder of recurrent seizures that commonly begins in focal brain regions. At present, the only way to identify these abnormal regions is through electrical recordings of epileptic discharges that result from the synchronous depolarization of large populations of neurons. Seizures are generated in these regions when epileptic discharges become rhythmic and spread to other regions of the cerebral cortex, producing a wide variety of symptoms ranging from unusual feelings, tastes, or smells, to convulsions consisting of generalized tonic and clonic movements of the extremities. The epileptic state can develop months or years after a wide range of cerebral insults that vary from infection to trauma, stroke, tumors, and developmental brain disorders (Annegers et al., 1996).
The exact cellular and molecular pathophysiology in the neocortex that leads to the development of seizures is not known; nor is it clear why these regions remain epileptic for an often lifelong disease. Although there are medications to reduce the frequency of seizures, there are no medications that cure epilepsy or prevent epileptogenesis following brain injury (Temkin, 2009). Clues about the molecular basis of human epilepsy have come from genetic explorations of rare familial forms of epilepsy that have implicated genes encoding voltage- and ligand-gated ion channels (Noebels, 2003; Steinlein, 2004) and scaffold proteins involved in postsynaptic glutamate receptor maturation (Kalachikov et al., 2002). However, to date these genes have not been able to account for the majority of sporadic cases (Ottman et al., 1996; Cavalleri et al., 2005).
Patients with focal forms of epilepsy who fail to respond to medications can benefit from selective resection of epileptic brain regions, suggesting that these regions are necessary and sufficient for expression of the disease. As an approach to understand what is unique about regions of human epileptic cortex that make them prone to have seizures, we performed genome-wide transcriptional profiling of human epileptic neocortex removed after long-term in vivo electrical recordings in patients with medically refractory epilepsy (Loeb, 2010, 2011). A novel aspect of this study design is the comparison of gene expression differences between local epileptic and nonepileptic brain regions within a given patient's brain and then finding common changes across many patients (Rakhade et al., 2005). In this way, the transcriptome that emerges is not biased by differences in genetic background, tissue processing, or antiepileptic medications. The genome-wide transcriptome was then used to identify the most statistically significant molecular pathways enriched in the epileptic brain regions, which were then validated using additional human tissue samples. The most significant of these was the pathway that activates CREB transcription through the mitogen-activated protein kinase (MAPK). The MAPK–CREB pathway and its downstream target genes were then used as biomarkers that were localized to large stretches of sharply demarcated layer 2/3 neurons, which showed a marked increase in synaptic density. These results parallel recent observations of layer-specific MAPK-CREB activation in a rodent model of interictal spiking (Barkmeier et al., 2012). Together, our results suggest that human neocortical epileptic seizures arise from focal brain regions with hyperconnected layer 2/3 neurons associated with persistent MAPK–CREB-mediated gene transcription.
Materials and Methods
Electrocorticography and tissue resection.
Informed consent was obtained from 13 patients who underwent surgery for medically intractable epilepsy (Table 1). Extreme care was taken to ensure our study did not influence surgical decision making. All patients underwent presurgical evaluation and identification of epileptic and control regions as previously described (Rakhade et al., 2005). A two-stage surgical approach using subdural electrodes with continuous brain surface recordings (electrocorticography) and video monitoring was undertaken over a 2–5 d period to localize epileptic brain regions that displayed both clinical seizures and interictal epileptiform discharges (spikes). Seizure onset zones, henceforth referred to as “epileptic,” were identified by sustained rhythmic changes on EEG that were clearly distinct from background rhythms and were associated with the patient's seizure semiology (Asano et al., 2003). “Control” regions were defined as nearby neocortex with minimal or no interictal activity and no seizure onset or spread. In some instances, small amounts of these control regions are removed as part of a larger anatomic resection independently determined by the surgeon. High-resolution digital photographs of the cortical surface were taken for exact identification of electrode locations within the resected brain tissue. Three-dimensional reconstructions of the brain surface were performed using T1 spoiled gradient recalled echo MRI with 1 mm resolution using BrainSuite2 (Shattuck and Leahy, 2002), and recording electrodes were coregistered and pseudocolored based on mean interictal spike frequency from continuous brain surface recordings acquired over 3–5 d. Tissue blocks under each electrode were subdivided so that tissue histology, gene expression, and protein expression could be linked to the in vivo electrical recordings as described previously (Loeb, 2010).
Table 1.
Patient data
| Patient no. | Age (years) | Sex | Seizure type | Frequency (per day) | Tissue (onset/control) | Pathology | Studies |
|---|---|---|---|---|---|---|---|
| 1 | 10 | F | CP | 0.3 | FL/FL | Gliosis | m |
| 2 | 7 | F | CP | >10 | T/FL | Gliosis | m |
| 3 | 2 | F | CP | 10 | FL/FL | Gliosis | m, q |
| 4 | 14 | M | CP | 2.0 | P/T | Gliosis | m, q |
| 5 | 7 | F | CP | >10 | P/T | Gliosis, FCD | m, q |
| 6 | 52 | F | CP | 0.5 | FL/FL | Gliosis | h, i, ChIP |
| 7 | 32 | F | CP | 1.0 | P/T | Gliosis | h, i, ChIP |
| 8 | 29 | M | CP | 0.7 | P/T | Gliosis | h, i |
| 9 | 4 | F | CP | >10 | FL/FL | Gliosis, PMG | h, i, ChIP |
| 10 | 15 | F | CP | 0.4 | FL/ | Gliosis, PMG | ChIP |
| 11 | 8 | M | CP | 1.5 | T/ | TS | ChIP |
| 12 | 5 | M | CP | 5 | T/ | FCD | ChIP |
| 13 | 2 | M | CP | 0.3 | P/ | Gliosis | ChIP |
CP, Complex partial; F, female; M, male; FL, frontal lobe; T, temporal lobe; P, parietal lobe; FCD, focal cortical dysplasia; PMG, polymicrogyria, TS, tuberous sclerosis,. m, microarray; q, quantitative real-time PCR; h, histological; i, in situ hybridization; c, chromatin immunoprecipitation.
Microarrays and statistical analysis.
Total RNA was isolated from 70 mg of human neocortex, containing approximately equal proportions of gray and white matter, below each recording electrode as previously described (Rakhade et al., 2005). Synthesis of cyanine-3- and cyanine-5-labeled cRNA targets was performed with 500 ng of total RNA using Low RNA Input Linear Amp kit (Agilent) for reverse transcription with Moloney Murine Leukemia Virus Reverse Transcriptase followed by in vitro transcription with T7 RNA polymerase. cRNA targets were spin column purified and hybridized to human, genome-wide 60-mer oligonucleotide arrays (catalog #G411A, Agilent) for 17 h at 60°C in a two-color dye-swap fashion. Based on prospective power analyses, technical quadruplicates were used to detect a 50% change in gene expression at 90% power (noncentral t distribution, α = 0.05) (Krawetz, 2009). Hybridized arrays were washed in successively stringent SSC buffers with 0.005% Triton X-102, carefully dried with compressed N2, and scanned using an Agilent Technologies Microarray Scanner. Sixteen-bit grayscale images were segmented using Imagene 6 (Biodiscovery). Signals <2 SDs of local background were discarded before significance testing.
To identify differentially expressed transcripts, a two-step, mixed-model ANOVA was implemented in SAS system v 9.1 (SAS Institute) as previously described with modifications (Jin et al., 2001). Intensity values were log2 transformed, and the following model was applied: yij= μ + Ai + Dj + Pk + ADij + (A)iPk + gijk, where μ is the sample mean, Ai is the effect of the ith array, Dj is the effect of dye, Pk is the effect of an individual patient, ADij is array dye interaction, (A)iPk is the within-patient array effect, and gikj is the residual covariance. The residual from this model is taken as the “normalized” expression values and then used in the following gene model to determine the treatment effect on each gene: rijklg = Aig + Djg + Pkg + Tlg + yijkl, where rijkg is the residual of each gene from the first model, Tlg is the treatment effect (control or epileptic), and Aig, Djg, and Pkg are the array, dye, and patient effects, respectively. The expression change for each gene is thus: log2 (fold) = Ttreated − Tcontrol. Local background-subtracted signals were then used in a separate step to compute the fold change of epileptic relative to control signals. Transcripts that had a ≥1.5-fold change and a false discovery rate (FDR) <0.1 were considered to be differentially expressed. Fold change cutoff was operationally defined based on the lowest expression change to be reproducibly verified by quantitative PCR. The FDR method of Benjamini (Reiner et al., 2003) was used to adjust significance values for the 12,880 pairwise comparisons performed.
Quantitative PCR.
A subset of 15 genes observed to be differentially expressed on the microarrays, ranging from 1.3-fold to 9-fold change, and of variable signal intensities, were verified with quantitative real-time PCR (qPCR). Many of these were chosen based on their known involvement in the MAPK/CREB signaling cascade. cDNA synthesis (Invitrogen) was performed using 1.5 μg of total RNA. Triplicate qPCRs were performed using commercially available Taqman primer/probe sets (Applied Biosystems) as previously described (Rakhade et al., 2005). For Chromatin immunoprecipitation (ChIP), QuantiTect SYBR Green master mix (Qiagen) and primer sets designed in the 5′ flanking regions were used to detect immunoprecipitated promoter sequences. PCR primer sequences and working conditions are available on request.
Bioinformatics.
RefSeq IDs corresponding to differentially expressed transcripts in epileptic brain regions were submitted to Pathway-Express (ontoexpress) to identify significantly represented biological pathways in the Kyoto Encyclopedia of Genes and Genomes (Khatri et al., 2006). Pathways with corrected significance <0.1 (hypergeometric distribution, Bonferroni's correction) were considered enriched. For transcription factor binding site enrichment, GeneIDs corresponding to the 137 differentially expressed transcripts were queried against sets of an equal number of randomly selected, nonregulated transcripts whose expression ratio (epileptic vs control) was 1 using GeneACT (Cheung et al., 2006). Promoters were interrogated from −3000 to +100 bp relative to the transcription start methionine. Ten trials with random sampling of control transcripts were performed to estimate the frequency of a given consensus element in the nonregulated gene set. The probability of enrichment for each consensus element was determined using a hypergeometric distribution, and probabilities were adjusted using the Bonferroni's method. The CREB Target Gene Database (Zhang et al., 2005) (http://natural.salk.edu/CREB/) was cross-queried with the 137 differentially expressed transcripts to assess the presence of putative CREB target genes. The number of CREB target genes containing functional CREs in the human genome was taken as 4084 (Zhang et al., 2005), and the human genome was estimated at 25,000 based on the National Center for Biotechnology Information Build 35 assembly of the human genome (International Human Genome Sequencing Consortium, 2004).
Tissue fractionation and immunoblotting.
Human neocortex underlying specific recording electrode locations was fractionated as described with modifications (Luo et al., 1997). Only gray matter was used. Briefly, 500 mg of cortical gray matter was homogenized for two 16 stroke cycles (5 s/stroke, 30 s interval between cycles, on ice) in 20 volumes of buffer (320 mm sucrose, 10 mm Tris-HCl, pH 7.4, 10 mm Na4P2O7, 10 mm NaF, 1 mm PMSF, 2 mm Na3VO4) with 10 μg/ml each antipain, aprotinin, leupeptin, and peptistatin (Sigma) using a glass-Teflon homogenizer (Thomas Scientific) at 800 rpm. Homogenates were centrifuged at 700 × g for 10 min at 4°C, and P1 fractions (nuclei) were resuspended in sucrose-free buffer as above. Supernatants were centrifuged at 37,000 × g for 45 min at 4°C, and P2 fractions (membranes) were resuspended in sucrose-free buffer while supernatants (cytosol) were concentrated using Centricon membranes (Amicon). Immunoblotting was performed as previously described (Ginty et al., 1993). Twenty-five micrograms of fractionated protein was loaded in each lane, subjected to SDS-PAGE, and transferred to PVDF membrane (Millipore). Primary antibodies against ERK (Cell Signaling Technology), diphospho-ERK1/2 (Sigma), CREB or phospho-CREB (pCREB) (Cell Signaling Technology), or β-actin (Sigma) were incubated overnight at 4°C. HRP-conjugated goat anti-mouse IgG or anti-rabbit IgG secondary antibodies were used, and detection was performed using ECL substrate (PerkinElmer).
pCREB chromatin immunoprecipitation.
ChIP was performed as previously described (Kapatos et al., 2007), with modifications. Human neocortex underlying specific recording electrode locations where seizures began was fractionated as described previously with modifications as described above (Luo et al., 1997). Only gray matter was used for ChIP. ChIP was performed using chromatin fragments of 500 bp on average (Kapatos et al., 2007). QuantiTect SYBR Green master mix (Qiagen) and primers designed in the 5′ flanking regions were used. P1 fractions were layered on four volumes of 30% sucrose in homogenization buffer (10 mm Tris-HCl, pH 7.4, 10 mm Na4P2O7, 10 mm NaF, 1 mm PMSF, and 2 mm Na3VO4) with 10 μg/ml each antipain, aprotinin, leupeptin, and peptistatin (Sigma), and centrifuged at 1100 × g for 20 min at 4°C. Nuclei were resuspended in homogenization buffer and centrifuged at 5000 × g for 15 min at 4°C. The supernatant was removed, and cross-linking was performed by resuspending the pellet in 1% formaldehyde in PBS for 15 min at room temperature (RT). Nuclei were then centrifuged at 5000 × g for 15 min at 4°C, resuspended in 100 mm Tris-HCl, pH 9.4, 10 mm DTT, and incubated for 10 min at RT. Nuclei were centrifuged at 6500 × g for 15 min at 4°C, the supernatant was carefully aspirated, and the nuclear pellet was resuspended in lysis buffer (1% SDS, 10 mm EDTA, and 50 mm Tris-HCl, pH 8.0) with 10 μg/ml each antipain, aprotinin, leupeptin, and, peptistatin.
Cross-linked genomic DNA samples were then sonicated using an Autotune High Intensity Ultrasonic Processor to obtain an average fragment size of 500 bp. Nuclear debris was pelleted by centrifuging at 20,000 × g for 30 min at 4°C, and supernatants were carefully collected. Five percent of this supernatant was saved as “input DNA.” The remaining supernatants were diluted tenfold in ice-cold dilution buffer (1% SDS, 10 mm EDTA, 50 mm Tris-HCl, pH 8.0, 1 mm PMSF) with 10 μg/ml each protease inhibitor as above and precleared with 20 μg of rabbit IgG (Santa Cruz Biotechnology, Sc-2027) with incubation on an end-over-end rotary mixer for 1 h at 4°C. Two hundred micrometers of salmon sperm DNA/BSA-blocked Protein G agarose (50% slurry) was added, and the samples were incubated end-over-end for 1 h at 4°C. Beads were collected by centrifugation at 800 × g for 5 min at 4°C, and four aliquots, each containing 20 μg of DNA, were transferred to nonstick microcentrifuge tubes. Fresh protease inhibitors (as above) and 5 μg of antibody against phospho-CREB S133 (Santa Cruz Biotechnology, Sc-7978) were added, and samples were incubated end-over-end for 17 h at 4°C. Anti-Green Fluorescent protein antibody (5 μg, Santa Cruz Biotechnology) was used as a nonspecific control IgG. Following antibody binding, 50 μl of Protein G agarose (50% slurry) was added, and samples were incubated end-over-end for 2 h at 4°C. Immune complexes were collected by centrifugation at 800 × g for 5 min at 4°C, and supernatants were carefully aspirated and discarded. Immune complexes were washed sequentially with low-salt wash (0.1% SDS, 1% TX-100, 2 mm EDTA, 150 mm NaCl, 20 mm Tris-HCl, pH 8.0), high-salt wash (0.1% SDS, 1% Triton X-100, 2 mm EDTA, 500 mm NaCl, 20 mm Tris-HCl, pH 8.0), LiCL wash (0.25 m LiCl, 1% NP40, 1% deoxycholate, 1 mm EDTA, 10 mm Tris-HCl, pH 8.0), and finally TE (10 mm Tris-HCl, pH 8.0, 1 mm EDTA), with 10 min incubation at 4°C between each wash. Immune complexes were centrifuged at 800 × g, supernatants were discarded, and 175 μl of elution buffer (1% SDS, 0.1 m NaHCO3, 0.2 m NaCl, and 1 μg/ml Rnase A) was added to each sample. Input DNA samples received 122 μl of elution buffer and 3 μl of 0.5 m NaCl (300 mm NaCl final concentration). Cross-links were reversed by incubating beads and input DNA overnight (∼17 h) at 65°C. Samples were then brought to 10 mm EDTA, and protein was digested by incubating with 40 μg of Proteinase K for 1 h at 45°C. DNA was purified using the Qiaquick PCR Purification Kit (Qiagen) with elution in 10 mm Tris-HCl, pH 8.0, and stored at −20°C until qPCR analysis. Immunoprecipitated promoter fragments were detected with QuantiTect SYBR Green master mix (Qiagen), and primer sets were designed in the proximal promoter within 500 bp of the transcription start methionine, flanking the CRE when possible. Additional promoter sets were designed distal to the promoter as a control for each. For brain-derived neurotrophic factor (BDNF) primers were designed within promoter III. For each primer set, efficiency plots and melting curves were constructed to ensure >90% efficiency with a specific product, free of primer dimers. Primer sequences and working concentrations are available upon request.
Tissue immunostaining.
Immunohistochemical and immunofluorescence staining was performed on 20 μm cryosections prepared on tissue samples fixed in 4% paraformaldehyde/PBS for 48 h, equilibrated in 30% sucrose, and then stored frozen in OCT compound (Tissue Tek). Sections were equilibrated for 10 min at RT and were permeabilized in 0.5% Triton X-100 and PBS for 1 h at RT. Slides for histochemistry were washed three times in PBS and blocked with 0.3% hydrogen peroxide/50% methanol/PBS for 30 min. Slides were again washed in PBS and blocked in 0.05% Triton X-100/5% heat-inactivated goat serum/PBS for 1 h at RT. Primary antibodies against CREB and pCREB S133 (Cell Signaling Technology) were diluted in blocking buffer and applied overnight at 4°C. Sections were then washed and treated per the Vector Elite ABC kit for Rabbit IgG (Vector Laboratories) and developed with a DAB substrate (Sigma). Finally, slides were dehydrated in an ethanol gradient followed by xylene and then mounted using Cytoseal XYL. Digital images were captured using a Nikon Eclipse microscope fitted with a 24-bit digital camera (Q Imaging). For immunofluorescence staining, slides were permeabilized and washed as above, and blocked in 0.05% Triton X-100/5% heat-inactivated goat serum/PBS for 1 h at RT; and primary antibodies against CREB (Cell Signaling Technology), pCREB (Cell Signaling Technology), and NeuN (Millipore Bioscience Research Reagents) were applied; and slides were incubated overnight at 4°C. Slides were washed in PBS and incubated with Alexa Fluor-conjugated secondary antibodies against mouse or rabbit IgG (Invitrogen) diluted in blocking solution containing 500 nm DAPI (Invitrogen) to visualize nuclei. Twelve-bit grayscale images were obtained using a Nikon Eclipse E600 epifluorescent microscope with cooled CCD as described above.
In situ hybridization.
In situ hybridization was performed using 35S-labeled RNA probes as previously described (Rakhade et al., 2005). Briefly, neocortical tissues were fixed in 4% paraformaldehyde/PBS at 4°C for 48 h, cryoprotected in 30% sucrose, and cryosectioned at 20 μm on Superfrost Microslideson Superfrost Microslides (VWR). Full-length human cDNA clones [activity-regulated cytoskeletal-associated protein (ARC): 5198843; BDNF: 5193877; dual-specificity phosphatase 1 (DUSP1): 4794895; early growth response 1 (EGR1): 6188360; EGR3: 8143768; GAPDH: 95132246CA2; neuronal activity-regulated pentraxin (NARP): 5198692; regulator of G-protein signaling 2 (RGS2): 4830785; somatostatin: 5240781; tachykinin 1 (TAC1): 4792746] (Open Biosystems) were sequence verified and linearized with the appropriate restriction endonucleases. For ARC, an 899 nt fragment with T3 and T7 promoters was generated by PCR (sequences available upon request). Sense and antisense 35S-labeled RNA probes were generated by in vitro transcription using the appropriate RNA polymerases (T3, T7, and SP6), and probes were purified on NuClean R50 Sephadex columns (Shelton Scientific). Tissues were hybridized for 17 h at 52°C, washed, and dehydrated in ethanol. Slides were then dipped in photographic emulsion (Kodak NTB) dried, and exposed for 2–21 d at 4°C. Nuclei were counterstained with DAPI, and slides were coverslipped in 90% glycerol/PBS. Dark-field images were captured using a Q Imaging 24-bit digital camera and a Nikon SMZ-10A dissecting microscope for low-power images, and a Nikon Eclipse E600 microscope with a Princeton Instruments Micromax cooled CCD digital camera for fluorescence-labeled nuclei.
Synaptic counting.
Double-immunofluorescence labeling was performed using 10 μm cryosections of human neocortex as above, with antibodies against synapsin-1 (Millipore Bioscience Research Reagents) and neurofilaments (RT97; Developmental Studies Hybridoma Bank). The latter was used for visualization of the horizontal fibers of cortical layer 1 to allow navigation to layer 2/3. Confocal stacks of 200 × 200 × 10 μm images were acquired with a z-step of 1.05 μm and combined into a single 4 × 105 μm3 neocortical volume using a Nikon Eclipse microscope with a D-Eclipse C1 confocal system (Nikon). Synapsin-1immunoreactive puncta were quantified in triplicate layer 2/3 volumes for each paired epileptic and control region (n = 4 patients, 24 volumes) using MetaMorph (Molecular Devices) in a blinded fashion. A standard synapse area was defined for each tissue section by selecting a 100 distinct puncta per replicate field (300 puncta section) and determining the mean pixel area. This approach was taken to account for intrasection and intersection variation in staining intensity. Other purely morphometric methods were also performed and yielded similar results (data not shown). Images were manually thresholded to exclude background as well as the “hole area” corresponding to neuronal somata, and the total immunoreactive pixel area was determined. This area was then divided by the standard synapse size (in pixels) to yield the synapse density, and values were corrected for hole area. Mean synaptic density values per unit area were computed for each patient and the grand mean ± SEM was computed for control and epileptic regions, and assessed for significance using a two-tailed Student's t test with Bonferroni's correction.
Results
Human epileptic transcriptome
When patients with recurrent seizures fail to respond to medications, a surgical approach that involves 2–5 d of continuous brain surface recording is initiated to identify and remove epileptic brain regions that include electrode locations where seizures begin (seizure onset zones) (Fig. 1a) together with areas showing frequent interictal epileptiform discharges that occur between seizures (Fig. 1b). These can then be graphically displayed on cortical surface maps, as shown in Figure 1c. Interictal epileptiform discharges, often referred to as “interictal spikes” are far more frequent than seizures and have been shown to correlate with activity-dependent gene expression in human cortex (Asano et al., 2003; Rakhade et al., 2005; Téllez-Zenteno et al., 2005; Rakhade et al., 2007). In many patients who undergo cortical resections for recurrent seizures, small nearby regions of neocortex without spontaneous epileptiform activity are removed as part of a larger anatomical resection, thus providing a unique opportunity to identify what is different between epileptic regions and control tissues from the same patient (Rakhade et al., 2005).
Figure 1.

Transcriptional profiling of human epileptic neocortex implicates MAPK–CREB-dependent transcription. a, Continuous brain surface recordings before tissue resection were used to differentiate electrode locations with (epileptic) and without (control) seizures. b, c, Interictal spikes (between seizures) (b) are far more frequent than seizures and were quantified and superimposed as a green-to-red heat map on the three-dimensional brain surface rendering (c). Calibration: 1 mV, 1 s. This rendering shows an example of the paired seizure onset zones (E1–E3) and nearby control regions (C1–C3) used for transcriptional profiling within each patient. d, Paired epileptic (E) and control (C) tissues from five patients (P1–P5) were subjected to transcriptome analysis on quadruplicate microarrays (↕) for each patient. e, The relative expression of a panel of 15 differentially expressed transcripts spanning the range of detection on oligonucleotide microarrays (light bars) is compared with measurements made by qPCR (dark bars). Data represent the mean of averaged triplicate measures within each of three patients (n = 3) ± SEM. CCAAT/enhancer binding protein β (CEBPB) at 1.3-fold was the lowest magnitude change confirmed. Linear correlation analysis of microarray versus qPCR showed excellent correlation with r = 0.934. f, Ontological analysis of 137 differentially expressed transcripts indicated significant representation of MAPK signaling and cell cycle. g, Differential transcription factor binding site search of proximal promoters (−3000 to +100 bp) demonstrated significant enrichment of consensus elements for CREB, SRF, NF-κB, and USF (dark bars), with CREB most significant by several orders of magnitude.
Table 1 shows a list of the pediatric and adult patients used for this study. This group of patients was carefully selected because they all had similar seizure types (complex partial), minimal histopathology (mostly gliosis), and the presence of nearby control regions to compare to seizure onset zones. To focus on transcriptional differences present in seizure onset zones that make seizures more likely, all the tissue samples used here were from patients who had not had seizures immediately before tissue resection. Seizures are well known to produce marked, but often transient changes in gene expression (Moore et al., 1996; Xi et al., 2007). The experimental design, shown in Figure 1d, uses quadruplicate microarrays allowing for the detection of 1.5-fold expression changes at 90% power for each patient on the first five patients listed in Table 1. Using the FDR method of Benjamini (Reiner et al., 2003) to account for multiple pairwise comparisons (≥1.5-fold and FDR <0.1), we observed 137 significant gene expression changes across all five patients (Table 2). A subset of 15 genes spanning 1.3- to 9.6-fold differences was confirmed by qPCR (Fig. 1e). Genes were selected for qPCR confirmation based on their known roles within the most statistically significant pathways as well as on their varying degrees of differential expression.
Table 2.
Total of 137 differentially expressed genes at seizure onset zones
| Accession | Symbol | Description | Expression change |
||
|---|---|---|---|---|---|
| Fold | FDR | CRE | |||
| Signaling | |||||
| NM_002923 | RGS2 | Regulator of G-protein signaling 2, 24 kDa | 4.9 | <0.0001 | HT |
| NM_004417 | DUSP1 | Dual-specificity phosphatase 1 | 3.4 | <0.0001 | FT |
| NM_001554 | CYR61 | Cysteine-rich, angiogenic inducer, 61 | 3.2 | <0.0001 | HT |
| NM_000963 | PTGS2 | Prostaglandin-endoperoxide synthase 2 | 3.0 | 0.0001 | |
| NM_002922 | RGS1 | Regulator of G-protein signaling 1 | 2.6 | 0.0012 | HT |
| NM_001946 | DUSP6 | Dual-specificity phosphatase 6 | 2.6 | <0.0001 | |
| NM_025195 | TRIB1 | Tribbles homolog 1 (Drosophila) | 2.3 | 0.0002 | H |
| NM_004419 | DUSP5 | Dual-specificity phosphatase 5 | 2.2 | 0.0105 | HT |
| NM_018948 | ERRFI1 | ERBB receptor feedback inhibitor 1 | 2.2 | <0.0001 | |
| NM_170735 | BDNF | Brain-derived neurotrophic factor | 2.1 | 0.0228 | H |
| NM_005842 | SPRY2 | Sprouty homolog 2 (Drosophila) | 1.7 | <0.0001 | H |
| NM_002928 | RGS16 | Regulator of G-protein signaling 16 | 1.7 | 0.0011 | |
| NM_005524 | HES1 | Hairy and enhancer of split 1, (Drosophila) | 1.6 | 0.0023 | HT |
| NM_004418 | DUSP2 | Dual-specificity phosphatase 2 | 1.6 | 0.0009 | HT |
| NM_018159 | NUDT11 | Nudix-type motif 11 | 1.5 | 0.0018 | H |
| NM_145735 | ARHGEF7 | Rho guanine nucleotide exchange factor (GEF) 7 | 1.5 | 0.0064 | HT |
| NM_018444 | PPM2C | Protein phosphatase 2C, catalytic subunit | 1.5 | 0.0001 | F |
| NM_003463 | PTP4A1 | Protein tyrosine phosphatase type IVA, member 1 | 1.5 | 0.0046 | HT |
| NM_032294 | CAMKK1 | Calcium/calmodulin-dependent protein kinase kinase 1 | 1.5 | 0.0134 | |
| NM_001010926 | HES5 | Hairy and enhancer of split 5 (Drosophila) | 0.7 | 0.0267 | |
| Transcription | |||||
| NM_001965 | EGR4 | Early growth response 4 | 9.6 | <0.0001 | HT |
| NM_002135 | NR4A1 | Nuclear receptor subfamily 4, group A, member 1 | 4.7 | <0.0001 | HT |
| NM_001964 | EGR1 | Early growth response 1 | 4.7 | <0.0001 | HT |
| NM_005252 | FOS | v-Fos FBJ murine osteosarcoma viral oncogene homolog | 4.2 | <0.0001 | HT |
| NM_173198 | NR4A3 | Nuclear receptor subfamily 4, group A, member 3 | 3.5 | <0.0001 | H |
| NM_000399 | EGR2 | Early growth response 2 (Krox-20 homolog, Drosophila) | 3.1 | <0.0001 | HT |
| NM_006732 | FOSB | FBJ murine osteosarcoma viral oncogene homolog B | 3.0 | <0.0001 | FHT |
| NM_002229 | JUNB | jun B proto-oncogene | 2.9 | <0.0001 | HT |
| NM_013376 | SERTAD1 | SERTA domain containing 1 | 2.6 | 0.0004 | |
| NM_004024 | ATF3 | Activating transcription factor 3 | 2.4 | 0.0002 | HT |
| NM_005384 | NFIL3 | Nuclear factor, interleukin 3 regulated | 2.4 | 0.0004 | |
| NM_004430 | EGR3 | Early growth response 3 | 2.2 | <0.0001 | HT |
| NM_005195 | CEBPD | CCAAT/enhancer binding protein (C/EBP), delta | 2.2 | 0.0013 | |
| NM_003407 | ZFP36 | Zinc finger protein 36, C3H type, homolog (mouse) | 2.0 | <0.0001 | HT |
| NM_005655 | KLF10 | Kruppel-like factor 10 | 1.8 | 0.0013 | HT |
| NM_012081 | ELL2 | Elongation factor, RNA polymerase II, 2 | 1.8 | 0.0257 | FT |
| NM_002166 | ID2 | Inhibitor of DNA binding 2 | 1.8 | 0.0001 | H |
| NM_183013 | CREM | cAMP responsive element modulator | 1.7 | 0.0013 | H |
| NM_015508 | TIPARP | TCDD-inducible poly(ADP-ribose) polymerase | 1.7 | <0.0001 | |
| NM_002228 | JUN | jun oncogene | 1.6 | 0.0002 | H |
| BC066345 | ARID5B | AT-rich interactive domain 5B (MRF1-like) | 1.5 | 0.0003 | |
| NM_006079 | CITED2 | Cbp/p300-interacting transactivator | 1.5 | 0.0859 | H |
| NM_014740 | EIF4A3 | Eukaryotic translation initiation factor 4A, isoform 3 | 1.5 | 0.0021 | |
| NM_005915 | MCM6 | Minichromosome maintenance complex component 6 | 0.7 | 0.0017 | |
| Synaptic | |||||
| NM_015193 | ARC | Activity-regulated cytoskeleton-associated protein | 6.2 | <0.0001 | |
| NM_002523 | NPTX2 | Neuronal pentraxin II | 3.5 | <0.0001 | H |
| AB028977 | SV2C | Synaptic vesicle glycoprotein 2C | 2.1 | 0.0001 | |
| NM_181711 | GRASP | GRP1-associated scaffold protein | 1.9 | <0.0001 | H |
| NM_003469 | SCG2 | Secretogranin II (chromogranin C) | 1.8 | 0.0009 | FT |
| NM_052978 | TRIM9 | tripartite motif-containing 9 | 1.7 | 0.0021 | |
| NM_001819 | CHGB | chromogranin B (secretogranin 1) | 1.6 | 0.0230 | FT |
| NM_017450 | BAIAP2 | BAI1-associated protein 2 | 1.5 | 0.0485 | |
| NM_014379 | KCNV1 | Potassium channel, subfamily V, member 1 | 1.5 | 0.0947 | |
| NM_198904 | GABRG2 | GABAA receptor, γ2 | 1.5 | 0.0016 | HT |
| NM_004272 | HOMER1 | Homer homolog 1 (Drosophila) | 1.5 | 0.0433 | H |
| NM_001392 | DTNA | Dystrobrevin, α | 1.5 | 0.0411 | |
| NM_001050 | SSTR2 | Somatostatin receptor 2 | 1.5 | 0.0121 | |
| NM_000817 | GAD1 | Glutamate decarboxylase 1 (brain, 67 kDa) | 1.5 | 0.0111 | HT |
| NM_002245 | KCNK1 | Potassium channel, subfamily K | 1.5 | 0.0024 | HT |
| NM_004975 | KCNB1 | Potassium voltage-gated channel, Shab-related subfamily | 1.5 | 0.0681 | H |
| Neuromodulators | |||||
| NM_006228 | PNOC | Prepronociceptin | 2.8 | <0.0001 | |
| NM_024411 | PDYN | Prodynorphin | 1.9 | 0.0109 | |
| NM_003182 | TAC1 | Tachykinin, precursor 1 | 1.8 | <0.0001 | HT |
| NM_001048 | SST | Somatostatin | 1.8 | 0.0003 | FT |
| NM_001124 | ADM | Adrenomedullin | 1.7 | 0.0010 | |
| NM_001117 | ADCYAP1 | Adenylate cyclase activating polypeptide 1 (pituitary) | 1.7 | 0.0068 | HT |
| Cytoskeleton/extracellular matrix | |||||
| NM_001017402 | LAMB3 | Laminin, β3 | 2.5 | 0.0011 | |
| NM_002727 | SRGN | Serglycin | 2.4 | 0.0021 | HT |
| NM_000439 | PCSK1 | Proprotein convertase subtilisin/kexin type 1 | 1.8 | 0.0008 | F |
| NM_006043 | HS3ST2 | Heparan sulfate (glucosamine) 3-O-sulfotransferase 2 | 1.8 | 0.0005 | FT |
| NM_005382 | NEFM | Neurofilament, medium polypeptide 150 kDa | 1.7 | 0.0040 | |
| NM_022359 | PDE4DIP | Phosphodiesterase 4D interacting protein (myomegalin) | 1.6 | 0.0005 | |
| AK128790 | GFAP | Glial fibrillary acidic protein | 1.5 | 0.0686 | |
| NM_006750 | SNTB2 | Syntrophin, β2 (dystrophin-associated protein A1) | 1.5 | 0.0032 | H |
| Stress | |||||
| NM_015675 | GADD45B | Growth arrest and DNA-damage-inducible, β | 4.2 | <0.0001 | HT |
| NM_006308 | HSPB3 | Heat shock 27 kDa protein 3 | 2.6 | 0.0001 | |
| NM_005345 | HSPA1A | Heat shock 70 kDa protein 1A | 2.5 | 0.0001 | |
| NM_001924 | GADD45A | Growth arrest and DNA-damage-inducible, α | 2.3 | <0.0001 | |
| NM_006145 | DNAJB1 | DnaJ (Hsp40) homolog, subfamily B, member 1 | 2.3 | 0.0003 | |
| NM_006705 | GADD45G | Growth arrest and DNA-damage-inducible, γ | 2.0 | 0.0051 | |
| NM_005527 | HSPA1L | Heat shock 70 kDa protein 1-like | 1.9 | 0.0092 | H |
| NM_002155 | HSPA6 | Heat shock 70 kDa protein 6 (HSP70B′) | 1.8 | 0.0935 | |
| NM_004281 | BAG3 | BCL2-associated athanogene 3 | 1.6 | 0.0041 | HT |
| NM_006597 | HSPA8 | Heat shock 70 kDa protein 8 | 1.6 | 0.0130 | |
| NM_012266 | DNAJB5 | DnaJ (Hsp40) homolog, subfamily B, member 5 | 1.5 | 0.0009 | HT |
| Metabolism/homeostasis | |||||
| NM_002133 | HMOX1 | Heme oxygenase (decycling) 1 | 2.9 | 0.0082 | |
| BC060766 | SLC2A14 | Solute carrier family 2 (facilitated glucose transporter), member 14 | 2.3 | <0.0001 | |
| NM_001006641 | SLC25A25 | Solute carrier family 25 (mitochondrial carrier; phosphate carrier) | 2.2 | <0.0001 | |
| NM_016109 | ANGPTL4 | Angiopoietin-like 4 | 1.9 | 0.0136 | H |
| NM_003956 | CH25H | Cholesterol 25-hydroxylase | 1.9 | 0.0004 | |
| NM_203301 | FBXO33 | F-box protein 33 | 1.7 | 0.0001 | |
| NM_006931 | SLC2A3 | Solute carrier family 2 (facilitated glucose transporter), member 3 | 1.6 | 0.0072 | |
| NM_015359 | SLC39A14 | Solute carrier family 39 (zinc transporter), member 14 | 1.5 | 0.0007 | |
| NM_021009 | UBC | Ubiquitin C | 1.5 | 0.0017 | |
| NM_181726 | ANKRD37 | Ankyrin repeat domain 37 | 1.5 | <0.0001 | |
| NM_000527 | LDLR | Low-density lipoprotein receptor | 1.5 | 0.0011 | |
| Cytokines/immunologic | |||||
| NM_002192 | INHBA | Inhibin, βA (activin A, activin AB α polypeptide) | 4.1 | <0.0001 | |
| NM_003004 | SECTM1 | Secreted and transmembrane 1 | 2.8 | 0.0048 | |
| NM_001008540 | CXCR4 | Chemokine (C-X-C motif) receptor 4 | 2.0 | <0.0001 | |
| NM_000576 | IL1B | Interleukin 1, β | 1.9 | 0.0011 | |
| NM_005746 | PBEF1 | Pre-B-cell colony-enhancing factor 1 | 1.8 | 0.0475 | H |
| NM_003955 | SOCS3 | Suppressor of cytokine signaling 3 | 1.7 | 0.0190 | |
| NM_172374 | IL4I1 | Interleukin 4 induced 1 | 1.7 | 0.0540 | |
| NM_004233 | CD83 | CD83 molecule | 1.7 | <0.0001 | |
| NM_001007245 | IFRD1 | Interferon-related developmental regulator 1 | 1.6 | 0.0034 | FHT |
| Cell cycle/differentiation | |||||
| NM_001004431 | METRNL | Meteorin, glial cell differentiation regulator-like | 2.0 | 0.0029 | |
| NM_001001852 | PIM3 | Pim-3 oncogene | 1.7 | 0.0003 | |
| NM_003633 | ENC1 | Ectodermal-neural cortex (with BTB-like domain) | 1.6 | 0.0037 | |
| NM_000389 | CDKN1A | Cyclin-dependent kinase inhibitor 1A (p21, Cip1) | 1.5 | 0.0011 | H |
| NM_004073 | PLK3 | polo-like kinase 3 (Drosophila) | 1.5 | 0.0066 | |
| NM_032808 | LINGO1 | Leucine-rich repeat and Ig domain containing 1 | 1.5 | 0.0182 | H |
| NM_006622 | PLK2 | Polo-like kinase 2 (Drosophila) | 1.5 | 0.0333 | H |
| NM_021960 | MCL1 | Myeloid cell leukemia sequence 1 (BCL2-related) | 1.5 | 0.0018 | |
| Hypothetical proteins/open reading frames | |||||
| BC052560 | LOC387763 | Hypothetical LOC387763 | 2.9 | 0.0001 | |
| NM_024603 | C1orf165 | Chromosome 1 open reading frame 165 | 1.7 | <0.0001 | |
| NM_007021 | C10orf10 | Chromosome 10 open reading frame 10 | 1.7 | 0.0158 | |
| AB029030 | KIAA1107 | KIAA1107 protein | 1.6 | 0.0460 | |
| NM_032895 | MGC14376 | Hypothetical protein MGC14376 | 1.6 | 0.0021 | |
| NM_018689 | KIAA1199 | KIAA1199 | 1.5 | <0.0001 | |
| NM_032823 | C9orf3 | Chromosome 9 open reading frame 3 | 1.5 | 0.0067 | FH |
| NM_017866 | TMEM70 | Transmembrane protein 70 | 1.5 | 0.0008 | |
| BC041772 | SPNS2 | spinster homolog 2 (Drosophila) | 1.5 | 0.0213 | |
| NM_001001873 | LOC283174 | Hypothetical protein LOC283174 | 1.5 | 0.0178 | |
| NM_012261 | C20orf103 | Chromosome 20 open reading frame 103 | 1.5 | 0.0011 | |
| NM_052871 | MGC4677 | Hypothetical protein MGC4677 | 1.5 | 0.0384 | |
| Other | |||||
| NM_004907 | IER2 | Immediate early response 2 | 2.1 | <0.0001 | FT |
| NM_000518 | HBB | Hemoglobin, β | 2.0 | 0.0408 | |
| NM_000517 | HBA2 | Hemoglobin, α 2 | 1.8 | 0.0040 | |
| NM_000519 | HBD | Hemoglobin, δ | 1.8 | 0.0042 | |
| NM_000558 | HBA1 | Hemoglobin, α1 | 1.8 | 0.0047 | |
| NM_003063 | SLN | Sarcolipin | 1.6 | 0.0031 | |
| BX538238 | MALAT1 | Metastasis-associated lung adenocarcinoma transcript 1 | 1.6 | 0.0200 | |
| NM_020801 | ARRDC3 | Arrestin domain containing 3 | 1.5 | 0.0034 | |
| NM_014583 | LMCD1 | LIM and cysteine-rich domains 1 | 1.5 | 0.0374 | FT |
| AK125140 | TMTC1 | Transmembrane and tetratricopeptide repeat containing 1 | 1.5 | 0.0001 | |
| AB023174 | ANKRD6 | Ankyrin repeat domain 6 | 1.5 | 0.0065 | |
| NM_001888 | CRYM | Crystallin, μ | 1.5 | 0.0355 | |
The proximal promoter (−3000 to +100 kb) of genes with expression change ≥1.5-fold and FDR < 0.1 were queried for conserved full CRE palindromes (TGACGTCA) (F) or half-sites (CGTCA/TGACG) (H) using the CREB Target Gene Database. When present, a TATA box is indicated by (T).
Rather than focusing in on any single gene, bioinformatic analyses identified the most statistically significant biological pathways represented by these 137 differentially expressed genes. Ontological analysis using Pathway-Express (Khatri et al., 2006) identified MAPK signaling (15 genes, p = 2.8 × 10⁻⁸) and cell cycle (5 genes, p = 1.9 × 10⁻²) as the most significantly represented pathways (Fig. 1f). BDNF; DUSPs 1, 2, 5, and 6; and FOS were the major contributors to the observed enrichment. Additionally, a transcription factor binding site search compared the frequency of consensus binding sites in the epileptic transcriptome to an equal number of expressed, non-differentially regulated genes (Cheung et al., 2006). This search identified enrichment for CREB, serum response factor (SRF), nuclear factor of κ light polypeptide enhancer (NF-κB), and upstream transcription factor (USF). CREB (p = 7.4 × 10⁻¹⁰, hypergeometric distribution, Bonferroni's correction) was most significant over the next factor, SRF (p = 5.9 × 10⁻⁶), by several orders of magnitude (Fig. 1g). To determine what proportion of the 137 genes is likely to contain functional CREs, we cross-queried these genes with the CREB Target Gene Database (http://natural.salk.edu/CREB/) (Zhang et al., 2005). Seventy-four percent (102) possess either a full CRE palindrome (TGACGTCA) or a half-site (CGTCA/TGACG) in their proximal promoter, and 44% (60) of these are expected to be functional since they are conserved in humans, mice, and rats (Table 2). This represents a significant enrichment over the estimated promoter-CRE frequency in the human genome (102/137 compared with 4084/25,000, respectively; p = 4.5 × 10⁻⁸, hypergeometric distribution, Bonferroni's correction) (Zhang et al., 2005).
Together, this human epileptic transcriptome strongly implicates the MAPK–CREB pathway, which is a well described pathway, both during development and in adults, for activity-dependent synaptic plasticity and in models of learning and memory (Impey et al., 1999; Lonze and Ginty, 2002). While this pathway has not been described in human epileptic neocortex, increased ERK phosphorylation was reported in temporal neocortex from patients with intractable epilepsy, and CREB is well known to be phosphorylated following seizure activity in both the hippocampus and cortex of rodents (Moore et al., 1996; Xi et al., 2007). Repressors of this pathway, such as inducible cAMP early repressor, suppress epileptogenesis (Porter et al., 2008). In acute seizure models in animals, ERK and CREB are maximally phosphorylated within minutes and return to baseline in 2–4 h (Moore et al., 1996; Merlo et al., 2004; Houser et al., 2008). Since none of the patients studied had seizures immediately before tissue resection, its seems unlikely that persistent MAPK-CREB activation is induced by seizures, but instead may be due to ongoing interictal activity (shown in Fig. 1b), as has been shown previously for some activity-dependent genes (Rakhade et al., 2007).
Persistent MAPK-CREB activation in human epileptic neocortex
To validate the pathways implicated from transcriptional profiling, we determined the activation state of the MAPK–CREB pathway in human seizure onset zones by Western blotting and immunostaining. Higher phosphorylation levels of both the MAPK intermediate ERK1/2 and CREB were observed in epileptic neocortex samples compared with control cortex from the same patients (Fig. 2a). Immunostaining of human epileptic and control neocortex revealed that these molecules are activated in spatially restricted regions limited to the most superficial layers of the six-layered neocortex (Fig. 2b). While ERK1/2 is activated predominantly in the axodendritic processes of layers 1–3, CREB phosphorylation was restricted to neuronal nuclei of layers 2/3 whose synaptic contacts are concentrated in layers 1–3. In fact, double labeling of epileptic neocortex with pCREB antibodies and the neuronal marker NeuN revealed that 84% of neurons were pCREB positive in layer 2/3 in the epileptic regions compared with 5% in control regions, with no differences in neuronal density (Fig. 3). Higher-magnification views show that both larger pyramidal-shaped neurons as well as smaller granular-shaped neurons show persistent CREB activation (Fig. 4). This is of interest in light of observations that both downstream targets, BDNF and EGR3, have important regulatory effects on a number of GABA receptors seen in experimental animal models of epileptogenesis (Roberts et al., 2005; Lund et al., 2008).
Figure 2.

Persistent MAPK-CREB activation in human epileptic neocortex. a, Robust phosphorylation of ERK1/2 and CREB were observed by Western blot analysis of nuclear fractions of human epileptic neocortex. No changes in the nonphosphorylated forms of either protein or β-actin were observed (n = 3 patients). b, Immunohistochemistry shows marked ERK1/2 phosphorylation in the axodendritic fields of neocortical layers 1and 2 (pERK) together with pCREB in the nuclei of layers 2/3 cells in an adjacent section. Scale bars, 100 μm. n = 4 patients.
Figure 3.

Quantitative analysis of neuronal CREB phosphorylation in layer 2/3 human epileptic neocortex. a, Double-immunofluorescence staining of control and epileptic neocortex for pCREB and CREB together with the neuronal marker NeuN shows that CREB is present throughout the lamina in both control and epileptic tissue, while pCREB is present only in epileptic tissue and is restricted to layer 2/3. b, Quantitation of the proportion of NeuN-positive cells with pCREB colocalization in layers 2/3 by blinded, manual counting revealed that 84 ± 1% of neurons in epileptic neocortex exhibited CREB phosphorylation compared with 5 ± 1% in control tissue (p = 5.4 × 10⁻⁵, one-tailed t test, Bonferroni's correction; n = 3 patients, triplicate fields for each control and epileptic neocortical region, ±SEM). c, The number of neurons in layer 2/3 epileptic and control regions were similar as assessed by manual counting of NeuN-positive cells per field (78 ± 5 compared with 72 ± 4 cells/field, ±SEM).
Figure 4.
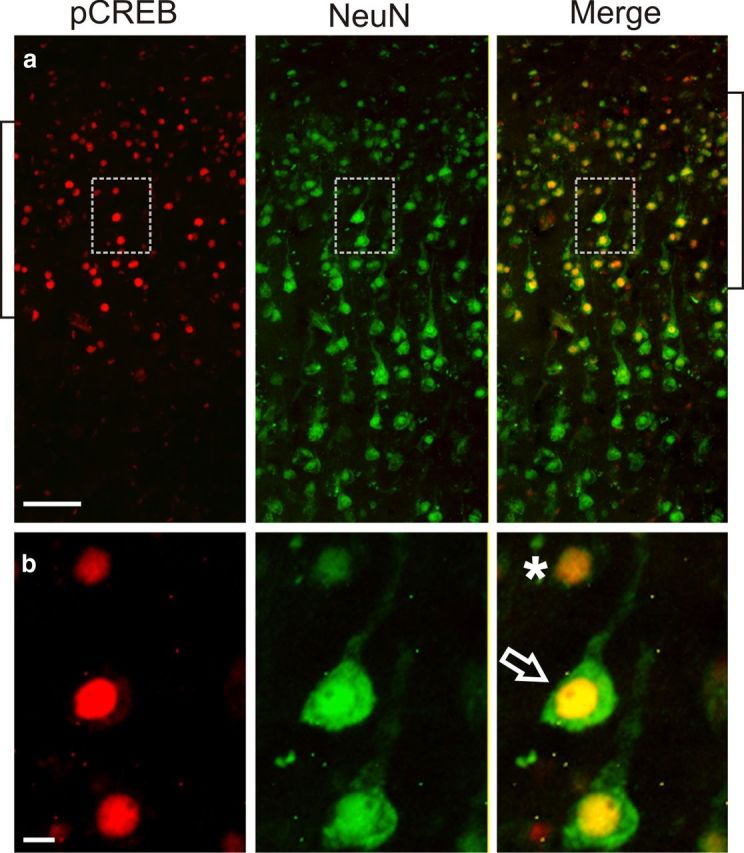
CREB phosphorylation occurs in pyramidal and granular neurons. a, pCREB is localized in NeuN-positive neurons in layers 2/3 (brackets). b, Higher magnification of the inset boxes shows pCREB in both granular- (*) and pyramidal-shaped neurons (⇒). Scale bars, 100 μm.
CRE occupancy of differentially expressed CREB target genes
Following CREB phosphorylation, transcription is induced at CREs through the recruitment of RNA polymerase II (POLII) (Mayr and Montminy, 2001; Impey et al., 2004). We therefore asked whether phosphorylated CREB was associated with the proximal promoters of target genes induced at human epileptic brain regions using ChIP (Fig. 5; POL II data not shown). FOS, a well described CREB target gene that was induced in the epileptic transcriptome also served as a positive control for the ChIP assay (Impey et al., 2004). For each gene, a distal region well upstream of the proximal promoter was used as a control. As an example, a distal region (−2830 to −2700) upstream of the FOS proximal promoter was used to establish the assay background (Fig. 5a). Promoter sequences of induced CREB target genes with known roles in neuronal signaling, excitability, and synaptic plasticity were enriched from 7- to 22-fold relative to IgG precipitates (Fig. 5b). There was no enrichment of CREB target gene distal control regions in pCREB immunoprecipitates. The association of pCREB with the promoters of induced target genes, together with the observed activation of MAPK and CREB at human seizure onset zones in the interictal state (Figs. 2, 3), suggests the existence of heightened MAPK/CREB signaling underlying the observed downstream transcriptional changes.
Figure 5.

Persistent pCREB association with the proximal promoter of CREB target genes in human epileptic neocortex. a, A schematic of the FOS 5′ flanking regions shows the distal upstream (−2800 to −2730) and proximal (−124 to −235) regions used as negative and positive controls, respectively for ChIP. b, Quantitative PCR shows marked enrichment of target gene promoter regions in pCREB immunoprecipitates relative to IgG. There was no enrichment for target genes in distal control regions. Data are mean ± pooled SEM (n = 8 proximal promoter; n = 4 distal control regions, two independent experiments).
Spatial organization of CREB target gene induction in human epileptic neocortex
At present, electrocorticography is the only way to localize human epileptic brain regions (Fig. 1). Given this highly significant association of MAPK-CREB activation and CREB target gene induction at seizure onset zones, this pathway should be an excellent biomarker for the cellular and spatial organization of the human cortex that produces seizures. We therefore explored the spatial organization of CREB activation together with several downstream genes within human epileptic brain regions as a means to map the anatomical substrates of neocortical epileptic activity. A representative example is shown in Figure 6, where CREB phosphorylation in layers 2/3 extends over large regions of neocortex (Fig. 6a) and displays rather abrupt boundaries, often at sulcal–gyral interfaces (n = 4 patients). As a control, nonphosphorylated CREB was compared with pCREB on an adjacent section (Fig. 6b). Unlike the spatially restricted pattern of pCREB, CREB was found in all cortical lamina and extended well beyond the lateral borders defined by pCREB.
Figure 6.
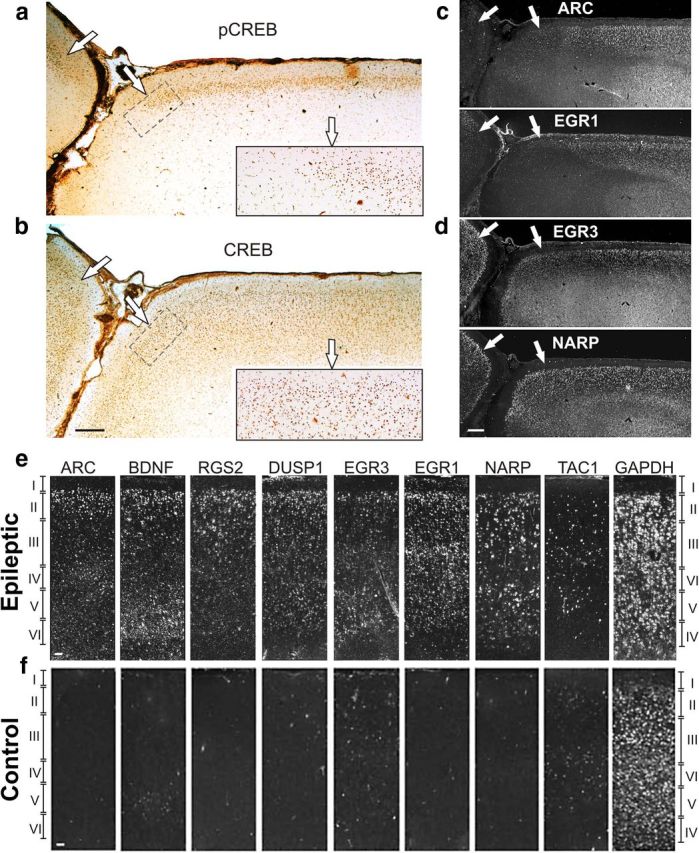
Phosphorylated CREB and its target genes are maximally induced in layers 2/3 over wide expanses of neocortex with distinct lateral boundaries. a, Intense pCREB immunoreactivity was seen in neocortical layers 2/3 extending across large fields of epileptic neocortex with distinct boundaries at sulcal–gyral interfaces (⇒) seen at low and high magnification (inset). b, In contrast, nonphosphorylated CREB is present in all layers and extends past the pCREB boundaries in an adjacent tissue section. c, Induction of differentially expressed target genes by in situ hybridization for ARC and EGR1 shows a lateral distribution similar to pCREB that is maximal in layers 2/3. d, EGR3 and NARP extend beyond the pCREB boundaries. e, Gene induction was maximal in neocortical layers 2/3 in epileptic cortex for a majority of the genes examined in contrast to the neuromodulator TAC1 and the ubiquitously expressed housekeeping gene GAPDH. f, These inductions were not seen in control tissue from the same patient. Scale bars: a–d, 0.5 mm; e, f, 100 μm.
In situ hybridizations were then performed on serial adjacent sections to define the spatial relationships of several of the induced CREB target genes including ARC, BDNF, DUSP1, EGR1, EGR3, NARP, RGS2, and TAC1. Two distinct patterns emerged. In the first, exemplified by ARC and EGR1, gene induction closely paralleled pCREB in well demarcated regions of layers 2/3 (Fig. 6c, white arrows). In the second pattern, genes such as EGR3 and NARP extended both to deeper lamina as well as beyond the lateral boundaries defined by pCREB, ARC, and EGR1 (Fig. 6d). Even the genes whose expression was not limited to layer 2/3 neurons showed maximal expression in layer 2/3 (n = 5 patients) (Fig. 6e, top), similar to the pattern of CREB phosphorylation. This was particularly strong for ARC, BDNF, DUSP1, EGR3, and RGS2, but was not seen for the neuromodulator TAC1 or for the GAPDH housekeeping gene that shows ubiquitous expression in all cortical layers. Significant laminar expression was not observed in paired control neocortex (Fig. 6e, bottom). Together, these findings of MAPK–CREB activation and downstream target gene induction in layer 2/3 epileptic neurons suggest the existence of layer-specific attributes that could underlie the pathophysiology of neocortical epilepsy.
Increased synaptic density of layer 2/3 epileptic neurons
This epileptic transcriptome derived from seizure onset zones focuses new attention onto layer 2/3 neurons that show sustained MAPK-CREB activation together with downstream genes with known roles in synaptic plasticity. A key question is whether these lamina-specific signaling and transcriptional differences relate to structural differences within layers 2/3 that could underlie synchronous neuronal firing. We measured the density of presynaptic terminals (puncta) between layer 2/3 of epileptic and control regions using confocal microscopy of synapsin-1 immunostaining (Fig. 7). Quantitation of these puncta revealed a 2.6-fold increase in synaptic density in layer 2/3 epileptic neocortex compared control neocortex (p = 0.039; two-tailed t test, Bonferroni's correction; 20.7 ± 0.9 and 9.8 ± 0.4 × 10⁶ puncta/mm3, ±SEM, n = 3 patients). Presynaptic terminals in epileptic neocortex also showed an overall 16% decrease in synapse area (p = 0.270; two-tailed t test, Bonferroni's correction; 21.6 ± 0.7 and 25.8 ± 0.3 square pixels, ±SEM) with an increased variance (p = 0.128; one-tailed F test) compared with control. Since layer 2/3 provides a majority of the lateral recurrent connectivity within the cortex, the increase in synaptic density here could represent aberrant network reorganization that could contribute to the synchronous firing of large populations of cortical neurons required to generate epileptiform discharges.
Figure 7.

Layer 2/3 neurons show a marked increase in synaptic density. a, b, Increased presynaptic terminal density in layer 2/3 epileptic neocortex is demonstrated by synapsin-1 immunoreactive puncta. c, Quantitation of puncta revealed a 2.6-fold increase in synaptic density in epileptic neocortex versus control neocortex (p = 0.039; two-tailed t test, Bonferroni's correction; 20.7 ± 0.9 compared with 9.8 ± 0.4 × 10⁶ puncta/mm3 ± SEM). d, Morphometric analysis revealed a 16% decrease in synapse area in epileptic regions (21.6 ± 0.7 compared with 25.8 ± 0.3 square pixels ± SEM). Scale bar: (in a) a, b, 10 μm.
Discussion
CREB target gene induction in human epileptic cortex
In this study we asked a simple question: “what is different about regions of human neocortex that produce seizures compared with nearby areas that do not?” One of the most difficult clinical aspects of epilepsy is that once established, it is a highly disabling illness that leaves patients dependent on sedating anticonvulsant medications, often for the rest of their lives. Patients who do not respond to anticonvulsant medications can become seizure free only when epileptic brain regions are surgically removed or if their seizures spontaneously resolve. This suggests that the pathophysiological processes within often normal-appearing focal brain areas are necessary and sufficient to produce epilepsy and that therapeutics aimed at molecular pathways underlying the formation and maintenance of the chronic epileptic state are needed.
Long-term in vivo recordings used to identify epileptic brain regions in humans undergoing surgery for medically intractable epilepsy have given us a unique opportunity to identify common transcriptional differences within epileptic brain regions on a genome-wide scale as a means to identify new biomarkers and potential drug targets for human epilepsy. These differences do not appear to be dependent on seizures, tissue location, or age, since none of the patients in this study had clinical or electrographic seizures immediately before tissue resection and tissues were sampled from multiple cortical regions from patients who ranged in age from 2 to 52 years. Without a priori assumptions, bioinformatic analysis of our human epileptic transcriptome most strongly implicated MAPK–CREB signaling and CREB-dependent transcription. This statistical analysis was validated in human epileptic tissues that showed persistent phosphorylation of ERK1/2 and CREB and the association of pCREB with the proximal promoters of differentially expressed CREB target genes.
While it is not surprising that this epileptic transcriptome contained activity-dependent CREB target genes, since both CREB and ERK have been shown to modulate seizure susceptibility in animals (Nateri et al., 2007; Jancic et al., 2009), the extent of enrichment observed in the interictal state was striking, with 74% (102/137) of differentially expressed genes containing a full or half CRE in their proximal promoter, and 44% (60/137) conserved from humans to rodents (Table 2, far right-hand column). A number of gene expression studies in animal seizure models and in human epileptic tissues share some of the genes that comprise our human epileptic transcriptome (Lanahan and Worley, 1998; Rakhade et al., 2005; Arion et al., 2006; Crino, 2007). However, a unique feature of the present study is that it focused on the interictal epileptic state using electrically mapped paired epileptic and control tissues from within the same patient in neocortical samples that were free of demonstrable histopathology. One of the limitations of human tissue studies is that it is impossible to infer cause and effect; however, given the above-cited roles of CREB in synaptic plasticity, it could quite possibly be playing a direct role. In fact, we have recently found that the induction of interictal spiking in the rat neocortex is sufficient to produce a similar layer 2/3 specific pattern of CREB phosphorylation and downstream gene activation and that blocking MAPK signaling can prevent the development of interictal spiking (Barkmeier et al., 2012).
Many of the genes found to be induced in epileptic brain regions are known CREB targets with a strong potential to promote neuronal excitability and synaptic plasticity. BDNF is a well described CREB target gene that is sufficient to induce both CREB phosphorylation and synaptic potentiation in vivo and in vitro, and has been shown to be upregulated temporal lobe epilepsy patients (Binder et al., 2001). BDNF can also induce EGR3 synthesis, which in turn can regulate type A GABA receptors and modulate excitability (Roberts et al., 2006). The TAC1 produces substance P as one its gene products that can induce acute seizures in rodents, while tachykinin-null mice show resistance to chemically induced status epilepticus (Liu et al., 1999a,b). RGS2 (Gold et al., 2002; Han et al., 2006) is induced in prefrontal cortex by electroconvulsive seizures and has been shown to increase presynaptic vesicle release by regulating Ca2+ channels. Although not a direct CREB target, ARC (Guzowski, 2002) is a well described marker of seizures and patterned neuronal activity in animal models of learning and memory, where it is involved in the regulation of AMPA receptor trafficking at the postsynaptic membrane (Chowdhury et al., 2006). Thus, while human tissue studies cannot reveal a direct cause-and-effect relationship, upregulation of these genes and their associated signaling pathways would be expected to increase neuronal excitability that, if blocked, could prevent the synchronization that underlies the development of a chronic epileptic state.
Genes from this human epileptic transcriptome may also aid in the search for single gene mutations associated with rare epileptic syndromes. For example, mapping of our epileptic transcriptome onto chromosomal regions of epilepsy susceptibility identified by linkage analysis demonstrates that the dual-specificity phosphatase DUSP2 is located in the critical region of susceptibility on chromosome 2q11.2 for autosomal-dominant cortical myoclonus epilepsy (maximum logarithm of the odds score, 3.74) (Guerrini et al., 2001). Interestingly, many of the MAPK-related genes that were expressed at higher levels at seizure onset zones were in fact phosphatases that are known to suppress the MAPK pathway, including DUSP1, 2, 5, and 6 (Bermudez et al., 2010). This suggests a strong role for dual-specificity phosphatases at human seizure onset zones that may dampen or spatially restrict MAPK activation. In thinking about possible drug development, this also raises an important point that not all of the genes and pathways induced in human epileptic brain regions are necessarily epileptogenic, but in fact may be protective to dampen the hyperexcitability that leads to seizures.
Epileptic biomarkers provide clues to the spatial organization of the epileptic neocortex
Given the complexity of the cortical brain tissue that went into this analysis, it was remarkable that the MAPK–CREB signaling pathway, together with many downstream CREB target genes, were highly localized to lamina-specific regions of the neocortex. Both MAPK–CREB activation and many downstream genes were induced in spatially restricted, well demarcated populations of layer 2/3 cortical neurons whose axodendritic processes displayed a marked increase in synaptic density. Given that layer 2/3 neurons are known to form the majority of lateral connections within the neocortex, these observed molecular and synaptic changes could well be a focus for abnormal hypersynchrony capable of generating an epileptic discharge. In fact, to detect a single epileptic discharge from a scalp EEG recording, >10 cm2 of human cortex needs to be synchronously firing (Tao et al., 2005). The marked increase in synapsin-1-stained presynaptic puncta observed here barely begins to scratch the surface of the synaptic complexity of excitatory and inhibitory connections that lead to hypersynchrony. Further studies detailing the specific temporal and spatial alterations in synaptodendritic connectivity as well as layer-specific recordings in human tissues and animal models will be needed to determine the network abnormalities that produce a pathological state that arises months to years after a brain insult.
Using the histological biomarkers developed here, sharp boundaries of MAPK–CREB activation and target gene induction were often found to coincide with sulcal–gyral interfaces. In fact these sulcal–gyral boundaries have been shown to form natural barriers for other electrical pathophysiological activities such as spreading depression (Leao, 1944). Thus, while brain infoldings of higher-order species provide an increase in brain surface area, they may also provide natural barriers to prevent the spread of pathological electrical activities. Understanding the functional and structural basis of these natural boundaries of epileptic activity using this new set of histological biomarkers will be important not only for therapeutics, but also for guiding surgical and electrophysiological treatments in medically refractory patients.
Since all of the tissue used for this study was in the interictal state, it is possible that ongoing interictal epileptiform discharges (as shown in Fig. 1b) are the driving force that maintains high levels of activity-dependent gene transcription. In fact, some of the same induced genes at epileptic foci, such as EGR1, EGR2, and FOS, are tightly correlated with interictal spike frequency (Rakhade et al., 2005, 2007) and are induced in the same neuronal lamina in a rat model of interictal spiking (Barkmeier et al., 2012). Long-term studies of epileptogenesis in rats following status epilepticus further demonstrate that interictal discharges occur before the development of spontaneous seizures (White et al., 2010). While at the present time there are no clinically approved treatments that target interictal discharges, it is tantalizing to speculate that their reduction or elimination could prevent epileptogenesis or reduce seizures once developed (Staley et al., 2005; White et al., 2010).
Footnotes
This work was funded by NIH/NINDS Grants R01NS045207 and R01NS058802 (to J.A.L.); and Grant F30NS049776 (to T.L.B.). We thank M. Meisler and E. Ziff for helpful comments on the manuscript. Microarray scanning was facilitated by the Core Facility of the Environmental Health Sciences Center at Wayne State University.
The authors declare no financial conflicts of interest.
References
- Annegers JF, Rocca WA, Hauser WA. Causes of epilepsy: contributions of the Rochester epidemiology project. Mayo Clin Proc. 1996;71:570–575. doi: 10.4065/71.6.570. [DOI] [PubMed] [Google Scholar]
- Arion D, Sabatini M, Unger T, Pastor J, Alonso-Nanclares L, Ballesteros-Yáñez I, García Sola R, Muñoz A, Mirnics K, DeFelipe J. Correlation of transcriptome profile with electrical activity in temporal lobe epilepsy. Neurobiol Dis. 2006;22:374–387. doi: 10.1016/j.nbd.2005.12.012. [DOI] [PubMed] [Google Scholar]
- Asano E, Muzik O, Shah A, Juhász C, Chugani DC, Sood S, Janisse J, Ergun EL, Ahn-Ewing J, Shen C, Gotman J, Chugani HT. Quantitative interictal subdural EEG analyses in children with neocortical epilepsy. Epilepsia. 2003;44:425–434. doi: 10.1046/j.1528-1157.2003.38902.x. [DOI] [PubMed] [Google Scholar]
- Barkmeier DT, Senador D, Leclercq K, Pai D, Hua J, Boutros NN, Kaminski RM, Loeb JA. Electrical, molecular and behavioral effects of interictal spiking in the rat. Neurobiol Dis. 2012;47:92–101. doi: 10.1016/j.nbd.2012.03.026. [DOI] [PMC free article] [PubMed] [Google Scholar]
- Bermudez O, Pagès G, Gimond C. The dual-specificity MAP kinase phosphatases: critical roles in development and cancer. Am J Physiol Cell Physiol. 2010;299:C189–C202. doi: 10.1152/ajpcell.00347.2009. [DOI] [PubMed] [Google Scholar]
- Binder DK, Croll SD, Gall CM, Scharfman HE. BDNF and epilepsy: too much of a good thing? Trends Neurosci. 2001;24:47–53. doi: 10.1016/s0166-2236(00)01682-9. [DOI] [PubMed] [Google Scholar]
- Cavalleri GL, Lynch JM, Depondt C, Burley MW, Wood NW, Sisodiya SM, Goldstein DB. Failure to replicate previously reported genetic associations with sporadic temporal lobe epilepsy: where to from here? Brain. 2005;128:1832–1840. doi: 10.1093/brain/awh524. [DOI] [PubMed] [Google Scholar]
- Cheung TH, Kwan YL, Hamady M, Liu X. Unraveling transcriptional control and cis-regulatory codes using the software suite GeneACT. Genome Biol. 2006;7:R97. doi: 10.1186/gb-2006-7-10-r97. [DOI] [PMC free article] [PubMed] [Google Scholar]
- Chowdhury S, Shepherd JD, Okuno H, Lyford G, Petralia RS, Plath N, Kuhl D, Huganir RL, Worley PF. Arc/Arg3.1 interacts with the endocytic machinery to regulate AMPA receptor trafficking. Neuron. 2006;52:445–459. doi: 10.1016/j.neuron.2006.08.033. [DOI] [PMC free article] [PubMed] [Google Scholar]
- Crino PB. Gene expression, genetics, and genomics in epilepsy: some answers, more questions. Epilepsia. 2007;48(Suppl 2):42–50. doi: 10.1111/j.1528-1167.2007.01066.x. [DOI] [PubMed] [Google Scholar]
- Ginty DD, Kornhauser JM, Thompson MA, Bading H, Mayo KE, Takahashi JS, Greenberg ME. Regulation of CREB phosphorylation in the suprachiasmatic nucleus by light and a circadian clock. Science. 1993;260:238–241. doi: 10.1126/science.8097062. [DOI] [PubMed] [Google Scholar]
- Gold SJ, Heifets BD, Pudiak CM, Potts BW, Nestler EJ. Regulation of regulators of G protein signaling mRNA expression in rat brain by acute and chronic electroconvulsive seizures. J Neurochem. 2002;82:828–838. doi: 10.1046/j.1471-4159.2002.01002.x. [DOI] [PubMed] [Google Scholar]
- Guerrini R, Bonanni P, Patrignani A, Brown P, Parmeggiani L, Grosse P, Brovedani P, Moro F, Aridon P, Carrozzo R, Casari G. Autosomal dominant cortical myoclonus and epilepsy (ADCME) with complex partial and generalized seizures: A newly recognized epilepsy syndrome with linkage to chromosome 2p11.1-q12.2. Brain. 2001;124:2459–2475. doi: 10.1093/brain/124.12.2459. [DOI] [PubMed] [Google Scholar]
- Guzowski JF. Insights into immediate-early gene function in hippocampal memory consolidation using antisense oligonucleotide and fluorescent imaging approaches. Hippocampus. 2002;12:86–104. doi: 10.1002/hipo.10010. [DOI] [PubMed] [Google Scholar]
- Han J, Mark MD, Li X, Xie M, Waka S, Rettig J, Herlitze S. RGS2 determines short-term synaptic plasticity in hippocampal neurons by regulating Gi/o-mediated inhibition of presynaptic Ca2+ channels. Neuron. 2006;51:575–586. doi: 10.1016/j.neuron.2006.07.012. [DOI] [PubMed] [Google Scholar]
- Houser CR, Huang CS, Peng Z. Dynamic seizure-related changes in extracellular signal-regulated kinase activation in a mouse model of temporal lobe epilepsy. Neuroscience. 2008;156:222–237. doi: 10.1016/j.neuroscience.2008.07.010. [DOI] [PMC free article] [PubMed] [Google Scholar]
- Impey S, Obrietan K, Storm DR. Making new connections: role of ERK/MAP kinase signaling in neuronal plasticity. Neuron. 1999;23:11–14. doi: 10.1016/s0896-6273(00)80747-3. [DOI] [PubMed] [Google Scholar]
- Impey S, McCorkle SR, Cha-Molstad H, Dwyer JM, Yochum GS, Boss JM, McWeeney S, Dunn JJ, Mandel G, Goodman RH. Defining the CREB regulon: a genome-wide analysis of transcription factor regulatory regions. Cell. 2004;119:1041–1054. doi: 10.1016/j.cell.2004.10.032. [DOI] [PubMed] [Google Scholar]
- International Human Genome Sequencing Consortium. Finishing the euchromatic sequence of the human genome. Nature. 2004;431:931–945. doi: 10.1038/nature03001. [DOI] [PubMed] [Google Scholar]
- Jancic D, Lopez de Armentia M, Valor LM, Olivares R, Barco A. Inhibition of cAMP response element-binding protein reduces neuronal excitability and plasticity, and triggers neurodegeneration. Cereb Cortex. 2009;19:2535–2547. doi: 10.1093/cercor/bhp004. [DOI] [PubMed] [Google Scholar]
- Jin W, Riley RM, Wolfinger RD, White KP, Passador-Gurgel G, Gibson G. The contributions of sex, genotype and age to transcriptional variance in Drosophila melanogaster. Nat Genet. 2001;29:389–395. doi: 10.1038/ng766. [DOI] [PubMed] [Google Scholar]
- Kalachikov S, Evgrafov O, Ross B, Winawer M, Barker-Cummings C, Martinelli Boneschi F, Choi C, Morozov P, Das K, Teplitskaya E, Yu A, Cayanis E, Penchaszadeh G, Kottmann AH, Pedley TA, Hauser WA, Ottman R, Gilliam TC. Mutations in LGI1 cause autosomal-dominant partial epilepsy with auditory features. Nat Genet. 2002;30:335–341. doi: 10.1038/ng832. [DOI] [PMC free article] [PubMed] [Google Scholar]
- Kapatos G, Vunnava P, Wu Y. Protein kinase A-dependent recruitment of RNA polymerase II, C/EBP beta and NF-Y to the rat GTP cyclohydrolase I proximal promoter occurs without alterations in histone acetylation. J Neurochem. 2007;101:1119–1133. doi: 10.1111/j.1471-4159.2007.04486.x. [DOI] [PMC free article] [PubMed] [Google Scholar]
- Khatri P, Desai V, Tarca AL, Sellamuthu S, Wildman DE, Romero R, Draghici S. New Onto-Tools: Promoter-Express, nsSNPCounter and Onto-Translate. Nucleic Acids Res. 2006;34:W626–631. doi: 10.1093/nar/gkl213. [DOI] [PMC free article] [PubMed] [Google Scholar]
- Krawetz SA, editor. Bioinformatics for systems biology. New York: Springer; 2009. [Google Scholar]
- Lanahan A, Worley P. Immediate-early genes and synaptic function. Neurobiol Learn Mem. 1998;70:37–43. doi: 10.1006/nlme.1998.3836. [DOI] [PubMed] [Google Scholar]
- Leao A. Spreading depression of activity across the cerebral cortex. J Neurophysiol. 1944;7:359–390. doi: 10.1152/jn.1947.10.6.409. [DOI] [PubMed] [Google Scholar]
- Liu H, Mazarati AM, Katsumori H, Sankar R, Wasterlain CG. Substance P is expressed in hippocampal principal neurons during status epilepticus and plays a critical role in the maintenance of status epilepticus. Proc Natl Acad Sci U S A. 1999a;96:5286–5291. doi: 10.1073/pnas.96.9.5286. [DOI] [PMC free article] [PubMed] [Google Scholar]
- Liu H, Cao Y, Basbaum AI, Mazarati AM, Sankar R, Wasterlain CG. Resistance to excitotoxin-induced seizures and neuronal death in mice lacking the preprotachykinin A gene. Proc Natl Acad Sci U S A. 1999b;96:12096–12101. doi: 10.1073/pnas.96.21.12096. [DOI] [PMC free article] [PubMed] [Google Scholar]
- Loeb JA. A human systems biology approach to discover new drug targets in epilepsy. Epilepsia. 2010;51(Suppl 3):171–177. doi: 10.1111/j.1528-1167.2010.02635.x. [DOI] [PMC free article] [PubMed] [Google Scholar]
- Loeb JA. Identifying targets for preventing epilepsy using systems biology. Neurosci Lett. 2011;497:205–212. doi: 10.1016/j.neulet.2011.02.041. [DOI] [PMC free article] [PubMed] [Google Scholar]
- Lonze BE, Ginty DD. Function and regulation of CREB family transcription factors in the nervous system. Neuron. 2002;35:605–623. doi: 10.1016/s0896-6273(02)00828-0. [DOI] [PubMed] [Google Scholar]
- Lund IV, Hu Y, Raol YH, Benham RS, Faris R, Russek SJ, Brooks-Kayal AR. BDNF selectively regulates GABAA receptor transcription by activation of the JAK/STAT pathway. Sci Signal. 2008;1:ra9. doi: 10.1126/scisignal.1162396. [DOI] [PMC free article] [PubMed] [Google Scholar]
- Luo J, Wang Y, Yasuda RP, Dunah AW, Wolfe BB. The majority of N-methyl-D-aspartate receptor complexes in adult rat cerebral cortex contain at least three different subunits (NR1/NR2A/NR2B) Mol Pharmacol. 1997;51:79–86. doi: 10.1124/mol.51.1.79. [DOI] [PubMed] [Google Scholar]
- Mayr B, Montminy M. Transcriptional regulation by the phosphorylation-dependent factor CREB. Nat Rev Mol Cell Biol. 2001;2:599–609. doi: 10.1038/35085068. [DOI] [PubMed] [Google Scholar]
- Merlo D, Cifelli P, Cicconi S, Tancredi V, Avoli M. 4-Aminopyridine-induced epileptogenesis depends on activation of mitogen-activated protein kinase ERK. J Neurochem. 2004;89:654–659. doi: 10.1111/j.1471-4159.2004.02382.x. [DOI] [PubMed] [Google Scholar]
- Moore AN, Waxham MN, Dash PK. Neuronal activity increases the phosphorylation of the transcription factor cAMP response element-binding protein (CREB) in rat hippocampus and cortex. J Biol Chem. 1996;271:14214–14220. doi: 10.1074/jbc.271.24.14214. [DOI] [PubMed] [Google Scholar]
- Nateri AS, Raivich G, Gebhardt C, Da Costa C, Naumann H, Vreugdenhil M, Makwana M, Brandner S, Adams RH, Jefferys JG, Kann O, Behrens A. ERK activation causes epilepsy by stimulating NMDA receptor activity. EMBO J. 2007;26:4891–4901. doi: 10.1038/sj.emboj.7601911. [DOI] [PMC free article] [PubMed] [Google Scholar]
- Noebels JL. The biology of epilepsy genes. Annu Rev Neurosci. 2003;26:599–625. doi: 10.1146/annurev.neuro.26.010302.081210. [DOI] [PubMed] [Google Scholar]
- Ottman R, Annegers JF, Risch N, Hauser WA, Susser M. Relations of genetic and environmental factors in the etiology of epilepsy. Ann Neurol. 1996;39:442–449. doi: 10.1002/ana.410390406. [DOI] [PMC free article] [PubMed] [Google Scholar]
- Porter BE, Lund IV, Varodayan FP, Wallace RW, Blendy JA. The role of transcription factors cyclic-AMP responsive element modulator (CREM) and inducible cyclic-AMP early repressor (ICER) in epileptogenesis. Neuroscience. 2008;152:829–836. doi: 10.1016/j.neuroscience.2007.10.064. [DOI] [PMC free article] [PubMed] [Google Scholar]
- Rakhade SN, Yao B, Ahmed S, Asano E, Beaumont TL, Shah AK, Draghici S, Krauss R, Chugani HT, Sood S, Loeb JA. A common pattern of persistent gene activation in human neocortical epileptic foci. Ann Neurol. 2005;58:736–747. doi: 10.1002/ana.20633. [DOI] [PubMed] [Google Scholar]
- Rakhade SN, Shah AK, Agarwal R, Yao B, Asano E, Loeb JA. Activity-dependent gene expression correlates with interictal spiking in human neocortical epilepsy. Epilepsia. 2007;48:86–95. doi: 10.1111/j.1528-1167.2007.01294.x. [DOI] [PubMed] [Google Scholar]
- Reiner A, Yekutieli D, Benjamini Y. Identifying differentially expressed genes using false discovery rate controlling procedures. Bioinformatics. 2003;19:368–375. doi: 10.1093/bioinformatics/btf877. [DOI] [PubMed] [Google Scholar]
- Roberts DS, Raol YH, Bandyopadhyay S, Lund IV, Budreck EC, Passini MJ, Wolfe JH, Brooks-Kayal AR, Russek SJ. Egr3 stimulation of GABRA4 promoter activity as a mechanism for seizure-induced up-regulation of GABA(A) receptor alpha4 subunit expression. Proc Natl Acad Sci U S A. 2005;102:11894–11899. doi: 10.1073/pnas.0501434102. [DOI] [PMC free article] [PubMed] [Google Scholar]
- Roberts DS, Hu Y, Lund IV, Brooks-Kayal AR, Russek SJ. Brain-derived neurotrophic factor (BDNF)-induced synthesis of early growth response factor 3 (Egr3) controls the levels of type A GABA receptor alpha 4 subunits in hippocampal neurons. J Biol Chem. 2006;281:29431–29435. doi: 10.1074/jbc.C600167200. [DOI] [PubMed] [Google Scholar]
- Shattuck DW, Leahy RM. BrainSuite: an automated cortical surface identification tool. Med Image Anal. 2002;6:129–142. doi: 10.1016/s1361-8415(02)00054-3. [DOI] [PubMed] [Google Scholar]
- Staley K, Hellier JL, Dudek FE. Do interictal spikes drive epileptogenesis? Neuroscientist. 2005;11:272–276. doi: 10.1177/1073858405278239. [DOI] [PubMed] [Google Scholar]
- Steinlein OK. Genetic mechanisms that underlie epilepsy. Nat Rev Neurosci. 2004;5:400–408. doi: 10.1038/nrn1388. [DOI] [PubMed] [Google Scholar]
- Tao JX, Ray A, Hawes-Ebersole S, Ebersole JS. Intracranial EEG substrates of scalp EEG interictal spikes. Epilepsia. 2005;46:669–676. doi: 10.1111/j.1528-1167.2005.11404.x. [DOI] [PubMed] [Google Scholar]
- Téllez-Zenteno JF, Dhar R, Wiebe S. Long-term seizure outcomes following epilepsy surgery: a systematic review and meta-analysis. Brain. 2005;128:1188–1198. doi: 10.1093/brain/awh449. [DOI] [PubMed] [Google Scholar]
- Temkin NR. Preventing and treating posttraumatic seizures: the human experience. Epilepsia. 2009;50(Suppl 2):10–13. doi: 10.1111/j.1528-1167.2008.02005.x. [DOI] [PubMed] [Google Scholar]
- White A, Williams PA, Hellier JL, Clark S, Edward Dudek F, Staley KJ. EEG spike activity precedes epilepsy after kainate-induced status epilepticus. Epilepsia. 2010;51:371–383. doi: 10.1111/j.1528-1167.2009.02339.x. [DOI] [PMC free article] [PubMed] [Google Scholar]
- Xi ZQ, Wang XF, He RQ, Li MW, Liu XZ, Wang LY, Zhu X, Xiao F, Sun JJ, Li JM, Gong Y, Guan LF. Extracellular signal-regulated protein kinase in human intractable epilepsy. Eur J Neurol. 2007;14:865–872. doi: 10.1111/j.1468-1331.2007.01777.x. [DOI] [PubMed] [Google Scholar]
- Zhang X, Odom DT, Koo SH, Conkright MD, Canettieri G, Best J, Chen H, Jenner R, Herbolsheimer E, Jacobsen E, Kadam S, Ecker JR, Emerson B, Hogenesch JB, Unterman T, Young RA, Montminy M. Genome-wide analysis of cAMP-response element binding protein occupancy, phosphorylation, and target gene activation in human tissues. Proc Natl Acad Sci U S A. 2005;102:4459–4464. doi: 10.1073/pnas.0501076102. [DOI] [PMC free article] [PubMed] [Google Scholar]