

Abstract
Recurrent mutations in isocitrate dehydrogenase 1 (IDH1) and IDH2 have been identified in gliomas, acute myeloid leukaemias (AML) and chondrosarcomas, and share a novel enzymatic property of producing 2-hydroxyglutarate (2HG) from α-ketoglutarate1-6. Here we report that 2HG-producing IDH mutants can prevent the histone demethylation that is required for lineage-specific progenitor cells to differentiate into terminally differentiated cells. In tumour samples from glioma patients, IDH mutations were associated with a distinct gene expression profile enriched for genes expressed in neural progenitor cells, and this was associated with increased histone methylation. To test whether the ability of IDH mutants to promote histone methylation contributes to a block in cell differentiation in non-transformed cells, we tested the effect of neomorphic IDH mutants on adipocyte differentiation in vitro. Introduction of either mutant IDH or cell-permeable 2HG was associated with repression of the inducible expression of lineage-specific differentiation genes and a block to differentiation. This correlated with a significant increase in repressive histone methylation marks without observable changes in promoter DNA methylation. Gliomas were found to have elevated levels of similar histone repressive marks. Stable transfection of a 2HG-producing mutant IDH into immortalized astrocytes resulted in progressive accumulation of histone methylation. Of the marks examined, increased H3K9 methylation reproducibly preceded a rise in DNA methylation as cells were passaged in culture. Furthermore, we found that the 2HG-inhibitable H3K9 demethylase KDM4C was induced during adipocyte differentiation, and that RNA-interference suppression of KDM4C was sufficient to block differentiation. Together these data demonstrate that 2HG can inhibit histone demethylation and that inhibition of histone demethylation can be sufficient to block the differentiation of non-transformed cells.
The fact that IDH mutations were identified in multiple cancers with disparate tissues of origin suggests that 2HG-producing mutant enzymes probably affect some fundamental cellular processes that facilitate tumour progression. To study the effects of IDH mutations, we collected and performed gene expression microarray analysis on tumour specimens from patients with grade II–III oligodendroglioma. Sequencing results revealed a high frequency of IDH mutations in oligodendroglioma (33 of the samples had the R132 IDH1 mutation, 2 had the R172 IDH2 mutation and 6 were wild type for IDH1/2). Supervised analysis found a statistically enriched gene signature in IDH-mutant samples (q value <10%, fold change >2; Fig. 1a and Supplementary Table 1) that was independent of tumour grade and recurrence status and survived multiple testing corrections. Gene-ontology analysis identified the regulation of astrocyte and glial differentiation as the top two functional categories enriched in differentially expressed genes (Supplementary Table 2). We previously reported that IDH mutation may promote leukaemogenesis by expanding the haematopoietic progenitor cell population and impairing haematopoietic differentiation7, and that such a phenotype could be attributed at least in part to mutant IDH-induced inhibition of TET2, an α-ketoglutarate (αKG)-dependent enzyme potentially involved in DNA demethylation7,8. Although DNA hypermethylation has been associated with IDH mutation in glioma samples9, no mutations in TET family members have been found in this disease. We explored the possibility that IDH mutation may affect additional αKG-dependent enzymes that contribute to the regulation of cell differentiation.
Figure 1. IDH mutations are associated with dysregulation of glial differentiation and global histone methylation.
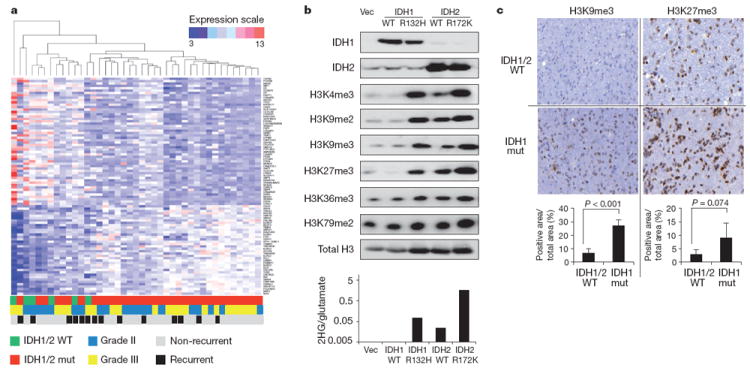
a, Heatmap representation of a two-dimensional hierarchical clustering of genes identified as differentially expressed between IDH mutant (mut) patient oligodendroglioma samples and IDH wild-type (WT) samples. Each row represents a gene and each column represents a specimen. IDH mutational status, tumour grade and recurrence of each sample are listed. b, 293T cells transfected with empty vector (Vec), wildtype or R132H mutant IDH1, or wild-type or R172K mutant IDH2 for 3 days were lysed and assessed for expression levels of IDH1, IDH2 and histone lysine methylation by western blotting with specific antibodies. Total H3 was used as loading control. Quantification of band intensities is shown in Supplementary Fig. 1. Bottom panel provides quantification of intracellular 2HG to glutamate ratio (2HG/glutamate) as previously reported for these transfectants7. c, Immunohistochemistry staining with antibodies against H3K9me3 and H3K27me3 inIDH1/2 wild-type andIDH1mutant oligodendrogliomasamples (x40 magnification). Image quantification was performed using Metamorph software (see Methods) and shown in bottom panels. Error bars represent standard deviation (s.d.) of at least three patient samples in each group.
Histone lysine methylation is an integral part of the post-translational modifications of histone tails that are important for chromatin organization and regulation of gene transcription10-13. In vitro 2HG can competitively inhibit a family of αKG-dependent Jumonji-C domain histone demethylases (JHDMs)14,15. To determine whether IDH-associated changes in histone methylation could be observed in cells, we ectopically expressed wild-type or mutant IDH1 or IDH2 in 293T cells and found that mutant IDH1 or IDH2 led to a marked increase in histone methylation compared to the wild-type enzymes. Transient transfection of wild-type IDH2 can also lead to increased 2HG production7. In all of the samples, the magnitude of increase in methylation correlated with the intracellular 2HG levels produced by IDH transfection (Fig. 1b and Supplementary Fig. 1). To test whether histone lysine methylation was dysregulated in gliomas with IDH mutation, immunohistochemistry analysis of patient oligodendroglioma samples was performed for several well-characterized histone marks. Compared to tumours with wild-type IDH, there was a statistically significant increase in the repressive trimethylation of H3K9 (H3K9me3) and an increasing trend in trimethylation of H3K27 (H3K27me3) in tumours with IDH1 mutation (Fig. 1c). No statistically significant difference was seen in trimethylation of H3K4 (H3K4me3), a mark associated with active transcription (data not shown). These data suggested that IDH mutations might preferentially affect the regulation of repressive histone methylation marks in vivo.
As IDH mutations were associated with glial tumours of the ‘proneural’ phenotype16, we sought to determine whether the persistence of histone repressive marks promoted by mutant IDH was sufficient to block the differentiation of non-transformed cells. Upon stimulation with a differentiation cocktail, immortalized murine 3T3-L1 cells undergo extensive chromatin remodelling, resulting in their maturation into adipocytes17. 3T3-L1 cells transduced with R172K mutant IDH2 produced 2HG whereas cells transduced with either wild-type IDH2 or vector alone did not (Fig. 2a). All three cell types were then induced to differentiate into adipocytes. After 7 days of differentiation induction, IDH mutant cells had visibly reduced lipid droplet accumulation compared to vector and IDH wild-type cells, as shown by Oil-Red-O staining (Fig. 2b). In separate experiments, stable transfection of R140Q mutant IDH2 also resulted in a block to adipocyte differentiation (data not shown). To determine whether 2HG was sufficient to mediate the effect of mutant IDH on cell differentiation, we synthesized cell-permeable 1-octyl-d-2-hydroxyglutarate (octyl-2HG; Supplementary Fig. 2). Treatment of 3T3-L1 cells with octyl-2HG led to a dose-dependent inhibition of lipid accumulation (Fig. 2c). Gene expression analysis showed that despite exposure to a well-standardized differentiation protocol18, IDH mutant cells or cells treated with octyl-2HG exhibited a profound defect in the expression of transcription factors essential for executing adipogenesis (Cebpa and Pparg) and an adipocytic lineage-specific gene (Adipoq) (Fig. 2d, e), suggesting that these cells failed to execute adipocyte differentiation.
Figure 2. Differentiation arrest induced by mutant IDH or 2HG is associated with increased global and promoter-specific H3K9 and H3K27 methylation.

a, 3T3-L1 cells stably expressing empty vector, wild-type, or R172K mutant IDH2 were lysed and assessed for expression levels of IDH2 or IDH1 by western blotting. Cells were also extracted for intracellular metabolites, which were then MTBSTFA-derivatized (see Methods) and analysed by gas chromatography–mass spectrometry (GC–MS). The quantification of 2HG signal intensity relative to the intrasample glutamate signal is shown for a representative experiment. b, Cells were induced to differentiate into mature adipocytes for 7 days. The accumulation of lipid droplets was assessed by Oil-Red-O staining. Wells from a representative experiment froma total of four independent experiments are shown. c, 3T3-L1 cells were induced to differentiate for 7 days in the absence or presence of 1mM or 2mM octyl-2HG. Oil-Red-O staining was performed and quantified by measuring absorbance at 500nm.DMSO, dimethylsulphoxide. d, Vector, wildtype or R172K mutant IDH2 transduced 3T3-L1 cells were induced to differentiate for 4 days. At days 0 and 4 (d0 and d4), RNA was extracted. Relative expression of adipocyte-specific gene and transcription factors was assessed by quantitative PCR with reverse transcription (RT–qPCR). e, 3T3-L1 cells were induced to differentiate for 4 days in the absence or presence of 1mMor 2mM octyl-2HG. RNA was extracted. Relative expression of adipocyte-specific gene and transcription factors was assessed by RT–qPCR. f, Vector, wild-type or R172K mutant IDH2 transduced 3T3-L1 cells were induced to differentiate. At days 0 and 4 (d0 and d4), ChIP analysis was performed using antibodies against H3K9me3 and H3K27me3. Immunoprecipitated Cebpa and Adipoq promoter sequences were analysed by qPCR and shown as percentage of input. g, Vector, wild-type or R172K mutant IDH2 transduced 3T3-L1 cells were induced to differentiate for 4 days. At days 0 and 4 (d0 and d4), histones were acidextracted and levels of H3K9me3, H3K9me2 and acetyl-H3 were assessed by western blotting with specific antibodies. Total H3 was used as loading control. Quantification of band intensities is shown in Supplementary Fig. 4. In f, error bars indicate s.d. from triplicate wells and a representative experiment from a total of two is shown. For all other experiments, error bars indicate s.d. from three independent experiments. *P<0.05; **P<0.01; NS, not significant.
Cells were harvested for a chromatin immunoprecipitation (ChIP) assay using antibodies against H3K9me3 and H3K27me3, before or after 4 days of differentiation induction. Quantitative polymerase chain reaction (PCR) with primers targeting promoters of Cebpa and Adipoq revealed that at day 4 there was a statistically significant increase in H3K9me3 and H3K27me3 at promoters of both genes in IDH mutant cells (Fig. 2f). These repressive marks also showed a modest but significant increase at gene promoters before differentiation induction. In contrast, quantitative assessment of DNA methylation at promoters of Cebpa and Adipoq by MassARRAY failed to reveal any significant difference between IDH wild-type and mutant cells (Supplementary Fig. 3). In addition to gene-specific changes, we detected a global increase in H3K9 methylation and a reciprocal decrease in H3 acetylation (Fig. 2g and Supplementary Fig. 4).
To determine whether IDH mutation was sufficient to induce enhanced repressive histone methylation in central nervous system (CNS)-derived cells and whether it was associated with altered neural gene expression, we retrovirally transduced immortalized normal human astrocytes (NHAs) with either wild-type or R132H mutant IDH1. Compared to parental cells, late-passage cells expressing mutant IDH exhibited elevated levels of a variety of histone methylation marks (Fig. 3a), and this correlated with an enhanced expression of the neural marker nestin (Fig. 3b). IDH mutations have been associated with CpG-island hypermethylation9 and consistent with this we observed that total CpG methylation was increased in IDH mutant cells (Supplementary Fig. 5). Because histone repressive marks can promote DNA methylation and vice versa13, we studied the temporal relationship of histone and DNA methylation in IDH-expressing astrocytes (Fig. 3c–e and Supplementary Fig. 5). The first observable change of the histone marks we examined was H3K9me3. H3K9me3 levels were significantly elevated by passage 12 after cells were infected with mutant IDH. Changes in other histone methylation marks were either delayed and of lower magnitude (H3K27me3 and H3K79me2) or were not observed (H3K4me3). Increases in DNA methylation were never observed before passage 17 and the difference in DNA methylation reached statistical significance only at passage 22.
Figure 3. IDH mutation induces histone methylation increase in CNSderived cells and can alter cell lineage gene expression.
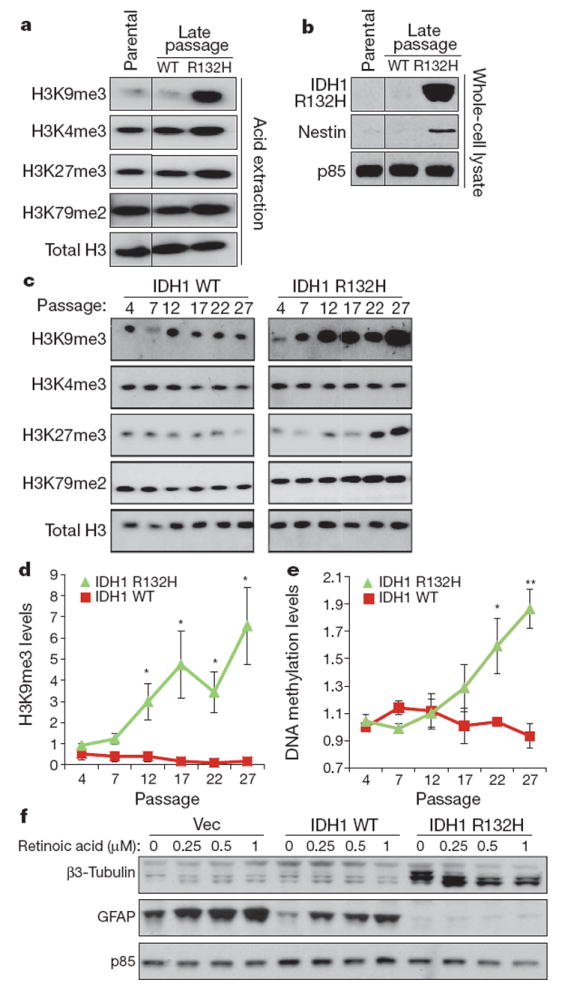
a, ImmortalizedNHA cells were retrovirally transduced with constructs containing wild-type or R132H mutant IDH1. Histones were acid-extracted from parental cells or cells expressing wild-type or mutant IDH1 at late (>40) passages. Histone lysine methylation levels were assessed by western blotting with specific antibodies. Total H3 was used as loading control. Images presented are panels from different areas of the same gel. b, Parental, IDH1 wild-type and R132H mutant NHAcells at late passages were lysed and assessed for expression levels of nestin by western blotting. p85 was used as loading control. Images presented are panels from different areas of the same gel. c, NHA cells were retrovirally transduced with constructs containing wild-type or R132H mutant IDH1. Histones were acid-extracted at different time points as cells were passaged in culture. Histone lysine methylation levels were assessed by western blotting with specific antibodies. Total H3 was used as loading control. Images presented are panels from different areas of the same gel. d, Western blot band intensities of H3K9me3 in c and two additional independent experiments were quantified using Image J. Red squares indicate IDH1 wild-type cells. Green triangles indicate IDH1 R132Hmutant cells. e, TotalCpGmethylation of IDH1 wild-type and R132H mutant NHA cells at various passages was measured by FACS using 5-methylcytosine-specific antibody and shown as normalized mean fluorescence intensity. FACS histograms from a representative experiment are shown in Supplementary Fig. 5. f, Neurosphere cultures established from the subventricular zone of brains of p16/p19−/− mice were infected with a retroviral construct containing IDH1 R132H mutant, wild-type IDH1 or the vector alone and induced to differentiate. GFAP and β3-tubulin expression levels were assessed by western blotting. p85 was used as loading control. In d and e, error bars indicate standard error of the mean from three independent experiments. *P<0.05; **P<0.01.
To test whether the IDH1 R132H mutation could interfere with neural differentiation in the absence of prolonged adaptation in culture, primary neurosphere cultures established from the brains of p16/p19−/− mice were infected with a retroviral construct containing IDH1 R132H mutant, wild-type IDH1 or the vector alone (Supplementary Fig. 6). After infection the cells were re-plated under conditions that promote astrocyte differentiation and induced to differentiate further by treatment with retinoic acid without further passaging. IDH mutant cells failed to induce expression of the astrocytic marker GFAP and exhibited expression of the neural marker β3-tubulin (Fig. 3f). When the differentiation conditions were supplemented with retinoic acid, enhanced expression of the astrocytic marker GFAP was observed in IDH wild-type and vector cells but GFAP expression remained repressed in IDH mutant cells.
The enhancement of H3K9 methylation in mutant IDH-expressing cells from multiple tissues of origin led us to investigate whether this H3K9 methylation might be sufficient to block the ability of non-transformed cells to execute differentiation. Support for this hypothesis came with the discovery that KDM4C (also known as JMJD2C), an H3K9-specific JHDM, was induced in 3T3-L1 cells during differentiation (Fig. 4a). An in vitro histone demethylase assay with recombinant human GST-tagged KDM4C confirmed that KDM4C effectively removed H3K9me2 and H3K9me3 in the presence of αKG. Importantly, the demethylation reaction was inhibited by 2HG in a dose-dependent manner (Fig. 4b and Supplementary Fig. 7). Given the similarities between 2HG and αKG, the inhibition of KDM4C by 2HG would be predicted to be competitive. Consistently, increasing the concentration of αKG in the reaction mixture reversed the inhibition of H3K9 demethylation by 2HG (Fig. 4c).
Figure 4. 2HG-inhibitable H3K9 demethylase KDM4C is required for cell differentiation.
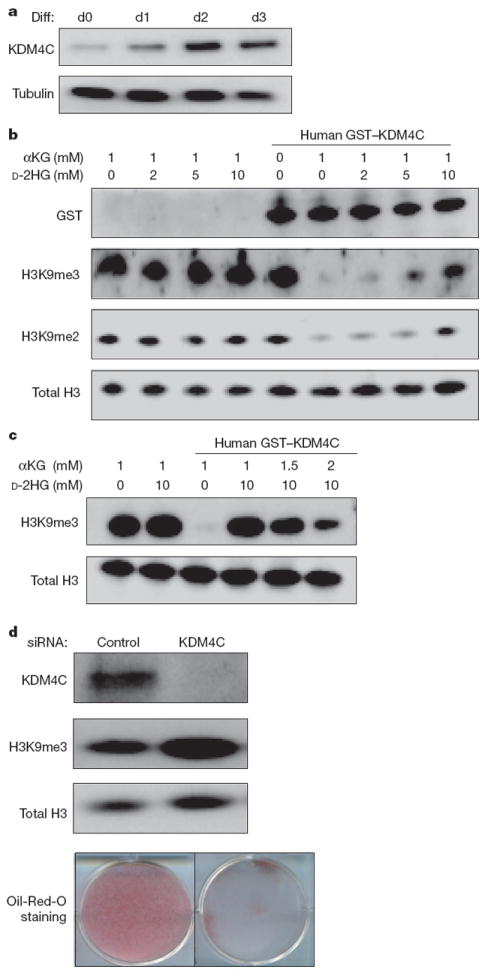
a, 3T3-L1 cells were induced to differentiate (Diff) for 3 days. Before (d0) and each day after differentiation induction, cells were lysed and KDM4C protein levels were assessed by western blotting with specific antibody. Tubulin was used as loading control. b, Bulk histones were incubated with purified GST-tagged human KDM4C in the reaction mix with 1 mM αKG and increasing concentrations of d-2HG. Levels of GST tag, H3K9me3 and H3K9me2 were assessed by western blotting with specific antibodies. Total H3 was used as loading control. c, Bulk histones were incubated with purified GST-tagged human KDM4C in the reaction mix. 10mMd-2HG was added to inhibit the demethylation reaction in the presence of increasing concentrations of αKG. Levels of H3K9me3 were assessed by western blotting with specific antibody. Total H3 was used as loading control. d, 3T3-L1 cells were transfected with control siRNAor siRNA specific for KDM4C. After 3 days, cells were lysed and assessed for expression levels of KDM4C and H3K9me3 by western blotting with specific antibodies. Total H3 was used as loading control. Cells from the same treatment were induced to differentiate for 7 days. The accumulation of lipid droplets was assessed by Oil-Red-O staining. Wells from a representative experiment from a total of three independent experiments are shown.
Finally, to test the possibility that H3K9 demethylation is a required component of adipocyte differentiation, we examined whether blocking the induction of KDM4C was sufficient to impair the differentiation of 3T3-L1 cells. Treatment with three independent short interfering RNAs (siRNAs) against KDM4C reduced its expression and enhanced H3K9me3 in 3T3-L1 cells (Fig. 4d and Supplementary Fig. 8). After differentiation induction, cells treated with KDM4C siRNAs exhibited reduced ability to differentiate into adipocytes. Thus the inability to erase repressive H3K9 methylation can be sufficient to impair the differentiation of non-transformed cells.
Biochemical studies suggest that 2HG is a universal inhibitor of JHDM family members14,15; therefore it was interesting to observe that H3K9 demethylation seemed to be more sensitive to mutant IDH-induced suppression than at least some other histone methylation marks. Future investigation of the sensitivity to 2HG inhibition among JHDM family members and/or cellular feedback mechanisms activated after defective histone demethylation will be needed. In addition to the data presented here, evidence is mounting for a direct role of histone methylation in stem cell maintenance, differentiation and tumorigenesis19-23 (see Supplementary Discussion). Our findings support a role for αKG-dependent demethylases in cell differentiation that can be impaired through the cellular accumulation of 2HG produced by IDH mutation.
METHODS
Patient samples, microarray, gene-ontology analysis
Primary oligodendroglioma samples were obtained with approval from the institutional review board at the University of Pennsylvania and were de-identified for the study. For microarray analysis, tumour sample RNA was extracted with Trizol and purified with Qiagen RNeasy, and then assayed on an Affymetrix Human Gene 1.0ST array. Significance Analysis of Microarrays (http://www-stat.stanford.edu/~tibs/SAM/sam.pdf) was applied to find differentially expressed genes (q value <10% and fold change >2). Functional analysis of differentially expressed genes was done using the DAVID tool (http://david.abcc.ncifcrf.gov/home.jsp) using all human genes as a background set.
3T3-L1 cell differentiation, Oil-Red-O staining
3T3-L1 cell differentiation and Oil-Red-O staining were carried out as described previously24. In brief, confluent 3T3-L1 cells were stimulated with a cocktail containing 0.5 mM isobutylmethylxanthine, 1 μM dexamethasone, 5 μg/ml insulin and 5 μM troglitazone (all from Sigma) to induce differentiation. Cells were maintained in medium with insulin after 2 days of differentiation until ready to be harvested. For Oil-Red-O staining, cells were washed in PBS and then fixed for 20 min at room temperature (25 °C) with 3% paraformaldehyde. Cells were then washed with de-ionized water and stained with Oil-Red-O solution. For quantification, Oil-Red-O staining was dissolved in isopropanol and absorbance was measured at 500 nm.
In vitro histone demethylase assay
The histone demethylase assay was carried out as described previously25. In brief, 4 μg bulk calf thymus histones (Sigma) were incubated with GST-tagged KDM4C (1.42 μg; BPS Bioscience) in a reaction mix containing 50 mM Tris-HCl pH 8.0, protease inhibitors cocktail, 1 mM αKG, 100 μM FeSO4 and 2 mM ascorbic acid at 37 °C for 4 h, in the absence or presence of various concentrations of d-2HG or l-2HG (Sigma). Reaction mixtures were analysed by western blotting using specific antibodies.
Cell culture, transfection and transduction, generation of cell lines
293T cells, NHA cells immortalized by E6/E7/hTERT (provided by R. Pieper26) and 3T3-L1 cells were cultured in Dulbecco’s modified Eagle’s medium (DMEM; Invitrogen) with 10% fetal bovine serum (FBS; CellGro). For expression of wild-type and mutant IDH1/2 in 293T cells, transfection was performed with Lipofectamine 2000 (Invitrogen) according to the manufacturer’s instructions. For generation of IDH2 retrovirus and transduction of 3T3-L1 cells, supernatant from 293T cells transfected with pCL-Eco helper virus and plasmids was collected after 72 h, filtered and applied to cells overnight. For generating 3T3-L1 cell lines with stable expression of wild-type or mutant IDH2, cells were grown in 2.5 μg ml−1 puromycin for 7 days after retroviral transduction. Pooled populations of puromycin-resistant cells were obtained, and then continuously cultured in puromycin. For generation of IDH1 retrovirus and transduction of NHA cells, GP2-293 cells (Clontech, 631458) were calcium phosphate transfected with equal amounts of pVSV-G (Clontech, 631512) and plasmids. Virus was harvested at day 2 and day 3 after transfection and placed on logarithmically growing cells. After infection, cells were placed in 800 μmg ml−1 G418 (Invitrogen) to generate stable cell lines. For siRNA knockdown of KDM4C, transfections were performed with Lipofectamine RNAiMAX (Invitrogen), using siRNAs targeting KDM4C (#1: sense, 5′-GCUUGAAUCUCCCAAGAUATT-3′; antisense, 5′-UAUCUU GGGAGAUUCAAGCTT-3′; #2: sense, 5′-CAAAGUAUCUUGGAUCAAATT-3′; antisense, 5′-UUUGAUCCAAGAUACUUUGCC-3′; #3: sense, 5′-GAGGAGUU UCGGGAGUUCAACAAAU-3′; antisense, 5′-AUUUGUUGAACUCCCGAA ACUCCUC-3′) or a non-targeting control (Dharmacon, #D-001810-01-20) at a concentration of 40 nM.
Mutational analysis
For IDH mutation analysis, tumour genomic DNA was extracted and the regions surrounding IDH1 codon 132 and IDH2 codons 140 and 172 were amplified by PCR followed by sequencing. IDH1 analysis used forward primer 5′-ACCAAATGGCACCATACGA-3′ and reverse primer 5′-TTCATACC TTGCTTAATGGGTGT-3′ for amplification, and primer 5′-CGGTCTTCAGAG AAGCCATT-3′ for sequencing1. IDH2 analysis used forward primer 5′-CAG AGACAAGAGGATGGCTAGG-3′ and reverse primer 5′-GTCTGCCTGTG TTGTTGCTTG-3′ for amplification, and the same forward primer for sequencing27. Out of the 42 tumours analysed, 41 had sufficient high quality genomic DNA for discerning IDH mutation status. The one sample unable to be classified as either IDH wild type or mutant was excluded from further analysis.
Plasmid construction
The cDNA clone of human IDH1 (BC012846.1) was purchased from the American Type Culture Collection in pCMV-Sport6, and human IDH2 (BC009244) was purchased from Invitrogen in pOTB7. Standard site-directed mutagenesis techniques were used to generate IDH1 R132H by introducing a G395A base-pair change in the IDH1 open reading frame (ORF). IDH2 R172K was made by introducing a G515A change in the IDH2 ORF, while IDH2 R140Q was made with a G419A alteration. Wild-type and mutant sequences were then subcloned into LPC vector. All sequences were confirmed by direct sequencing before expression in 293T cells and retrovirus generation. Retroviral constructs used for neurosphere infection were generated by excising wild-type IDH1 and IDH1 R132H with NotI and PacI restriction enzymes from the previously made vectors and incorporating into the pQCXIH (Clontech, 631516) retroviral vector.
Histone extraction and western blotting
For histone acid extraction, cells were lysed in hypotonic lysis buffer (10 mM HEPES, 10 mM KCl, 1.5 mM MgCl2, 0.5 mM DTT, protease inhibitors) for 1 h. H2SO4 was added to 0.2 N overnight at 4 °C with rotation. After spinning down and collecting supernatant, proteins were precipitated in 33% TCA, washed with acetone, and resuspended in de-ionized water. For whole-cell lysates, cells were lysed and sonicated in standard RIPA buffer (1% sodium deoxycholate, 0.1% SDS, 1% Triton X-100, 0.01 M Tris pH 8.0 and 0.14 M NaCl), and lysates were then centrifuged at 14,000g at 4 °C for 10 min. Supernatants were collected and measured for total protein concentration. For western blotting, lysates were separated by SDS–PAGE, transferred to nitrocellulose membrane, blocked in 5% non-fat milk in PBS containing 0.5% Tween-20, probed with primary antibodies and detected with horseradish-peroxidase-conjugated anti-rabbit or anti-mouse antibodies (GE Healthcare, NA934V and NA931V). Primary antibodies used were: anti-IDH1 (Proteintech, 12332-1-AP), anti-IDH2 (Abcam, ab55271), anti-GST tag (Millipore, 05-311), anti-H3K9me2 (Cell Signaling Tech, 9753), anti-H3K9me3 (Abcam, ab8898), anti-H3K36me3 (Abcam, ab9050), anti-H3K27me3 (Millipore, 17-622), anti-H3K4me3 (Millipore, 17-614), anti-H3K79me2 (Cell Signaling Tech, 9757), anti-KDM4C (Abcam, ab85454), anti-acetyl H3 (Upstate, 06-599), anti-H3 (Cell Signaling Tech, 4499), anti-tubulin (Sigma, T9026), anti-GFAP (Cell Signaling Tech, 3670), anti-β3-tubulin (Cell Signaling Tech, 5666), anti-p85 (Millipore, 06-195), anti-nestin (Millipore, MAB5326), anti-β-actin (Sigma, A5316). Anti-IDH1 R132H mutant antibody was a gift from Agios Pharmaceuticals. Quantification of western blot band intensity was performed using Image J software according to the manufacturer’s instructions.
Metabolite extraction, GC–MS
After gentle removal of culture medium, cells were rapidly quenched with ice-cold 80% methanol and incubated at −80 °C for 20 min. After sonication, extracts were then centrifuged at 14,000g for 20 min at 4 °C to remove precipitated protein and the aqueous metabolites in the supernatant layer were dried under nitrogen gas. For 293T cells, organic acids were further purified by redissolving the dried extract in de-ionized water, followed by elution from an AG-1 X8 100–200 anion exchange resin (Bio-Rad) in 3 N HCl after washing with five column volumes.
For GC–MS analysis, dried extracts were redissolved in a 1:1 mixture of acetonitrile and N-methyl-N-tert-butyldimethylsilyltrifluoroacetamide (MTBSTFA; Regis) and heated for 75 min at 70 °C to derivatize metabolites. Samples were then injected into an Agilent 7890A GC with an HP-5MS capillary column, connected to an Agilent 5975 C mass selective detector operating in splitless mode using electron impact ionization with ionizing voltage of −70 eV and electron multiplier set to 1,060 V. GC temperature was started at 100 °C for 3 min, ramped up to 230 °C at 4 °C min−1 and held for 4 min, then ramped up to 300 °C and held for 5 min. Mass range of 50–500 amu was recorded at 2.71 scans per second. Identification of the 2HG metabolite peak was confirmed using standards obtained from Sigma. The 2HG and glutamate signal intensities were quantified by integration of peak areas.
Quantitative real-time PCR
RNA was isolated using Trizol (Invitrogen). After incubating with DNase, cDNA was synthesized using Superscript II reverse transcriptase (Invitrogen). Quantitative PCR was performed on a 7900HT Sequence Detection System (Applied Biosystems) using Taqman Gene Expression Assays (Applied Biosystems). Gene expression data was normalized to 18S rRNA.
ChIP
ChIP was performed with the Millipore Magna ChIP G kit (Millipore, 17-611). In brief, 2,000,000 cells were cross-linked with 1% formaldehyde for 10 min at room temperature. After washing with cold PBS, cells were centrifuged and lysed in 500 μl SDS lysis buffer for 10 min on ice. Lysate was then sonicated using Bioruptor sonicator (Diagenode) to shear DNA to approximately 200–600 bp. Samples were spun down and 50 μl of the supernatant was used for each immuno-precipitation overnight with magnetic beads after 10× dilution. Primary antibodies (3 μg per ChIP) used were: anti-H3K9me3 (Abcam, ab8898) and anti-H3K27me3 (Millipore, 17-622). Normal rabbit IgG (Millipore, 12-370) was used as control and showed minimal enrichment. The next day, samples were washed in low-salt immune complex buffer, high-salt immune complex buffer, LiCl immune complex buffer and TE buffer. Histone complexes were eluted in elution buffer plus proteinase K for 2 h at 65 °C. DNA was recovered using columns. Quantitative PCR was performed on purified DNA samples. Primers used are: Adipoq forward, 5′-ATGGCTGAACCACACAGCTTCA-3′; reverse, 5′-AGGGGTCAGGAGA CCTCCCTTT-3′; Cebpa forward, 5′-CTGGAAGTGGGTGACTTAGAGG-3′; reverse, 5′-GAGTGGGGAGCATAGTGCTAG-3′. Data points (Ct) are converted to percentage of input.
Quantitative DNA methylation analysis
Matrix-assisted laser desorption/ionization time-of-flight mass spectrometry using EpiTyper by MassARRAY (Sequenom) was performed on bisulphite-converted DNA extracted from 3T3-L1 cells. MassARRAY primer design was done as previously described28,29.
Immunohistochemistry
Immunohistochemistry detection was performed using Discovery XT processor (Ventana Medical Systems). The tissue sections were blocked for 30 min in 10% normal goat serum in 0.2% BSA/PBS, followed by incubation for 5 h with 0.1 μg ml−1 of the rabbit polyclonal anti-H3K9me3 (Abcam, ab8898) or 1 μg ml−1 rabbit polyclonal anti-H3K27me3 (Millipore, 07-449) antibodies and incubation for 60 min with biotinylated goat anti-rabbit IgG (Vector labs, PK6101) at 1:200 dilution. The detection was performed with the DAB-MAP kit (Ventana Medical Systems). The entire slides were scanned by Zeiss Mirax Scan (Carl Zeiss) using a X20/0.8 objective. The scanned image was exported into image analysis software, Metamorph (Molecular Devices). The colour threshold for DAB-positive nuclei was determined and set for all images. Areas above the threshold for the DAB signal and for haematoxylin-counterstained total nuclei were measured in an automated fashion. The ratio between the two parameters were calculated and analysed for statistical significance.
Synthesis of 1-octyl-d-2-hydroxyglutarate
Commercial R(-)-tetrahydro-5-oxofuran-2-carboxylic acid (140 mg, 1.076 mmol) was dissolved in H2O (1 ml), cooled to 0 °C and treated with 1 N KOH (2.16 ml, 2.15 mmol). The resulting solution was stirred at this temperature for 5 min and at ambient temperature for 2 h. It was then concentrated to dryness under reduced pressure and dried. The residue was dissolved in trifluoroacetic anhydride (8 ml) at 0 °C, stirred for 30 min at 0 °C, for 2 h at room temperature, then the volatiles were evaporated under reduced pressure. The residue was dried and dissolved in anhydrous tetrahydrofuran (6 ml). Octanol (0.3 ml, 2.1 eq.) was added to the solution at 0 °C and the mixture was stirred for an overnight period at ambient temperature. Water was added to quench the reaction, and the mixture extracted with EtOAc. The combined extracts were dried over MgSO4, concentrated and purified by Flash chromatography (EtOAc:hexane 1:3 and 1:1) to give 1-octyl-d-2-hydroxyglutarate (110 mg, 39%).
Neurosphere isolation, culture and differentiation
Six days postpartum Ink4a/Arf null (p16/p19−/−) mice were killed, with the isolated subventricular zones subjected to chemical (Pronase E, Calbiochem 7433-2) and mechanical dissociation to obtain a single-cell suspension in full neurobasal medium (Neurobasal medium, GIBCO 21103; B27 supplement without retinoic acid, GIBCO 12587-010; Glutamax, GIBCO 35050; 20 ng ml−1 EGF, R&D Systems 236-EG; 20 ng ml−1 basic FGF, Millipore GF003). On the next day the cells were spun down and re-suspended in fresh medium, and once neurospheres had formed in culture, the spheres were collected and chemically dissociated (Accumax, Innovative Cell Technologies AM105) back into single cells in fresh medium.
One day after final infection, infected neurospheres and a non-infected control were placed in 400 mg μl−1 Hygromycin B (InvivoGen, ant-hg-1). Once selection was complete, isogenic cell lines maintained in full neurobasal medium were chemically dissociated into single cells and plated at the same density in full neurobasal medium with increasing concentrations of retinoic acid (Sigma-Aldrich, R2625). Seventy-two hours later cells were harvested, and expression of proteins was analysed by western blotting.
Measurement of total CpG methylation
DNA methylation was assessed as previously described30. In brief, 1 × 10⁶ NHA cells were washed with PBS and fixed with 2% paraformaldehyde for 10 min at room temperature and permeabilized with 0.5% Triton X-100 for 10 min. Cells were then treated with 2 N HCl for 20 min at room temperature and subsequently neutralized with 100 mM Tris-HCl, pH 8.0. Cells were incubated with anti-5-methylcytosine antibody (Calbiochem, NA 81) at 1:100 dilution for 30 min at room temperature. After washing with PBS, cells were incubated with secondary antibody coupled with ALEXA FLUOR 488 (Invitrogen) for 30 min in the dark. Flow cytometry was done using Becton Dickinson Calibur flow cytometer and analysed using FlowJo software.
Statistical analysis
All statistical analysis was performed using Student’s t-test (two-sample equal variance; two-tailed distribution).
Supplementary Material
Acknowledgments
We thank members of the Thompson laboratory for technical help and critical reading of the manuscript. We thank T. A. Gocke and the genomic core of University of Pennsylvania for their assistance with the microarray study; the molecular cytology core facility of Memorial Sloan-Kettering Cancer Center (MSKCC) for technical help with the immunohistochemistry study; and O. Ouerfelli and M. K. Spassova at the organic synthesis core of MSKCC for the synthesis of octyl-2HG. This work was supported by grants from the National Cancer Institute and National Institutes of Health. R.L.L. is an Early Career Award recipient of the Howard Hughes Medical Institute and the Geoffrey Beene Junior Chair at MSKCC. D.M.O’R. is supported by the Betsy Cohen Fund of the Abramson Cancer Center at University of Pennsylvania. I.K.M. is supported by NCI-U54CA143798, the Doris Duke Charitable Foundation, and an Advanced Clinical Research Award in Glioma from the American Society of Clinical Oncology.
Footnotes
Author Contributions C.L., P.S.W. and C.B.T. designed the study. C.L., P.S.W., G.S.K., D.R. and M.E.F. performed research; S.T., D.R., T.A.C. and I.K.M. contributed research material; C.L., P.S.W., G.S.K., O.A.-W., C.R.E., R.K., M.E.F., A.M., K.E.W., D.M.O’R., S.L.B., R.L.L. and C.B.T. contributed to data analysis and interpretation; C.L., P.S.W. and C.B.T. wrote the manuscript.
Supplementary Information is linked to the online version of the paper at www.nature.com/nature.
Author Information Microarray data have been deposited with the ArrayExpress database under accession code E-MEXP-3239.
The authors declare competing financial interests: details accompany the full-text HTML version of the paper at www.nature.com/nature.
References
- 1.Parsons DW, et al. An integrated genomic analysis of human glioblastoma multiforme. Science. 2008;321:1807–1812. doi: 10.1126/science.1164382. [DOI] [PMC free article] [PubMed] [Google Scholar]
- 2.Yan H, et al. IDH1 and IDH2 mutations in gliomas. N Engl J Med. 2009;360:765–773. doi: 10.1056/NEJMoa0808710. [DOI] [PMC free article] [PubMed] [Google Scholar]
- 3.Mardis ER, et al. Recurring mutations found by sequencing an acute myeloid leukemia genome. N Engl J Med. 2009;361:1058–1066. doi: 10.1056/NEJMoa0903840. [DOI] [PMC free article] [PubMed] [Google Scholar]
- 4.Amary MF, et al. IDH1 and IDH2 mutations are frequent events in central chondrosarcoma and central and periosteal chondromas but not in other mesenchymal tumours. J Pathol. 2011;224:334–343. doi: 10.1002/path.2913. [DOI] [PubMed] [Google Scholar]
- 5.Ward PS, et al. The common feature of leukemia-associated IDH1 and IDH2 mutations is a neomorphic enzyme activity converting α-ketoglutarate to 2-hydroxyglutarate. Cancer Cell. 2010;17:225–234. doi: 10.1016/j.ccr.2010.01.020. [DOI] [PMC free article] [PubMed] [Google Scholar]
- 6.Dang L, et al. Cancer-associated IDH1 mutations produce 2-hydroxyglutarate. Nature. 2009;462:739–744. doi: 10.1038/nature08617. [DOI] [PMC free article] [PubMed] [Google Scholar]
- 7.Figueroa ME, et al. Leukemic IDH1 and IDH2 mutations result in a hypermethylation phenotype, disrupt TET2 function, and impair hematopoietic differentiation. Cancer Cell. 2010;18:553–567. doi: 10.1016/j.ccr.2010.11.015. [DOI] [PMC free article] [PubMed] [Google Scholar]
- 8.Guo JU, Su Y, Zhong C, Ming G, Song H. Hydroxylation of 5-methylcytosine by TET1 promotes active DNA demethylation in the adult brain. Cell. 2011;145:423–434. doi: 10.1016/j.cell.2011.03.022. [DOI] [PMC free article] [PubMed] [Google Scholar]
- 9.Noushmehr H, et al. Identification of a CpG island methylator phenotype that defines a distinct subgroup of glioma. Cancer Cell. 2010;17:510–522. doi: 10.1016/j.ccr.2010.03.017. [DOI] [PMC free article] [PubMed] [Google Scholar]
- 10.Taverna SD, Li H, Ruthenburg AJ, Allis CD, Patel DJ. How chromatin-binding modules interpret histone modifications: lessons from professional pocket pickers. Nature Struct Mol Biol. 2007;14:1025–1040. doi: 10.1038/nsmb1338. [DOI] [PMC free article] [PubMed] [Google Scholar]
- 11.Berger SL. The complex language of chromatin regulation during transcription. Nature. 2007;447:407–412. doi: 10.1038/nature05915. [DOI] [PubMed] [Google Scholar]
- 12.Bernstein BE, et al. A bivalent chromatin structure marks key developmental genes in embryonic stem cells. Cell. 2006;125:315–326. doi: 10.1016/j.cell.2006.02.041. [DOI] [PubMed] [Google Scholar]
- 13.Estève PO, et al. Direct interaction between DNMT1 and G9a coordinates DNA and histone methylation during replication. Genes Dev. 2006;20:3089–3103. doi: 10.1101/gad.1463706. [DOI] [PMC free article] [PubMed] [Google Scholar]
- 14.Xu W, et al. Oncometabolite 2-hydroxyglutarate is a competitive inhibitor of α-ketoglutarate-dependent dioxygenases. Cancer Cell. 2011;19:17–30. doi: 10.1016/j.ccr.2010.12.014. [DOI] [PMC free article] [PubMed] [Google Scholar]
- 15.Chowdhury R, et al. Theoncometabolite 2-hydroxyglutarate inhibits histone lysine demethylases. EMBO Rep. 2011;12:463–469. doi: 10.1038/embor.2011.43. [DOI] [PMC free article] [PubMed] [Google Scholar]
- 16.Verhaak RG, et al. Integrated genomic analysis identifies clinically relevant subtypes of glioblastoma characterized by abnormalities in PDGFRA, IDH1, EGFR, and NF1. Cancer Cell. 2010;17:98–110. doi: 10.1016/j.ccr.2009.12.020. [DOI] [PMC free article] [PubMed] [Google Scholar]
- 17.MacDougald OA, Lane MD. Transcriptional regulation of gene expression during adipocyte differentiation. Annu Rev Biochem. 1995;64:345–373. doi: 10.1146/annurev.bi.64.070195.002021. [DOI] [PubMed] [Google Scholar]
- 18.Rubin CS, Hirsch A, Fung C, Rosen OM. Development of hormone receptors and hormonal responsiveness in vitro. Insulin receptors and insulin sensitivity in the preadipocyte and adipocyte forms of 3T3-L1 cells. J Biol Chem. 1978;253:7570–7578. [PubMed] [Google Scholar]
- 19.Krivtsov AV, Armstrong SA. MLL translocations, histone modifications and leukaemia stem-cell development. Nature Rev Cancer. 2007;7:823–833. doi: 10.1038/nrc2253. [DOI] [PubMed] [Google Scholar]
- 20.Hu Z, et al. A novel nuclear protein, 5qNCA (LOC51780) is a candidate for the myeloid leukemia tumor suppressor gene on chromosome 5 band q31. Oncogene. 2001;20:6946–6954. doi: 10.1038/sj.onc.1204850. [DOI] [PubMed] [Google Scholar]
- 21.van Haaften G, et al. Somatic mutations of the histone H3K27 demethylase gene UTX in human cancer. Nature Genet. 2009;41:521–523. doi: 10.1038/ng.349. [DOI] [PMC free article] [PubMed] [Google Scholar]
- 22.Bilodeau S, Kagey MH, Frampton GM, Rahl PB, Young RA. SetDB1 contributes to repression of genes encoding developmental regulators and maintenance of ES cell state. Genes Dev. 2009;23:2484–2489. doi: 10.1101/gad.1837309. [DOI] [PMC free article] [PubMed] [Google Scholar]
- 23.Ceol CJ, et al. The histone methyltransferase SETDB1 is recurrently amplified in melanoma and accelerates its onset. Nature. 2011;471:513–517. doi: 10.1038/nature09806. [DOI] [PMC free article] [PubMed] [Google Scholar]
- 24.Wellen KE, et al. ATP-citrate lyase links cellular metabolism to histone acetylation. Science. 2009;324:1076–1080. doi: 10.1126/science.1164097. [DOI] [PMC free article] [PubMed] [Google Scholar]
- 25.Ingvarsdottir K, et al. Histone H3K4 demethylation during activation and attenuation of GAL1 transcription in Saccharomyces cerevisiae. Mol Cell Biol. 2007;27:7856–7864. doi: 10.1128/MCB.00801-07. [DOI] [PMC free article] [PubMed] [Google Scholar]
- 26.Sonoda Y, et al. Formation of intracranial tumors by genetically modified human astrocytes defines four pathways critical in the development of human anaplastic astrocytoma. Cancer Res. 2001;61:4956–4960. [PubMed] [Google Scholar]
- 27.Balss J, et al. Analysis of the IDH1 codon 132 mutation in brain tumors. Acta Neuropathol. 2008;116:597–602. doi: 10.1007/s00401-008-0455-2. [DOI] [PubMed] [Google Scholar]
- 28.Figueroa ME, et al. Genome wide epigenetic analysis delineates a biologically distinct immature acute leukemia with myeloid/T-lymphoid features. Blood. 2009;113:2795–2804. doi: 10.1182/blood-2008-08-172387. [DOI] [PMC free article] [PubMed] [Google Scholar]
- 29.Figueroa ME, et al. DNA methylation signatures identify biologically distinct subtypes in acute myeloid leukemia. Cancer Cell. 2010;17:13–27. doi: 10.1016/j.ccr.2009.11.020. [DOI] [PMC free article] [PubMed] [Google Scholar]
- 30.Habib M, et al. DNA global hypomethylation in EBV-transformed interphase nuclei. Exp Cell Res. 1999;249:46–53. doi: 10.1006/excr.1999.4434. [DOI] [PubMed] [Google Scholar]
Associated Data
This section collects any data citations, data availability statements, or supplementary materials included in this article.