Abstract
Pulmonary nodules are of high clinical importance, given they may prove to be an early manifestation of lung cancer. Pulmonary nodules are small, focal, radiographic opacities that may be solitary or multiple. A solitary pulmonary nodule is a single, small (≤30 mm in diameter) opacity. Larger opacities are called masses and are often malignant. As imaging techniques improve and more nodules are detected, the optimal management of pulmonary nodules remains unclear. However, the question of malignancy of any given nodule remains the same. A standard contrast-enhanced computed tomography (CT) scan is often the first examination, followed by a number of other examinations. The purpose of this study was to examine the clinical feasibility of CT versus integrated [18F]fluorodeoxyglucose-positron emission tomography (PET)/low-dose CT scan in patients with suspected lung cancer and pulmonary lesions on CT. All results were controlled for reproducibility. We found that when used early in the work-up of the lesions, CT raised the prevalence of lung cancer in the population to the point where further diagnostic imaging examination could be considered futile. We also found that the overall diagnostic accuracy, as well as the classification probabilities and predictive values of the two modalities were not significantly different; the reproducibility of these results was substantial.
Keywords: Lung neoplasms; radiography; radionuclide imaging; multidetector computed tomography, positron emission tomography/computed tomography, sensitivity, specificity
Introduction
Pulmonary nodules are of high clinical importance, given they may prove to be an early manifestation of lung cancer. Pulmonary nodules are small, focal, radiographic opacities that may be solitary or multiple. A solitary pulmonary nodule is a single, small (≤30 mm in diameter) opacity[1,2]. Larger opacities are called masses and are often malignant[3]. Pulmonary nodules and masses are also known as pulmonary lesions.
As imaging techniques improve and more nodules are detected, the optimal management of pulmonary nodules remains unclear. However, the question of malignancy of any given nodule remains the same. Current assessment strategies include: no follow-up in low-risk patients and imaging follow-up in high-risk patients with very small nodules (<4 mm); imaging follow-up in low-risk patients and imaging as well as tissue sampling in high-risk patients with small nodules (4–8 mm); and imaging as well as tissue sampling in all patients regardless of risk class with larger nodules and masses. This is irrespective of whether the nodules are incidental findings or if they are found in patients with suspected lung cancer[4].
Obviously, imaging plays an important role in the assessment of patients with suspected lung cancer and in the assessment of patients with incidentally discovered pulmonary nodules. Usually the first imaging examination is a chest radiograph. This is followed by contrast-enhanced computed tomography (CT) of the thorax and upper abdomen and, dependent on local arrangements, by whole-body integrated [18F]fluorodeoxyglucose (FDG)-positron emission tomography (PET)/CT.
FDG-PET aids in differentiating malignant and benign nodules if these are >10 mm in diameter[5–7]. For this purpose, sensitivity has been reported to be 80–100% (median, 87%) and specificity to be 40–100% (median, 83%) for malignancy of lung nodules[3]. However, due to large numbers of false-negatives, the use of FDG-PET outside clinical trials is discouraged for nodules <10 mm[8]. Besides the risk of false-negatives in nodules <10 mm, FDG-PET is also reported to give false-negatives in highly differentiated adenocarcinomas and other slow-growing cancers[9,10]. This considerable risk of false-negatives means that, although FDG-PET has been reported to have a consistently high negative predictive value, the modality cannot be used to rule out lung nodule malignancy. FDG-PET is also reported to be false-positive in infections and inflammation of all kinds[11,12].
Modern FDG-PET scanners are integrated with CT scanners in a single gantry (FDG-PET/CT scanner). The purpose of this is to couple the functionality of an FDG-PET scanner with the resolution of a CT scanner, thereby increasing the value of both. However, there are only few published studies on the matter of characterization of pulmonary nodules using integrated FDG-PET/CT scanners[13–15].
The purpose of this study was to examine the clinical feasibility of CT versus integrated FDG-PET/low-dose CT in patients with suspected lung cancer and pulmonary lesions on CT. First, CT and FDG-PET/CT were compared by their overall lesion characterization results. Second, FDG-PET/CT lesion characterization results were examined in three different patient subgroups. All results were controlled for reproducibility.
Materials and methods
Study population
The study conformed to Danish legal requirements. As all subjects received best patient care and no biological material was involved, Institutional Review Board approval was waived (The Central Denmark Region Committees on Biomedical Research Ethics, case no. 1-15-0-72-2-09).
Patients with suspected lung cancer, who were referred to a tertiary sector hospital for diagnosis, were prospectively identified for inclusion over a 15-month study period. All patients received standard contrast-enhanced CT of the chest and upper abdomen as part of their clinical work-up. Based on the CT results, the patients were the subjects of a multidisciplinary decision. If there were no pulmonary lesions, or at least no pulmonary lesions suspicious for malignancy on CT, the patients were either discharged without follow-up or received CT follow-up after 3, 6, 12, 24 months or longer. On the other hand, if there were indeterminate lesions or lesions suspicious for malignancy on CT, they underwent whole-body FDG-PET/CT.
Consecutive patients who received both a CT of the thorax and upper abdomen, and an FDG-PET/CT scan of the whole body were included in the study. To ensure equal review terms between CT and FDG-PET/CT, all examinations done as part of the clinical work-up were blinded, and were reviewed as part of the study. A total of 182 consecutive patients received a CT scan as well as an FDG-PET/CT scan. However, 14 patients were excluded due to discrepancy between CT and FDG-PET/CT nodule location, incomplete FDG-PET/CT data or incomplete CT data, leaving 168 patients for final analysis. Patient sampling preceded both imaging and reference standards. Therefore the study design was prospective.
CT procedures
CT including the chest and the upper abdomen was performed with an multidetector computed tomography (MDCT) scanner (Philips Brilliance CT 64-channel scanner; Philips Healthcare, Best, The Netherlands). The CT acquisition parameters were: 64 × 0.625 mm collimation, section thickness 2.0 mm, increment 1.0 mm. iodixanole 270 mg/ml (Visipaque® 270; GE Healthcare, Oslo, Norway) or iohexole 300 mg/ml (Omnipaque® 300; GE Healthcare, Oslo, Norway) was injected intravenously in weight-adjusted doses of 2 ml/kg body weight to compensate for differences in distribution volume. A bolus tracking technique was used to compensate for differences in cardiac output. The trigger region of interest (ROI) was placed in the aorta and when it exceeded 200 HU, the patients were scanned from the root of the neck to the upper abdomen including the liver and adrenals. CT was performed after a delay of 15 s for the chest and 65 s for the upper abdomen and raw picture data sets were transferred to a Philips Extended Brilliance™ Workspace workstation v4.02, where they were reviewed with the application CT-viewer.
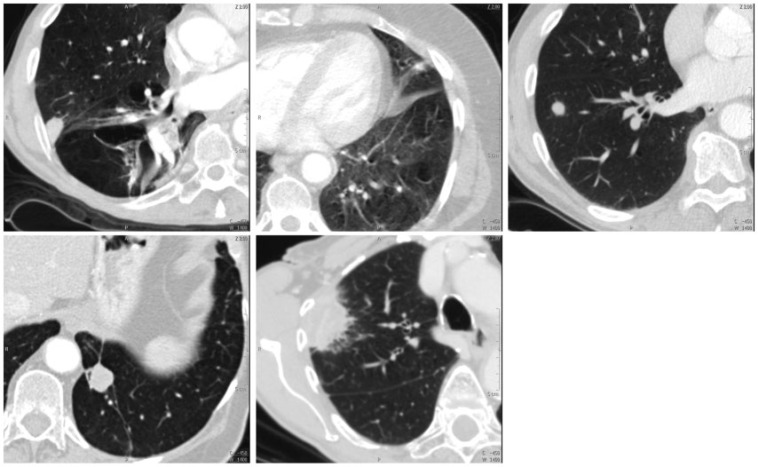
Two consultant radiologists reviewed the studies. The reviewers were blinded to patient name, patient ID and clinical data. They assessed three well-documented predictors of malignancy[3]: (1) lesion size, measured as the greatest axial diameter on CT; (2) lesion morphology, assessed as smooth, irregular or spiculated; and (3) lesion attenuation assessed as solid, partly solid or ground glass opacity (GGO). Although no formalized score system was used, these predictors were considered as the reviewers assigned each lesion an overall rating on potential of malignancy. The following rating scale was used: (1) definitely benign, (2) probably benign, (3) indeterminate, (4) probably malignant and (5) definitely malignant (Table 1) (Fig. 1). Both radiologists reviewed all participants' images side by side to obtain consensus results for the study. Six months later, they reviewed the first 100 participants' images again, individually, to assess reproducibility.
Table 1.
CT and FDG-PET/CT ratings
| CT | Definitely benign | Probably benign | Indeterminate | Probably malignant | Definitely malignant |
| Benign | 10 | 1 | 6 | 2 | 13 |
| Malignant | 2 | 3 | 5 | 6 | 120 |
| FDG-PET/CT | No uptake | Mildly increased uptake | Moderately increased uptake | Intensely increased uptake | |
| Benign | 15 | 5 | 3 | 9 | |
| Malignant | 4 | 5 | 24 | 103 | |
Figure 1.
The 5 CT ratings. From top left to bottom right, these specific lesions were rated as: definitely benign, probably benign, indeterminate, probably malignant and definitely malignant.
FDG-PET/CT procedures
As a part of a fast-track work-up for suspected lung cancer, the patients received CT and FDG-PET/CT within a few days, followed immediately by tissue sampling. Whole-body FDG-PET/CT including the head except for the brain, neck, thorax, abdomen, pelvis and thighs was performed with an integrated PET/CT scanner (Siemens Biograph w. 40-slice CT scanner; Siemens Healthcare, Erlangen, Germany). Participants were instructed to fast for 6 h prior to the examination. Approximately 400 MBq FDG was injected intravenously. FDG-PET/CT scans were performed after a delay of 60 min. The FDG-PET images were corrected for scatter and iteratively reconstructed. CT acquisition parameters were: 40 × 3.0 mm collimation, section thickness 5.0 mm, increment 3.0 mm. No contrast medium was administered. FDG-PET/CT picture data sets were transferred to a Hermes Gold 3™ workstation, where they were reviewed with the application Hermes Hybrid Viewer.
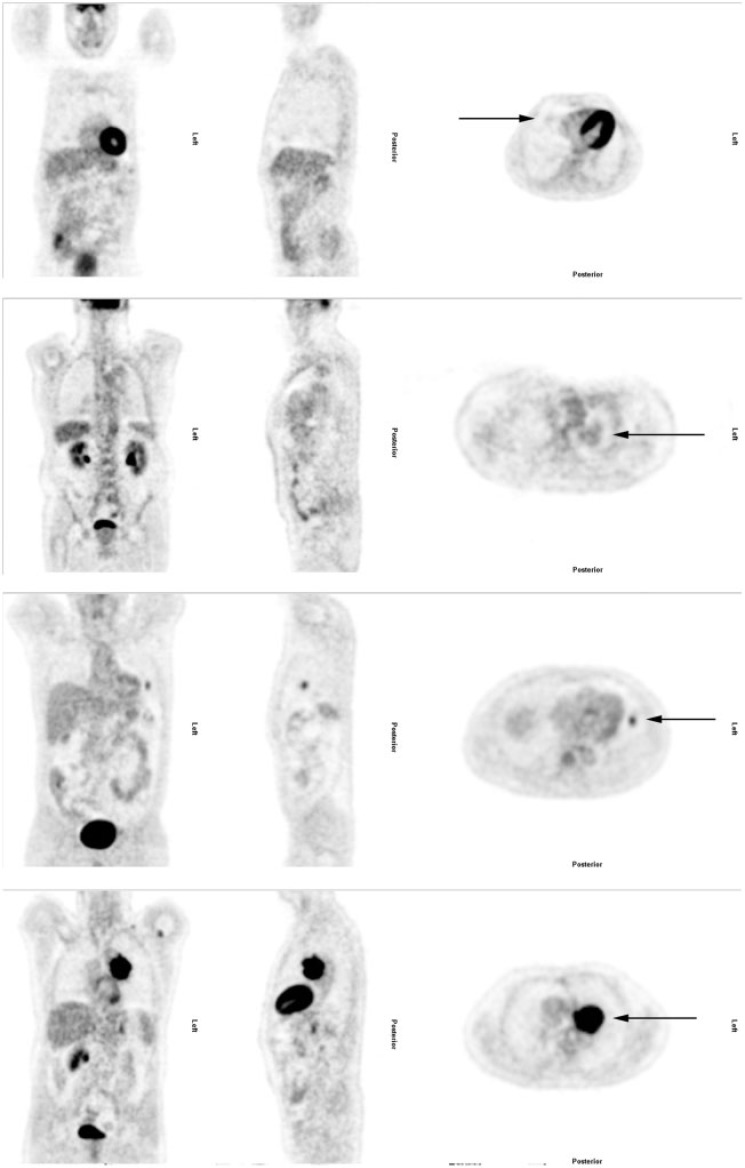
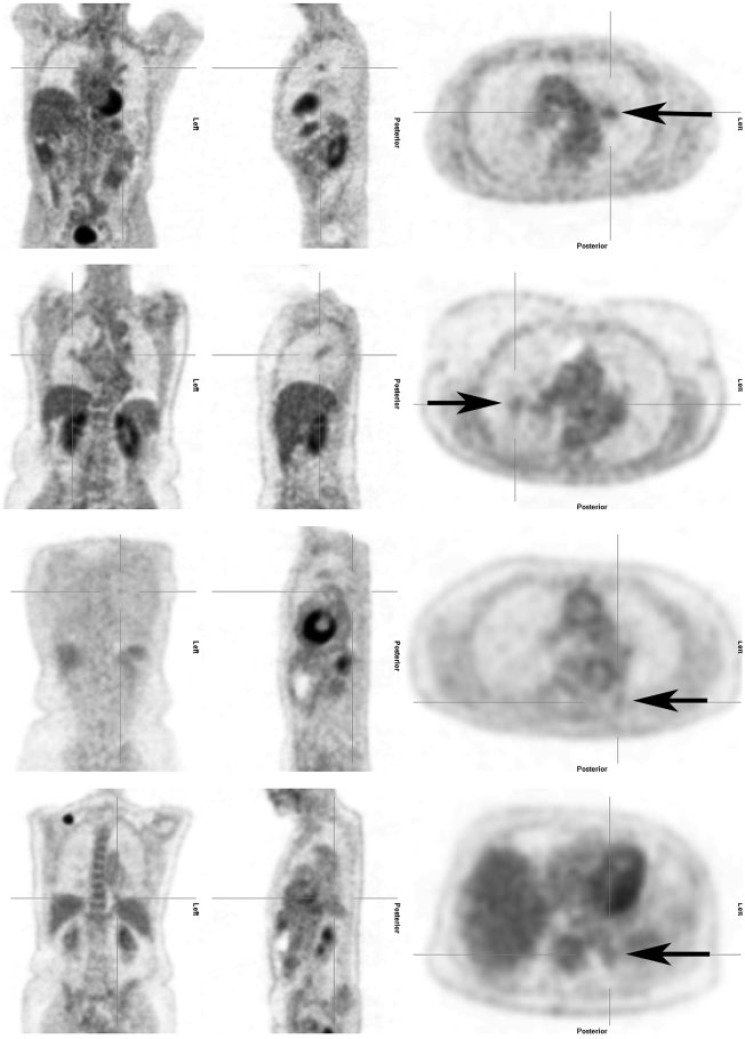
Two consultants in nuclear medicine did the FDG-PET/CT reviews. The reviewers were blinded to patient names, patient IDs and clinical data. According to international guidelines, FDG uptake was compared with the background uptake of the liver. Thus, lesion uptake was rated on a scale of 1 to 4: (1) no uptake, (2) mildly increased uptake (i.e. below liver level uptake), (3) moderately increased uptake (i.e. at or slightly above liver level uptake) and (4) intensely increased uptake (i.e. substantially above liver level uptake)[16] (Table 1) (Fig. 2). Both nuclear medicine consultants reviewed all participants' images side by side to obtain consensus results for the study. Six months later, they reviewed the first 100 participants’ images again, individually, to assess reproducibility.
Figure 2.
The 4 FDG-PET/CT ratings. From top to bottom, these specific lesions were rated as: negative, with mildly increased uptake, with moderately increased uptake and with intensely increased uptake.
The consultant radiologists had no access to the FDG-PET/CT images and the consultants in nuclear medicine had no access to the CT images. Thus, the reviewers were completely blinded.
Reference standard
In general, tissue sampling was the preferred reference standard. All malignant diagnoses were verified by tissue sampling and all non-malignant diagnoses were verified by tissue sampling. In this manner, three separately obtained non-malignant diagnoses were accepted as a definitely benign result. In most cases, lesion material was obtained by fluoroscopy-guided or CT-guided transthoracic needle aspiration biopsy (TNAB). However, in selected cases, material was obtained by bronchoscopy or by video-assisted thoracic surgery (VATS). Definitive diagnoses were obtained in 91% (153/168) of all cases in this study.
In 9% (15/168) of the cases, it was inappropriate to do an invasive procedure to achieve a definitive diagnosis. In these cases, CT follow-up was accepted as the reference standard. Studies have shown that solid nodules that have been stable for at least 2 years usually do not require further evaluation[17–19]. Therefore, CT follow-up was done at 3, 6, 12 and 24 months. Partly solid nodules and GGOs should be followed for at least 36 months. However, as the validity of the follow-up rules has been questioned[20], the follow-up period was longer if necessary. Follow-up ceased prematurely if lesions resolved entirely. The follow-up time in this study was 5–30 months (median, 18 months).
Statistics
Pulmonary lesions were rated on an ordinal scale from 1 to 5 (CT) or from 1 to 4 (FDG-PET/CT), with higher values being indicative of malignancy[21]. Diagnostic accuracy was defined as the area under the fitted receiver operating characteristic (ROC) curve and was computed using the ratings with a maximum-likelihood ROC model assuming bivariate normal distributions[22]. Sensitivity, specificity, positive predictive value and negative predictive value were computed from the resulting 2 × 2 contingency tables. Two different clinical situations relating to the role of CT as the first examination in a line of examinations were addressed: (1) What were the sensitivity, specificity and positive predictive value if CT was used to identify patients with lung cancer? In this situation it was important to achieve a high positive predictive value. Therefore, CT ratings 1–3 were considered benign results, and CT ratings 4 and 5 were considered malignant results. (2) What were the sensitivity, specificity and negative predictive value if CT was used to rule out cancer? In this situation, it was important to achieve a high sensitivity and a high negative predictive value. Therefore, CT ratings 1 and 2 were considered benign test results, and CT ratings 3 to 5 were considered malignant test results. In both situations, an FDG-PET/CT rating of 1 was considered a benign test result, and FDG-PET/CT ratings of 2–4 were considered malignant test results. The reproducibility of the results was assessed with weighted kappa of the original ratings.
According to accepted scientific standards, all data on diagnostic performance as well on reproducibility were reported using 95% confidence intervals. Sample test statistics were used when appropriate; in these instances, Fisher’s exact test was used to test for correlation between categorized (nominal) variables, and Spearman’s rho was used to test for correlation between ordered categorized (ordinal) variables. The chi-squared test was used to test for non-independence of the areas under the ROC curves of CT and FDG-PET/CT. P values < 0.05 were considered statistically significant, and P values < 0.001 were considered highly statistically significant.
The licensed statistical software package STATA/SE 11 (STATAcorp LP, College Station, TX) was used for the statistical analyses.
Results
Overall results
A total of 89 males and 79 females aged 34–88 years (mean, 66 years) participated in the study. Each participant had a single pulmonary lesion. Eighty-one percent (136/168) of the lesions were malignant and 19% (32/168) were benign. The malignant lesions had the following distribution: 47% (64/136) adenocarcinomas, 30% (41/136) squamous cell carcinomas, 4% (6/136) large cell carcinomas, 9% (12/136) other or undifferentiated non-small cell ling carcinomas, 8% (11/136) small cell lung carcinomas and 1% (2/136) metastases from extrathoracic cancers.
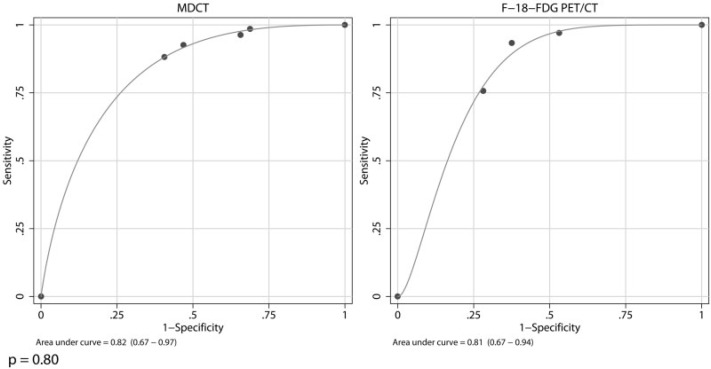
There was no significant difference between the areas under the ROC curves of CT and FDG-PET/CT (χ2 = 0.07; P = 0.80) (Fig. 3). Although based on different criteria, CT and FDG-PET/CT ratings were both highly associated with malignancy (both P < 0.001). Likewise, the overall accuracy was higher than 80% for both imaging modalities. This was irrespective of whether CT was used to identify lung cancer or to rule out cancer.
Figure 3.
These two parametric ROC curves illustrate the overall lesion characterization results of CT and FDG-PET/CT. In this study, the overall diagnostic accuracy of CT and FDG-PET/CT was defined as the area under the parametric ROC curves. The two ROC curves were compared using the chi-squared test.
In practice, CT results did not vary significantly, irrespective of whether the imaging modality was used to identify lung cancer or to rule out cancer; in both instances the sensitivity was >90%. However, specificity was almost 20 percentage points higher if CT was used to identify lung cancer than to rule out cancer (Table 2). Reproducibility of the CT ratings was substantial (κ = 0.62 (0.41–0.76)).
Table 2.
Overall results of CT and FDG-PET/CT
| CT used to identify lung cancer, % (95% CI) | CT used to rule out cancer, % (95% CI) | FDG-PET/CT, % (95% CI) | |
|---|---|---|---|
| Sensitivity | 93 (87–96) | 96 (92–99) | 97 (93–99) |
| Specificity | 53 (35–71) | 34 (19–53) | 47 (29–65) |
| Positive predictive value | 89 (83–94) | 86 (80–91) | 89 (82–93) |
| Negative predictive value | 63 (42–81) | 69 (41–89) | 79 (54–94) |
| False-positive rate | 47 | 66 | 53 |
| False-negative rate | 7.3 | 3.7 | 2.9 |
FDG-PET/CT results were very similar to CT results; the sensitivity for FDG-PET/CT was >90% and the specificity was 47% (Table 2). Reproducibility of the FDG-PET/CT ratings was substantial (κ = 0.73 (0.43–0.89)).
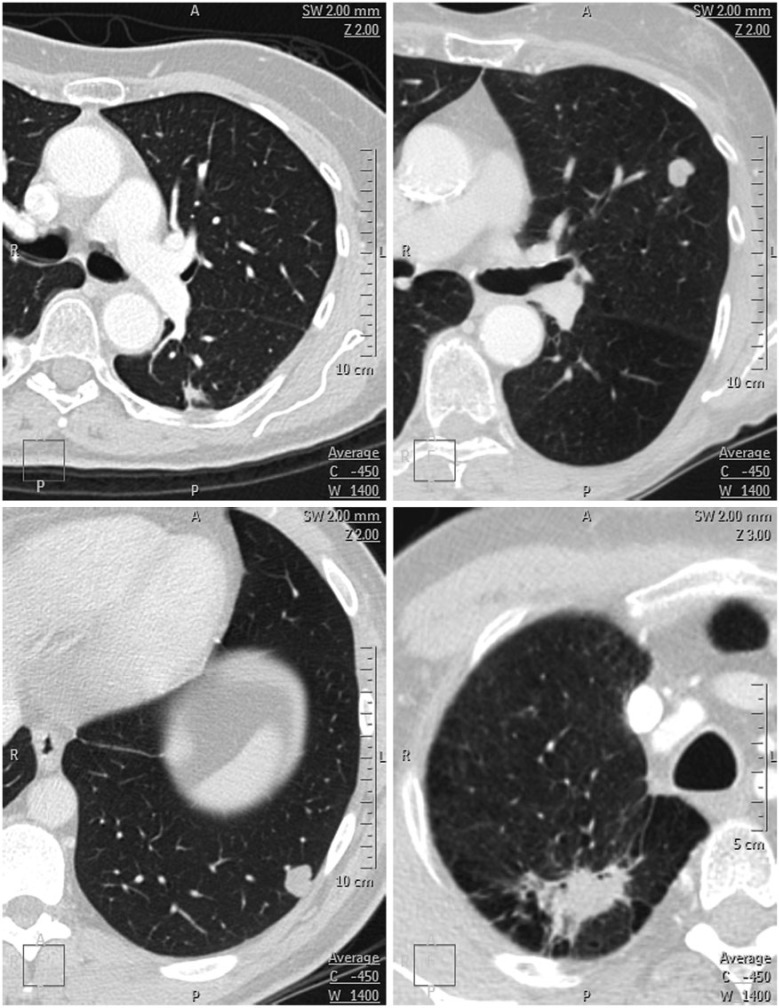
When the false-positives and false-negatives were reviewed, the modalities also yielded very similar results (Table 2) (Figs. 4 and 5). The false-positive rate, at approximately 50%, was clearly too high; this was irrespective of the imaging modality and the clinical situation. On the other hand, the false-negative rate was well below 5% in all instances. The false-negative lesions on FDG-PET/CT comprised three adenocarcinomas and a transitional cell carcinoma metastasis. The size of these lesions ranged from 7 mm to 24 mm (median, 17 mm).
Figure 4.
Four false-negative lesions on CT. Both nodules in the top row were rated as definitely benign and both nodules in the bottom row were rated as probably benign. Both nodules in the top row, and the nodule in the bottom left represent adenocarcinomas; the nodule in the bottom right represents a large cell carcinoma. In retrospect, the large cell carcinoma could have been rated differently.
Figure 5.
Four false-negative lesions on FDG-PET/CT. The lesions in rows 1–3 represent adenocarcinomas; the lesion in row 4 represents a transitional cell carcinoma metastasis.
Stratified results
The CT results were used to stratify the FDG-PET/CT results into subgroups.
If CT was used to identify patients with lung cancer (i.e. lesions reviewed as being probably malignant or definitely malignant on CT (n = 141)), a positive FDG-PET/CT examination would make the likelihood of malignancy even higher. For this purpose, the sensitivity and specificity of FDG-PET/CT were 98% and 27%, respectively; the false-positive rate was 73% (Table 3).
Table 3.
Stratified results for FDG-PET/CT
| CT used to identify lung cancer, % (95% CI) | CT used to rule out cancer, % (95% CI) | CT was indeterminate, % (95% CI) | |
|---|---|---|---|
| Sensitivity | 98 (93–100) | 80 (28–100) | 100 (48–100) |
| Specificity | 27 (8–55) | 64 (31–89) | 67 (22–96) |
| Positive predictive value | 92 (86–96) | 50 (16–84) | 71 (29–96) |
| Negative predictive value | 57 (18–90) | 88 (47–100) | 100 (40–100) |
| False-positive rate | 73 | 36 | 33 |
| False-negative rate | 2 | 20 | 0 |
If CT was used to rule out cancer (i.e. lesions reviewed as being probably benign or definitely benign on CT (n = 16)), obviously the clinical issue would be to rule out cancer. For this purpose, the sensitivity and specificity of FDG-PET/CT were 80% and 64%, respectively; the false-negative rate was 20% (Table 3).
If CT was indeterminate (i.e. lesions reviewed as being indeterminate on CT (n = 11)), the sensitivity and specificity of FDG-PET/CT were 100% and 67%, respectively; the false-positive rate was 33%. There were no false-negatives (Table 3).
Discussion
Previous studies by our research group have indicated that the prevalence of lung cancer is 15–20% in the population referred for CT[23,24]. However, in this study, the pre-study standard contrast-enhanced CT raised the prevalence of malignancy to more than 80%, a significant result in itself. It was obvious from the overall results that standard contrast-enhanced CT is better suited to diagnosing patients with lung cancer than ruling out cancer; all other things being equal, the specificity for the former purpose was 20 percentage points higher than for the latter. On the other hand, there was strikingly little difference between overall CT and FDG-PET/CT results.
These results raised a need for stratification according to the CT results in order to mimic the setup in daily practice. When reviewing the stratified results, it appeared that FDG-PET/CT could be an effective examination for patients if they had been previously identified with lung cancer on CT or if the CT was indeterminate. However, in a clinical setting, these patients would already be considered highly suspicious for malignant disease and although FDG-PET/CT might make the likelihood of lung cancer even higher, the need to obtain a lesion biopsy would in most cases make further diagnostic imaging redundant. Thus, in this context, FDG-PET/CT would make no difference to these patients. The next question was whether FDG-PET/CT should be offered to patients if they were previously deemed cancer free on CT. Obviously, for these patients the major clinical issue would be to rule out cancer. However, the low prevalence of malignancy in these patients combined with the rather significant false-negative rate of FDG-PET/CT indicates that the chance of finding an additional lung cancer in this group would be so low that it would hardly justify further work-up. Therefore, clinically, it would make more sense to follow these patients with CT.
The results of this study are fairly close to those previously reported on the subject, further bolstering them. In the present study, the prevalence of malignancy was 81%. If CT was used to identify patients with lung cancer, the sensitivity and specificity were 93% and 53%, respectively; the sensitivity and specificity of FDG-PET/CT were 97% and 47%, respectively. In comparison, in an analysis by Wahidi et al.[3] from 2007, the prevalence of malignancy was 48–73% in 8 studies of CT imaging. In the same analysis, the prevalence of malignancy was 46–82% in 17 studies of FDG-PET imaging. CT sensitivity was 98–100% (median, 100%) and specificity was 54–95% (median, 75%); FDG-PET/CT sensitivity was 80–100% (median, 87%) and specificity was 40–100% (median, 83%). In turn, those results were slightly less optimistic than those of 40 studies of FDG-PET analysed by Gould et al.[25] in 2001.
There were some limitations to the design of this study, the most significant of which was whether it was justifiable to let the outcome of one imaging test determine whether the next should be carried out. However, as mentioned above, this trial was performed in the clinical setting and represented everyday imaging algorithms and problems. Clinically, based on cost–benefit analyses and due to radiation considerations, it would not be feasible to suggest FDG-PET/CT as the first examination for patients with suspected lung cancer.
Conversely, our study’s strengths must also be mentioned. Patient sampling preceded both imaging and the reference standard. This prospective design, as well as the blinding procedure, conforms to the STARD statement from 2003, which dictates that these are both natural requisites in studies of diagnostic accuracy[26]. Furthermore, the study size was large; 168 participants with pulmonary lesions were included. This should be compared with an average of 37–66 participants per study for both CT and FDG-PET/CT in most studies[3,25], making our study comparably strong. In addition, all results in this study were controlled for reproducibility. Although this has been standard for CT since the STARD statement, to the best of our knowledge, reproducibility has not previously been controlled for FDG-PET/CT.
In conclusion, this study was initiated to compare CT with FDG-PET/CT for characterization of pulmonary lesions in patients with suspected lung cancer. When used early in the work-up of the lesions, CT raised the prevalence of lung cancer in the population to the point at which further diagnostic imaging examination could be considered redundant. Standard contrast-enhanced CT seems better suited to identify patients with lung cancer than to rule out cancer. Finally, the overall diagnostic accuracy as well as the classification probabilities and predictive values of the two modalities were not significantly different. The reproducibility of the above results was substantial.
In conclusion, although standard contrast-enhanced CT has brought us far in the characterization of pulmonary nodules and masses, the last decade has seen a constant move away from strictly anatomical approaches to imaging, towards more functional or analytical approaches. The desire is, of course, to be able to safely distinguish between malignant and benign nodules without the need for invasive procedures. By examining some of the current imaging modalities in the field, this study is a step towards that goal.
Footnotes
This paper is available online at http://www.cancerimaging.org. In the event of a change in the URL address, please use the DOI provided to locate the paper.
References
- 1.Ost D, Fein AM, Feinsilver SH. Clinical practice. The solitary pulmonary nodule. N Engl J Med. 2003;348:2535–2542. doi: 10.1056/NEJMcp012290. . PMid:12815140. [DOI] [PubMed] [Google Scholar]
- 2.Tuddenham WJ. Glossary of terms for thoracic radiology: recommendations of the nomenclature committee of the Fleischner Society. AJR Am J Roentgenol. 1984;143:509–517. doi: 10.2214/ajr.143.3.509. PMid:6380245. [DOI] [PubMed] [Google Scholar]
- 3.Wahidi MM, Govert JA, Goudar RK, Gould MK, McCrory DC American College of Chest Physicians. Evidence for the treatment of patients with pulmonary nodules: when is it lung cancer? ACCP evidence-based clinical practice guidelines. 2nd ed. Chest. 2007;132(3 Suppl):94S–107S. doi: 10.1378/chest.07-1352. . PMid:17873163. [DOI] [PubMed] [Google Scholar]
- 4.MacMahon H, Austin JH, Gamsu G, et al. Guidelines for management of small pulmonary nodules detected on CT scans. A statement from the Fleischner Society. Radiology. 2005;237:395–400. doi: 10.1148/radiol.2372041887. . PMid:16244247. [DOI] [PubMed] [Google Scholar]
- 5.Lindell RM, Hartman TE, Swensen SJ, et al. Lung cancer screening experience: a retrospective review of PET in 22 non-small cell lung carcinomas detected on screening chest CT in a high-risk population. AJR Am J Roentgenol. 2005;185:126–131. doi: 10.2214/ajr.185.1.01850126. PMid:15972412. [DOI] [PubMed] [Google Scholar]
- 6.Nomori H, Watanabe K, Ohtsuka T, Naruke T, Suemasu K, Uno K. Evaluation of F-18 fluorodeoxyglucose (FDG) PET scanning for pulmonary nodules less than 3 cm in diameter, with special reference to the CT images. Lung Cancer. 2004;45:19–27. doi: 10.1016/j.lungcan.2004.01.009. . PMid:15196730. [DOI] [PubMed] [Google Scholar]
- 7.Pastorino U, Bellomi M, Landoni C, et al. Early lung-cancer detection with spiral CT and positron emission tomography in heavy smokers: 2-year results. Lancet. 2003;362:593–597. doi: 10.1016/S0140-6736(03)14188-8. . PMid:12944057. [DOI] [PubMed] [Google Scholar]
- 8.Herder GJ, Golding RP, Hoekstra OS, et al. The performance of (18)F-fluorodeoxyglucose positron emission tomography in small solitary pulmonary nodules. Eur J Nucl Med Mol Imaging. 2004;31:1231–1236. doi: 10.1007/s00259-004-1552-7. PMid:15175835. [DOI] [PubMed] [Google Scholar]
- 9.Higashi K, Ueda Y, Seki H, et al. Fluorine-18-FDG PET imaging is negative in bronchioloalveolar lung carcinoma. J Nucl Med. 1998;39:1016–1020. PMid:9627336. [PubMed] [Google Scholar]
- 10.Lowe VJ, Fletcher JW, Gobar L, et al. Prospective investigation of positron emission tomography in lung nodules. J Clin Oncol. 1998;16:1075–1084. doi: 10.1200/JCO.1998.16.3.1075. PMid:9508193. [DOI] [PubMed] [Google Scholar]
- 11.Fletcher JW. PET scanning and the solitary pulmonary nodule. Semin Thorac Cardiovasc Surg. 2002;14:268–274. doi: 10.1053/stcs.2002.33429. PMid:12232868. [DOI] [PubMed] [Google Scholar]
- 12.Dewan NA, Gupta NC, Redepenning LS, Phalen JJ, Frick MP. Diagnostic efficacy of PET-FDG imaging in solitary pulmonary nodules. potential role in evaluation and management. Chest. 1993;104:997–1002. doi: 10.1378/chest.104.4.997. . PMid:8404239. [DOI] [PubMed] [Google Scholar]
- 13.Quaia E, Tona G, Gelain F, et al. Integrated fluorine-18 fluorodeoxyglucose (18F-FDG) PET/CT compared to standard contrast-enhanced CT for characterization and staging of pulmonary tumors eligible for surgical resection. Acta Radiol. 2008;49:995–1004. doi: 10.1080/02841850802291259. . PMid:18651256. [DOI] [PubMed] [Google Scholar]
- 14.Lardinois D, Weder W, Hany TF, et al. Staging of non-small-cell lung cancer with integrated positron-emission tomography and computed tomography. N Engl J Med. 2003;348:2500–2507. doi: 10.1056/NEJMoa022136. . PMid:12815135. [DOI] [PubMed] [Google Scholar]
- 15.Antoch G, Stattaus J, Nemat AT, et al. Non-small cell lung cancer; Dual-modality PET/CT in preoperative staging. Radiology. 2003;229:526–533. doi: 10.1148/radiol.2292021598. . PMid:14512512. [DOI] [PubMed] [Google Scholar]
- 16.Delbeke D, Coleman RE, Guiberteau MJ, et al. Procedure guideline for tumor imaging with 18F-FDG PET/CT 1.0. J Nuclear Med. 2006;47:885–889. [PubMed] [Google Scholar]
- 17.Friberg S, Mattson S. On the growth rates of human malignant tumors. Implications for medical decision making. J Surg Oncol. 1997;65:284–297. doi: 10.1002/(SICI)1096-9098(199708)65:4<284::AID-JSO11>3.0.CO;2-2. . PMid:9274795. [DOI] [PubMed] [Google Scholar]
- 18.Weiss W. Tumor doubling time and survival of men with bronchogenic carcinoma. Chest. 1974;65:3–8. doi: 10.1378/chest.65.1.3. . PMid:4358467. [DOI] [PubMed] [Google Scholar]
- 19.Nathan MH, Collins VP, Adams RA. Differentiation of benign and malignant pulmonary nodules by growth rate. Radiology. 1962;79:221–232. doi: 10.1148/79.2.221. PMid:14478531. [DOI] [PubMed] [Google Scholar]
- 20.Yankelevitz DF, Henschke CI. Does 2-year stability imply that pulmonary nodules are benign? AJR Am J Roentgenol. 1997;168:325–328. doi: 10.2214/ajr.168.2.9016198. PMid:9016198. [DOI] [PubMed] [Google Scholar]
- 21.Weinstein S, Obuchowski NA, Lieber ML. Clinical evaluation of diagnostic tests. AJR Am J Roentgenol. 2005;184:14–19. doi: 10.2214/ajr.184.1.01840014. PMid:15615943. [DOI] [PubMed] [Google Scholar]
- 22.Obuchowski NA. ROC analysis. AJR Am J Roentgenol. 2005;184:364–372. doi: 10.2214/ajr.184.2.01840364. PMid:15671347. [DOI] [PubMed] [Google Scholar]
- 23.Harders SW, Madsen HH, Hjorthaug K, et al. Limited value of 99mTc depreotide single photon emission CT compared with CT for the evaluation of pulmonary lesions. Br J Radiol. 2012;85:e307–e313. doi: 10.1259/bjr/10438644. . PMid:22745210. [DOI] [PMC free article] [PubMed] [Google Scholar]
- 24.Harders SW, Madsen HH, Rasmussen TR, Hager H, Rasmussen F. High resolution spiral CT for determining the malignant potential of solitary pulmonary nodules: refining and testing the test. Acta Radiol. 2011;52:401–409. doi: 10.1258/ar.2011.100377. . PMid:21498302. [DOI] [PubMed] [Google Scholar]
- 25.Gould MK, Maclean CC, Kuschner WG, Rydzak CE, Owens DK. Accuracy of positron emission tomography for diagnosis of pulmonary nodules and mass lesions: a meta-analysis. JAMA. 2001;285:914–912. doi: 10.1001/jama.285.7.914. . PMid:11180735. [DOI] [PubMed] [Google Scholar]
- 26.Bossuyt PM, Reitsma JB, Bruns DE, et al. Towards complete and accurate reporting of studies of diagnostic accuracy: the STARD initiative. Br Med J. 2003;326:41–44. doi: 10.1136/bmj.326.7379.41. [DOI] [PMC free article] [PubMed] [Google Scholar]


