


Abstract
Understanding the categorization of human diseases is critical for reliably identifying disease causal genes. Recently, genome-wide studies of abnormal chromosomal locations related to diseases have mapped >2000 phenotype–gene relations, which provide valuable information for classifying diseases and identifying candidate genes as drug targets. In this article, a regularized non-negative matrix tri-factorization (R-NMTF) algorithm is introduced to co-cluster phenotypes and genes, and simultaneously detect associations between the detected phenotype clusters and gene clusters. The R-NMTF algorithm factorizes the phenotype–gene association matrix under the prior knowledge from phenotype similarity network and protein–protein interaction network, supervised by the label information from known disease classes and biological pathways. In the experiments on disease phenotype–gene associations in OMIM and KEGG disease pathways, R-NMTF significantly improved the classification of disease phenotypes and disease pathway genes compared with support vector machines and Label Propagation in cross-validation on the annotated phenotypes and genes. The newly predicted phenotypes in each disease class are highly consistent with human phenotype ontology annotations. The roles of the new member genes in the disease pathways are examined and validated in the protein–protein interaction subnetworks. Extensive literature review also confirmed many new members of the disease classes and pathways as well as the predicted associations between disease phenotype classes and pathways.
INTRODUCTION
Phenotypes, the observable characteristics (traits) of an organism, are believed to be determined by genetic materials (DNAs) under environmental influences (1,2). The key to achieving desired phenotypes such as favorable disease treatment outcomes lies in the understanding of the relation between phenotypes and the biological roles of genes (3–5). In the past two decades, promising bio-technologies such as microarray-based profiling (6–9) and second generation sequencing (10,11) were developed to hunt for potential phenotype–gene associations. Currently, in the most comprehensive disease, phenotype–gene relation database, Online Mendelian Inheritance in Man (OMIM) (2), nearly 2000 confirmed relations between around 6000 phenotypes and over 12 000 genes are documented. This knowledge base provides a new phenome (the collection of all phenotypes) perspective to study human diseases and their molecular mechanisms. Although most previous studies focused on predicting new disease phenotype–gene relations with OMIM data (12–19), we propose to cluster phenotypes and find gene modules associated with the phenotype clusters by integrating OMIM phenotype–gene relations with disease phenotype similarity network and the human gene interaction network as well as exiting disease categorization and molecular pathways. To effectively use all the sources of information, we design regularized non–negative matrix tri-factorization (R-NMTF) algorithms to tri-factorize the binary matrix of phenotype–gene relations into phenotype clusters, gene clusters and an association matrix representing the associations between phenotype clusters and the gene clusters (Figure 1). Since the matrix of known phenotype–gene relations is very sparse, constraints constructed from the prior knowledge and the phenotype/gene labels are introduced to regularize the NMTF models.
Figure 1.

NMTF of disease phenotype–gene associations. The phenotype–gene association matrix X is factorized into products of three matrices, phenotype cluster membership F, gene cluster membership G and phenotype cluster–gene cluster association S for supervised co-clustering of phenotypes and genes. Label information for the disease classes and the pathways are available for a small number of phenotypes and genes. Prior knowledge is also introduced from phenotype similarity network and gene network. For better visualization, different colors are used to distinguish the phenotypes and the genes in different clusters.
Current classification of human disease is mainly based on observational correlation between pathological analysis and clinical syndromes (20), and more recently, by text mining of clinical records and synopsis (21). An accurate classification of human diseases based on its phenotypic and molecular basis will help to establish syndromic patterns for selecting phenotypes to consider in diagnosis. Existing phenotype clustering approaches cluster phenotypes based on only text descriptions and synopsis (22–24) or shared disease genes (25), which do not fully reflect both phenotypic and genetic basis of the disease phenotypes. R-NMTF integrates various sources of phenotypic and genomic data as well as prior knowledge to perform supervised co-clustering of phenotypes and genes simultaneously. R-NMTF is the first of its kind that effectively discovers disease classes based on the molecular underpinnings of the phenotypes and the molecular interactions in a network. This approach implements the philosophy of network-based medicine (26), which is believed to be the promising approach for generating the next generation of disease categorization (20). The R-NMTF-based co-clustering also naturally induces the associations between the phenotype clusters and gene clusters, which provides a global pathway activity view of human disease classes for understanding the unique as well as common underlying molecular mechanisms of diseases.
MATERIALS AND METHODS
In this section, we first describe the notations for the data of disease phenotypes, genes and their associations. We then review NMTF and introduce the framework of R-NMTF for co-clustering phenotypes and genes. We also outline the multiplicative update algorithm for solving the R-NMTF model.
Notations
The notations and definitions used in the article are specified in Table 1. We denote the OMIM phenotype–gene associations by a m by n binary matrix X with 1 for known associations and 0 otherwise. The objective is to derive phenotype clusters (F) and find their association (S) with gene clusters (G) based on X (Figure 1). F and G are non-negative matrices representing the soft memberships of each gene/phenotype against the k1 phenotype clusters or the k2 gene clusters. To perform more reliable phenotype clustering in a supervised setting, we use the partial phenotype annotations by (25) represented by a binary matrix F0 with 1 for the known class memberships. Similarly, KEGG pathways (27) are also included in a binary matrix G0 to guide gene clustering. Note that, since training samples are not required for each disease category to classify the phenotypes in the model, we use the word ‘co-clustering’ instead of ‘classification’ or ‘semi-supervised learning’ for the learning problem although in the experiments, we only focused on recovering the 21 disease categories with at least one OMIM disease phenotype. Finally, a phenotype similarity network M (21) and the gene interaction network N were also introduced to capture modular relations among phenotypes and genes. M and N contain edges weighted by the degree of similarity between phenotypes or the confidence of interaction between genes, respectively.
Table 1.
Notations
| Notation | Definition |
|---|---|
| m | Number of disease phenotypes |
| n | Number of genes |
| k1 | Number of phenotype clusters (e.g. classes) |
| k2 | Number of gene clusters (e.g. pathways) |
| X | Disease phenotype–gene association matrix (m × n) |
| F | Phenotype cluster membership (m × k1) |
| S | Phenotype cluster–gene cluster association Matrix (k1 × k2) |
| G | Gene cluster membership (n × k2) |
| F0 | Annotated phenotype cluster membership (m × k1) |
| G0 | Annotated gene cluster membership (n × k2) |
| M | Disease phenotype similarity network (m × m) |
| N | Gene interaction network (n × n) |
Non-negative matrix tri-factorization
Non-negative matrix factorization (NMF) was proposed by (28,29) as an alternative to principle component analysis and vector quantization for parts-based decomposition of a data matrix. NMF has been applied to solve various bioinformatics problems such as identifying gene clusters (30–32), bi-clustering (33) and identifying cancer tumor categories (34) in gene expression data analysis, and finding modules in protein–protein interaction (PPI) network (35).
By imposing the orthogonality on the two factorized matrices, (36) proposed a framework to perform NMTF as X ≃ FSGT under the constraints FTF = 1 and GTG = 1. This framework has the advantage of simultaneously clustering the columns and rows, and finding a condense representation of the data matrix by the row clusters and the column clusters, which can also be considered as associations between row clusters and column clusters. For co-clustering phenotypes and genes, the NMTF approach provides novel insights into the phenotype–gene associations beyond clustering and decomposition.
Regularization by phenotype and gene labels
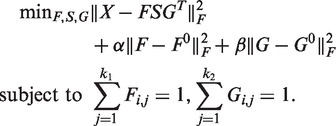
To cluster phenotypes and genes based on their associations, we adopt supervised NMTF proposed for finding associations between document clusters and word clusters in text categorization (37,38). We use manually labeled phenotype clusters as the phenotype label F0 and gene clusters from existing pathway database as the gene label G0, and simultaneously cluster phenotypes and genes with tri-factorization as illustrated in Figure 1. The following optimization framework can be solved to achieve the goal:
 |
(1) |
In equation (1), the first term is the NMTF of X, and the second and the third terms are the fitting penalties to keep the new cluster assignment consistent with the known phenotype and gene cluster labels. These two terms are introduced as a supervised way of minimizing the squared loss between the predicted phenotype cluster assignment F and the initial phenotype cluster assignment F0, and between the predicted gene cluster assignment G and the initial gene cluster assignment G0. Specifically, the phenotype clusters are taken from the 21 disease classes manually curated by (25), in which 872 disease phenotypes are assigned to 21 classes. The gene clusters are derived from the genes in KEGG pathways (27). The information of the labeled phenotypes and genes provides the useful guidance to learning more accurate co-clustering.
A limitation of the approach in equation (1) is the low coverage and the sparsity of the disease gene association matrix used to cluster phenotypes and genes. The known disease–gene association only cover a small fraction of phenotypes and genes (one-third of the phenotypes and 5% of the genes), with very few associations between them (less than one association per phenotype/gene). Moreover, the phenotype cluster annotations and KEGG pathways also only provide a low coverage of around 15% phenotypes and one-fourth of the genes. The statistics simply suggest that with this model only a very small fraction of phenotypes and genes could be clustered properly.
Regularization by graph Laplacians
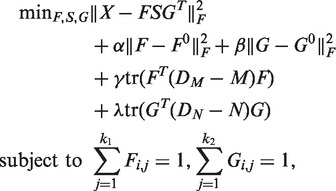
To address the above problem, we design R-NMTF to incorporate the prior knowledge in the phenotype similarity network and the PPI network (Figure 1) to cluster phenotypes and genes with matrix tri-factorization. Given the phenotype similar network M and the PPI network N, the following optimization problem is formulated for the purpose:
 |
(2) |
where DM is the diagonal matrix with the row summation of matrix M on the diagonal and DN is similarly defined from N. In this equation, the first three terms are identical to those in equation (1). The fourth and fifth terms introduce the phenotype similarity network and the PPI network as prior knowledge to guide the clustering of the phenotypes and the genes. These two terms are called smoothness terms, which encourage the connected nodes (phenotypes/genes) in a graph to be assigned to the same cluster. Specifically, the term tr(FT(DM − M) F) requires that the phenotype clusters identified by NMTF are also densely connected in the phenotype network, and similarly for tr(GT (DN − N)G). DM − M and DN − N are known as the Laplacian matrices of the graphs, which are positive semi-definite (39).
Algorithm 1 —
Regularized Non-negative Matrix Tri-factorization
INPUT: X, F0, G0, LM, LN, parameters α, β, γ, and λ, maximum interation T
OUTPUT: F, G, S
while not converged and t ≤ T do
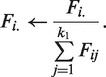
Update
.
Normalize
Update
.
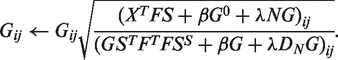
Normalize
.
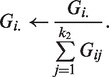
Compute
.
end while

Multiplicative update algorithms
We extend the optimization algorithms for the original NMTF to handle the four additional penalty terms in equation (2). The alternative iterative scheme to solve the problem with respect to one variable while fixing the other variables are described.
Computation of F
If we fix variables S and G, solving equation (2) with respect to F is equivalent to minimizing the following function:
subject to 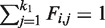 , where LM is DM − M.
The differentiation of L with respect to F is
The multiplicative update rule is
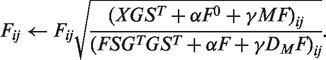 |
To satisfy the equality constrain, we normalize F as
 |
Computation of G
If we fix variables S and F, solving equation (2) with respect to G is equivalent to minimizing the function,
subject to 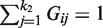 , where LN is DN − N.
The differentiation of L with respect to G is
The multiplicative update rule is
 |
To satisfy the equality constrain, we normalize G as
 |
Computation of S
After F and G are computed, solving equation (2) with respect to S is equivalent to minimizing the following function:
The differentiation of L with respect to S is
The multiplicative update rule is
 |
The complete R-NMTF algorithm is outlined in Algorithm 1. Since the updating steps for F, S and G are non-increasing, the objective function will decrease until a lower bound is reached. Empirically, the algorithm converges fast within 100 iterations in the experiments.
EXPERIMENTS
To evaluate the performance of supervised co-clustering of phenotypes and genes, R-NMTF was applied to classifying OMIM human disease phenotypes and KEGG disease pathway genes with leave-one-out cross-validation. R-NMTF was compared with several baseline methods, including support vector machines (SVMs), Label Propagation (LP) and a NMTF model without network regularization defined in equation (1). R-NMTF was then applied to classify unannotated OMIM disease phenotypes and identify new member genes of KEGG disease pathways. The predictions were verified and analyzed by comparison with human phenotype ontology (HPO) and literature survey.
Data preparation
We collected the disease phenotype–gene associations in OMIM, which consist of the associations between 1284 disease phenotypes and 1777 disease genes. We also collected 200 KEGG pathways, which contain 4128 genes in total, from molecular signature database (40). We obtained the human protein-protein interaction (PPI) network from HPRD (41). The PPI network contains 76232 binary undirected interactions between 9667 genes. We obtained the phenotype similarity network from (21). The phenotype similarity network is an undirected graph with 5080 vertices representing OMIM disease phenotypes, and edges weighted by a number in [0,1]. The edge weights measure the similarity between phenotypes by their overlap in the text and the clinical synopsis in OMIM records, calculated by text mining (21).
In the leave-one-out cross-validation, after preprocessing (removing the phenotypes classified as multiple and unclassified, removing disease phenotypes not present in both the disease phenotype–gene associations and the phenotype similarity network and removing genes not present in both the disease phenotype–gene associations and the PPI network), we generated a dataset containing 590 disease phenotypes in 20 disease classes (25) and 7997 genes in 200 gene pathways. This dataset was used in leave-one-out cross-validation on disease phenotype classification and disease pathway gene discovery.
To further evaluate R-NMTF with more phenotypes and other independent phenotype annotations, we generated another larger dataset containing 1325 disease phenotypes with at least one known causal gene in OMIM. Among the 1325 disease phenotypes, 501 disease phenotypes intersect with the labeled disease phenotypes in the first dataset and the rest 824 disease phenotypes are unlabeled. Our task in this experiment is to perform a supervised clustering to assign the 824 unannotated disease phenotypes to the 20 disease classes.
Baselines and parameter tuning
Four baselines were introduced for comparison with R-NMTF, SVMs with linear kernel and radial basis kernel, LP and the NMTF model defined in equation (1) without the prior knowledge from the phenotype network and the PPI network (named NMTF). The SVMs used a binary vector representing the disease genes of each phenotype as the features for classification (25). We also tested SVMs with the similarity scores in the phenotype similarities network as features for classification. Since the results are close to random, we did not report them in the experiments. We also compared R-NMTF with a semi-supervised learning method, LP, which uses the disease similarity network and the PPI network for disease phenotype classification and disease gene discovery, respectively (42). The hyper-parameters (α and β for NMTF; α, β, γ and λ for R-NMTF and C and σ for SVMs) were chosen by a grid search in {10−3, 10−2, 10−1, 1, 10, 100}. The hyper-parameter α for LP was chosen by a grid search in {0.1, 0.3, 0.5, 0.7, 0.9}. More analysis of parameter tuning is described in the supplementary Table S1 and S2.
In the leave-one-out cross-validation on the 590 labeled phenotypes in disease phenotype classification, we held out one phenotype as the test case to be classified by all the compared methods. The performance is measured by the rank of the true disease class among the 20 target classes ranked by the corresponding classification scores generated by a classification method. Similarly, in the leave-one-out cross-validation for disease gene discovery on the same data, we held out one gene in a KEGG disease pathway as the test case to be classified by all the compared methods. Since one gene could belong to multiple disease pathways, the performance is measured by the area under the curve of receiver operating characteristic (AUC). Since leave-one-out cross-validation usually gives less overfitting bias, we reported the results with the best parameters for all the methods in the experiments on both disease phenotype classification and disease gene discovery.
Performance of disease phenotype classification in leave-one-out cross-validation
The average ranking performance of the compared methods are reported in Table 2 and Figure 2. On average, R-NMTF were able to rank the target class at around third out of the 20 classes, while the other methods performed worse. To further assess the statistical significance of the difference in the performance between R-NMTF and the baselines, we also report the pairwise comparison of each test case and performed a Wilconsin test on the difference of the ranks in Table 2. The P-values suggest that R-NMTF performed significantly better than the baselines. Supplementary Figure S1 visualizes the pairwise comparison between R-NMTF and the baselines by scatter plot. Many more cases appeared in the top left triangle indicating a better ranking by R-NMTF. LP performed worse than R-NMTF but better than SVMs and NMTF. The observation indicates that the global structural information in the phenotype similarity network provides substantial information on phenotype classes. To further understand the classification performance in each disease class, we show in Table 3 the classification performance for the phenotypes by disease classes. R-NMTF outperformed all the baseline methods in 11 disease classes. In some of the small classes such as ‘ear, nose, throat’, ‘nutritional’ and ‘respiratory’, less relations among the training points are available for R-NMTF to improve classification.
Table 2.
Performance of phenotype classification in leave-one-out cross-validation
| Compared methods | Avg. rank | win/draw/loss (P-value) |
|---|---|---|
| R-NMTF versus NMTF | 3.124 versus 5.590 | 300/154/136 (4.617e−13) |
| versus SVM-linear | versus 6.103 | 308/154/128 (3.693e−12) |
| versus SVM-rbf | versus 5.037 | 268/213/109 (1.497e−4) |
| versus LP | versus 3.700 | 161/388/41 (9.145e−05) |
This table reports the average rank of the target class out of the 20 classes, and the pairwise ‘win/draw/loss’ comparisons of each leave-one-out case between R-NMTF and the baselines, SVMs with linear and rbf kernels, NMTF and LP. The last column reports the statistical significance of the ranking results using Wilcoxon rank sum test.
Figure 2.

Performance of phenotype classification in leave-one-out cross-validation. In this plot, the x-axis represents the cutoffs of the rank of the target disease class out of the 20 classes. The y-axis represents the faction of phenotypes with their target disease class ranked within a certain cutoff. For example, R-NMTF ranked the target class of >60% of the phenotypes within Rank 2, while the other methods only ranked around or <50% within the same rank cutoff.
Table 3.
Disease phenotype classification results by disease classes
| Disease classes (No) | Avg. rank |
||||
|---|---|---|---|---|---|
| R-NMTF | NMTF | SVM- linear | SVM-rbf | LP | |
| Bone (23) | 3.3 | 8.5 | 4.7 | 7.6 | 4.7 |
| Cancer (53) | 1.6 | 5.0 | 4.2 | 2.0 | 1.9 |
| Cardiovascular (28) | 3.8 | 10.1 | 10.0 | 6.0 | 4.3 |
| Connective tissue (16) | 8.5 | 8.9 | 10.6 | 11.4 | 11.1 |
| Dermatological (32) | 2.0 | 4.4 | 3.0 | 4.0 | 2.5 |
| Developmental (28) | 5.7 | 2.5 | 9.6 | 9.2 | 6.5 |
| Ear,Nose,Throat (3) | 20.0 | 20.0 | 14.7 | 15.0 | 16.7 |
| Endocrine (30) | 4.2 | 5.4 | 13.4 | 5.4 | 4.9 |
| Gastrointestinal (12) | 9.7 | 7.8 | 7.8 | 9.7 | 11.7 |
| Hematological (30) | 3.5 | 9.5 | 2.3 | 6.9 | 3.8 |
| Immunological (31) | 2.6 | 10.0 | 8.1 | 5.2 | 2.8 |
| Metabolic (84) | 1.0 | 2.2 | 4.1 | 2.2 | 1.0 |
| Muscular (18) | 5.7 | 5.3 | 12.2 | 9.1 | 7. 3 |
| Neurological (80) | 1.4 | 6.2 | 5.8 | 2.7 | 1.4 |
| Nutritional (2) | 16.0 | 3.0 | 19.0 | 2.0 | 20 |
| Ophthamological (35) | 1.9 | 4.2 | 2.5 | 2.9 | 2.5 |
| Psychiatric (9) | 7.9 | 6.1 | 8.0 | 11.4 | 14.8 |
| Renal (23) | 4.1 | 3.5 | 4.4 | 6.8 | 4.9 |
| Respiratory (7) | 15.4 | 10.4 | 10.4 | 14.1 | 15.7 |
| Skeletal (46) | 1.5 | 3.3 | 4.8 | 5.2 | 1.8 |
This table reports the ranking performance by R-NMTF, SVM with linear and rbf kernels, NMTF and LP in each disease class in the leave-one-out cross-validation. The number of phenotypes in each disease class is reported in the parentheses.
Performance of disease gene discovery in leave-one-out cross-validation
In the experiment of disease gene discovery, we collected the member genes in the 200 pathways from KEGG. In the preprocessed data, there are 590 member genes in 27 KEGG disease pathways such as Alzheimer, diabetes and cancer-related pathways. In the leave-one-out cross-validation, each of the 590 member gene was held out and then classified into the 200 pathways as a multi-label classification problem since some of the disease genes are members of multiple pathways. The higher the target pathways in the ranking of the 200 pathways, the better the performance. We measured the performance by the AUC. LP was applied on the PPI network to predict the disease genes as the baseline. The other 589 member genes was used as the initialization of label propagations to classify the held-out gene. The average AUC across the 590 member genes by all the methods are reported in Table 4 and Figure 3. The results clearly show that by integration of phenotype similarity, phenotype class annotation and phenotype–gene associations with PPI network R-NMTF more accurately classified the disease genes compared with LP, which only uses the PPI network for disease gene discovery. R-NMTF performed better on >500 cases with an average AUC 0.930 compared with 0.73 by LP.
Table 4.
Performance of disease gene discovery in leave-one-out cross-validation
| Compared methods | Avg. AUC | win/draw/loss (P-value) |
|---|---|---|
| R-NMTF versus LP | 0.930 versus 0.730 | 526/1/63 (5.4482e−113) |
This table reports the average AUC for disease gene classification, and the pairwise ‘win/draw/loss’ comparisons of each leave-one-out case between R-NMTF and LP. The last column reports the statistical significance of ranking results using Wilcoxon rank sum test.
Figure 3.
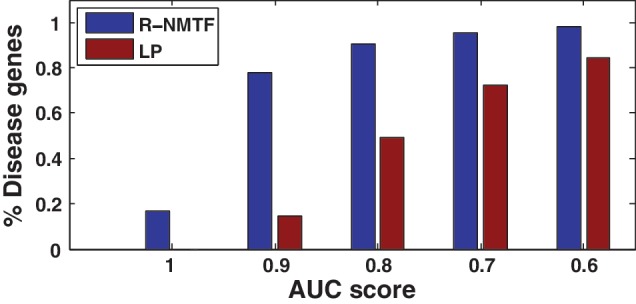
Performance of disease gene discovery in leave-one-out cross-validation. In the plot, the x-axis represents AUC cutoffs. The y-axis represents the faction of disease genes with a AUC score above the cutoffs. For example, R-NMTF achieved AUCs above 0.9 for >80% of the genes, while LP only achieved the same level of AUC for 20% of the genes.
Analysis of phenotype clusters with HPO
To bette characterize the discovered phenotype clusters for the 824 unannotated disease phenotypes, we compared the phenotype clusters with HPO (43). HPO describes human phenomic abnormalities with a controlled hierarchical vocabulary. Since the vocabulary in the HPO was developed independently of the disease classification by (25), it is an external resources for the validation of the phenotype clusters discovered by R-NMTF. Each OMIM phenotype was mapped to the hierarchy of HPO to retrieve the matched HPO terms. Then, a new HPO similarity is calculated for each pair of phenotypes by Jaccard similarity coefficient
where P1 and P2 are the set of the matched HPO terms of the two phenotypes, respectively. We arranged the phenotypes into the 20 disease classes (clusters) based on the R-NMTF clustering, and show their HPO similarity by a heat map in Figure 4. There are clearly block structures among the predicted 20 clusters. Most of the phenotypes in the same cluster also share strong HPO similarity. The consistency between the predicted disease clusters and HPO similarities suggest that R-NMTF produced a phenotype clustering supported by HPO annotations. Another interesting observation is that there are also strong HPO similarities between different clusters (i.e. different disease classes share HPO similarities). This may imply that some of the disease classes may share common molecular mechanisms such as skeletal diseases and developmental diseases.
Figure 4.

HPO phenotype similarities by clusters. The HPO similarity matrix of the phenotypes are display as a heap map. The phenotypes are grouped into 20 clusters with the disease classes annotated below.
Analysis of new phenotypes in disease classes
Table 5 lists the newly predicted disease phenotypes in the 20 disease classes. Our survey identified supporting literatures for many of the predictions. One interesting finding is faconi anemia (FA) (OMIM:227650), a rare, inherited blood disorder, predicted as a cancer-related disease. Surprisingly, a recent study found that FA could share a common pathogenesis with diseases related with chromosomal instability including cancers, and suggested a possible use of cancer treatment for patients with FA (48). R-NMTF also predicted Proteus syndrome (OMIM:176920) as a cancer-related disease. PTEN, a well-known tumor suppressor gene, is a known causative gene for Proteus syndrome, which may indicate that cancer risk accompanying Proteus syndrome could be increased (49–52). Other interesting newly predicted disease phenotypes are Amyotrophic lateral sclerosis (ALS) (OMIM:105400), also known as Lou Gehrig's disease in neurological disease class, and Gambling, pathologic (OMIM:606349) in psychiatric disease class. ALS is a disease of the nerve cells in the brain and causes unstable muscle movement and Gambling, pathologic is a disabling disorder to fail to resist impulses to gamble, known for frequently co-occur with other psychiatric disorders (85,86). R-NMTF also accurately predicted a few disease phenotypes including juvenile myelomonocytic leukemia and breast cancer which were previously missed in the annotation of the cancer disease class (25). These findings suggest that R-NMTF could correctly classify complex and rare disease phenotypes into their relevant disease classes, which could be used to guide clinical decisions.
Table 5.
New disease phenotypes in 20 disease classes
| Disease classes | New disease phenotypes | ||||
|---|---|---|---|---|---|
| Bone | Achondrogenesis, Type III (44) | Canine Teeth (Omim:114600) | Dens Evaginatus (45) | Dental Noneruption (46) | Dentin Dysplasia, Type I(47) |
| Cancer | Fanconi Anemia (48) | Juvenile Myelomonocytic Leukemia | Breast Cancer | Proteus Syndrome (49,50,51,52) | Bannayan-Riley-Ruvalcaba Syndrome (53,54) |
| Cardiovascular | Cardiomyopathy (Omim:192600) | Atrial Standstill (55) | Cardiomyopathy, Dilated, 1E | Long Qt Syndrome 3 (56,57) | Sudden Infant Death Syndrome (58) |
| Connective tissue | Arthritis, Sacroiliac (59) | Spondyloarthropathy (Omim:183840) | Slipped Femoral Capital Epiphyses (60) | Facial Asymmetry (61) | Cervical Rib |
| Dermatological | Deafness; Dfna3 (62) | Epidermolysis Bullosa (Omim:131800) | Pachyonychia Congenita, Type 1 (63) | Epidermolysis Bullosa Herpetiformis (64) | Epidermolysis Bullosa Simplex, Koebner Type (64) |
| Developmental | Leucine Transport, High | Uterine Anomalies (65) | Testes, Rudimentary (66) | Oligosynaptic Infertility | Hypospadias, Autosomal (67) |
| Ear,Nose,Throat | Otosclerosis 3 (68) | Otosclerosis 2 (68) | Otosclerosis 5 (68) | Periodontitis, Aggressive, 2 | Red Cell Permeability Defect |
| Endocrine | Diabetes Mellitus | Hypoglycemia (Omim:601820) (69) | Polycystic Ovary Syndrome 1 (70) | Diabetes Mellitus, Transient Neonatal | Goiter, Multinodular 2 (71) |
| Gastrointestinal | Cholestasis2 (Omim:605479) (72) | Bile Acid, Synthetic Defect Of | Cholestasis; Pfic2 (Omim:601847) (72) | Cholestasis; Pfic3 (Omim:602347) (72) | Pancreatitis, Hereditary (73) |
| Hematological | Anemia (74) | Hyperheparinemia | Sideroblastic Anemia, Autosomal (75) | Platelet Groups–ko System | Anemia, Familial Pyridoxine-Responsive (76) |
| Immunological | Herpesvirus Sensitivity (77) | Interleukin (Omim:243110) (78) | Panbronchiolitis, Diffuse (79) | Immune Deficiency Disease | Allergic Bronchopulmonary Aspergillosis (80) |
| Metabolic | Immunoglobulin D Level In Plasma | Magnesium, Elevated Red Cell | Flood Factor Deficiency | Citrulline Transport Defect | Amobarbital, Deficient N-Hydroxylation of |
| Muscular | Palmomental Reflex | Myopathy (Omim:255100) | Muscular Hypoplasia | Pleoconial Myopathy With Salt Craving | Myopathy, Congenital |
| Neurological | Amyotrophic Lateral Sclerosis 1 | Amyotrophic Lateral Sclerosis 2 | Alzheimer Disease 2 | Prion Disease (Omim:603218) | Frontotemporal Dementia (Omim:607485) |
| Nutritional | Bulimia Nervosa | Red Cell Permeability Defect | Labia Minora (Omim:149600) (81) | Schizophrenia 9 (82) | Amyotrophic Lateral Sclerosis 6 (83) |
| Ophthamological | Cone Dystrophy 3 | Cone-Rod Dystrophy 3 | Leber Congenital Amaurosis | Cone-Rod Dystrophy 6 | Retinitis Pigmentosa 19 |
| Psychiatric | Fg Syndrome 2 (86) | Fg Syndrome 3 (84) | Schizophrenia 5 | Cerebral Angiopathy, Dysphoric (85,86) | Gambling, Pathologic |
| Renal | Nephrotic Syndrome, Type 2 (87,88) | Hypertensive Nephropathy (89) | Enuresis, Nocturnal, 2 (90) | Enuresis, Nocturnal, 1 (90) | Blue Diaper Syndrome |
| Respiratory | Hemangiomatosis | Respiratory Underresponsiveness | Emphysema (Omim:130700) | Asthma, Short Stature, and Elevated Iga | Asthma-Related Traits, Susceptibility To, 1 |
| Skeletal | Brachydactyly, Mononen Type | Tibial Hemimelia (91) | Acropectoral Syndrome | Syndactyly, Type IV | Spondyloepimetaphyseal Dysplasia, Irapa Type |
The 5 most confident predictions of phenotypes in each disease class are reported.
Analysis of new member genes in disease pathways
KEGG provides a list of manually curated disease pathways. However, the current knowledge of biological pathways related with diseases is still incomplete and inaccurate, and there are many missing member genes in the disease-related pathways. Table 6 lists the newly predicted member genes in the KEGG disease pathways. Our literature review also identified supporting evidences for many of the predictions. Interesting examples include TMED10 and PRND, which are newly predicted member genes in Alzheimer's pathway and Prion disease pathway, respectively. TMED10 inhibits production of amyloid beta peptides, which is a critical feature of Alzheimers disease and RPND (prion protein 2) is known for that mutations in this gene may lead to neurological disorders. Other examples include EXO1 and ADIPOR1 in colorectal cancer pathway and FGFR3 and FGFR4 in melanoma pathway. Single nucleotide polymorphisms in EXO1 increases risk of colorectal cancer (106,107), and expression of ADIPOR1 is known for involving cancer progression in colorectal cancer (108,109). Mutations in FGFR3 and FGFR4 were previously described in melanoma (121).
Table 6.
New member genes of KEGG disease pathways
| Kegg disease pathways | New member genes | |||||||||
|---|---|---|---|---|---|---|---|---|---|---|
| Hsa04930: Type II Diabetes Mellitus | KCNJ8 (92) | EFHC1 | ADIPOR2 (93) | ABCC9 | LDHA | CDH13 (94) | ENSA | CRYBB1 | CASR | KCNJ2 |
| Hsa04940: Type I Diabetes Mellitus | CKAP5 | SPTBN4 | PTPRT | SNX19 | CD74 | LILRB1 (95) | LILRB2 | GAST | LRRC23 | CTLA4 (96) |
| Hsa04950: Maturity Onset Diabetes of the Young | OLIG2 | EN2 | PCSK1 | PNRC1 | PCSK2 | GATA5 | GATA6 | PNRC2 | OTX2 | RAMP2 |
| Hsa05010: Alzheimers Disease | TMED10 (97) | BRI3 | PTX3 | APH1B (98) | TFCP2 (99) | HRG | C1R | FKBP2 | KHSRP | NEDD8 (100) |
| Hsa05020: Parkinsons Disease | ARIH1 (101) | AMFR | AGXT | TRIM25 | CCNB1IP1 | GAN | TMCC2 | STUB1 | SH2D3C | SLC6A1 |
| Hsa05030: ALS | SSR3 | JUB | ALS2CL (102) | APBA1 | MTMR2 | ABL2 | HOXB2 | RAB37 | PKN1 (103) | CHML |
| Hsa05040: Huntingtons Disease | HIP1R (104) | SNX5 | IFT20 | PICALM | RPS10 | PQBP1 | NECAP1 | ARF1 | KPNA4 | MBTPS1 |
| Hsa05050: Dentatorubropallidoluysian Atrophy | ALG13 | TRIM22 | CLCN5 | ECM1 | MYST3 | NET1 | SYNPO | EFEMP1 | CPSF6 | NDFIP2 |
| Hsa05060: Prion Disease | PRND (106) | CHD6 | LAMA2 | RPS21 | EIF2AK3 | KEAP1 | ADAM23 | DPP6 | MOG | OPCML |
| Hsa05110: Cholera Infection | SERP1 | SEC63 | ARFIP2 | APOB | ARFIP1 | PIP5K1A | FLAD1 | TRAM1 | ETHE1 | AP1B1 |
| Hsa05120: Epithelial Cell Signaling in Helicobacter Pylori Infection | GRLF1 | ETHE1 | HBA1 | EFNA2 | TOMM34 | DARC | ADD2 | SH3D19 | PFKM | ANG |
| Hsa05130: Pathogenic Escherichia Coli Infection Ehec | ARPC4 | GRM7 | HS1BP3 | CGN | PLA2G7 | KIAA1543 | LAPTM4A | NOX4 | ACTR2 | SSB |
| Hsa05210: Colorectal Cancer | EXO1 (106,107) | ADIPOR1 (108,109) | MUTYH (111) | PMS2 | CDCA8 | ROR2 | PMS1 | MAZ | WNT5A | WNT7A |
| Hsa05211: Renal Cell Carcinoma | HIF3A | OS9 | EGLN2 | ING4 | ARNTL2 | SIM1 | ASB8 | LRRC41 | SENP6 | SIM2 |
| Hsa05212: Pancreatic Cancer | REPS1 | REPS2 | PLCD1 | SHFM1 | EXOC1 | RAD51AP1 | RAD54L | RALGPS1 | EXOC5 | EXOC3 |
| Hsa05213: Endometrial Cancer | MSR1 | BRCA2 (112) | NF1 | MXI1 (113) | RNASEL | FH | MSH2 | ELAC2 | MAD1L1 | CHEK2 |
| Hsa05214: Glioma | PDAP1 | KIAA1683 | RHBDF1 | RPS18 | ART1 | BRD2 | NKD2 | MYO10 | TFDP2 | SETD8 |
| Hsa05215: Prostate Cancer | KRT27 | MTTP | ATF6 (114) | PTHLH (115) | SEMG1 | ATF2 (116) | G6PC | NFIL3 (117) | ASGR1 | MALL |
| Hsa05216: Thyroid Cancer | TSSK2 | TMOD2 | RNF14 | TRIM25 | PPP4C | IFI16 | CNN1 | TMOD1 | S100A2 | NUP98 |
| Hsa05217: Basal Cell Carcinoma | IHH | DHH | ZIC1 | ZIC2 | PORCN | SFRP1 | ROR2 | FRMPD4 | GPC3 | GAS1 |
| Hsa05218: Melanoma | FGFR4 (118) | FGFR2 (119) | PHEX | FGFR3 (120,121) | SCN8A | EBNA1BP2 | RPS2 | MAPK8IP2 | TFEB | PDAP1 |
| Hsa05219: Bladder Cancer | MLC1 | UNC5B (122) | UNC5A | PAWR | AATF | TNXB | CAMK2A | RECK | HIST3H2A | ATF4 (123) |
| Hsa05220: Chronic Myeloid Leukemia | APBA3 | MAP4K5 (124) | BAZ2B | KLF3 | TDGF1 | MAPK4 | FMOD | RAI2 | ELF2 | SPRY2 (125) |
| Hsa05221 Acute Myeloid Leukemia | RPL21 | NDUFB8 (126) | FBXO18 | GATA2 (127) | CEBPD (128) | GFI1 (129) | TAF9B | MYST3 (130) | CBFA2T3 | NFATC1 |
| Hsa05222: Small Cell Lung Cancer | CKS2 | BCKDK | TBC1D8 | TNFRSF19 | DUSP1 | TNFRSF4 | TNFRSF12A | NGFRAP1 | LTBR | MAP6 |
| Hsa05223: Non Small Cell Lung Cancer | FDXR (131) | LATS1 (132) | MAP6 | NR1H2 (133) | PRKRIR | CSN1S1 | NR1H3 | CNKSR1 | FOXG1 (134) | PNRC1 |
The 10 most confident predictions of member genes in KEGG disease pathways are reported.
We also provide a network view of three examples of disease pathways with addition of the newly predicted member genes in Figure 5. These examples demonstrate that, while KEGG disease pathways were manually curated, there are still missing member genes in the pathways. One example is WNT5A, a newly predicted member gene in the colorectal cancer pathway in Figure 5A. Recent study showed that WNT5A is a potential biomarker for colorectal cancer and could act as tumor suppressor for colorectal cancer by antagonizing the WNT signaling pathway (135). Another example is FGFR3 gene, the newly predicted member gene in the melanoma pathway, in Figure 5B. It has been shown that mutation and overexpression in FGFR3 are associated with survival of melanoma patients (136). However, FGFR3 was not annotated in the melanoma pathway although it is interacting with several members in the pathway. The network views of all the 27 expanded KEGG disease pathways with newly predicted member genes are available at the article's Supplementary Web. These results support that R-NMTF correctly predicted new member genes in several disease-related pathways, and these novel disease genes could play important roles in the disease pathways.
Figure 5.

PPI subnetworks of the extended disease pathways. In each pathway, gray nodes are known member genes in the disease pathways and red nodes are newly predicted member genes. Edges represent PPI between two genes. Note that if a known or a newly predicted member gene is not interacting with any other member genes in the pathway, the gene is not included. (A) Colorectal cancer pathway. The predicted colorectal cancer genes EXO1 and ADIPOR1 are interacting with many other genes in the colorectal cancer pathway. (B) Alzheimer pathway. Over-expression of C1R is known for involving alzheimer disease. (C) Melanoma pathway. Mutation and copy number changes in new member gene FGFR3 were recently discovered in melanoma.
Analysis of predicted disease phenotype cluster–gene cluster associations
We evaluated the predicted disease phenotype cluster–gene cluster associations by a literature survey. We performed two-way hierarchical clustering for the predicted disease phenotype cluster–gene cluster associations. Figure 6 shows the predicted associations between 20 disease phenotype clusters and 200 gene clusters (pathways). Interesting examples are the manually curated KEGG disease pathways. These disease-related pathways include pathways related to cancers, neurological diseases and psychiatric diseases. R-NMTF accurately predicted association between many of these disease-related pathways to the related disease classes. For example, many cancer-related pathways including colorectal, pancreatic, bladder, non-small cell lung, glioma and prostate cancer were correctly identified as cancer pathways. We also identified a set of biological pathways such as apoptosis, p53 signaling and ERBB signaling, hedgehog signaling which are previously known to contribute to tumorigenesis, as well as targets of many anti-cancer drugs (137–141). Other interesting examples are the pathways predicted to be associated to neurological and psychiatric disease classes. Prion disease is one of the well-known rare progressive neurodegenerative disorders that affect both humans and animals. R-NMTF accurately predicted the prion disease pathway as one of the pathways associated with neurological disease class. MAPK pathway is predicted to be associated with both neurological and psychiatric disease classes. Recent study reported that activation of MAPK pathway could play a role in alzheimer and psychiatric disorders such as increasing anxiety and depression and schizophrenia etc. (142,143). R-NMTF also correctly predicted Huntington's disease pathway to be associated with neurological and psychiatric diseases.
Figure 6.

Predicted associations between disease classes and pathways. Each red entry represents a predicted association between 20 disease classes and 200 KEGG pathways.
DISCUSSION
The number of documented disease phenotypes and phenotype–gene associations increases quickly. Since 2007, the number of OMIM disease–gene associations is nearly doubled. These determined associations provide valuable resources not only for predicting novel associations but also for understanding disease phenotypes. Our research work in the article explored this possibility and reported promising results. Recently, phenotype databases have been proposed and in the progress of becoming comprehensive and systematic for many species. R-NMTF will be a useful model for analyzing the new ‘phenomes’. Moreover, R-NMTF also identifies pathways associated with disease phenotype clusters. Since many drugs are developed to target proteins that act in disease-related pathways, precise identification of members of disease pathways could accelerate the development of more efficient targeted therapies, as well as improve understanding of the molecular mechanisms underlying complex human diseases. More recently, cross-species phenotype–gene association analysis based on ortholog genes and similar phenotypes has been performed (144). An interesting future direction is to extend R-NMTF to perform cross-species phenome–genome co-clustering. It is also possible to apply other advanced machine learning models to integrate the phenotype similarity network and the PPI network with phenotype–gene association data for co-clustering phenotypes and genes. More refined modeling might lead to further improvement in phenotype classification and disease–gene discovery.
Previously, regularized NMTF models were only proposed for applications in image and document classification. Gu and Zhou (145) introduced a dual regularized co-clustering (DRCC), which extended NMTF by incorporating the graph Laplacian as additional regularizations in the objective function. DRCC was applied to classify images, documents and newsgroups. Zh vang et al. (38) introduced a matrix tri-factorization-based classification framework (MTrick) for transfer learning. MTrick first learns an association matrix from source domain by performing non-negative tri-factorization and use incorporates inferred association matrix S from source domain into non-negative tri-factorization for target domain classification. R-NMTF introduces regularization terms for label information from both phenotype and gene clusters, and thus R-NMTF is a supervised co-clustering method while DRCC is unsupervised. Compared with MTrick, which only uses label information, R-NMTF incorporates the prior knowledge in phenotype similarity network and PPI networks to cluster phenotypes and genes with tri-matrix factorization. To our best knowledge, no previous NMF-based model has been applied to clustering phenotypes or analyzing disease phenotype–gene associations. R-NMTF is an advanced model which integrates phenome, genome and interactome information for both problems.
SUPPLEMENTARY DATA
Supplementary Data are available at NAR Online: Supplementary Tables 1 and 2 and Supplementary Figure 1.
FUNDING
Funding for open access charge: National Science Foundation [III-1117153].
Conflict of interest statement. None declared.
Supplementary Material
REFERENCES
- 1.McKusick V. Mendelian Inheritance in Man and its online version, OMIM. Am. J. Hum. Genet. 2007;80:588–604. doi: 10.1086/514346. [DOI] [PMC free article] [PubMed] [Google Scholar]
- 2.Groth P, Weiss B. Phenotype Data: a Neglected Resource in Biomedical Research? Curr. Bioinformatics. 2006;1:347–358. [Google Scholar]
- 3.Sawyers C. The cancer biomarker problem. Nature. 2008;452:548–552. doi: 10.1038/nature06913. [DOI] [PubMed] [Google Scholar]
- 4.Rubin E. Genomics of cellulosic biofuels. Nature. 2008;454:841–845. doi: 10.1038/nature07190. [DOI] [PubMed] [Google Scholar]
- 5.Edwards D, Batley J. Plant bioinformatics: from genome to phenome. Trends Biotechnol. 2004;22:232–237. doi: 10.1016/j.tibtech.2004.03.002. [DOI] [PubMed] [Google Scholar]
- 6. The Wellcome Trust Case Control Consortium. (2007) Genome-wide association study of 14,000 cases of seven common diseases and 3,000 shared controls. Nature, 447, 661–678. [DOI] [PMC free article] [PubMed] [Google Scholar]
- 7.van't Veer L, Bernards R. Enabling personalized cancer medicine through analysis of gene-expression patterns. Nature. 2008;452:564–570. doi: 10.1038/nature06915. [DOI] [PubMed] [Google Scholar]
- 8.Johnson A, O'Donnell C. An open access database of genome-wide association resutls. BMC Med. Gent. 2009;6 doi: 10.1186/1471-2350-10-6. [DOI] [PMC free article] [PubMed] [Google Scholar]
- 9.Shlien A, Malkin D. Copy number variations and cancer. Genome Med. 2009;1:62. doi: 10.1186/gm62. [DOI] [PMC free article] [PubMed] [Google Scholar]
- 10.Shendure J, Ji H. Next-generation DNA sequencing. Nat. Biotech. 2008;26:1135–1145. doi: 10.1038/nbt1486. [DOI] [PubMed] [Google Scholar]
- 11.Rothberg J, Leamon J. The development and impact of 454 sequencing. Nat. Biotechnol. 2008;26:1117–1124. doi: 10.1038/nbt1485. [DOI] [PubMed] [Google Scholar]
- 12.Franke L, van Bakel H, Fokkens L, de Jong E, Egmont-Petersen M, Wijmenga C. Reconstruction of a functional human gene network, with an application for prioritizing positional candidate genes. Am. J. Hum. Genet. 2006;78:1011–1025. doi: 10.1086/504300. [DOI] [PMC free article] [PubMed] [Google Scholar]
- 13.Kohler S, Bauer S, Horn D, Robinson P. Walking the interactome for prioritization of candidate disease genes. Am. J. Hum. Genet. 2008;82:949–958. doi: 10.1016/j.ajhg.2008.02.013. [DOI] [PMC free article] [PubMed] [Google Scholar]
- 14.Wu X, Jiang R, Zhang M, Li S. Network-based global inference of human disease genes. Mol. Syst. Biol. 2008;4:189. doi: 10.1038/msb.2008.27. [DOI] [PMC free article] [PubMed] [Google Scholar]
- 15.Linghu B, Snitkin E, Hu Z, Xia Y, Delisi C. Genome-wide prioritization of disease genes and identification of disease–disease associations from an integrated human functional linkage network. Genome Biol. 2009;10:R91. doi: 10.1186/gb-2009-10-9-r91. [DOI] [PMC free article] [PubMed] [Google Scholar]
- 16.Hwang T, Kuang R. Proc of SIAM International Conference on Data Mining. 2010. A Heterogeneous Label Propagation Algorithm for Disease Gene Discovery; pp. 583–594. [Google Scholar]
- 17.Vanunu O, Magger O, Ruppin E, Shlomi T, Sharan R. Associating genes and protein complexes with disease via network propagation. PLoS Comput. Biol. 2010;6:e1000641. doi: 10.1371/journal.pcbi.1000641. [DOI] [PMC free article] [PubMed] [Google Scholar]
- 18.Li Y, Patra J. Genome-wide inferring gene–phenotype relationship by walking on the heterogeneous network. Bioinformatics. 2010;26:1219–1224. doi: 10.1093/bioinformatics/btq108. [DOI] [PubMed] [Google Scholar]
- 19.Navlakha S, Kingsford C. The power of protein interaction networks for associating genes with diseases. Bioinformatics. 2010;26:1057–1063. doi: 10.1093/bioinformatics/btq076. [DOI] [PMC free article] [PubMed] [Google Scholar]
- 20.Loscalzo J, Kohane I, Barabasi A. Human disease classification in the postgenomic era: a complex systems approach to human pathobiology. Mol. Syst. Biol. 2007;3:124. doi: 10.1038/msb4100163. [DOI] [PMC free article] [PubMed] [Google Scholar]
- 21.van Driel M, Bruggeman J, Vriend G, Brunner H, Leunissen J. A text-mining analysis of the human phenome. Eur. J. Hum. Genet. 2006;14:535–542. doi: 10.1038/sj.ejhg.5201585. [DOI] [PubMed] [Google Scholar]
- 22.Freimer N, Sabatti C. The human phenome project. Nat. Genet. 2003;34:15–21. doi: 10.1038/ng0503-15. [DOI] [PubMed] [Google Scholar]
- 23.Scriver C. After the genome–the phenome? J. Inherit. Metab. Dis. 2004;27:305–317. doi: 10.1023/B:BOLI.0000031100.26546.6e. [DOI] [PubMed] [Google Scholar]
- 24.Groth P, Kalev I, Kirov I, Traikov B, Leser U, Weiss B. Phenoclustering: online mining of cross-species phenotypes. Bioinformatics. 2010;26:1924–1925. doi: 10.1093/bioinformatics/btq311. [DOI] [PMC free article] [PubMed] [Google Scholar]
- 25.Goh K-I, Cusick ME, Valle D, Childs B, Vidal M, Barabási A-L. The human disease network. Proc Natl Acad. Sci. USA. 2007;104:8685–8690. doi: 10.1073/pnas.0701361104. [DOI] [PMC free article] [PubMed] [Google Scholar]
- 26.Barabasi A, Gulbahce N, Loscalzo J. Network medicine: a network-based approach to human disease. Nat. Rev. Genet. 2011;12:56–68. doi: 10.1038/nrg2918. [DOI] [PMC free article] [PubMed] [Google Scholar]
- 27.Kanehisa M, Goto S, Kawashima S, Okuno Y, Hattori M. The KEGG resource for deciphering the genome. Nucleic Acids Res. 2004;32:D277–D280. doi: 10.1093/nar/gkh063. [DOI] [PMC free article] [PubMed] [Google Scholar]
- 28.Lee D, Seung H. Learning the parts of objects by non-negative matrix factorization. Nature. 1999;401:788–791. doi: 10.1038/44565. [DOI] [PubMed] [Google Scholar]
- 29.Lee DD, Seung HS. The proceeding of Neural Information Processing Systems. Denver, CO, USA: MIT Press; 2000. pp. 556–562. [Google Scholar]
- 30.Brunet J, Tamayo P, Golub T, Mesirov J. Metagenes and molecular pattern discovery using matrix factorization. Proc. Natl Acad. Sci. USA. 2004;101:4164–4169. doi: 10.1073/pnas.0308531101. [DOI] [PMC free article] [PubMed] [Google Scholar]
- 31.Kim H, Park H, Drake B. Extracting unrecognized gene relationships from the biomedical literature via matrix factorizations. BMC Bioinformatics. 2007;8(Suppl 9):S6. doi: 10.1186/1471-2105-8-S9-S6. [DOI] [PMC free article] [PubMed] [Google Scholar]
- 32.Schachtner R, Lutter D, Knollmuller P, Tome A, Theis F, Schmitz G, Stetter M, Vilda P, Lang E. Knowledge-based gene expression classification via matrix factorization. Bioinformatics. 2008;24:1688–1697. doi: 10.1093/bioinformatics/btn245. [DOI] [PMC free article] [PubMed] [Google Scholar]
- 33.Kim H, Park H. Sparse non-negative matrix factorizations via alternating non-negativity-constrained least squares for microarray data analysis. Bioinformatics. 2007;23:1495–1502. doi: 10.1093/bioinformatics/btm134. [DOI] [PubMed] [Google Scholar]
- 34.Inamura K, Fujiwara T, Hoshida Y, Isagawa T, Jones M, Virtanen C, Shimane M, Satoh Y, Okumura S, Nakagawa K, et al. Two subclasses of lung squamous cell carcinoma with different gene expression profiles and prognosis identified by hierarchical clustering and non-negative matrix factorization. Oncogene. 2005;24:7105–7113. doi: 10.1038/sj.onc.1208858. [DOI] [PubMed] [Google Scholar]
- 35.Greene D, Cagney G, Krogan N, Cunningham P. Ensemble non-negative matrix factorization methods for clustering protein–protein interactions. Bioinformatics. 2008;24:1722–1728. doi: 10.1093/bioinformatics/btn286. [DOI] [PMC free article] [PubMed] [Google Scholar]
- 36.Ding C, Li T, Peng W, Park H. Proceeding of the 12th ACM International Conference on Knowledge Discovery and Data Mining. Philadelphia, PA, USA: ACM (Association for Computing Machinery); 2006. pp. 126–135. [Google Scholar]
- 37.Li T, Sindhwani V, Ding C, Zhang Y. SIAM Conference on Data Mining. Columbus, Ohio, USA: SIAM (Society for Industrial and Applied Mathematics); 2010. pp. 293–302. [Google Scholar]
- 38.Zhuang F, Luo P, Xiong H, He Q, Xiong Y, Shi Z. SIAM Conference on Data Mining. Press; 2010. pp. 13–24. [Google Scholar]
- 39.Chung F. In: Regional Conference Series in Mathematics. Vol. 92. Providence, RI, Ann Arbor, MI: American Mathematical Society; 1997. Spectral graph theory. [Google Scholar]
- 40.Higgins M, Claremont M, Major J, Sander C, Lash A. CancerGenes: a gene selection resource for cancer genome projects. Nucleic Acids Res. 2007;35:D721–D726. doi: 10.1093/nar/gkl811. [DOI] [PMC free article] [PubMed] [Google Scholar]
- 41.Peri S, Navarro J, Amanchy R, Kristiansen T, Jonnalagadda C, Surendranath V, Niranjan V, Muthusamy B, Gandhi T, Gronborg M, et al. Development of human protein reference database as an initial platform for approaching systems biology in humans. Genome Res. 2003;13:2363–2371. doi: 10.1101/gr.1680803. [DOI] [PMC free article] [PubMed] [Google Scholar]
- 42.Zhou D, Bousquet O, Lal TN, Weston J, Schlkopf B. In Advances in Neural Information Processing Systems 16. MIT Press; 2004. pp. 321–328. [Google Scholar]
- 43.Robinson P, Mundlos S. The human phenotype ontology. Clin. Genet. 2010;77:525–534. doi: 10.1111/j.1399-0004.2010.01436.x. [DOI] [PubMed] [Google Scholar]
- 44.Hall CM. International nosology and classification of constitutional disorders of bone (2001) Am. J. Med. Genet. 2002;113:65–77. doi: 10.1002/ajmg.10828. [DOI] [PubMed] [Google Scholar]
- 45.McCulloch KJ, Mills CM, Greenfeld RS, Coil JM. Dens evaginatus from an orthodontic perspective: report of several clinical cases and review of the literature. Am. J. Orthod. Dentofacial Orthop. 1997;112:670–675. doi: 10.1016/s0889-5406(97)70233-6. [DOI] [PubMed] [Google Scholar]
- 46.Marks SC, Jr, Cahill DR. Regional control by the dental follicle of alterations in alveolar bone metabolism during tooth eruption. J. Oral Pathol. Med. 1987;16:164–169. doi: 10.1111/j.1600-0714.1987.tb02060.x. [DOI] [PubMed] [Google Scholar]
- 47.Morris ME, Augsburger RH. Dentine dysplasia with sclerotic bone and skeletal anomalies inherited as an autosomal dominant trait: a new syndrome. Oral Surg. Oral Med. Oral Patho. 1977;43:267–283. doi: 10.1016/0030-4220(77)90163-3. [DOI] [PubMed] [Google Scholar]
- 48.D'Andrea AD. Susceptibility pathways in fanconi's anemia and breast cancer. N. Engl J. Med. 2010;362:1909–1919. doi: 10.1056/NEJMra0809889. [DOI] [PMC free article] [PubMed] [Google Scholar]
- 49.Yilmaz A, Hamel N, Schwartz CE, Houlston RS, Harper JI, Foulkes WD. A genome-wide analysis of loss of heterozygosity and chromosomal copy number variation in Proteus syndrome using high-density SNP microarrays. J. Hum. Genet. 2010;55:627–630. doi: 10.1038/jhg.2010.70. [DOI] [PubMed] [Google Scholar]
- 50.Bahcall O. Proteus syndrome exomes. Nat. Genet. 2011;43:824–824. [Google Scholar]
- 51.Lindhurst MJ, Sapp JC, Teer JK, Johnston JJ, Finn EM, Peters K, Turner J, Cannons JL, Bick D, Blakemore L, et al. A Mosaic Activating Mutation in AKT1 Associated with the Proteus Syndrome. New Engl. Jo. Med. 2011;365:611–619. doi: 10.1056/NEJMoa1104017. [DOI] [PMC free article] [PubMed] [Google Scholar]
- 52.Zbuk KM, Eng C. Cancer phenomics: RET and PTEN as illustrative models. Nat. Rev. Cancer. 2007;7:35–45. doi: 10.1038/nrc2037. [DOI] [PubMed] [Google Scholar]
- 53.Pilarski R, Stephens JA, Noss R, Fisher JL, Prior TW. Predicting PTEN mutations: an evaluation of Cowden syndrome and bannayanrileyruvalcaba syndrome clinical features. J. Med. Genet. 2011;48:505–512. doi: 10.1136/jmg.2011.088807. [DOI] [PubMed] [Google Scholar]
- 54.Patnaik MM, Raza SS, Khambatta S, Stanich PP, Goetz MP. Oncophenotypic Review and Clinical Correlates of Phosphatase and Tensin Homolog on Chromosome 10 Hamartoma Tumor Syndrome. J. Clini. Oncol. 2010;28:e767–e768. doi: 10.1200/JCO.2010.32.7031. [DOI] [PubMed] [Google Scholar]
- 55.Groenewegen WA, Firouzi M, Bezzina CR, Vliex S, van Langen IM, Sandkuijl L, Smits JP, Hulsbeek M, Rook MB, Jongsma HJ, et al. A Cardiac Sodium Channel Mutation Cosegregates With a Rare Connexin40 Genotype in Familial Atrial Standstill. Circ. Res. 2003;92:14–22. doi: 10.1161/01.res.0000050585.07097.d7. [DOI] [PubMed] [Google Scholar]
- 56.Roden DM. Long-QT Syndrome. New Engl. J. Med. 2008;358:169–176. doi: 10.1056/NEJMcp0706513. [DOI] [PubMed] [Google Scholar]
- 57.Crotti L, Monti MC, Insolia R, Peljto A, Goosen A, Brink PA, Greenberg DA, Schwartz PJ, George AL. NOS1AP Is a Genetic Modifier of the Long-QT Syndrome. Circulation. 2009;120:1657–1663. doi: 10.1161/CIRCULATIONAHA.109.879643. [DOI] [PMC free article] [PubMed] [Google Scholar]
- 58.Horne RSC, Witcombe NB, Yiallourou SR, Scaillet S, Thiriez G, Franco P. Cardiovascular control during sleep in infants: implications for Sudden Infant Death Syndrome. Sleep Medicine. 2010;11:615–621. doi: 10.1016/j.sleep.2009.10.008. [DOI] [PubMed] [Google Scholar]
- 59.Bennett RM, O'Connell DJ. The arthritis of mixed connective tissue disease. Ann. Rheumatic Diseases. 1978;37:397–403. doi: 10.1136/ard.37.5.397. [DOI] [PMC free article] [PubMed] [Google Scholar]
- 60.Mcafee PC, Cady RB. Endocrinologic and Metabolic Factors in Atypical Presentations of Slipped Capital Femoral Epiphysis: Report of Four Cases and Review of the Literature. Clin. Orthopa. Relat Res. 1983;180 [PubMed] [Google Scholar]
- 61.Kale A, Sah K, Rastogi P, Awasthi S, Chandra S. Traumatic pseudolipoma causing facial asymmetry: an uncommon pathology and review of its pathogenesis. J. Oral Maxillofacial Pathol. 2011;15:113–115. doi: 10.4103/0973-029X.80012. [DOI] [PMC free article] [PubMed] [Google Scholar]
- 62.Lai-Cheong JE, Arita K, McGrath JA. Genetic Diseases of Junctions. J. Invest Dermatol. 127:2713–2725. doi: 10.1038/sj.jid.5700727. [DOI] [PubMed] [Google Scholar]
- 63.Leachman SA, Kaspar RL, Fleckman P, Florell SR, Smith FJD, McLean WHI, Lunny DP, Milstone LM, van Steensel MAM, Munro CS, et al. Clinical and Pathological Features of Pachyonychia Congenita. J. Investig. Dermatol. Symp. Proc. 2005;10:3–17. doi: 10.1111/j.1087-0024.2005.10202.x. [DOI] [PubMed] [Google Scholar]
- 64.Yaoita H, Briggaman RA, Lawley TJ, Provost TT, Katz SI. Epidermolysis Bullosa Acquisita: Ultrastructural and Immunological Studies. J. Investig. Dermatol. 1981;76:288–292. doi: 10.1111/1523-1747.ep12526124. [DOI] [PubMed] [Google Scholar]
- 65.Saravelos SH, Cocksedge KA, Li T-C. Prevalence and diagnosis of congenital uterine anomalies in women with reproductive failure: a critical appraisal. Hum. Reproduct. Update. 2008;14:415–429. doi: 10.1093/humupd/dmn018. [DOI] [PubMed] [Google Scholar]
- 66.Bergada C, Cleveland WW, Jones HW, Wilkins L. Variants of embryonic testicular dysgenesis: Bilateral anorchia and the syndrome of rudimentary testes. Acta Endocrinologica. 1962;40:521–536. doi: 10.1530/acta.0.0400521. [DOI] [PubMed] [Google Scholar]
- 67.Wang M-H, Baskin LS. Endocrine Disruptors, Genital Development, and Hypospadias. J. Androl. 2008;29:499–505. doi: 10.2164/jandrol.108.004945. [DOI] [PubMed] [Google Scholar]
- 68.Ruedi L. Pathogenesis of Otosclerosis. Arch. Otolaryngol. 1963;78:469–477. doi: 10.1001/archotol.1963.00750020481009. [DOI] [PubMed] [Google Scholar]
- 69.Gerich JE, Mokan M, Veneman T, Korytkowski M, Mitrakou A. Hypoglycemia Unawareness. Endocrine Rev. 1991;12:356–371. doi: 10.1210/edrv-12-4-356. [DOI] [PubMed] [Google Scholar]
- 70.Franks S. Polycystic Ovary Syndrome. New Eng. J. Med. 1995;333:853–861. doi: 10.1056/NEJM199509283331307. [DOI] [PubMed] [Google Scholar]
- 71.Krohn K, Fhrer D, Bayer Y, Eszlinger M, Brauer V, Neumann S, Paschke R. Molecular Pathogenesis of Euthyroid and Toxic Multinodular Goiter. Endocrine Rev. 2005;26:504–524. doi: 10.1210/er.2004-0005. [DOI] [PubMed] [Google Scholar]
- 72.Mcrae CA, Prince MI, Hudson M, Day CP, James OFW, Jones DEJ. Pain as a complication of use of opiate antagonists for symptom control in cholestasis. Gastroenterology. 2003;125:591–596. doi: 10.1016/s0016-5085(03)00879-5. [DOI] [PubMed] [Google Scholar]
- 73.Lowenfels AB, Maisonneuve P, DiMagno EP, Elitsur Y, Gates LK, Perrault J, Whitcomb DC. Hereditary Pancreatitis and the Risk of Pancreatic Cancer. J. Nat. Cancer Instit. 1997;89:442–446. doi: 10.1093/jnci/89.6.442. [DOI] [PubMed] [Google Scholar]
- 74.Jayabose S, Tugal O, Sandoval C, Patel P, Puder D, Lin T, Visintainer P. Clinical and hematologic effects of hydroxyurea in children with sickle cell anemia. The Journal of Pediatrics. 1996;129:559–565. doi: 10.1016/s0022-3476(96)70121-x. [DOI] [PubMed] [Google Scholar]
- 75.Fiske DN, McCoy HE, Kitchens CS. Zinc-induced sideroblastic anemia: report of a case, review of the literature, and description of the hematologic syndrome. Ame. J. Hematol. 1994;46:147–150. doi: 10.1002/ajh.2830460217. [DOI] [PubMed] [Google Scholar]
- 76.Bourne MS, Elves MW, Israls MCG. Familial Pyridoxine-Responsive Anaemia. Brit. J. Haematol. 1965;11:1–10. doi: 10.1111/j.1365-2141.1965.tb00077.x. [DOI] [PubMed] [Google Scholar]
- 77.Enbom M, Wang F-Z, Fredrikson S, Martin C, Dahl H, Linde A. Similar Humoral and Cellular Immunological Reactivities to Human Herpesvirus 6 in Patients with Multiple Sclerosis and Controls. Clin. Diagn. Lab. Immunol. 1999;6:545–549. doi: 10.1128/cdli.6.4.545-549.1999. [DOI] [PMC free article] [PubMed] [Google Scholar]
- 78.Durum SK, Schmidt JA, Oppenheim JJ. Interleukin 1: an Immunological Perspective. Annu. Rev. Immunol. 1985;3:263–287. doi: 10.1146/annurev.iy.03.040185.001403. [DOI] [PubMed] [Google Scholar]
- 79.Iwata M, Colby TV, Kitaichi M. Diffuse panbronchiolitis: diagnosis and distinction from various pulmonary diseases with centrilobular interstitial foam cell accumulations. Human Pathol. 1994;25:357–363. doi: 10.1016/0046-8177(94)90143-0. [DOI] [PubMed] [Google Scholar]
- 80.Rosenberg M, Patterson R, Mintzer R, Cooper BJ, Roberts M, Harris KE. Clinical and Immunologic Criteria for the Diagnosis of Allergic Bronchopulmonary Aspergillosis. Ann. Inter. Medi. 1977;86:405–414. doi: 10.7326/0003-4819-86-4-405. [DOI] [PubMed] [Google Scholar]
- 81.Fiorillo L. Therapy of pediatric genital diseases. Dermatologic Therapy. 2004;17:117–128. doi: 10.1111/j.1396-0296.2004.04012.x. [DOI] [PubMed] [Google Scholar]
- 82.Malcolm P. Nutrition and schizophrenia: beyond omega-3 fatty acids. Prostaglandins Leukot. Essent. Fatty Acids. 2004;70:417–422. doi: 10.1016/j.plefa.2003.12.019. [DOI] [PubMed] [Google Scholar]
- 83.Desport JC, Preux PM, Magy L, Boirie Y, Vallat JM, Beaufrre B, Couratier P. Factors correlated with hypermetabolism in patients with amyotrophic lateral sclerosis. Am. J. Clin. Nutr. 2001;74:328–334. doi: 10.1093/ajcn/74.3.328. [DOI] [PubMed] [Google Scholar]
- 84.Graham JM, Clark RD, Moeschler JB, Rogers RC. Behavioral features in young adults with FG syndrome (OpitzKaveggia syndrome) Am. J. Med. Genet. C Seminar Med. Genet. 2010;154C:477–485. doi: 10.1002/ajmg.c.30284. [DOI] [PMC free article] [PubMed] [Google Scholar]
- 85.Petry NM, Stinson FS, Grant BF. Comorbidity of DSM-IV Pathological Gambling and Other Psychiatric Disorders: results From the National Epidemiologic Survey on Alcohol and Related Conditions. J. Clin. Psychiatr. 2005;66:564–574. doi: 10.4088/jcp.v66n0504. [DOI] [PubMed] [Google Scholar]
- 86.Blaszczynski A, Nower L. A pathways model of problem and pathological gambling. Addiction. 2002;97:487–499. doi: 10.1046/j.1360-0443.2002.00015.x. [DOI] [PubMed] [Google Scholar]
- 87.Blainey J, Brewer D, Hardwicke J, Soothill J. The nephrotic syndrome. Diagnosis by renal biopsy and biochemical and immunological analyses related to the response to steroid therapy. Quart. j. Med. 1960;29:235–256. [PubMed] [Google Scholar]
- 88.Boute N, Gribouval O, Roselli S, Benessy F, Lee H, Fuchshuber A, Dahan K, Gubler M-C, Niaudet P, Antignac C. NPHS2, encoding the glomerular protein podocin, is mutated in autosomal recessive steroid-resistant nephrotic syndrome. Nat. Genet. 2000;24:349–354. doi: 10.1038/74166. [DOI] [PubMed] [Google Scholar]
- 89.Brenner BM, Cooper ME, de Zeeuw D, Keane WF, Mitch WE, Parving H-H, Remuzzi G, Snapinn SM, Zhang Z, Shahinfar S. Effects of Losartan on Renal and Cardiovascular Outcomes in Patients with Type 2 Diabetes and Nephropathy. New Eng. J. Med. 2001;345:861–869. doi: 10.1056/NEJMoa011161. [DOI] [PubMed] [Google Scholar]
- 90.Natochin YV, Kuznetsova AA. Nocturnal enuresis: correction of renal function by desmopressin and diclofenac. Pediatr. Nephrol. 2000;14:42–47. doi: 10.1007/s004670050011. 10.1007/s004670050011. [DOI] [PubMed] [Google Scholar]
- 91.McKay M, Clarren SK, Zorn R, Opitz JM. Isolated tibial hemimelia in sibs: an autosomal-recessive disorder? Am. J. Med. Genet. 1984;17:603–607. doi: 10.1002/ajmg.1320170308. [DOI] [PubMed] [Google Scholar]
- 92.Koehn J, Fountoulakis M, Krapfenbauer K. Multiple drug resistance associated with function of ABC-transporters in diabetes mellitus: molecular mechanism and clinical relevance. Infect. Disorders Drug Targets (Formerly Current Drug Targets-Infectious. 2008;8:109–118. doi: 10.2174/187152608784746510. [DOI] [PubMed] [Google Scholar]
- 93.Heilbronn L, Smith S, Ravussin E. Failure of fat cell proliferation, mitochondrial function and fat oxidation results in ectopic fat storage, insulin resistance and type II diabetes mellitus. Int. J. Obe. 2004;28:S12–S21. doi: 10.1038/sj.ijo.0802853. [DOI] [PubMed] [Google Scholar]
- 94.Andersson L, Petersen G, Ståhl F. Ranking candidate genes in rat models of type 2 diabetes. Theor. Biol. Med. Mode. 2009;6:12. doi: 10.1186/1742-4682-6-12. [DOI] [PMC free article] [PubMed] [Google Scholar]
- 95.Planas R, Carrillo J, Sanchez A, Ruiz de Villa M, Nuñez F, Verdaguer J, James R, Pujol-Borrell R, Vives-Pi M. Gene expression profiles for the human pancreas and purified islets in Type 1 diabetes: new findings at clinical onset and in long-standing diabetes. Clini. Exp. Immunol. 2010;159:23–44. doi: 10.1111/j.1365-2249.2009.04053.x. [DOI] [PMC free article] [PubMed] [Google Scholar]
- 96.Donner H, Rau H, Walfish P, Braun J, Siegmund T, Finke R, Herwig J, Usadel K, Badenhoop K. CTLA4 alanine-17 confers genetic susceptibility to Graves' disease and to type 1 diabetes mellitus. J. Clin. Endocrinol. Metab. 1997;82:143–146. doi: 10.1210/jcem.82.1.3699. [DOI] [PubMed] [Google Scholar]
- 97.Haygood R, Fedrigo O, Hanson B, Yokoyama K, Wray G. Promoter regions of many neural-and nutrition-related genes have experienced positive selection during human evolution. Nat. Genet. 2007;39:1140–1144. doi: 10.1038/ng2104. [DOI] [PubMed] [Google Scholar]
- 98.Tanzi R, Bertram L. Twenty years of the Alzheimers disease amyloid hypothesis: a genetic perspective. Cell. 2005;120:545–555. doi: 10.1016/j.cell.2005.02.008. [DOI] [PubMed] [Google Scholar]
- 99.Carter C. Convergence of genes implicated in Alzheimer's disease on the cerebral cholesterol shuttle: app, cholesterol, lipoproteins, and atherosclerosis. Neurochem. Int. 2007;50:12–38. doi: 10.1016/j.neuint.2006.07.007. [DOI] [PubMed] [Google Scholar]
- 100.De Vrij F, Fischer D, Van Leeuwen F, Hol E. Protein quality control in Alzheimer's disease by the ubiquitin proteasome system. Prog. neurobiol. 2004;74:249–270. doi: 10.1016/j.pneurobio.2004.10.001. [DOI] [PubMed] [Google Scholar]
- 101.Parelkar S, Cadena J, Kim C, Wang Z, Sugal R, Bentley B, Moral L, Ardley H, Schwartz L. The Parkin-Like Human Homolog of Drosophila Ariadne-1 (HHARI) Can Induce Aggresome Formation in Mammalian Cells and Is Immunologically Detectable in Lewy Bodies. J. Mol. Neurosci. 2012;46:109–121. doi: 10.1007/s12031-011-9535-1. 10.1007/s12031-011-9535-1. [DOI] [PubMed] [Google Scholar]
- 102.Hadano S, Otomo A, Suzuki-Utsunomiya K, Kunita R, Yanagisawa Y, Showguchi-Miyata J, Mizumura H, Ikeda J-E. ALS2CL, the novel protein highly homologous to the carboxy-terminal half of ALS2, binds to Rab5 and modulates endosome dynamics. FEBS Lett. 2004;575:64–70. doi: 10.1016/j.febslet.2004.07.092. [DOI] [PubMed] [Google Scholar]
- 103.Manser C, Stevenson A, Banner S, Davies J, Tudor EL, Ono Y, Nigel~Leigh P, McLoughlin DM, Shaw CE, Miller CCJ. Deregulation of PKN1 activity disrupts neurofilament organisation and axonal transport. FEBS Lett. 2008;582:2303–2308. doi: 10.1016/j.febslet.2008.05.034. [DOI] [PMC free article] [PubMed] [Google Scholar]
- 104.Borrell-Pags M, Zala D, Humbert S, Saudou F. Huntingtons disease: from huntingtin function and dysfunction to therapeutic strategies. Cell. Mol. Life Sci. 2006;63:2642–2660. doi: 10.1007/s00018-006-6242-0. 10.1007/s00018-006-6242-0. [DOI] [PMC free article] [PubMed] [Google Scholar]
- 105.Peoc'h K, Guérin C, Brandel J, Launay J, Laplanche J. First report of polymorphisms in the prion-like protein gene (PRND): implications for human prion diseases. Neurosc. lett. 2000;286:144–148. doi: 10.1016/s0304-3940(00)01100-9. [DOI] [PubMed] [Google Scholar]
- 106.Wu Y, Berends M, Post J, Mensink R, Verlind E, Van Der Sluis T, Kempinga C, Sijmons R, Van Der Zee A, Hollema H, et al. Germline mutations of EXO1 gene in patients with hereditary nonpolyposis colorectal cancer (HNPCC) and atypical HNPCC forms. Gastroenterology. 2001;120:1580–1587. doi: 10.1053/gast.2001.25117. [DOI] [PubMed] [Google Scholar]
- 107.Yamamoto H, Hanafusa H, Ouchida M, Yano M, Suzuki H, Murakami M, Aoe M, Shimizu N, Nakachi K, Shimizu K. Single nucleotide polymorphisms in the EXO1 gene and risk of colorectal cancer in a Japanese population. Carcinogenesis. 2005;26:411–416. doi: 10.1093/carcin/bgh335. [DOI] [PubMed] [Google Scholar]
- 108.Kaklamani V, Wisinski K, Sadim M, Gulden C, Do A, Offit K, Baron J, Ahsan H, Mantzoros C, Pasche B. Variants of the adiponectin (ADIPOQ) and adiponectin receptor 1 (ADIPOR1) genes and colorectal cancer risk. JAMA. 2008;300:1523. doi: 10.1001/jama.300.13.1523. [DOI] [PMC free article] [PubMed] [Google Scholar]
- 109.Byeon J-S, Jeong J-Y, Kim MJ, Lee S-M, Nam W-H, Myung S-J, Kim JG, Yang S-K, Kim J-H, Suh DJ. Adiponectin and adiponectin receptor in relation to colorectal cancer progression. Inte. J. Cancer. 2010;127:2758–2767. doi: 10.1002/ijc.25301. [DOI] [PubMed] [Google Scholar]
- 110.Sieber O, Lipton L, Crabtree M, Heinimann K, Fidalgo P, Phillips R, Bisgaard M, Orntoft T, Aaltonen L, Hodgson S, et al. Multiple colorectal adenomas, classic adenomatous polyposis, and germ-line mutations in MYH. New Engl. J. Med. 2003;348:791–799. doi: 10.1056/NEJMoa025283. [DOI] [PubMed] [Google Scholar]
- 111.De Jong A, Van Puijenbroek M, Hendriks Y, Tops C, Wijnen J, Ausems M, Meijers-Heijboer H, Wagner A, Van Os T, Bröcker-Vriends A, et al. Microsatellite instability, immunohistochemistry, and additional PMS2 staining in suspected hereditary nonpolyposis colorectal cancer. Clin. Cancer Res. 2004;10:972–980. doi: 10.1158/1078-0432.ccr-0956-3. [DOI] [PubMed] [Google Scholar]
- 112.Beiner ME, Finch A, Rosen B, Lubinski J, Moller P, Ghadirian P, Lynch HT, Friedman E, Sun P, Narod SA. The risk of endometrial cancer in women with brca1 and brca2 mutations. a prospective study. Gynecol. Oncol. 2007;104:7–10. doi: 10.1016/j.ygyno.2006.08.004. [DOI] [PubMed] [Google Scholar]
- 113.Yoo KH, Sung YH, Yang MH, Jeon JO, Yook YJ, Woo YM, Lee H-W, Park JH. Inactivation of Mxi1 induces Il-8 secretion activation in polycystic kidney. Biochem. Biophys. Res. Commun. 2007;356:85–90. doi: 10.1016/j.bbrc.2007.02.103. [DOI] [PubMed] [Google Scholar]
- 114.Zu K, Bihani T, Lin A, Park Y-M, Mori K, Ip C. Enhanced selenium effect on growth arrest by BiP//GRP78 knockdown in p53-null human prostate cancer cells. Oncogene. 2005;25:546–554. doi: 10.1038/sj.onc.1209071. [DOI] [PMC free article] [PubMed] [Google Scholar]
- 115.Wu Y-M, Robinson DR, Kung H-J. Signal Pathways in Up-regulation of Chemokines by Tyrosine Kinase MER/NYK in Prostate Cancer Cells. Cancer Res. 2004;64:7311–7320. doi: 10.1158/0008-5472.CAN-04-0972. [DOI] [PubMed] [Google Scholar]
- 116.Deng X, Liu H, Huang J, Cheng L, Keller ET, Parsons SJ, Hu C-D. Ionizing Radiation Induces Prostate Cancer Neuroendocrine Differentiation through Interplay of CREB and ATF2: Implications for Disease Progression. Cancer Res. 2008;68:9663–9670. doi: 10.1158/0008-5472.CAN-08-2229. [DOI] [PMC free article] [PubMed] [Google Scholar]
- 117.Zhao H, Whitfield ML, Xu T, Botstein D, Brooks JD. Diverse Effects of Methylseleninic Acid on the Transcriptional Program of Human Prostate Cancer Cells. Mol. Biol. Cell. 2004;15:506–519. doi: 10.1091/mbc.E03-07-0501. [DOI] [PMC free article] [PubMed] [Google Scholar]
- 118.Streit S, Mestel D, Schmidt M, Ullrich A, Berking C. FGFR4 Arg388 allele correlates with tumour thickness and FGFR4 protein expression with survival of melanoma patients. Brit. Jo. cancer. 2006;94:1879–1886. doi: 10.1038/sj.bjc.6603181. [DOI] [PMC free article] [PubMed] [Google Scholar]
- 119.Gartside M, Curtis A, Yudt L, Harper U, Bengston A, Pavey S, Tuthill R, Bastian B, Meltzer P, Pollock P. AACR Meeting Abstracts. 2005;2005:608. [Google Scholar]
- 120.Bloethner S, Mould A, Stark M, Hayward N. Identification of arhgef17, dennd2d, fgfr3, and rb1 mutations in melanoma by inhibition of nonsense-mediated mRNA decay. Genes, Chromosomes and Cancer. 2008;47:1076–1085. doi: 10.1002/gcc.20598. [DOI] [PubMed] [Google Scholar]
- 121.Bloethner S, Mould A, Stark M, Hayward NK. Identification of arhgef17, dennd2d, fgfr3, and rb1 mutations in melanoma by inhibition of nonsense-mediated mRNA decay. Genes, Chromosomes and Cancer. 2008;47:1076–1085. doi: 10.1002/gcc.20598. [DOI] [PubMed] [Google Scholar]
- 122.Koed K, Wiuf C, Christensen L, Wikman F, Zieger K, Møller K, von~der Maase H, Ørntoft T. High-density single nucleotide polymorphism array defines novel stage and location-dependent allelic imbalances in human bladder tumors. Cancer Res. 2005;65:34. [PubMed] [Google Scholar]
- 123.Buytaert E, Matroule JY, Durinck S, Close P, Kocanova S, Vandenheede JR, de Witte PA, Piette J, Agostinis P. Molecular effectors and modulators of hypericin-mediated cell death in bladder cancer cells. Oncogene. 2007;27:1916–1929. doi: 10.1038/sj.onc.1210825. [DOI] [PubMed] [Google Scholar]
- 124.Diaz-Blanco E, Bruns I, Neumann F, Fischer JC, Graef T, Rosskopf M, Brors B, Pechtel S, Bork S, Koch A, et al. Molecular signature of CD34+ hematopoietic stem and progenitor cells of patients with CML in chronic phase. Leukemia. 2007;21:494–504. doi: 10.1038/sj.leu.2404549. [DOI] [PubMed] [Google Scholar]
- 125.Steelman LS, Franklin RA, Abrams SL, Chappell W, Kempf CR, Basecke J, Stivala F, Donia M, Fagone P, Nicoletti F, et al. Roles of the Ras/Raf/MEK/ERK pathway in leukemia therapy. Leukemia. 2011;25:1080–1094. doi: 10.1038/leu.2011.66. [DOI] [PubMed] [Google Scholar]
- 126.Schmidt S, Wolf D. Role of gene-expression profiling in chronic myeloid leukemia. Expert Rev. Hematol. 2009;2:93–103. doi: 10.1586/17474086.2.1.93. [DOI] [PubMed] [Google Scholar]
- 127.Zhang S, Ma L, Huang Q, Li G, Gu B, Gao X, Shi J, Wang Y, Gao L, Cai X, et al. Gain-of-function mutation of GATA-2 in acute myeloid transformation of chronic myeloid leukemia. Proc. Nat. Acad. Sci. 2008;105:2076. doi: 10.1073/pnas.0711824105. [DOI] [PMC free article] [PubMed] [Google Scholar]
- 128.Forestier E, Izraeli S, Beverloo B, Haas O, Pession A, Michalová K, Stark B, Harrison C, Teigler-Schlegel A, Johansson B. Cytogenetic features of acute lymphoblastic and myeloid leukemias in pediatric patients with Down syndrome: an iBFM-SG study. Blood. 2008;111:1575. doi: 10.1182/blood-2007-09-114231. [DOI] [PubMed] [Google Scholar]
- 129.Valk P, Verhaak R, Beijen M, Erpelinck C, van Doorn-Khosrovani S, Boer J, Beverloo H, Moorhouse M, van~der Spek P, Löwenberg B, et al. Prognostically useful gene-expression profiles in acute myeloid leukemia. New Engl. J. Med. 2004;350:1617–1628. doi: 10.1056/NEJMoa040465. [DOI] [PubMed] [Google Scholar]
- 130.Rozman M, Camós M, Colomer D, Villamor N, Esteve J, Costa D, Carrió A, Aymerich M, Aguilar J, Domingo A, et al. Type I MOZ/CBP (MYST3/CREBBP) is the most common chimeric transcript in acute myeloid leukemia with t (8; 16)(p11; p13) translocation. Genes Chromosomes Cancer. 2004;40:140–145. doi: 10.1002/gcc.20022. [DOI] [PubMed] [Google Scholar]
- 131.Sun Y. p53 and its downstream proteins as molecular targets of cancer. Mol. Carcinogenesis. 2006;45:409–415. doi: 10.1002/mc.20231. [DOI] [PubMed] [Google Scholar]
- 132.Xia H, Qi H, Li Y, Pei J, Barton J, Blackstad M, Xu T, Tao W. LATS1 tumor suppressor regulates G2/M transition and apoptosis. Oncogene. 2002;21:1233–1241. doi: 10.1038/sj.onc.1205174. [DOI] [PubMed] [Google Scholar]
- 133.Altucci L, Leibowitz MD, Ogilvie KM, de Lera AR, Gronemeyer H. RAR and RXR modulation in cancer and metabolic disease. Nat Rev Drug Discov. 2007;6:793–810. doi: 10.1038/nrd2397. [DOI] [PubMed] [Google Scholar]
- 134.Massague J. G1 cell-cycle control and cancer. Nature. 2004;432:298–306. doi: 10.1038/nature03094. [DOI] [PubMed] [Google Scholar]
- 135.Ying J, Li H, Yu J, Ng KM, Poon FF, Wong SCC, Chan AT, Sung JJ, Tao Q. WNT5A exhibits tumor-suppressive activity through antagonizing the Wnt/beta-catenin signaling, and is frequently methylated in colorectal cancer. Clin Cancer Res. 2008;14:55–61. doi: 10.1158/1078-0432.CCR-07-1644. [DOI] [PubMed] [Google Scholar]
- 136.Streit S, Mestel DS, Schmidt M, Ullrich A, Berking C. FGFR4 Arg388 allele correlates with tumour thickness and FGFR4 protein expression with survival of melanoma patients. Br J Cancer. 2006;94:1879–1886. doi: 10.1038/sj.bjc.6603181. [DOI] [PMC free article] [PubMed] [Google Scholar]
- 137.Vogelstein B, Kinzler KW. Cancer genes and the pathways they control. Nat. Med. 2004;10:789–799. doi: 10.1038/nm1087. [DOI] [PubMed] [Google Scholar]
- 138.Brown CJ, Lain S, Verma CS, Fersht AR, Lane DP. Awakening guardian angels: drugging the p53 pathway. Nat. Rev. Cancer. 2009;9:862–873. doi: 10.1038/nrc2763. [DOI] [PubMed] [Google Scholar]
- 139.Citri A, Yarden Y. EGF-ERBB signalling: towards the systems level. Nat. Rev. Mole. Cell Biol. 2006;7:505–516. doi: 10.1038/nrm1962. [DOI] [PubMed] [Google Scholar]
- 140. (2006) Targeting the Hedgehog pathway in cancer. Nature Reviews Drug Discovery, 5, 1026–1033. [DOI] [PubMed] [Google Scholar]
- 141. (2005) Promoting apoptosis as a strategy for cancer drug discovery. Nat. Rev. Cancer, 5, 876–885. [DOI] [PubMed] [Google Scholar]
- 142.Tsankova N, Renthal W, Kumar A, Nestler EJ. Epigenetic regulation in psychiatric disorders. 2007;8:355–367. doi: 10.1038/nrn2132. [DOI] [PubMed] [Google Scholar]
- 143.Zarubin T, Han J. Activation and signaling of the p38 MAP kinase pathway. Cell Res. 2005;15:11–18. doi: 10.1038/sj.cr.7290257. [DOI] [PubMed] [Google Scholar]
- 144.Hoehndorf R, Schofield P, Gkoutos G. PhenomeNET: a whole-phenome approach to disease gene discovery. Nucleic Acids Res. 2011;39:e119. doi: 10.1093/nar/gkr538. [DOI] [PMC free article] [PubMed] [Google Scholar]
- 145.Gu Q, Zhou J. KDD '09: Proceedings of the 15th ACM SIGKDD international conference on Knowledge discovery and data mining. New York, NY, USA: ACM; 2009. pp. 359–368. [Google Scholar]
Associated Data
This section collects any data citations, data availability statements, or supplementary materials included in this article.