Abstract
Accurate sound speed estimates are desirable in a number of fields. In an effort to increase the spatial resolution of sound speed estimates, a new method is proposed for direct measurement of sound speed between arbitrary spatial locations. The method uses the sound speed estimator developed by Anderson and Trahey. Their least squares fit of the received waveform’s curvature provides an estimate of the wave’s point of origin. The point of origin and the delay profile calculated from the fit are used to arrive at a spatially registered virtual detector. Between a pair of registered virtual detectors, a spherical wave is propagated. By beamforming the data, the time-of-flight between the two virtual sources can be calculated. From this information, the local sound speed can be estimated. Validation of the estimator is made using phantom and simulation data. The set of test phantoms consisted of both homogeneous and inhomogeneous media. Several different inhomogeneous phantom configurations were used for the physical validation. The simulation validation focused on the limits of target depth and signal-to-noise ratio on virtual detector registration. The simulations also compare the impact of two- and three-layer inhomogeneous media. The phantom results varied based on signal-to-noise ratio and geometry. The results for all cases were generally less than 1% mean error and standard deviation. The simulation results varied somewhat with depth and F/#, but primarily, they varied with signal-to-noise ratio and geometry. With two-layer geometries, the algorithm has a worst-case spatial registration bias of 0.02%. With three-layer geometries, the axial registration error gets worse with a bias magnitude up to 2.1% but is otherwise relatively stable over depth. The stability over depth of the bias in a given medium still allows for accurate sound speed estimates with a mean relative error less than 0.2%.
Keywords: ultrasound, sound speed, beamforming, channel data
Sound speed estimates are desirable in a number of fields such as nondestructive evaluation, material characterization, ocean acoustics, and clinical applications. Clinically, sound speed estimates have relevance in adaptive imaging and tissue and phantom characterization. Sound speeds, in vivo, range from 1440 to 1600 m/s in soft tissue and may be higher than 3700 m/s in bone.1,2 It has been suggested that sound speed estimates may be useful for pathological and healthy tissue distinction.3
Besides demarcation of tissue type, sound speed estimation has potential for correcting tissue aberrations. Aberrations of concern here can be divided into two categories. The first category is beamforming aberration resulting from a gross velocity mismatch between the beamformer and the tissue. The second category of interest is aberration caused by spatial velocity variations. Both categories of aberration result in image degradation that can be reduced with accurate knowledge of the sound speed.
It is not clear what the necessary resolution and error bounds are for either demarcation of tissue types (likely situation dependent) or correction of aberration errors. However, probably the best examples of high-resolution, high-precision sound speed estimates to date have come from transmission methods of ultrasound tomography. Transmission methods of ultrasound tomography have been around for several decades and show promise in distinguishing between healthy and pathological tissue in breasts using sound speed.4,5 More recently an ultrasound transmission tomography approach to sound speed estimates has shown good results and demonstrated the feasibility of sound speed estimates with the ability to resolve small cysts (4–6 mm) with estimation errors less than 1%.6 While these results are impressive, they are acquired with expensive systems that are not readily available. Unfortunately, methods that have used readily available clinical arrays have either lacked spatial resolution or suffered from poor precision.
The use of clinical arrays in sound speed estimation algorithms has a long history in the medical ultrasound literature.3 Within the past decade or so, there has been an introduction of several new methods. However, most new algorithms only provide gross sound speed estimates. Of these new, gross estimators, the first was proposed by Anderson and Trahey.7 Their algorithm involves fitting the received waveform’s curvature. The Anderson-Trahey method for sound speed estimation plays an important role in the proposed algorithm and will be discussed in detail later.
A global sound speed algorithm similar to one by Anderson and Trahey7 was proposed by Pereira et al.8 The two algorithms are conceptually similar but differ in the fit of the data. The arrival time data are fit between time and time by Pereira et al. and between time and space by Anderson and Trahey. Both methods have been shown to be extremely accurate for estimating global sound speeds, but Pereira et al.’s method may, under certain circumstances, such as high F/#, perform better. The change in performance is due to algebraic manipulation of the received delay equation to eliminate dependence on the received wave’s point of origin. However, knowledge of the received wave’s point of origin provided by Anderson and Trahey’s method will be a crucial part of the algorithm proposed here.
An approach similar to Pereira et al.8 was proposed by Kolkman et al.9 The primary difference is that Kolkman et al. use photoacoustic excitation of the medium. In addition, Kolkman et al. demonstrate their algorithm in a media with a second thin layer located below a 1-cm layer of water. They show good results with estimation errors and a standard deviation of almost 1% in layered media.
The algorithms described are novel relative to the sound speed estimation algorithms in the earlier literature. However, Krücker et al.10 recently revisited an old algorithm originally proposed by Robinson et al.3 The original method was to make an estimate of the global sound speed by finding the optimal registration of images from different angles. Krücker et al. applied recent image registration algorithms to the method with good success. Their results show they can calculate the global sound speed with an error significantly lower than 1%. In addition, their method may be adaptable to introduce some level of spatial resolution to their sound speed estimates.
Greco de Sousa et al.11 have also recently presented a sound speed algorithm. Their algorithm’s intent is specifically to measure the sound speeds and thicknesses in multilayered media. They rely on geometrical acoustics and assume a strictly parallel layered medium. Their results for estimated sound speed errors range from 1.8% to 6.6%.
Several other recent techniques have been proposed with reasonable results, but they rely on a planar reflector or a multitransducer configuration.12,13
The algorithms discussed above make assumptions about the interrogated media,11 lack resolution,7,8,10 or become less accurate as the medium increases in complexity.14 To handle more complex media with a less stringent assumption about the nature of the medium, a new method was recently proposed that is less affected by inhomogeneity and can find a localized sound speed measurement between arbitrary points within the influence of the transducer’s geometry.15
Methods
Theory
The proposed sound speed estimator is most easily considered in two stages. In the first stage, two points in the field are spatially registered. The second stage takes the two points and, for the space in between, finds the ultrasonic time-of-flight. The time-of-flight and the known spatial position can be used to estimate the local sound speed.
As stated above, the purpose of the first stage of the algorithm is to find two registered points in the field and their accompanying delay profile. In this article, the combination of a delay profile and a spatial location will be referred to as a spatially registered virtual detector. (To the authors’ knowledge, the term virtual detector was coined by Zemp and Insana16; the descriptor used in this article adds the notion of spatial registration.)
Obtaining a spatially registered virtual detector is accomplished using the sound speed estimator developed by Anderson and Trahey.7 The method uses individual channel receive data to determine the sound speed integrated over the transducer’s shadow as well as a lateral and axial point from which the wave originated.
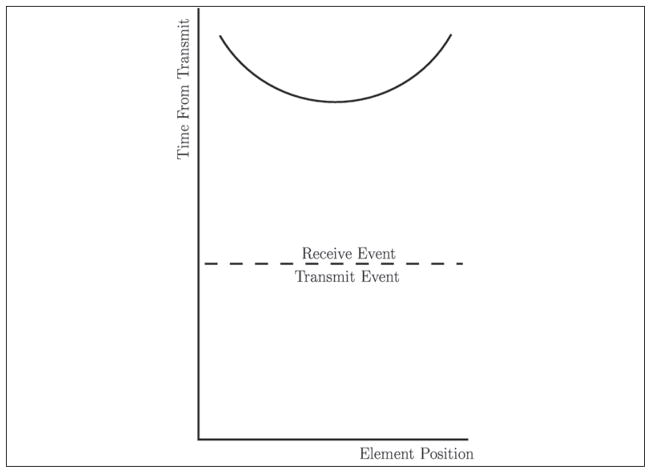
Specifically, the algorithm works in the following manner. First, a conventionally focused beam is transmitted, and the received data are acquired from each individual channel. Then, single-channel cross-correlations are performed to determine the time delays between adjacent channels. Next, the adjacent channel delays are summed cumulatively across the array (larger channel lags could be incorporated into future algorithm realizations). These cumulatively summed delays are then isolated from the transmit event by subtracting half the delay of the leading edge of the curve from the entire delay profile. This is seen in Figure 1. The profile is described by the classic delay equation
Figure 1.
This figure shows the reconstructed delay profile after the channel data have been correlated and the delays cumulatively summed, but before the effect of the transmit event has been removed. The transmit event describes the time the wave travels before reaching the target, and the receive event describes the propagation time for the return trip back to the transducer.
| (1) |
where c is the mean sound speed of the medium, and xt, yt, and zt represent the azimuthal, elevational, and axial dimensions, respectively, of the wave’s origin in the medium. The delay profile is then squared, yielding
| (2) |
where
Finally, the coefficients of this equation can be found using a least squares fit, and the desired parameters c and xt can be isolated; zt can also be isolated when yt is assumed to be negligible.
At this point, the algorithm has obtained all the necessary information to be called a spatially registered virtual detector consisting of the spatial location of the detector as well as the information to calculate the receive delay profile for the detector. This process is then repeated for other points in the field. The selection of the points is controlled by transmit focusing and axial windowing.
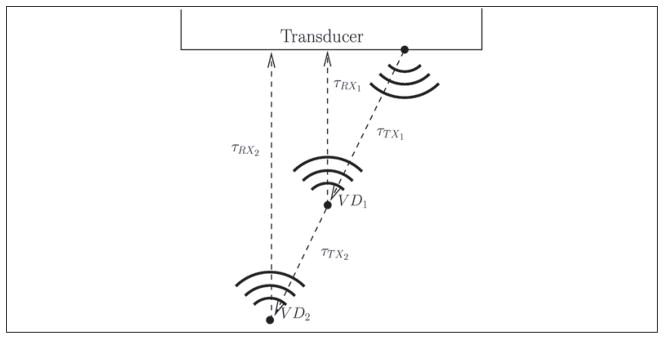
The purpose of the second stage of the algorithm is to acquire the time-of-flight between any two spatially registered virtual detectors. This is accomplished by propagating a spherical wave between two previously acquired registered virtual detectors. The origin of the spherical wave is the point of intersection of the transducer face and the line formed by the two spatially registered virtual detectors. From the intersection, a spherical wave—with origin at the intersection—is emitted, and the delay profiles corresponding to each of the virtual detectors are used to beam-form the received signal. The beamformed received data are then envelope detected; the time corresponding to the maximum value from each of the beamformed lines will coincide with the emitted spherical wave’s complete time-of-flight. The complete time-of-flight is the time from emission through the virtual detector and finally back to the transducer. From the complete time-of-flight through each spatially registered virtual detector, the local time-of-flight between the virtual detectors can be calculated. This is seen in Figure 2, from which the equation for the time-of-flight is apparent and is
Figure 2.
This figure demonstrates a potential geometry of two virtual detectors (each denoted by VD) and the transducer. The time delays are indicated by τTXi for the time from the transducer surface to the virtual detector and τTXi for the time from the virtual detector to the transducer’s surface.
| (3) |
where τVDi is the complete time-of-flight for the spherical wave scattering from the virtual detector, τTXi is the time it takes the spherical wave to reach the ith virtual detector from the transducer, and τRXi is the time it takes the wave to travel from the ith virtual detector to the transducer. τRXi is known from the first part of the algorithm: τRXi is the time of the leading edge of the profile obtained during application of the Anderson-Trahey method. This means the local time-of-flight is calculable and is described by the equation
| (4) |
where the virtual sources are numbered in the order the spherical wave passes them.
Knowing the time-of-flight between virtual detectors and the position of the virtual detectors gives a distance and time measure relating the two detectors. Using this information, it becomes trivial to directly calculate a local sound speed estimate.
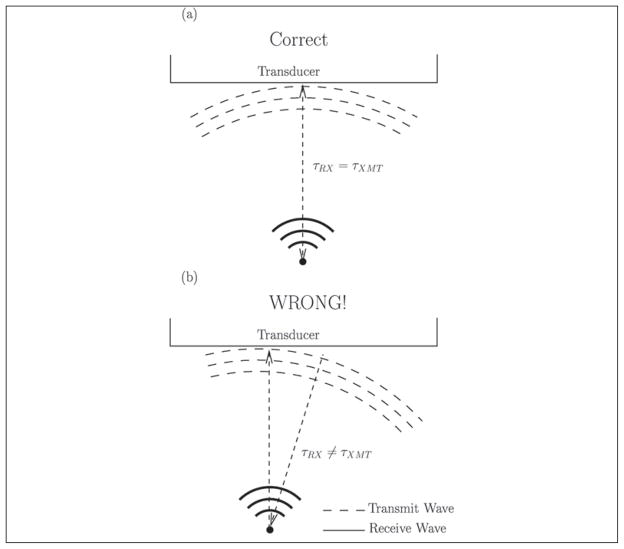
Before continuing, it is necessary to step back to the first part of the algorithm where spatial registration is performed. To obtain an accurate estimate of τRXi, the transmit beam used for the registration step of the algorithm (which can be synthetically or conventionally beamformed) must be transmitted toward the virtual detector orthogonal to the transducer’s face. If this does not occur, then several problems arise—specifically, when half of the transmit distance between the leading edge of the received delay profile is removed, the profile is positioned at an incorrect location and the values produced by the Anderson-Trahey method become less exact. The error is compounded because it changes the value of τRXi, which causes the time-of-flight to be calculated incorrectly, which is seen in Figure 3. This means there is often the requirement for an additional iteration of the Anderson-Trahey method for each virtual detector to ensure correct detector registration. (To apply the algorithm to other transducer geometries [e.g., phased or curvilinear arrays], a pre-steering can be applied to the channel data to make the transducer appear linear.)
Figure 3.
This figure demonstrates the necessity for transmit iteration. If the transmit beam is not transmitted directly toward the virtual source orthogonal to the transducer, as in b, it is not possible to correctly determine τRX. When the beam is transmitted orthogonally, as in a, τRX is the same as τTX and can be found as described.
Implementation
To make transmit iteration and the transmission of the spherical wave more convenient, we implemented the algorithm using a synthetic aperture transmit scheme. Transmit iteration only involves the first portion of the algorithm and proceeds as follows. The data were acquired synthetically as done by others.17–20 The synthetically acquired data sets are combined to create a conventional transmit beam. The transmit beam is then processed with the Anderson-Trahey method to acquire a mean sound speed and the wave’s point of origin. Using this point of origin and sound speed, the synthetically transmitted data sets are recombined to create a second conventional transmit beam. This transmit beam is processed with the Anderson-Trahey method again, and the algorithm proceeds as described previously.
In addition, by acquiring the data as a synthetic aperture set, the data from each possible spherical wave have already been acquired. Since the data have already been acquired, the virtual detector delays are applied just to the appropriate transmit position.
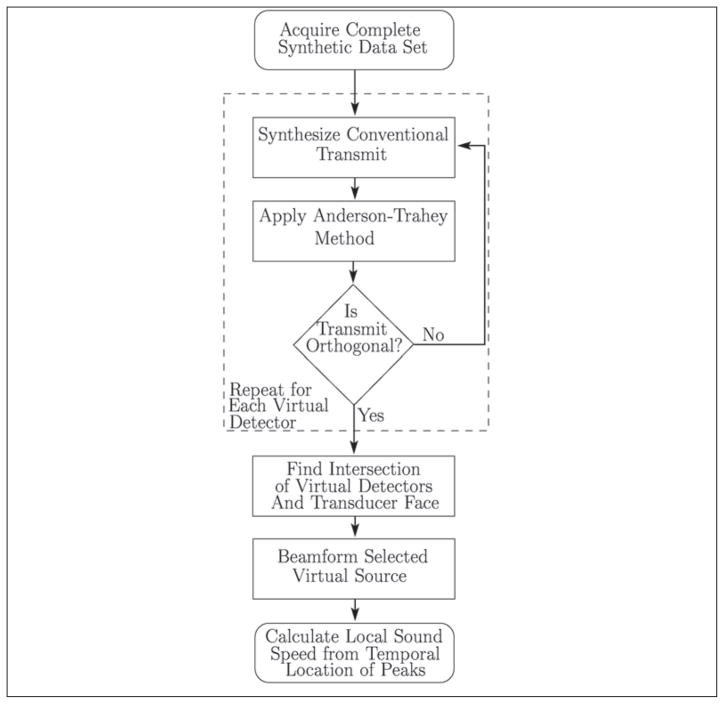
A synthetic aperture implementation is also convenient for investigating the impact of refraction from layers. Several strategies for handling refraction and the subsequent results are described in the appendix. The sound speed algorithm with no refraction correction is shown graphically in Figure 4.
Figure 4.
This figure summarizes the algorithm graphically for the case where the local sound speed estimate is calculated ignoring possible refractive effects.
Simulations
Simulations were performed to test the limits of the proposed algorithm. The simulations demonstrate the performance of the algorithm as a sound speed estimator and the Anderson-Trahey method’s performance in spatial registration. The simulations were performed in a similar manner to those performed by Anderson and Trahey.7 Simulations were accomplished by applying Fermat’s principle of least time for wave propagation. For the simple case here, the most exact formulation of Fermat’s principle is not necessary, and only the path of shortest propagation time is considered. The two sources of error investigated are multiple sound speed layers and signal-to-noise ratio.
The simulations were done by calculating the delay profile based on the desired geometry. The geometries simulated consisted of two- and three-layer geometries oriented parallel to the transducer face.
The equation for a delay profile for a wave returning from a point in space in a homogeneous medium is shown in (1). A two-layer delay profile is more complicated to calculate but can be done analytically. In the two-layer case, the time for propagation from an element to a target via an intermediate point is described by
| (5) |
where x indicates the lateral coordinates, z indicates the axial coordinates, and e, i, and t are subscripts indicating the element, the interface, and the target variable, respectively. In addition, c1 is the sound speed in the first medium, and c2 is the sound speed in the second medium. The geometry for (5) is shown in Figure 5. From Fermat’s principle, the interest lies in calculating the minimum time for a wave to propagate between the transducer and the target. To calculate the intermediate lateral position with a known axial position, the derivative of (5) with respect to the lateral intermediate position is taken and set to 0.
Figure 5.
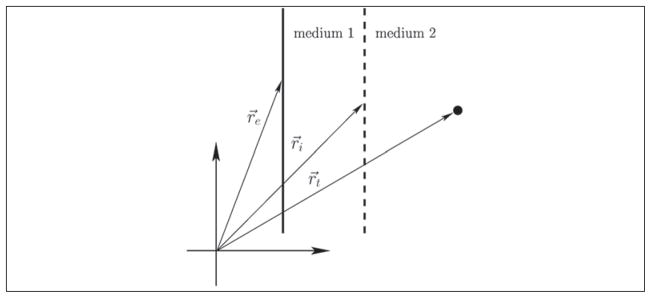
This figure demonstrates the geometry for calculating the two-layer delay profile. The solid line shows the position of the transducer whose element positions are described by re, where j indexes the transducer element. There is an interface position for each element position, which is described by ri. The lateral component of ri is what is actually found by finding the roots of equation (7). The wave’s point of origin is described by rt.
By rearranging the terms, a quartic polynomial for xi is found.
where
The delay calculation for the two-layer case is an application of Snell’s law with an unknown point of incidence. For the inhomogeneous delay calculation, all the parameters are given except the lateral position of the interface. There will be four solutions for the lateral interface xi. The solution of interest is the real root that minimizes the time it takes for the wave to travel from the element to the target. By solving this equation for each element position in the transducer and recording the time from transducer element to the target, the two-layer delay profile is found.
A simulated receive profile from a three-layered parallel medium can also be calculated from a three-layered version of (5). To simulate three layers, the correct lateral positions where a ray would cross between the two sets of interfaces must be found. Again, this will be the set of lateral positions that produce the minimum time-of-flight between the target position and the element position. The time-of-flight from the target to the element was minimized using the Nelder-Mead simplex algorithm as implemented in MATLAB.21 (This approach using the Nelder-Mead algorithm could be extended to more than three layers.)
Using the calculated delay profiles as the basis for the simulations, two types of simulations were run. The first set of simulations examined the Anderson-Trahey method’s performance for spatial registration. The second set of simulations examined the new algorithm’s ability to estimate sound speed in complex media. In both simulations, different noise levels were simulated and then combined with the simulated receive delay profiles to test the performance of the algorithm. To test the effect of the signal-to-noise ratio, a set of normal uncorrelated random values was produced with a standard deviation predicted by the Cramer-Rao lower bound for a cross-correlation estimator.22 The array of normally distributed random values was cumulatively summed (to mimic the Anderson-Trahey algorithm) and then added to the base delay profile. The now noisy delay profiles were used to test the algorithm’s ability to register points in the presence of noise and to calculate sound speed. In addition, the time-of-flight was calculated in an identical manner as that used on the experimental data. The level of noise applied to the single-channel data was applied to the simulated RF data, taking into account the noise reduction encountered from delay and sum beamforming and the noise increase encountered from beam-forming only single virtual source transmit. For each noise and geometric configuration, 10,000 realizations were simulated. The methods are an adaptation of the simulations done by Anderson and Trahey.7 The parameters for the simulation were chosen to, as much as possible, mimic the physical validation.
The simulations were performed with an F/# of 2, a center frequency of 5.3 MHz, and bandwidth of 70%. The window length was 2.81 μs, and the correlation between channels was 1. The target position and the interface position of the two media were varied. The sound speed of the first medium was always 1480 m/s, and the sound speed of the second medium was always 1540 m/s. For three-layer simulations, an initial layer was added to the simulation. The initial layer was always 2.5 mm thick. First-layer sound speeds of 1000 m/s and 1500 m/s were evaluated.
Experimental Validation
To complement the simulation studies, the algorithm was also tested experimentally with several phantom configurations. The phantoms consisted of two wire targets located on the transducer’s axial axis at depths near 21 and 33 mm. The phantoms’ targets in one instance consisted of a thin copper wire and in another a single fiber of synthetic thread. The copper target was 180 μm, and the nylon fiber had a mean thickness of 24 μm and a standard deviation of 5 μm. The copper targets were used to create a high signal-to-noise ratio (SNR) scenario, and the nylon fiber targets were used to validate off-axis targets and to create a relatively lower SNR scenario. (The method for SNR measurement will be described later.)
Using the wire and the nylon phantoms, the sound speed between the two wires was measured for a homogeneous (water) medium and for several inhomogeneous (DB-grade castor oil on water) phantoms. The DB-grade castor oil (Rutherford Chemicals, Bayonne, New Jersey) and water were chosen because they have readily available, highly accurate sound speeds available in the literature as functions of temperature and pressure.23,24 As an example, at 20°C and standard pressure (100 kPa), the sound speed difference between water and castor oil is approximately 22.5 m/s. The water and oil were allowed to sit for over 24 hours before the experiment.
The inhomogeneous phantoms were arranged as an oil layer on top of a water layer with oil layer thicknesses between 5 and 12 mm. The setup is shown in Figure 6. The data were collected using a Siemens SONOLINE Antares ultrasound scanner (Siemens Healthcare Sector, Ultrasound Business Unit, Mountain View, California). The Antares scanner and a VF7-3 ultrasonic transducer were programmed to emit 5.3-MHz multielement spherical virtual sources.18,20 The virtual sources were 11-element-wide spherical emissions with an F/# of −0.75. (The negative F/# indicates a focal point behind the transducer surface.) The multielement synthetic aperture implementation and 5.3-MHz center frequency were used to ensure adequate SNR. The DB-grade castor oil was attenuating, which resulted in lower SNRs in phantoms with thick oil layers.
Figure 6.
This figure shows the experimental validation of the algorithm. The lens is shown because it acts as an additional layer in the model. The oil layer was varied, and the wire targets were positioned at 21 and 33 mm.
For each virtual source emission, the received data on each transducer channel were recorded and saved at 40 MHz using a user research interface.25 The acquisition sequence produced a full data set for the medium in question in about 40 seconds. The full data set comprised 182 virtual source transmissions and reception of 192 individual channels.
The complete data set was used to form conventional transmits with an F/# of 2. The initial assumed sound speed for the conventionally focused transmit beams was 1540 m/s, but the average of the two sound speeds calculated using the Anderson and Trahey7 method were used to beamform the conventionally focused transmits in the second iteration of the transmit procedure discussed above. In addition to the lateral windowing provided by the formation of a conventional focus, an axial window was also applied to select the location of the virtual detector. The same axial window was applied to the detected data used for the time-of-flight calculation. Applying the window to the detected data is not a restrictive assumption, since the same window is applied to find the virtual detector, so the return signal from the spherical emission must come from the windowed depth.
A Digi-Sense thermocouple thermometer (Cole Parmer, Chicago, Illinois) was used during the course of the experiment. The thermometer tip was placed in between the two wire targets, and it was assumed that the temperature gradient throughout the medium was negligible. The ambient pressure at the Raleigh-Durham International airport was used, which is located about 19 km away. The ambient pressure was updated every hour. In addition, the phantom was set into a water bath. The water bath temperature was monitored and controlled by a Polystat temperature controller (Cole Parmer), allowing the phantom temperature to be influenced and held constant.
There is one more issue of note for the validation phantom. The phantom appears to consist of a two-layer geometry with a planar interface at various angles and depths. However, the phantom is more complex because there is also an acoustic lens. There are models for acoustic lens correction; recently Krücker et al.10 demonstrated a geometric acoustic model that improved their method’s performance. The problem with a lens model and subsequent correction is the lack of prior knowledge of the first interface between the lens and the medium. It is possible to provide some initial estimate of the first layer’s sound speed and iteratively correct for the lens, but in our case, this is unnecessary. The effect of the uncorrected lens actually provides an additional level of complexity to our phantom. Effectively, on consideration of the lens, the phantom becomes three layers. To show that the lens does exhibit an effect on the data, the results are shown for the Anderson-Trahey method and the proposed method with and without lens correction. Lens correction results are shown for the copper wire target phantom, and lens correction is performed based on the speed of sound in water calculated from the temperature and the pressure.
SNR estimation for the different phantom cases was accomplished by assuming that the underlying noise process was ergodic, and the wire targets produced negligible axial clutter. The noise was then estimated from the standard deviation of 5 μs of data (sampled at 40 MHz) split evenly on both sides of the wire target. In addition, the data for the noise realization were taken at least 2.5 μs away from the peak echo returning from a given wire. The signal power was estimated as the root mean square (RMS) over 1 μs of data centered on the detected pulse’s peak.
Results
Simulation Results
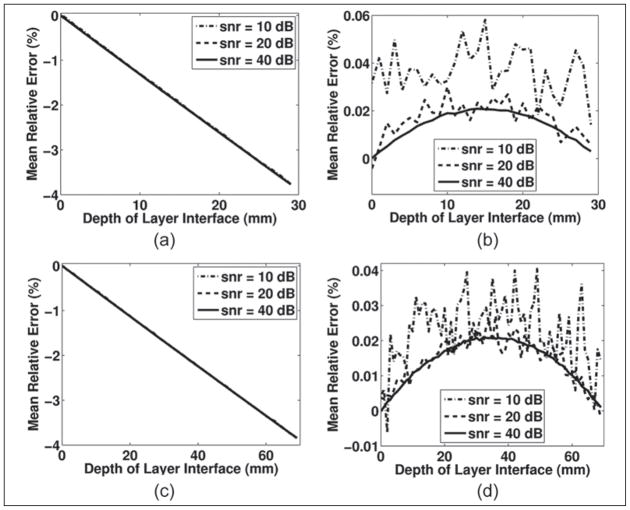
Simulation results in Figure 7 demonstrate the Anderson-Trahey estimator’s inability to accurately estimate the sound speed in a two-layer geometry (Figure 7a,c) but still accurately register a target in the field (Figure 7b,d). The simulation results show the case for targets positioned at 3 and 7 cm and a constant F/# of 2. The simulated sound speed estimates are nearly identical for both target positions, and the sound speed estimation error is great enough that the effect of the different SNRs simulated is not noticeable. The results in Figure 7 also show the effect of target position on the axial position estimate. The position estimates primarily differ for the lowest SNR case. For the case with lowest SNR, it is not unexpected that the target positioned at 3 cm would perform worse because the smaller aperture (due to the constant F/#) at 3 cm means that there are fewer elements contributing to the polynomial fit and the effect of the noise is more pronounced. However, as the SNR increases, the size of the aperture becomes less important. The results also show, for the jitter limited case, that SNR itself becomes less important as SNR increases. From the simulation, this level is near 20 dB, although the SNR level where the algorithm becomes geometrically limited is probably underestimated because the noise powers were simulated using the Cramer-Rao bound. Regardless, somewhere near 20 dB SNR, the algorithm’s performance becomes limited by the structure of the inhomogeneous media investigated, which is explored with additional simulations to be discussed shortly.
Figure 7.
These four plots show simulation results for the two-layer inhomogeneous media. Graphs a and b show results for the target located at 3 cm axially. Graph a shows the mean relative percent error compared with the sound speed of the second layer as a function of the layer interface depth. Graph b shows the relative error of the axial position estimation as a function of the interface depth. Graphs c and d show the simulation results for a target located at 7 cm. Graph c shows the sound speed simulations, and graph d shows the axial registration error.
The simulation results in Figure 7 also show the underlying geometric error limitation of the algorithm, which is specifically seen in Figure 7b,d. In these figures, as the SNR increases, the underlying pattern for the measurement-limiting error emerges. The limiting error will be geometry dependent. The spatial registration is the worst when the interface between the media is near the midpoint between the transducer and the target, which is expected since either the dt or the de term in (7) will be at a minimum when the interface between the layers is near the target or the transducer face. When the terms of orders higher than 2 have their highest influence, the quadratic polynomial fit from the Anderson-Trahey method will be a poor model for the true delay profile.
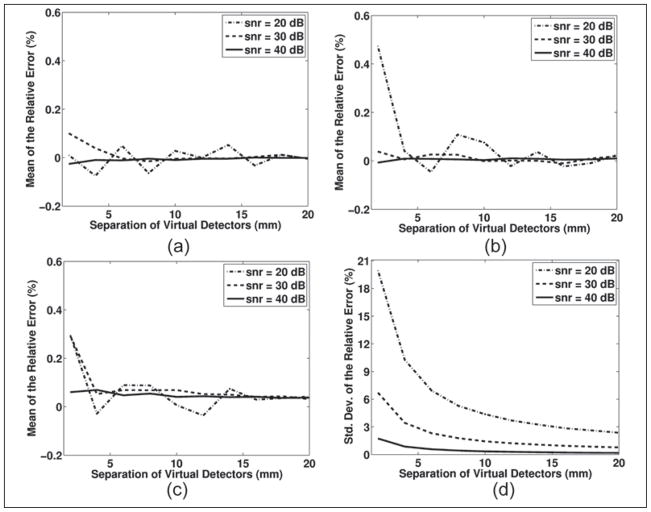
Simulations of the proposed method to estimate local sound speed are shown in Figure 8, which shows the performance of the proposed method in homogeneous and two-layer geometries. In this figure, three different geometries are shown. Figure 8a shows the results in a homogeneous medium, and Figure 8b,c shows results in two different layered media. The figure shows that a very slight bias develops based on geometry, but the variance of the estimates is independent of geometry and only dependent on SNR.
Figure 8.
The results for the local speed of sound estimation simulations for a homogeneous and two two-layer media are shown. Graphs a, b, and c show the mean (bias) of the relative error for sound speeds measured in the deepest layer of the one- or two-layered media. The fourth graph, d, shows the standard deviation of the relative error for all three simulations since the standard deviation was visually indistinguishable between the cases. The first layer is 1480 m/s, and the second layer is 1540 m/s. The location of the interface between the two-layer cases is at 9 mm in graph b and 19 mm in graph c. The first target is located at 20 mm, and the second target is varied, as shown in the independent axis on the graphs. The separation between the two targets always indicates a second target location that is deeper than the 20-mm fixed reference target.
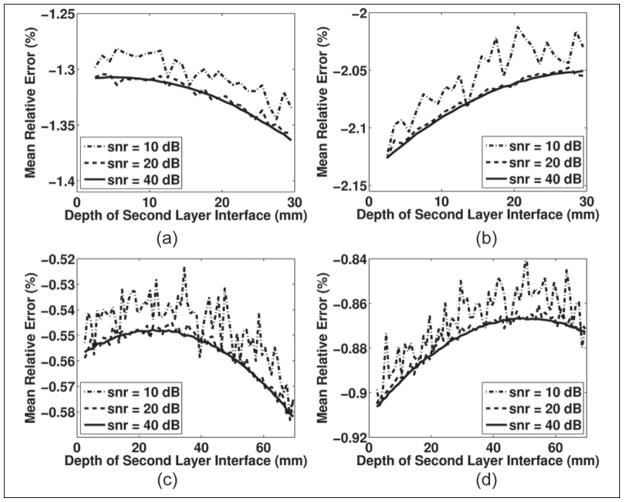
The effect of complex geometry is explored further in Figure 9, which shows the spatial registration errors associated with adding an additional layer. In this figure, the sound speed estimates are not shown because they resemble the sound speed estimates shown in Figure 7a,c. The axial registration error is shown for two target locations and for two different initial sound speeds. The third layer is added at the beginning and is always 2.5 mm thick. In the first case, the new layer is set to 1000 m/s, mirroring an acoustic lens (Figure 9a,c), and in the second case, the layer is set to 1500 m/s, mirroring a more physiological initial sound speed (Figure 9b,d). The results indicate that there is a large increase in error with the introduction of a third layer. The results in Figure 9 also indicate that the order of relative sound speed magnitudes between the layers is important. Figure 9b,d indicates that having a lower sound speed sandwiched between two higher sound speeds has more impact on axial registration than when the sound speeds increase with depth, as in Figure 9a,c (even if the sound speeds are otherwise closer in magnitude).
Figure 9.
These graphs show the axial spatial registration results for the three-layered simulations. Across the top row, graphs a and b show the error associated with registering a target at 3 cm. The first layer has a sound speed of 1000 m/s in graph a and 1500 m/s in graph b. The first layer is always fixed at 2.5 mm. The second layer is variable and corresponds to the value on the independent axis. The graphs across the bottom row show a similar geometry and sound speed in each layer, but the point being registered is located 7 cm away from the simulated transducer. The results are reported as the mean of the relative error compared with each target position.
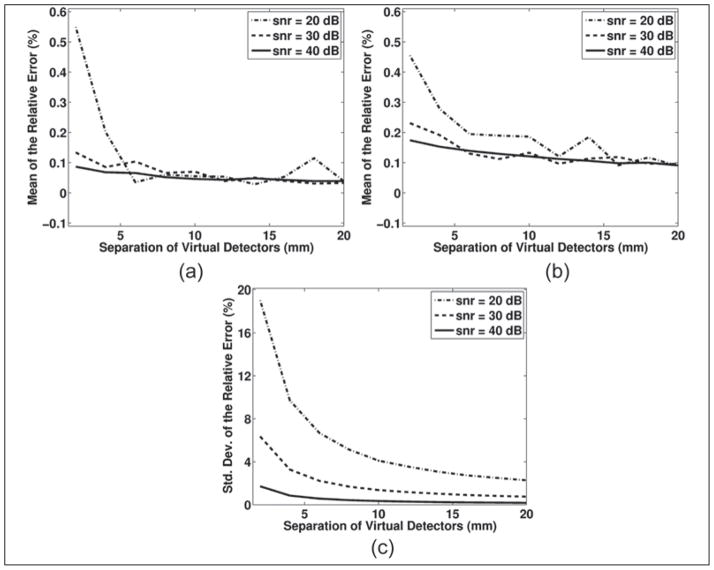
Local sound speed estimates were also simulated in three-layer geometries and are shown in Figure 10. The simulations in this figure demonstrate the same trends seen in the two-layer simulations, which are a geometry-dependent bias and an SNR-dependent variance. All of the local sound speed estimation simulations, in both Figures 8 and 10, show that as the virtual detector separation is increased, the bias and standard deviation decrease.
Figure 10.
The results for the local speed of sound estimation simulations for a three-layer configuration are shown in this figure. The top graph, a, shows the mean of the relative error for sound speeds measured in the bottom layer of the three-layer media. For the simulations, the first layer was 2.5 mm thick and had a sound speed of 1000 m/s, the second layer was 7 mm and 1480 m/s, and the bottom layer was 1540 m/s and had a thickness that contained both targets. The second plot, b, shows the same thing except the middle layer is 17 mm thick. The bottom plot, c, shows the standard deviation of the relative error for graph b. The standard deviation is not shown for graph a since it was visually indistinguishable from the standard deviations shown in graph c. In both sets of simulations, the depth of the first target was 20 mm. The depth of the second target is shown on the independent axis and represents the amount of additional distance the target is from the transducer face relative to the first target at 20 mm.
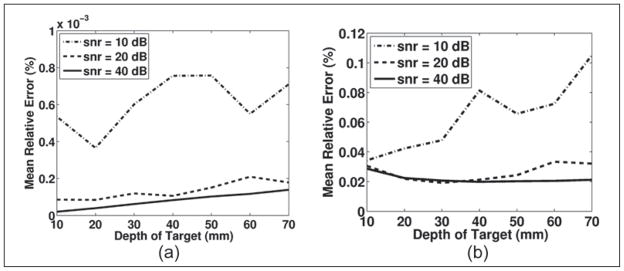
To complete the simulations, a last figure for registration error, Figure 11, demonstrates error as a function of depth with a constant aperture size and a constant F/#. In these simulations, the interface between the two layers is always halfway between the transducer and the target, which is the geometry with the worst registration error. The results show that even for high SNR, as target depth increases, the algorithm’s performance decreases. In the constant F/# case shown in Figure 11a, the algorithm’s performance degradation is an extremely subtle effect and even in low SNR cases should not be expected to greatly reduce the performance of the algorithm. Figure 11b shows the case where the aperture is held constant with increasing depth. The aperture size used for these simulations was 1.5 cm. In this case, the effect of SNR with depth and the subsequent error is very apparent. However, when adequate SNR is available, even a small aperture can be used at depth.
Figure 11.
These two plots show the simulation results for registering a point in a two-layer inhomogeneous medium. In each case, the interface between the two sound speed layers is located at half the distance between the target and the transducer face. In graph a, the aperture size was held constant at 1.5 cm. Graph b shows the simulation results except the F/# is held constant at 2.
Experimental Results
The results for the physical validation demonstrate the algorithm’s performance in both a high SNR scenario and a low SNR scenario. The results for the sound speed algorithm when the phantom comprises the copper wire target (high SNR) are shown in Table 1. The table shows the expected sound speed based on temperature and pressure in both the castor oil and the water. The table also shows the absolute measured sound speed using the algorithm, as well as the percent difference and standard deviations relative to the literature-predicted sound speed in water. (The percent difference is the most appropriate metric of comparison because it removes any false change of sound speed that would be present from the fluctuation of temperature in the media over the acquisition of the data sets.) The results presented in Table 1 also demonstrate the data processed with and without an acoustic lens, and the results indicate that the algorithm is affected by the additional layer. The data in general show that in a high SNR case, there is little effect from a two-layer geometry on sound speeds, but they also show that there is more error when a three-layer geometry is tested. None of the results from the copper wire phantom used refraction correction.
Table 1.
Experimental Results (Copper Wire)
| Medium | Literature-Predicted Cwater, m/s | Literature-Predicted Coil, m/s | Local Estimate between Targets, m/s | Error Relative to Cwater, m/s (%) | Standard Deviation of Local Error, m/s (%) |
|---|---|---|---|---|---|
| With lens | |||||
| Water only | 1483.9 | NA | 1487.1 | 3.18 (0.21) | 10.3 (0.69) |
| Castor oil (6 mm) on water | 1489.1 | 1498.2 | 1476.2 | −13.00 (−.88) | 1.04 (0.071) |
| Castor oil (11 mm) on water | 1492.4 | 1494.7 | 1478.8 | −13.64 (−0.91) | 1.19 (0.080) |
| Lens removed | |||||
| Water only | 1483.9 | NA | 1482.4 | −1.44 (−0.097) | 6.44 (0.43) |
| Castor oil (6 mm) on water | 1489.1 | 1498.2 | 1491.5 | 2.27 (0.15) | 0.89 (0.060) |
| Castor oil (11 mm) on water | 1492.4 | 1494.7 | 1493.0 | 0.62 (0.041) | 1.05 (0.070) |
NA = Not applicable
The results for the nylon target (lower SNR) case are presented similarly in Table 2 and are also processed without considering refraction. The results for the low SNR case show similar agreement with the expected value of water from the literature. The mean error and standard deviations are generally larger than those seen with the copper wire, which is consistent with the simulations. A few caveats to this trend do confound analysis. There were experimental challenges with creating the same temperature and pressure between the two cases, and temperature has a significant impact on the difference in sound speed between the layers. In addition, the water-only scenario performs better using the nylon fiber phantom, which is inconsistent with the simulation results. However, from observation of the data, it appears that the results from the copper wire phantom were influenced by the long returning pulse due to reverberation within the wire. This artifact was less noticeable in the castor oil possibly from increased attenuation.
Table 2.
Experimental Results (Nylon Fiber)
| Medium | Literature-Predicted Cwater, m/s | Literature-Predicted Coil, m/s | Local Estimate between Targets, m/s | Error Relative to Cwater, m/s (%) | Standard Deviation of Local Error, m/s (%) |
|---|---|---|---|---|---|
| Water only | 1474.1 | NA | 1475.0 | 0.05 (0.0032) | 1.04 (0.071) |
| Castor oil (5 mm) on water | 1472.1 | 1515.5 | 1482.2 | −10.16 (−0.69) | 0.41 (0.028) |
| Castor oil (7 mm) on water | 1472.2 | 1515.4 | 1485.2 | −13.38 (−0.91) | 1.90 (0.129) |
| Castor oil (10 mm) on water | 1472.7 | 1514.9 | 1489.4 | −16.70 (−1.12) | 1.69 (0.12) |
| Castor oil (12 mm) on water | 1474.1 | 1513.6 | 1489.8 | −15.77 (−1.07) | 7.17 (0.49) |
NA = Not applicable
The SNR for the different validation cases can be seen in Table 3, which shows the SNR for a single centered receive channel for transmit focused data. The simulation results indicate that SNR manifests itself as estimator variance, which should be higher in the nylon fiber phantom. The reduced performance with the thicker oil layers is a combination of a decrease in SNR due to the oil layer as well as an increase in complexity of the phantom geometry.
Table 3.
Signal-to-Noise (SNR) Estimates
| Medium | SNR Target 1, dB | SNR Target 2, dB |
|---|---|---|
| Copper target | ||
| Water only | 54.5 ± 0.4 | 60.5 ± 0.6 |
| Castor oil (6 mm) | 53.5 ± 0.7 | 58.5 ± 0.7 |
| Castor oil (11 mm) | 44.1 ± 0.5 | 45.6 ± 0.5 |
| Nylon target | ||
| Water only | 38.0 ± 0.4 | 46.0 ± 0.4 |
| Castor oil (5 mm) | 33.4 ± 0.6 | 40.2 ± 0.5 |
| Castor oil (7 mm) | 30.8 ± 0.5 | 37.2 ± 0.5 |
| Castor oil (10 mm) | 26.2 ± 0.6 | 32.6 ± 0.4 |
| Castor oil (12 mm) | 24.3 ± 0.4 | 30.5 ± 0.5 |
Discussion
The results indicate that for the geometries tested, the algorithm presented is less affected by multilayered sound speed geometries than previous methods. However, the results also suggest that the algorithm does perform worse as the complexity of the geometry increases.
The simulations also demonstrate that, for cases simulated, the estimated axial position is nearly independent of the medium when the relative scales of the error and the size of the medium are considered. The explanation for the nearly position-invariant behavior is expected from (2). The axial position is a function of the medium’s mean sound speed and the average return time-of-flight corrected for the azimuthal location of the target. Stated in an alternative way, the time-of-flight at each transducer element is proportional to the sound speed for the path between the target and the transducer element, because the signal arriving at each element originates from the same location the arrival time differences are dependent on the path-dependent sound speed. Because the estimated sound speed represents the average speed along each path, the sound speed dependence is removed by adaptively using the mean sound speed, and a nearly invariant axial position emerges. Similar logic holds for the lateral position, but lateral position estimates are even less affected by the geometries tested here.
The simulations also demonstrate that the axial estimates are robust in the presence of SNR levels commonly encountered in ultrasonic applications. This is important because it suggests sound speed measurements are feasible at large depths. In addition, it suggests that sound speed measurements may be possible with high F/#. Both could prove useful if it was deemed desirable to create sound speed maps with a significant field of view.
Besides performance improvements from larger aperture size, there also would be the traditional improvement (and SNR decrease) from increasing the center frequency of the transmitted wave. Besides the standard trade-off between center frequency and SNR, an additional trade-off exists between sound speed accuracy and axial sound speed resolution. Axial resolution is a function of virtual detector separation. As the separation decreases, the resolution of the measurement increases, but registration error has an increased effect on the sound speed calculation.
Only the axial resolution of the algorithm has been evaluated in this study, and the relevant results were shown in Figure 8. Strictly speaking, the axial resolution of the method is limited by the resolution of the imaging system, but the simulations show that any realizable resolution will be significantly higher, probably 5 to 10 mm or more. The lateral resolution, which was not evaluated, is expected to be limited only by the receive beamforming. An important future task for the method outlined here is to design and construct an appropriate phantom to empirically evaluate the complete resolution of the algorithm.
It is important to note that the low error seen in the simulations was not attainable with the experimental validation. Simulations like those performed in this work that rely on the Cramer-Rao bound are optimistic. In addition, it may be the case that the castor oil has some additional effect on the wave propagation that is not appropriately accounted for in the simulation method or the algorithm.
Because of the challenge of constructing phantoms with irregular layers with well-characterized sound speeds, this scenario was not evaluated here. However, it was evaluated by Anderson and Trahey,7 who showed that near-field phase screens cause an increase in estimation variance, which is consistent with applying least squares to data corrupted by correlated noise. Other aberration effects such as distributed aberration would cause decorrelation of the channel data, which increases the correlation jitter, leading to lower effective SNR.
The final source of error that will be discussed is motion. To discuss motion, it is important to consider two limiting realizations of the algorithm. The first algorithm realization of interest is the fully synthetic implementation. By implementing the algorithm synthetically, all motion has been fixed within the data. (In the synthetic aperture implementation here, motion can be considered a true phase screen,26 which was investigated in the context of the Anderson-Trahey method with good results.7) However, because of the many emissions required to acquire a complete data set, there could be a significant systematic motion artifact in a single direction that may be more difficult to accommodate. In the case of a synthetic aperture implementation in the presence of motion, the absolute point of registration has less meaning, although it loses no meaning within the data set. The second limiting realization of the algorithm is to transmit in a conventional manner. In this realization, a sound speed measurement could be made in as few as three transmissions, when it is unnecessary to perform transmit iteration. When transmit iteration is required—in a minimally refractive medium—it would likely take only five transmissions to acquire a localized sound speed estimate. By realizing the algorithm in this manner, the spatial registration of the virtual detector is ensured to have an absolute positional registration relative to the transducer. However, there is more likely to be unrecorded motion between registration of the virtual detectors and transmission of the spherical time-of-flight wave.
Conclusions
An algorithm for calculating the local sound speed has been presented. Validation of the method has been shown in homogeneous media as well as in a two-layer geometry. The simulations indicate that the algorithm likely performs better than previously proposed algorithms when resolved sound speed measurements are desired. While the phantom validation does indicate the feasibility of implementing the algorithm on available system architecture, the phantoms used in the validation do not definitively allow a statement that the new algorithm is clearly better than the few algorithms that have biases on the order of 1% (or better as is the case with tomography methods). Creating new phantoms that allow more specific and challenging tests of the algorithm is an area of future research and should allow for better understanding of relative performance between different algorithms.
In addition, the results indicate that even in low SNR cases, the algorithm meets the requirements suggested by others for distinguishing tissue types. In addition to the improved sound speed estimation, the results indicate that the use of registered virtual detectors may be useful for general registration of features within an ultrasonic field.
The algorithm still needs to be validated in diffuse media, which will probably have higher variance. However, with some increase in sophistication, the algorithm should work in complex diffuse media, as there is no fundamental assumption or restriction in the algorithm that suggests it will not be feasible.
Acknowledgments
The authors thank Dr. Borislav Tomov, Dr. Svetoslav Nikolov, and Dr. Jeremy Dahl for their help in acquiring the data used here.
Funding
The author(s) disclosed receipt of the following financial support for the research, authorship, and/or publication of this article: This work was supported by The Whitaker Scholars and Fellows Program, the NIH by grant T32EB001040, and by 26-04-024 from the Danish Science Foundations.
Appendix—A Note on Handling Refraction
Thus far, refractive effects have been ignored, but in order for the algorithm to work in complex media, there must be a way to appropriately address refraction. A refraction-based error will occur any time the line passing through both virtual detectors does not intersect the spherical wave perpendicularly. The refraction error itself can be most easily understood in a limiting case of the algorithm in a homogeneous medium. If the algorithm were to choose to emit the wrong spherical source, which, rather than passing along the line intersecting the virtual detectors, passes along a different line, the resulting sound speed estimate will be biased up toward higher sound speeds since the perceived time-of-flight will be reduced. Since refractive effects are common during wave propagation, the algorithm should be able to handle refraction.27
To manage refraction, three methods are tested. The first method is to ignore refraction. This assumes that the effect of refraction is minimal. The second and third methods assume refraction may be nonnegligible; both methods make an effort to correct for refraction. These two methods determine the local velocity by finding the functional relationship between emission origin and sound speed. The two methods accomplish this by beamforming and calculating the local sound speed from spherical emission origins to either side of the origin predicted assuming no refraction. For each method, the correct sound speed will be the minimum of the sound speed as a function of emission position because this will describe the spherical emission that intersected the path between the two virtual detectors most perpendicularly. The emission that intersects the two virtual detectors most closely along the line between them will have the longest time-of-flight and the slowest velocity. (The caveat is that the medium around the virtual detectors—while allowed to be inhomogeneous—cannot possess some exotic continuous velocity gradient that results in a deflection of the wave.) The second method proposed here for finding the correct sound speed looks for the slowest velocity when the original virtual source origin of emission as well as nearby emissions is beamformed and processed using the proposed algorithm. Again, the second method would take the slowest estimated velocity from all of the processed virtual sources as the best estimate of the local sound speed. The third proposed method considers that at small angles, the projection of a line onto some background in two-dimensional space will appear parabolic. Since the results are expected to be parabolic, the sound speed estimates from beamforming nearby virtual sources as well as the virtual source selected by ray tracing are fit to an analytic quadratic polynomial using least squares methods. The minimum sound speed is then the sound speed at the zero point of the first derivative of the quadratic equation.
To test the three methods, data were acquired using the setup shown in Figure 4, except that the transducer was positioned at angles between 11.3° and 32.3° relative to the oil and water layers. (Experimentally, it was not possible to get a large angle when the castor oil was present. When the transducer’s angle was much higher than 20° in a medium with castor oil, there was no observable reflection from either wire target.) It should be pointed out that under this configuration, the phantom no longer consists of three parallel layers. The interface between the oil and water layer and the lens and water layer is no longer parallel.
The performance of the three different local sound speed estimation algorithms is shown in Table 4. The results demonstrate for all but the largest angle tested that there was no improvement between tracing a direct line between the sources and attempting to calculate the minimum analytically from a parabolic function fit to the data. Both methods outperformed the method of selecting the minimum sound speed as the best estimate. This last method of using the minimum sound speed tended to perform poorly because adjacent virtual sources are not expected to calculate large differences in sound speed since the lateral offset is small (the size of a transducer element). Therefore, the minimum value is more influenced by noise than a real physical minimum sound speed.
Table 4.
Angled Experimental Results
| Medium | Literature-Predicted Cwater, m/s | Literature-Predicted Coil, m/s | Local Estimate between Targets, m/s
|
Error Relative to Cwater, %
|
Standard Deviation of Local Error, %
|
|---|---|---|---|---|---|
| Meth 1/Meth 2/Meth 3 | Meth 1/Meth 2/Meth 3 | Meth 1/Meth 2/Meth 3 | |||
| Water only (angle 16.2°) | 1473.3 | NA | 1461.1/1458.1/1460.2 | 0.83/1.04/0.89 | 0.032/0.045/0.36 |
| Water only (angle 32.3°) | 1474.7 | NA | 1513.7/1449.0/1476.0 | −2.64/1.74/−0.090 | 0.075/0.217/0.074 |
| Castor oil on water (angle 11.3°) | 1473.1 | 1514.5 | 1469.4/1465.0/1469.4 | 0.25/.55/.25 | 0.28/0.24/0.25 |
| Castor oil on water (angle 19.0°) | 1474.2 | 1513.5 | 1463.0/1458.0/1463.4 | 0.76/1.10/0.73 | 0.27/0.18/0.18 |
Meth 1 = ignore refraction; Meth 2 = select minimum value; Meth 3 = calculate minimum analytically. NA = Not applicable
Footnotes
Declaration of Conflicting Interests
The author(s) declared no potential conflicts of interest with respect to the research, authorship, and/or publication of this article.
References
- 1.Goss SA, Johnston RL, Dunn F. Comprehensive compilation of empirical ultrasonic properties of mammalian tissues. J Acoust Soc Am. 1978;64:423–45. doi: 10.1121/1.382016. [DOI] [PubMed] [Google Scholar]
- 2.Goss SA, Johnston RL, Dunn F. Compilation of empirical ultrasonic properties of mammalian tissues, II. J Acoust Soc Am. 1980;68:93–108. doi: 10.1121/1.384509. [DOI] [PubMed] [Google Scholar]
- 3.Robinson D, Ophir J, Wilson L, Chen C. Pulse-echo ultrasound speed measurements: progress and prospects. Ultrasound Med Biol. 1991;17:633–46. doi: 10.1016/0301-5629(91)90034-t. [DOI] [PubMed] [Google Scholar]
- 4.Greenleaf JF, Johnson SA, Bahn RC, Rajagopalan B. Quantitative cross-sectional imaging of ultrasound parameters, in 1977. IEEE Ultrason Symp. 1977:989–95. [Google Scholar]
- 5.Carson PL, Meyer CR, Scherzinger AL, Oughton TV. Breast imaging in coronal planes with simultaneous pulse echo and transmission ultrasound. Science. 1981;214:1141–3. doi: 10.1126/science.7302585. [DOI] [PubMed] [Google Scholar]
- 6.Duric N, Littrup P, Poulo L, Babkin A, Pevzner R, Holsapple E, et al. Detection of breast cancer with ultrasound tomography: first results with the computed ultrasound risk evaluation (cure) prototype. Med Phys. 2007;34:773–85. doi: 10.1118/1.2432161. [DOI] [PubMed] [Google Scholar]
- 7.Anderson ME, Trahey GE. The direct estimation of sound speed using pulse-echo ultrasound. J Acoust Soc Am. 1998;104:3099–106. doi: 10.1121/1.423889. [DOI] [PubMed] [Google Scholar]
- 8.Pereira FR, Machado JC, Pereira WC. Ultrasonic wave speed measurement using the time-delay profile of rf-backscattered signals: simulation and experimental results. J Acoust Soc Am. 2002;111:1445–53. doi: 10.1121/1.1445787. [DOI] [PubMed] [Google Scholar]
- 9.Kolkman RGM, Steenbergen W, van Leeuwen TG. Reflection mode of photoacoustic measurement of speed of sound. Opt Express. 2007;15:3291–300. doi: 10.1364/oe.15.003291. [DOI] [PubMed] [Google Scholar]
- 10.Krücker JF, Fowlkes JB, Carson PL. Sound speed estimation using automatic ultrasound image registration. IEEE Trans Ultrason Ferroelectr Freq Control. 2004;51:1095–106. doi: 10.1109/tuffc.2004.1334842. [DOI] [PubMed] [Google Scholar]
- 11.de Sousa AVG, de Albuquerque Pereira WC, Machado JC. An ultrasonic theoretical and experimental approach to determine thickness and wave speed in layered media. IEEE Trans Ultrason Ferroelectr Freq Control. 2007;54:386–93. doi: 10.1109/tuffc.2007.252. [DOI] [PubMed] [Google Scholar]
- 12.Leydier A, Matthieu J, Despaux G. The two coupling fluids method for ultrasonic velocity measurement: application to biological tissues. Meas Sci Technol. 2009;20:1–6. [Google Scholar]
- 13.Ammann J-J, Apablaza V, Galaz B, Flores C. Ultrasonic sound velocity measurement in samples of soft materials through under-resonance excitation. Ultrasound Med Biol. 2005;31:485–91. doi: 10.1016/j.ultrasmedbio.2004.12.021. [DOI] [PubMed] [Google Scholar]
- 14.Anderson M, McKeag M, Gauss R, Soo M, Trahey G. Application of sound speed estimation and mapping to multi-layer media and in vivo data. IEEE Ultrason Symp. 1998;2:1393–6. [Google Scholar]
- 15.Byram BC, Jensen JA. A novel method for direct localized sound speed measurement using the virtual source paradigm. IEEE Ultrason Symp. 2007:232–5. [Google Scholar]
- 16.Zemp R, Insana MF. Imaging with unfocused regions of focused ultrasound beams. J Acoust Soc Am. 2007;121:1491–8. doi: 10.1121/1.2434247. [DOI] [PMC free article] [PubMed] [Google Scholar]
- 17.Nock LF, Trahey GE. Synthetic receive aperture imaging with phase correction for motion and for tissue inhomogeneities—part I: basic principles. IEEE Trans Ultrason Ferroelectr Freq Control. 1992;39:489–95. doi: 10.1109/58.148539. [DOI] [PubMed] [Google Scholar]
- 18.Karaman M, Li P-C, O’Donnell M. Synthetic aperture imaging for small scale systems. IEEE Trans Ultrason Ferroelectr Freq Control. 1995;42:429–42. [Google Scholar]
- 19.O’Donnell M, Thomas LJ. Efficient synthetic aperture imaging from a circular aperture with possible application to catheter-based imaging. IEEE Trans Ultrason Ferroelectr Freq Control. 1992;39:366–80. doi: 10.1109/58.143171. [DOI] [PubMed] [Google Scholar]
- 20.Nikolov SI, Jensen JA. In-vivo synthetic aperture flow imaging in medical ultrasound. IEEE Trans Ultrason Ferroelectr Freq Control. 2003;50:848–56. doi: 10.1109/tuffc.2003.1214504. [DOI] [PubMed] [Google Scholar]
- 21.Lagarias JC, Reeds JA, Wright MH, Wright PE. Convergence properties of the Nelder-Mead simplex method in low dimensions. SIAM J Optim. 1998;9:112–47. [Google Scholar]
- 22.Walker W, Trahey G. A fundamental limit on delay estimation using partially correlated speckle signals. IEEE Trans Ultrason Ferroelectr Freq Control. 1995;42:301–8. [Google Scholar]
- 23.Wong GS, Zhu S-M. Speed of sound in seawater as a function of salinity, temperature, and pressure. J Acoust Soc Am. 1995;97:1732–6. [Google Scholar]
- 24.Timme R. Speed of sound in castor oil. J Acoust Soc Am. 1972;52:989–92. [Google Scholar]
- 25.Brunke S, Insana M, Dahl J, Hansen C, Ashfaq M, Ermert H. An ultrasound research interface for a clinical system. IEEE Trans Ultrason Ferroelectr Freq Control. 2007;54:198–210. doi: 10.1109/tuffc.2007.226. [DOI] [PubMed] [Google Scholar]
- 26.Trahey G, Nock L. Synthetic receive aperture imaging with phase correction for motion and for tissue inhomogeneities—part II: effects of and correction for motion. IEEE Trans Ultrason Ferroelectr Freq Control. 1992;39:496–501. doi: 10.1109/58.148540. [DOI] [PubMed] [Google Scholar]
- 27.Paul J, LaFollette S, Ziskin MC. Geometric and intensity distortion in echography. Ultrasound Med Biol. 1986;12:953–63. doi: 10.1016/0301-5629(86)90064-5. [DOI] [PubMed] [Google Scholar]


