Abstract
Purpose
The aim of the study was to compare primary total hip arthroplasty (THA) implantations between different countries in terms of THA number per inhabitant, age, and procedure type and to compare the survival curve including all THAs using hip arthroplasty registers.
Methods
THA registers were compared between different countries with respect to the number of primary implantations per inhabitant and age, procedure type and survival curve. We performed a literature search for all national hip arthroplasty registers providing annual reports for 2009 or, if not available, a more recent period. The data from these reports were analysed in terms of number, age distribution and procedure type of primary THAs and survival curves.
Results
We identified nine hip arthroplasty registers, which comprised sufficient data to be included. A large variation was found in the annual number of primary THA implantations per inhabitant. The procedure type varied greatly as well, e.g. in Sweden 67 % are cemented THAs whereas in Emilia-Romagna (Italy) 89 % are cementless THAs.
Conclusions
This study revealed large differences in terms of the annual number of primary THAs per inhabitant and primary THA procedure type across countries. These data can be used to rank local primary THA implantations within an international context.
Introduction
Hip arthroplasty registers which collect data on primary and revision hip arthroplasty have become established or are in development in more and more countries [1–3]. The main object of arthroplasty registers is to assess the outcome of arthroplasties with regard to implant-related factors, surgical technique and patient-related factors by evaluating arthroplasty survival curves yielding to the development of more accurate concepts or classification systems [1, 4, 5]. In this way, implant choice, surgical technique and indications can be optimised to improve the outcome of arthroplasty. According to the literature the Swedish Hip Arthroplasty Register has significantly contributed to a reduction of revision rates by evaluating the annual feedback of outcome data from the register, which has impelled most clinics to use safer and well-documented implants and develop an optimal surgical technique [4]. Arthroplasty registers seek to include all patients of certain countries and, thus, in contrast to clinical studies, no patient-related or hospital-related bias exists. Furthermore, registers involve a great number of patients and therefore deliver results with better validity by better reproducibility of findings over a shorter period of time than clinical studies, which is underlined by various publications in this field [6–12].
There is one study in the literature which evaluated the feasibility of comparing survival rates of specific hip prosthesis systems using data from more than one register [2]. This study arrived at the conclusion that a comparison between registers could be only performed incompletely because of lack of data and/or heterogeneous reporting. However, to date no study has analysed data on the medical treatment with primary total hip arthroplasties (THAs) and the survival curve comprising all THAs in different countries/regions.
The aim of this study was therefore to compare primary THA implantations between different countries in terms of THA number per inhabitant and age and procedure type and to compare the survival curve including all THAs using hip arthroplasty registers.
Materials and methods
We carried out a Google search using the terms “arthroplasty” and “register” or “registry” and studied literature on arthroplasty registers [1, 2] and the European Arthroplasty Register website [13] to identify national hip arthroplasty registers. These hip registers were carefully scanned for annual reports from 2009 or, if not available, the most recent documented period. The data from these reports were analysed in terms of number, age distribution and procedure type of primary THAs and survival curves. The nine arthroplasty registers [14–22] listed in Table 1 were identified as those which comprise the data mentioned above.
Table 1.
Arthroplasty registers including time periods of total hip arthroplasty (THA) number, THA age distribution, THA procedure type and THA survival/revision data considered in the present study
| Register | Total THA number | THA age distribution | THA procedure type | THA survival/revision data |
|---|---|---|---|---|
| Australian Orthopaedic Association National Joint Replacement Registry [6] | 2009 | 2009 | 2009 | 1999-2009 (resurfacing THAs are separately considered) |
| Danish Hip Arthroplasty Register (in Danish) [7] | 2009 | 1995–2009 | 2009 | 1995–2009 |
| Emilia-Romagna Register of Orthopaedic Prosthetic Implants [8] | 2009 | 2000–2009 | 2009 | 2000–2009 (resurfacing THAs are separately considered) |
| National Joint Registry for England and Wales [9] | 2009 | 2009 | 2009 | 2003–2009 |
| New Zealand Joint Registry [10] | 2009 | 1999–2009 | 2009 | 1999–2009 |
| Norwegian Arthroplasty Register [11] | 2009 | 2009 | 2009 | 1987–1990, 1994–1996, 1997–1999, 2000–2002 (more time periods are reported but not used in the present study) |
| Portuguese Arthroplasty Register [12] | 2009/2010 (50 % data coverage) | 2009/2010 (50 % data coverage; including hemiarthroplasty) | 2009/2010 (50 % data coverage) | n.a. |
| Slovak Arthroplasty Register (in Slovakian) [13] | 2008 | 2008 | 2008 | only for specific implants available |
| Swedish Hip Arthroplasty Register [14] | 2009 | 1992–2009 | 2009 | 1979–1991, 1992–2009 |
Eight registers operate on a national basis; the Emilia-Romagna Register of Orthopaedic Prosthetic Implants refers to the region of Emilia-Romagna in Italy. All registers except for the Portuguese register claimed to achieve a very high compliance with all country’s arthroplasty operations. The Portuguese registers covered approximately 50 % of all arthroplasties, i.e. their reported numbers were doubled before they were evaluated.
The registers’ time periods considered in the present study are summarised in Table 1. The time periods of the number, age distribution and procedure type span one year except for the age distribution, where four of the nine registers only reported data for a long time span. The Swedish register presented the longest survival history beginning in 1979. The Swedish and Norwegian registers showed the survival curves for different historical periods (Sweden: 1979–1991, 1992–2009; Norway: 1987–1990, 1991–1993, 1994–1996, 1997–1999, 2000–2002, 2003–2005, 2006–2009); in our study the most recent period was used except for 1991–1993, 2003–2005 and 2006–2009 in Norway because these periods showed worse results than the earlier periods.
Almost every register used a different age classification; in our study the classification from the New Zealand register, which divided the patients into the four classes younger than 55 years, 55–64 years, 65–74 years and older than or equal to 75 years, was applied. If these age classes could not be directly derived from the register data linear interpolation was used. The THA numbers were normalised by national population estimates at the mean, mid, end or beginning (whichever was first available) of the corresponding register period. The population data were obtained from official state agencies [23–31].
According to the registers THAs can be distinguished regarding the type of procedure into cemented, cementless, hybrid (cemented femur and cementless acetabulum), reverse hybrid (cemented acetabulum and cementless femur), and resurfacing THAs. In most registers, hybrid and reverse hybrid THAs were pooled together as hybrid THAs and resurfacing THAs were not considered as a separate procedure type. Thus, in our study we designated three fixation groups: cemented, cementless and hybrid; reversed hybrid and resurfacing THAs were assumed as hybrid THAs, if they were separately documented. In addition, the primary resurfacing THA number was collected, if reported.
The survival rate with revision as the definition of failure endpoint or the cumulative revision rate was estimated using the Kaplan-Meier method in all registers. Survival rate and cumulative revision rate are the direct complements (in probability) [14], so that they can be interchangeable. The survival curve for all THAs, i.e. including all patient ages, implant types, diagnoses, etc., with revision as failure endpoint was evaluated in our study, since these data were available from all registers with a small exception for Australia and Emilia-Romagna. The registers of Australia and Emilia-Romagna analysed the survival of conventional and resurfacing THAs separately; for both registers the survival of conventional THAs was evaluated in our study since they had a much larger number than resurfacing THAs.
Results
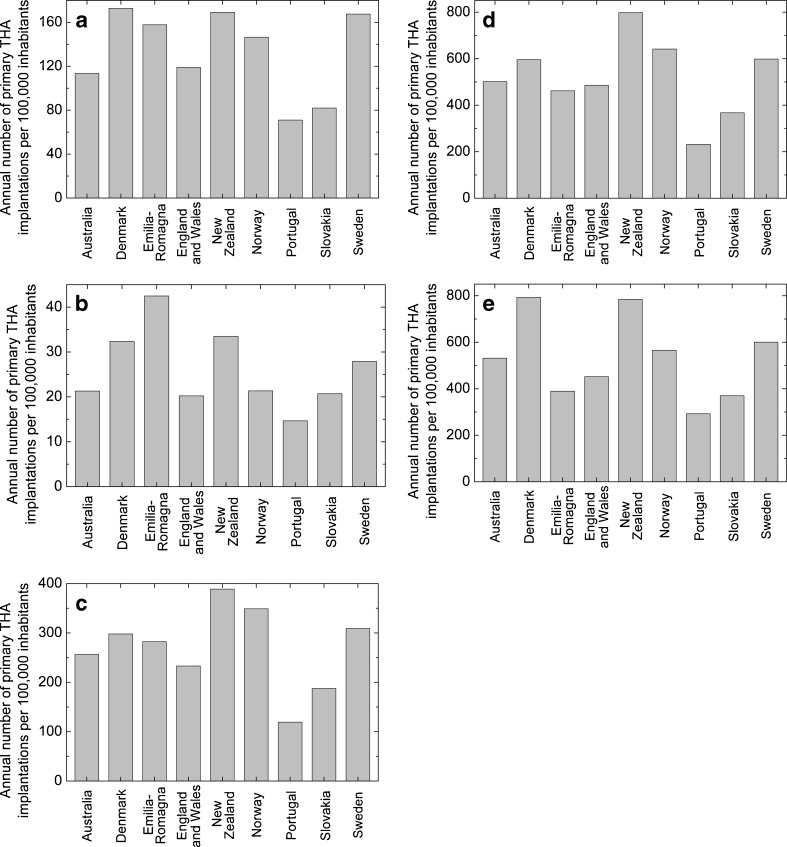
The comparisons of the annual primary THA number per 100,000 inhabitants between countries for all ages, persons younger than 55 years, 55–64 years, 65–74 years and older than or equal to 75 years are shown in Fig. 1a, b, c, d and e, respectively. On average (over countries) the annual number of primary THAs per 100,000 inhabitants is 133 for all ages, 26 for persons younger than 55 years, 269 for persons 55–64 years, 520 for persons 65–74 years and 531 for persons older than or equal to 75 years. Portugal had the lowest primary THA number for all age groups. There was a maximum variation of more than the ratio 2.5 for all age groups between the countries. The highest variation was found for the age group 55–64 years, between New Zealand and Portugal with the ratio 3.4.
Fig. 1.
a Annual total number of primary total hip arthroplasty (THA) implantations per 100,000 inhabitants. b Annual number of primary total hip arthroplasty (THA) implantations per 100,000 inhabitants for persons younger than 55 years. c Annual number of primary total hip arthroplasty (THA) implantations per 100,000 inhabitants for persons between 55 and 64 years. d Annual number of primary total hip arthroplasty (THA) implantations per 100,000 inhabitants for persons between 65 and 74 years. e Annual number of primary total hip arthroplasty (THA) implantations per 100,000 inhabitants for persons older than or equal to 75 years
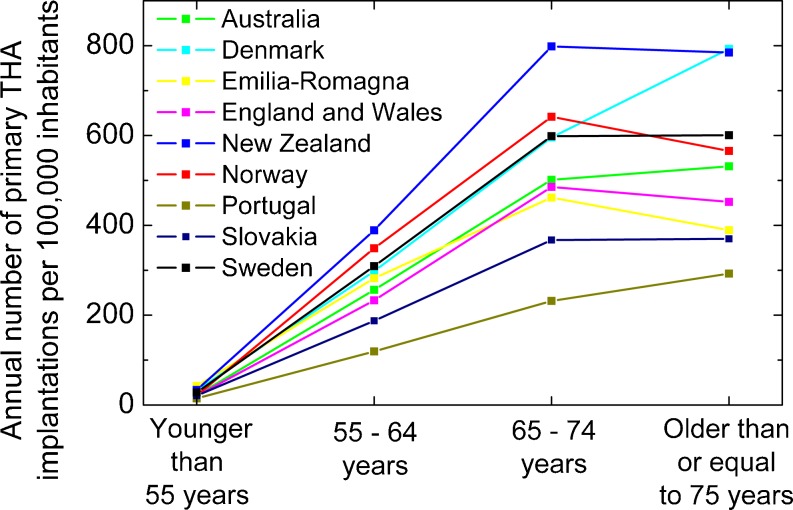
The change of the annual primary THA number with age is plotted in Fig. 2. The primary THA number showed an almost linear increase over age group within the first three age groups, i.e. until the age of 74 years, in all countries/regions. However, different behaviours across countries were found between the two oldest age groups; the number of primary THAs per inhabitant continued to increase almost linearly in Denmark and Portugal, dropped significantly in Emilia-Romagna and Norway and remained almost constant in other countries between 65 and 74 years, and older than or equal to 75 years.
Fig. 2.
Annual number of primary total hip arthroplasty (THA) implantations per 100,000 inhabitants vs. age group
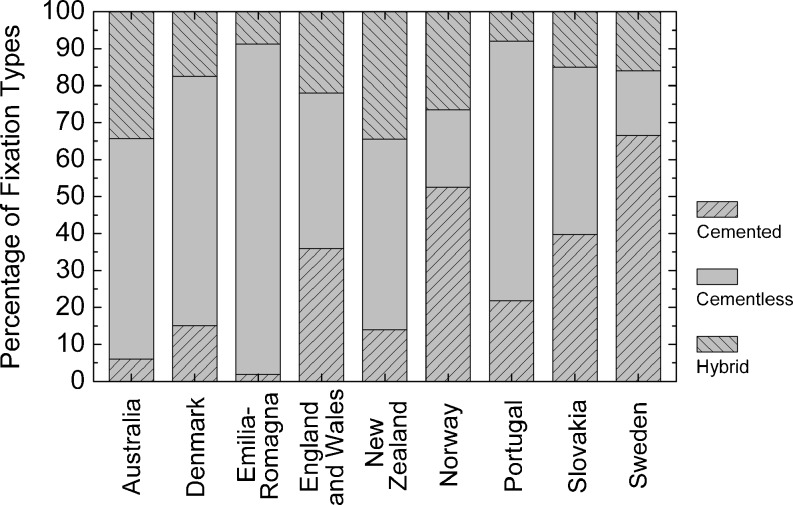
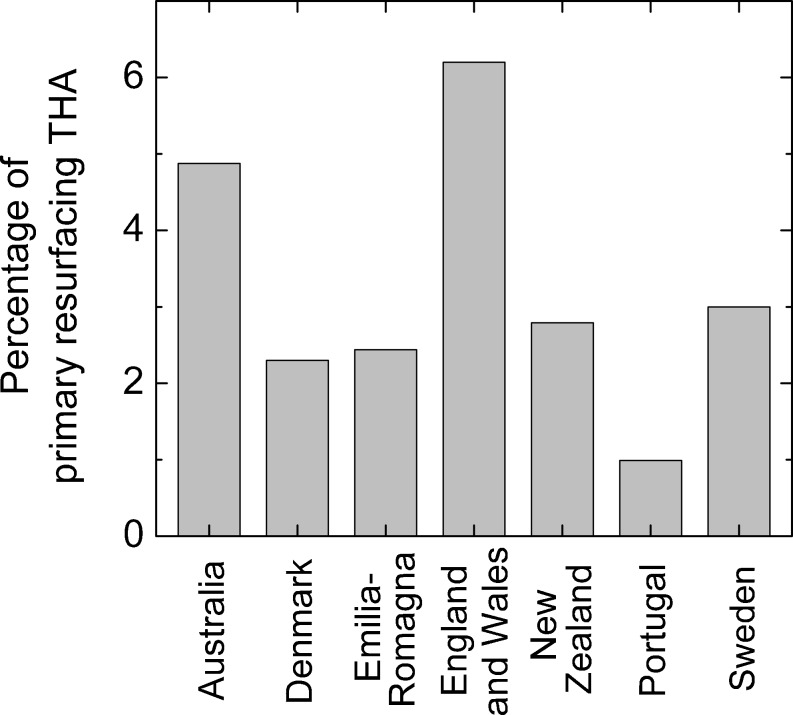
Figure 3 shows the fixation type distribution of primary THAs in the different countries. Cementless fixation dominated with a share of over 50 % in Australia, Denmark, Emilia-Romagna, New Zealand, and Portugal. In contrast, cemented fixation dominated with a share of over 50 % in Sweden and Norway. Cemented and cementless fixation had a similar percentage in England and Wales and Slovakia. Hybrid fixation showed a more uniform share across countries, which ranged between 8 % in Portugal and 34.5 % in New Zealand. Primary resurfacing THAs were not separately documented in Norway and Slovakia. Their percentage in the other countries is depicted in Fig. 4; it varied from approximately 1 % in Portugal, between 2 % and 3 % in Denmark, Emilia-Romagna, New Zealand and Sweden to approximately 5 % and 6 % in Australia and England and Wales, respectively.
Fig. 3.
Fixation type distribution of primary total hip arthroplasties (THAs)
Fig. 4.
Percentage of primary resurfacing total hip arthroplasties (THAs)
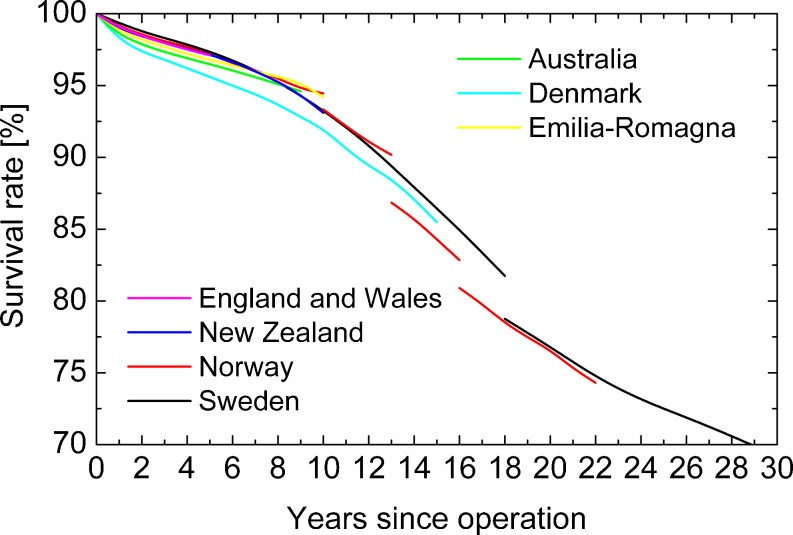
The countries’ Kaplan-Meier survival curves including all THAs are plotted in Fig. 5. Denmark showed the lowest survival rate within the first 15 years; however, THAs implanted from 2006 to 2009 in Norway (not plotted, see Materials and Methods section) also showed similar low survival rates. All survival curves except for Denmark never varied more than 1 % within the first nine years. Please note that all THAs were included in these survival curves, independent of patient age, prosthesis type, diagnoses, etc. Thus, the simple comparison from Fig. 5 is biased by confounding variables and no conclusion about the outcome should be drawn from such a simple comparison. Instead, multivariate or subgroup analyses are necessary to compare survival curves, as described in the discussion section.
Fig. 5.
Kaplan-Meier survival curve including all total hip arthroplasties (THAs) with revision as failure endpoint
Discussion
The annual number of primary THA implantations per inhabitant differed strongly across countries (Fig. 1a, b, c, d and e). One possible reason is the different expenditures on health of the countries’ health systems, e.g. Portugal and Slovakia had the lowest annual expenditures on health per capita in 2009 [32] as well as the lowest primary THA numbers of all countries considered. However, e.g. the annual expenditure per capita of Portugal (2,409 USD) was almost at the same level as in New Zealand (2.629 USD) in 2009 [32], but the number of primary THAs differed more than the ratio 2:1 between both countries in all age groups. This means that the countries’ expenditures on health cannot be the only explanation for the differences across countries.
At first glance, it might be surprising that, for example, Denmark has lower primary THA numbers per inhabitant than New Zealand in almost all age groups but a higher total primary THA number per inhabitant. The reason is the different population distribution in both countries, which is used to weight the THA numbers per age to calculate the total value. There are (relative to the total population) 27 % more persons aged 65 years or older in Denmark than in New Zealand. Since elderly people have the highest primary THA numbers, a higher percentage of old age groups (in relation to the total population) leads to a higher total primary THA number per inhabitant.
The change in the number of primary THAs with age varied across countries as well (Fig. 2), e.g. Emilia-Romagna had the highest THA number per inhabitant for young persons under 55 years of age but the third lowest for persons older than or equal to 75 years. Particularly large variations across countries were found between the two oldest age groups considered (65–74 years; older than or equal to 75 years); some countries showed a strong increase, some a strong decrease and some almost no change in primary THA number between both groups. In summary, large variations in the annual number of primary THAs were found across countries and their reason remains for the most part unexplained.
In addition, there were very large differences across countries in terms of the THA fixation type (Fig. 3) and the use of resurfacing THAs (Fig. 4). The fixation type differed between 2 % cemented and 89 % cementless fixation in Emilia-Romagna and 67 % cemented and 17 % cementless fixation in Sweden. This fact expresses Sweden’s exceptional position regarding the use of cemented THAs, which is especially noteworthy because the Swedish arthroplasty register is probably the most cited register. The survival curves including all THAs showed no large variations across countries (Fig. 5), although, for example, the fixation type varied largely across countries. Based on the similar survival curves it can be concluded that the countries considered in our study have a similar high quality standard in the field of THA.
A more in-depth analysis of the survival curves across countries could not be performed in the study, since only the survival curve comprising all THAs without any adjustment for influencing factors was available from all registers. It is well established that age and gender have an influence on the survival of THAs; however, other variables such as body mass index (BMI), pre-operative condition (American Society of Anaesthesiologists [ASA] class), diagnosis, fixation type, patient physical status, and type of provider were also found to significantly affect the risk of revision [14, 16, 17, 22]. All these influencing factors are confounders in the comparison between survival curves. In order to overcome this confounding, comparisons between survival curves should be done using Cox multivariate or subgroup analyses, which adjust the results for influencing factors [33]. Such adjustments could not be done in our study because the registers do not report survival data depending on influencing factors such as age and gender or use different classifications.
Several registers report adjusted comparisons. The Australian register included the most comprehensive survival analysis with adjustments for age and gender by using the Cox multivariate analysis and by applying age and gender subgroups. Procedure types, patient physical status and type of provider were compared and adjusted for influencing factors using the Cox multivariate analysis in the register of England and Wales. Cox multivariate analyses were mentioned in the running text by the Swedish register to evaluate a few factors. New Zealand and Denmark applied age subgrouping to compare fixation types. Comparisons of survival curves without any adjustment for influencing factors such as age and gender should be regarded with caution.
It should be noted that only a long time period regarding the THA age distribution was provided in four registers (see Table 1), and these THA age distributions were related to the total THA number and population in 2009 to calculate the THA number per inhabitant and age in our study. Furthermore, the time periods on which the survival curves are based differed between the registers (see Table 1). It is known from registers [19, 22] that THAs implanted in the 1980s and early 1990s achieved lower survival rates than more recently implanted THAs. The survival curves from Fig. 2 from Sweden and Norway at more than 18 and 13 years, respectively, were from THAs implanted before 1991 and 1996, respectively. Thus, it is expected that currently implanted THAs have higher survival rates in the long term than plotted in Fig. 5 for Sweden and Norway. It is not well established whether this trend still persists, i.e. that the choice of the time period affects the survival curves for more recent time periods. Survival rates are only presented in diagrams in the registers from Denmark, Norway and Sweden and, thus, the accuracy of their readings is limited. A statistical meta-analysis of the survival curves could not be performed, since such an analysis needs a confidence interval or the standard deviation which are, however, numerically only given in the registers of Australia, Emilia-Romagna and England and Wales.
In conclusion, our study revealed large differences in terms of the annual number of primary THAs per inhabitant and primary THA procedure type across countries. These data on primary THAs summarised in the study can be used to rank local primary THA implantations within an international context. The survival curves including all THAs were found to be similar for all countries. In order to allow for a thorough multivariate meta-analysis of the survival across countries a standardisation of influencing factors is necessary and the survival data must be numerically presented as a function of these factors including a confidence interval or the standard deviation. The standardisation involves the definition of important influencing factors, which can be implant-related, surgical related or patient-related, and their classification. As a minimum requirement, different age classes with the same classification and gender need to be considered in all registers.
Acknowledgments
Conflict of interest
All authors of this manuscript declare that they have no financial and personal relationships with other people or organisations that could inappropriately influence (bias) this work such as employment, consultancies, stock ownership, honoraria, paid expert testimony, patent applications/ registrations, and grants or other funding.
References
- 1.Kolling C, Simmen BR, Labek G, Goldhahn J. Key factors for a successful national arthroplasty register. J Bone Jt Surg Br. 2007;89B:1567–1573. doi: 10.1302/0301-620X.89B12.19409. [DOI] [PubMed] [Google Scholar]
- 2.Migliore A, Perrini MR, Romanini E, Fella D, Cavallo A, Cerbo M, Jefferson T. Comparison of the performance of hip implants with data from different arthroplasty registers. J Bone Jt Surg Br. 2009;91B:1545–1549. doi: 10.1302/0301-620X.91B12.22692. [DOI] [PubMed] [Google Scholar]
- 3.Stea S, Bordini B, Clerico M, Petropulacos K, Toni A. First hip arthroplasty register in Italy: 55,000 cases and 7 year follow-up. Int Orthop. 2009;33(2):339–46. doi: 10.1007/s00264-007-0465-z. [DOI] [PMC free article] [PubMed] [Google Scholar]
- 4.Herberts P, Malchau H. Long-term registration has improved the quality of hip replacement—A review of the Swedish THR Register comparing 160,000 cases. Acta Orthop Scand. 2000;71:111–121. doi: 10.1080/000164700317413067. [DOI] [PubMed] [Google Scholar]
- 5.Labek G, Janda W, Agreiter M, Schuh R, Böhler N. Organisation, data evaluation, interpretation and effect of arthroplasty register data on the outcome in terms of revision rate in total hip arthroplasty. Int Orthop. 2011;35(2):157–163. doi: 10.1007/s00264-010-1131-4. [DOI] [PMC free article] [PubMed] [Google Scholar]
- 6.Schuh R, Neumann D, Rauf R, Hofstaetter J, Boehler N, Labek G (2012) Revision rate of Birmingham Hip Resurfacing arthroplasty: comparison of published literature and arthroplasty register data. Int Orthop 36(7):1349–1354 [DOI] [PMC free article] [PubMed]
- 7.Schuh R, Dorninger G, Agreiter M, Boehler N, Labek G. Validity of published outcome data concerning anatomic graduated component total knee arthroplasty: a structured literature review including arthroplasty register data. Int Orthop. 2012;36(1):51–6. doi: 10.1007/s00264-011-1255-1. [DOI] [PMC free article] [PubMed] [Google Scholar]
- 8.Labek G, Frischhut S, Schlichtherle R, Williams A, Thaler M. Outcome of the cementless Taperloc stem: a comprehensive literature review including arthroplasty register data. Acta Orthop. 2011;82(2):143–148. doi: 10.3109/17453674.2011.570668. [DOI] [PMC free article] [PubMed] [Google Scholar]
- 9.Labek G, Klaus H, Schlichtherle R, Williams A, Agreiter M. Revision rates after total ankle arthroplasty in sample-based clinical studies and national registries. Foot Ankle Int. 2011;32(8):740–745. doi: 10.3113/FAI.2011.0740. [DOI] [PubMed] [Google Scholar]
- 10.Labek G, Sekyra K, Pawelka W, Janda W, Stöckl B. Outcome and reproducibility of data concerning the Oxford unicompartmental knee arthroplasty: a structured literature review including arthroplasty registry data. Acta Orthop. 2011;82(2):131–135. doi: 10.3109/17453674.2011.566134. [DOI] [PMC free article] [PubMed] [Google Scholar]
- 11.Labek G, Kovac S, Levasic V, Janda W, Zagra L. The outcome of the cementless tapered SL-Plus stem: an analysis of arthroplasty register data. Int Orthop. 2012;36(6):1149–1154. doi: 10.1007/s00264-011-1421-5. [DOI] [PMC free article] [PubMed] [Google Scholar]
- 12.Boyer P, Boutron I, Ravaud P. Scientific production and impact of national registers: the example of orthopaedic national registers. Osteoarthr Cartil. 2011;19(7):858–863. doi: 10.1016/j.joca.2011.02.006. [DOI] [PubMed] [Google Scholar]
- 13.European Arthroplasty Register (2011) EAR European Arthroplasty Register. http://www.ear.efort.org. Accessed 10/28/2011
- 14.Australian Orthopaedic Association National Joint Replacement Registry (2010) National Joint Replacement Registry. Annual Report 2010. Australian Orthopaedic Association National Joint Replacement Registry. http://www.dmac.adelaide.edu.au/aoanjrr. Accessed 10/28/2011
- 15.Danish Hip Arthroplasty Register (2010) Dansk Hoftealloplastik Register. Årsrapport 2010. Danish Hip Arthroplasty Register. http://www.dhr.dk. Accessed 10/28/2011
- 16.Register of Orthopaedic Prosthetic Implants (2010) Overall data hip, knee and shoulder arthroplasty in the Emilia-Romagna Region (Italy). 1st January 2000 - 31st December 2009. Register of Orthopaedic Prosthetic Implants. https://ripo.cineca.it. Accessed 10/28/2011
- 17.National Joint Registry for England and Wales (2010) National Joint Registry. 7th Annual Report 2010. National Joint Registry for England and Wales. http://www.njrcentre.org.uk. Accessed 10/28/2011
- 18.New Zealand National Joint Register (2010) The New Zealand Joint Register. Eleven Year Report. New Zealand National Joint Register. http://www.cdhb.govt.nz/njr. Accessed 10/28/2011
- 19.Norwegian Arthroplasty Register (2010) The Norwegian Arthroplasty Register. Report June 2010. Norwegian Arthroplasty Register. http://nrlweb.ihelse.net. Accessed 10/28/2011
- 20.Portuguese Arthroplasty Register (2010) 1st Annual Report. June 2009 - May 2010. Portuguese Arthroplasty Register. http://www.rpa.spot.pt. Accessed 10/28/2011
- 21.Necas L, Katina S, Kokavec M, Uhlárová J. Slovenský artroplastický register. analýza 2003 - 2008 (2009) Slovak Arthroplasty Register. https://sar.mfn.sk/. Accessed 10/28/2011
- 22.Garellick G, Kärrholm J, Rogmark C, Herberts P. Swedish (2010) Hip Arthroplasty Register. Annual Report 2009. Swedish Hip Arthroplasty Register. http://www.shpr.se. Accessed 10/28/2011
- 23.Australian Bureau of Statistics. Australian Demographic Statistics (2010) Estimated Resident Population By Single Year Of Age. http://www.abs.gov.au. Accessed 11/01/2011
- 24.Statistics Denmark (2010) Population at the first day of the quarter by region, sex, age, marital status, ancestry, country of origin and citizenship. http://www.statbank.dk. Accessed 11/01/2011
- 25.Italian National Institute of Statistics (2010) Resident population by age, sex and marital status on 1st January 2009. http://demo.istat.it. Accessed 11/01/2011
- 26.Office for UK National Statistics (2010) Mid Year Population Estimates 2009. http://www.ons.gov.uk. Accessed 11/01/2011
- 27.Statistics New Zealand Tatauranga Aotearoa (2010) National population estimates, mean year ended 31 December 1991-2010. http://www.stats.govt.nz. Accessed 11/01/2011
- 28.Statistics Norway (2010) Population, by sex and age. In: http://statbank.ssb.no. Accessed 11/01/201.
- 29.Statistics Portugal (2010) Resident population (No.) by Sex and Age. Annual 2009. http://www.ine.pt. Accessed 11/01/2011
- 30.Statistical Office of the Slovak Republic (2009) Population Age status of the Slovak Republic by sex and age as of 1st July 2008. http://www.statistics.sk. Accessed 11/01/2011
- 31.Statistics Sweden (2010) Sweden’s Population by sex and age on 31/12/2009. http://www.scb.se. Accessed 11/01/2011
- 32.World Health Organization. Global Health Observatory (2010) Per capita total expenditure on health at average exchange rate (US$). http://www.who.int/gho. Accessed 11/02/2011
- 33.Furnes O, Lie SA, Espehaug B, Vollset SE, Engesaeter LB, Havelin LI. Hip disease and the prognosis of total hip replacements - A review of 53 698 primary total hip replacements reported to the Norwegian arthroplasty register 1987–99. J Bone Jt Surg Br. 2001;83B:579–586. doi: 10.1302/0301-620X.83B4.11223. [DOI] [PubMed] [Google Scholar]


