

Abstract
Oropharyngeal carcinoma (OPC) can be classified into two equally prevalent sub-types depending on the presence of Human Papillomavirus (HPV). Patients with HPV-positive (HPV+) OPC represent a unique cohort with a distinct tumor biology and clinical behavior compared to HPV-negative (HPV-) OPC. Genetic studies have demonstrated chromosomal and gene expression changes associated with distinct sub-classes of OPC, although the proteomic consequences of HPV infection are not known. We analyzed sets of 10 HPV+ and 10 HPV− OPCs, and 10 normal adult oral epithelia using a standardized global proteomic analysis platform. This analysis yielded a total of 2,653 confidently identified proteins from which we chose 31 proteins on the basis of expression differences between HPV+, HPV− and normal epithelium for targeted protein quantiation. Analysis of differentially expressed proteins by HPV status revealed enrichment of proteins involved epithelial cell development, keratinization, and extracellular matrix organization in HPV− OPC while enrichment of proteins in DNA initiation and replication and cell cycle control was found for HPV+ OPC. Enrichment analysis for transcription factor targets identified transcription factors E2F1 and E2F4 to be highly expressed in HPV+ OPC. We also found high expression of argininosuccinate synthase 1 (ASS1) in HPV+ OPC suggesting HPV+ OPC is more dependent on conditionally essential amino acid, arginine, and this was confirmed on a OPC-specific tissue microarray. These identified proteomic changes reveal novel driving molecular pathways for HPV+ and HPV− OPC that may be pertinent in therapeutic strategies and outcomes of OPC.
Keywords: Human papilloma virus, mass spectrometry, oropharyngeal carcinoma
Introduction
Oropharyngeal Carcinoma (OPC), one of the primary sites within head and neck squamous cell carcinoma (HNSCC), is associated with the use of tobacco and alcohol products or with infection by Human Papillomavirus (HPV) 1, 2. About 50% of all OPCs harbor HPV, depending on the detection method used (PCR for HPV DNA, in situ detection of HPV RNA, or indirect methods), geographical region and other factors 3. Generally, HPV-positive (HPV+) OPCs occur in patients that are younger and are less likely to have tobacco and alcohol exposure than those with HPV− tumors. Several studies have suggested that HPV+ tumors have more favorable survival profiles than those without 4. Molecular evidence that HPV-status determines a separate class of OPC comes from studies showing HPV+ tumors are associated with low rates of p53 or p16INK4A mutations as opposed to HPV− OPCs where p53 and p16INK4A alterations are commonly found 5. Genetic studies of OPC have demonstrated chromosomal changes associated with HPV infection 5, while we and others determined gene expression profiles related to HPV that have identified subclasses of OPC 6-8. Unfortunately, reported gene expression profiles show little overlap between studies, which complicates interpretation of the findings and the identification of important “drivers” of OPC carcinogenesis9. These results suggest that neither transcript profiles nor chromosomal changes clearly explain OPC biological and clinical phenotypes beyond HPV status and alternative strategies to identify molecular pathways are needed.
Until recently, an unbiased analysis of the cellular proteome was limited to the 500-1,000 most abundant proteins through early proteomics approaches such as 2-dimensional gel electrophoresis. Novel advances in mass spectrometry (MS)-based protein detection now allows unbiased discovery of thousands of proteins in small tissue samples 10, 11. In a pioneering study, Patel et al. identified almost 400 individual proteins from formalin-fixed paraffin-embedded microdissected HNSCC tissues 12. Although limited in numbers of identified proteins, Patel et al. found proteins involved in cell-cell contacts, differentiation, cell cycle regulation and cancer-associated proteins, indicating that biological information can be derived from proteomic datasets. Technological advances through the first phase of the National Cancer Institute’s Clinical Proteomic Technologies for Cancer (CPTAC) program resulted in standardization of MS-based protein discovery (“shotgun proteomics”) and targeted protein detection strategies (“multiple-reaction-monitoring”, MRM) 13, 14. As original participants in CPTAC, we developed and standardized protocols that allow the simultaneous detection of thousands of proteins in clinical samples that can be quantitatively compared and interpreted in biological context. Application of these novel proteomic approaches will improve our understanding of the differences between HPV+ and HPV− tumors may identify biomarkers for early detection or recurrence surveillance and identify biological pathways as potential treatment targets.
The aims for this study were to determine the global proteome of OPC, to identify protein expression differences between HPV+ and HPV− OPC and normal epithelium and to interpret the findings in the context of known molecular, biological and signaling pathways. Our results demonstrate the central role of cell cycle regulation, DNA metabolism and dedifferentiation in HPV+ OPC and provide new insight in potential metabolic differences between HPV+ and HPV− OPC.
Materials and Methods
Patient selection and specimen processing
All tumor specimens were derived from histologically confirmed OPC, and not from other HNSCC sub-sites. Twenty frozen tumor samples were prospectively collected from patients undergoing surgery for OPC at Vanderbilt University (supplemental table S1). In addition, we collected 10 normal epithelium specimens from tonsillectomies (5 cases) and uvulopalatopharyngoplasties (5 cases). All tissues were snap-frozen in liquid nitrogen within 30 minutes of surgical resection or biopsy, and kept at −80°C until further processing. All patients consented to participation in this study under protocols approved by the Vanderbilt Institutional Review Board. Tissues were sectioned on a microtome at −20°C, collected on glass slides and used for macrodissection of the tumor or epithelial components. A minimum of 80% tumor cell content was required for inclusion in the study.
HPV detection
Tumor DNAs were tested for the presence of HPV DNA using a previously established PCR-based method 15. This method employs degenerate PCR primers (MY09 and MY11, WD72/76 and WD66/67/154) that are designed to represent highly conserved HPV L1 and E6 sequences present in all major types of HPV. In addition, HPV-positive samples were tested with a HPV16-specific quantitative reverse transcriptase PCR for E6 using RNA isolated from frozen tissue specimens using forward primer 5′-GCACCAAAAGAGAACTGCAATGTTT-3′ and reverse primer 5′-GCTCTGTGCATAACTGTGGTAACTT-3′.
Protein isolation and sample preparation
An outline of our proteomic analysis procedure is shown in Figure 1. Tissue proteins were extracted and digested by the method of Wang et al. 16. Equivalent amounts of protein for the three sets (HPV+ OPC, HPV− OPC and normal epithelium) of 10 patients each were combined to form a single pooled protein lysate. This approach was chosen to increase the efficiency of the analyses and to average out all individual variation not due to the factors of interest (HPV status and tumor/normal status). We performed each of the analyses in quadruplicate to reach better estimates of experimental variation, which improves statistical estimates of the observed differences. Macrodissected sections of tissue were suspended in a 50/50 TFE solution (Acros Organics, Belgium), homogenized by sonication, and incubated at 60° C for one hour with shaking. Protein concentration was measured using the BCA protein assay (Pierce Biotechnology, IL) and a total of 1 mg of pooled protein lysate was created by adding equal amounts of protein from each individual sample from each of the four pools. The pooled lysates were alkylated on cysteines using iodoacetamide and digested into peptides using trypsin (Promega, WI).
Figure 1. Overview of the LC-MS/MS shotgun proteomics pipeline.

Primary tumor tissue is sectioned and used for macrodissection to enrich for tumor cell content. This preparation is used for protein isolation and subsequent digestion with trypsin to create peptide mixtures. Peptides are then separated into 15 fractions based on isoelectric point and each of these fractions is further separated using high-performance liquid chromatography (HPLC), in-line with the mass spectrometer. Ions obtained by electrospray are captured and individually collided with an inert gas to create fragmentation patterns (MS scans) that are unique for each peptide. The MS scans are compared with predicted fragmentation patterns from the known human proteome and positively identified peptides are then assembled into groups of proteins. The number of times each peptide was observed (spectral counts) serves as a measure for the abundance of the protein in the original mixture and these counts are used for quasi-likelihood modeling to compare protein levels between tissue types. Protein expression levels can be used for hierarchical cluster analysis and represented in heat maps. The link with biological data is made by enrichment analyses against biological databases (Gene Ontology, GO; Kyoto Encyclopedia of Genes and Genomes, KEGG, etc.)
IEF fractionation of peptide digests and LC-MS/MS analyses
Methods for peptide separation and MS analysis have been described in detail elsewhere 17. Briefly, peptides are separated by isoelectric focusing (IEF) on immobilized pH-gradient “ZOOM” strips (Invitrogen, CA) with a pH range of 3.5-4.7. This range captures approximately 60% of all possible peptides from the human proteome and is very reproducible. After focusing, the strips were cut into 15 segments and peptides were eluted from each of the pieces of the IEF strip. LC-MS/MS analyses were performed on a LTQ mass spectrometer (Thermo Fisher, CA) using data-dependent scanning (Figure 1).
Peptide identification from MS/MS data, protein assembly and filtering
Captured peak lists from the mass spectral .RAW files were transcoded to mzML by the ProteoWizard MSConvert tool 18. MS data was searched using the MyriMatch version 1.6.57 search algorithm 19 against the IPI database version 3.64 supplemented with 8 HPV open reading frames and potential contaminant sequences for a total of 84,050 sequences in forward and reverse orientation. The search results were filtered and assembled using IDPicker version 2.0 20. Any number of miscleavages was allowed and peptides were allowed to have one non-tryptic end. A static modification for carbamidomethylation was defined for cysteines, while dynamic modifications reflecting oxidation of methionines and formation of N-terminal pyroglutamines were allowed. Precursor mass tolerance was set at 1.25 m/z and product ion mass tolerance was set at 0.5 m/z. Peptide identification stringency was set at a maximum of 2.5% reversed peptide identifications (5% overall peptide FDR) and a minimum of 2 unique peptides to identify a given protein within the full dataset. IPI database entries that mapped to the identical set of peptide identifications were grouped into ‘protein groups’, which consist almost exclusively of isoforms or identical proteins resulting from redundancy in the database 21. Because the majority of false identifications occur with low frequency and such low-count identifications are unlikely to yield statistically significant results, an additional filter was applied that required on average one spectrum counted per replicate MS analysis. The full and unfiltered IDPicker output data set is provided as supplementary data and includes a complete list of protein IDs and their sequence relationships, the number of peptide coverage observed per protein, the number of spectra observed per protein and full peptide sequences. Peptides with identical sequence but differences in precursor or fragment ion mass to charge values were considered ‘distinct’ and treated as separate entities in the report.
Comparison of proteome inventories based on MS/MS spectral count data
Previous results have shown that a frequency-based analysis approach using the number of observed spectra (spectral counting) provides a measure of protein concentration in complex protein mixtures, especially for more abundant proteins 22, 23. To account for the specific properties of spectral count data, we used a quasi-likelihood model 24 which has no restriction on distribution assumptions. This approach also accounts for the type of overdispersion and/or underdispersion usually observed in shotgun data. To protect against multiple comparison issues with simultaneously testing thousands of proteins, we applied the False Discovery Rate (FDR) method 25. Normalization between different runs was achieved by adding the number of confident identifications into the model as the offset. The model generates quasi-p values for each of the protein entries in the dataset and estimates an average spectral count (λ) across the replicate analyses 26. We performed comparisons between the HPV+ and HPV− OPC groups and between each of the OPC groups and normal epithelium. Differential proteins were required to have at least a 2-fold difference in average spectral count and a quasi-likelihood p-value of less than 0.05 (corrected for multiple comparisons). In addition, proteins for which no variation could be determined (CV=0 or NA) were manually removed if proteins with similar counts but measureable CV values did not reach statistical significance.
Multiple Reaction Monitoring analyses
All analyses were performed on a TSQ Quantum triple quadrupole mass spectrometer (Thermo-Fisher Scientific, Waltham MA) equipped with an Eksigent 1D Plus NanoLC pump (Eksigent Technologies, Dublin CA) as described in detail previously 27. Criteria to accept MRM peptide measurements were as follows: all peptide MRM transitions were required to generate integrated precursor peak area higher than 105 and chromatographic retention time alignment was required for all MRM transitions. For data analysis, the sum of the peak areas for all measured transitions from each peptide was used to generate a peptide peak area. The sum of peptide peak areas from each protein was used to generate a protein peak area.
Hierarchical Clustering Analysis
We performed a clustering analysis on the top 200 proteins with the highest coefficient of variation (CV) values across the full dataset using Cluster and Treeview software. Pairwise similarity was calculated on log-transformed spectral counts using the Spearman rank correlation coefficient. Average linkage was used for hierarchical clustering. Genes and samples were clustered separately.
Webgestalt Enrichment Analysis of Differentially Expressed Proteins
Enrichment analysis of proteomic data was carried out using Webgestalt 28, 29. Webgestalt identifies enriched classes of genes/proteins in large scale datasets by searching from several public resources: NCBI Gene, NCBI Gene Expression Omnibus (GEO) Ensembl, Gene Ontology (GO), Kyoto Encyclopedia of Genes and Genomes (KEGG), Pathway Commons, Wikipathways, Molecular Signatures Database (MSigDB). Statistical significance was calculated using the Fisher test with Benjamini-Hochberg correction for multiple testing. Each enriched category is assigned an adjusted p-value (listed in “Results” along with each enriched class) and an enrichment factor (ratio of observed to expected for given enrichment class).
Tissue microarray (TMA) construction and Immunohistochemistry Staining (IHC)
With approval from Human Research Protection Program of Vanderbilt University, 35 archival paraffin blocks were obtained from Department of Pathology in Vanderbilt University Medical Center, and then a TMA was constructed by 1 mm punches in duplicate from each block. Following TMA construction, 4 μm thick sections were prepared for IHC staining. The TMA was stained with anti-ASS1 antibody (Atlas Antibodies Sigma-Aldrich, HPA020896, rabbit polyclonal) at a 1:25 dilution. Antigen retrieval was performed by pressure cooker boiling for 10 minutes in citrate buffer (Target Retrieval Solution, pH9.0, DAKO). EnVision+ System-HRP labeled polymer (DAKO) conjugated with secondary antibody was used for the detection of antigen. Sections were examined and immunoreactivity was scored as negative (−) with fewer than 5% of tumor cells stained; weakly positive (+) with 5% to 10% of tumors cells stained; moderately positive (++) with 10% to 50% of tumors cells stained; and strongly positive (+++) when more than 50% of the tumors cells stained positively.
Results
Analysis of OPC by LC-MS/MS Shotgun Proteomics
Our implementation of shotgun proteomics is outlined in Figure 1 22, 30. To study global protein differences between HPV+ and HPV− OPC and between OPC and normal oral epithelium, we analyzed pooled protein lysates from 10 individuals for each group by shotgun proteomics. These lysates were analyzed by shotgun proteomics in quadruplicate and the resulting spectral count data were used to determine proteomic differences in OPC depending on HPV status and between normal oral epithelium and OPC.
The complete dataset was based on 113,274 confidently assigned MS spectra, filtered at 5% peptide FDR. Proteins identified by a minimum of 2 distinct peptides and at least 4 total spectra yielded a total of 2,602 non-redundant proteins with 3.8% protein FDR (see supplemental table S2). Spectral count comparisons between HPV+ and HPV− OPC (Panel A) and between normal epithelium and HPV− (Panel B) and HPV+ (Panel C), respectively were determined/generated (Figure S1). These plots indicate that the majority of proteins are expressed at similar levels between the three tissue types, although a small number of highly differential proteins are immediately apparent from these plots (indicated by arrows).
To visualize the most differential proteins in the dataset, all proteins were ranked by coefficient of variation (CV) across the full dataset and a heat map was generated from clustering of the top 200 most variable proteins with at least 12 spectral counts per protein (Figure 2, supplemental table S3). Several observations can be made from this analysis. First, the four replicate mass-spectrometry runs clustered closely together and second, that HPV− and HPV+ OPC were grouped more closely to each other than to normal epithelium. Of note is a large cluster containing extracellular matrix proteins with increased levels in normal epithelium (yellow) compared to OPC (ECM1, PPL, EVPL), and another cluster of DNA metabolism proteins with increased expression in HPV+ OPC (MCM2, 6, and 7).
Figure 2. Unsupervised hierarchical cluster analysis of OPC and normal epithelium.
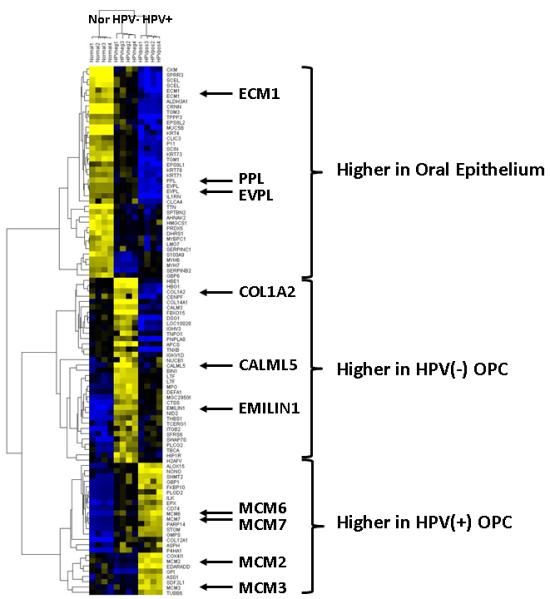
Analysis of the top 200 most differential proteins in the analysis clustered by similarity identifies groups of proteins that differentiate HPV+ and HPV− OPC and differences with normal epithelium. A full list of these proteins is provided as supplemental data.
Proteins with differential expression between HPV+ and HPV-OPC
To study the proteomic differences in OPC depending on HPV status, we compared protein expression levels using quasi-likelihood modeling by QuasiTel 26. Of the 2,343 proteins in this comparison, 319 showed at least a 2-fold difference at p<0.05 with 180 proteins at higher levels in HPV+ OPC and 139 proteins at higher levels in HPV− OPC. The full list of proteins is provided in supplemental table S4. This differential set of proteins was used for enrichment analysis against the full set using Webgestalt. Table 1 lists highly significant enrichment of proteins involved in DNA replication and metabolism, cell cycle control, chromosomal unwinding and nucleic acid metabolism that were identified through for all major classification methods (GO, KEGG, Wiki Pathways, WP and Protein Commons, PC). These results show similarity with those observed by gene expression analyses where a range of cell cycle-associated genes are upregulated in HPV+ cancers 7, 8. Similarly, enrichment analysis for transcription factors identified activation of E2F-family members, reflecting the effects of inactivation of pRB by HPV E7. The main E2F types identified were E2F1 and E2F4, although the driving proteins for this enrichment (MCMs and RFCs, POLD1, PCNA and other proteins) largely overlapped. Our analysis also identified upregulation of MYC and MAX in HPV+ OPC, in agreement with previously published evidence of increased MYC protein levels by HPV E7 31. Two additional upregulated transcription factors were found: upstream transcription factor 1 (USF1) and C/EBP homologous protein (CHOP). USF1 is a basic helix-loop-helix (HLH) transcription factor and regulates genes involved in cellular differentiation 32. CHOP is activated in response to endoplasmic reticulum (ER) stress and plays an important role in ER stress-induced apoptosis 33. Since chromosomal amplification or deletion can cause simultaneous expression changes of closely spaced genes, we also tested for enrichment by chromosomal region but this analysis did not identify any clusters of proteins with equally affected expression levels in HPV+ compared to HPV− OPC.
Table 1.
Selected pathways identified by enrichment analysis of HPV+ versus HPV− OPC
| Database | Database ID | Description | Up/Down in HPV+ |
p- value |
|---|---|---|---|---|
| GO (BP) | 0006270 | DNA replication initiation |
|
0.036 |
| GO (BP) | 0007398 | Ectoderm development |
|
<0.0001 |
| GO (BP) | 0008544 | Epidermis development |
|
<0.0001 |
| GO (BP) | 0009888 | Tissue development |
|
<0.0001 |
| GO (BP) | 0031424 | Keratinization |
|
<0.0001 |
| GO (BP) | 0030216 | Keratinocyte differentiation |
|
<0.0001 |
| GO (BP) | 0009913/0030855 | Epidermal/Epithelial cell differentiation |
|
<0.0001 |
| GO (BP) | 0048513/0048731 | Organ/System development |
|
<0.001 |
| GO (BP) | 0060429/0048856 | Epithelium/Anatomical structure development |
|
<0.001 |
| GO (BP) | 0030198 | Extracellular matrix organization |
|
0.006 |
| GO (BP) | 0006952/0006955 | Defense/Immune response |
|
0.006 |
| GO (MF) | 0016818/0016817 | Hydrolase activity, acting on acid anhydrindes |
|
0.0003 |
| GO (MF) | 0016462 | Pyrophosphatase activity |
|
0.0003 |
| GO (MF) | 0017111 | Nucleoside-triphosphatase activity |
|
0.0003 |
| GO (MF) | 0032553/0032555 | Purine/Ribonucleotide binding |
|
0.0006 |
| GO (MF) | 0005198 | Structural molecule activity |
|
<0.0001 |
| GO (MF) | 0003823 | Antigen binding |
|
0.001 |
| GO (MF) | 0005200 | Structural constituent of cytoskeleton |
|
0.002 |
| GO (MF) | 0005201 | Extracellular matrix structural constituent |
|
0.014 |
| KEGG | 04110 | Cell cycle |
|
<0.001 |
| KEGG | 03030 | DNA replication |
|
<0.001 |
| KEGG | 04512 | ECM-receptor interaction |
|
0.01 |
| WP | 466 | DNA replication |
|
0.0003 |
| WP | 179 | Cell cycle |
|
0.0004 |
| WP | 453 | Inflammatory response pathway |
|
0.015 |
| PC | 917 | Cell cycle checkpoints |
|
0.0001 |
| PC | 555 | Mitotic cell cycle |
|
0.0002 |
| PC | 283 | Cyclin D associated events in G1 |
|
0.0004 |
| PC | 743 | DNA replication pre-initiation |
|
0.0004 |
| PC | 82 | E2F transcriptional targets at G1/S |
|
0.0004 |
| PC | 298 | Activation of ATR in response to replication stress |
|
0.002 |
| MSigDB (TF) | 2074 | E2F1DP1RB_01 |
|
0.0006 |
| MSigDB (TF) | 2432 | E2F_02 |
|
0.002 |
| MSigDB (TF) | 1946 | MYC |
|
0.013 |
| MSigDB (TF) | 2081 | MAX |
|
0.037 |
| MSigDB (TF) | 2167 | USF1 |
|
0.037 |
| MSigDB (TF) | 2025 | CHOP |
|
0.047 |
| CHR | 11323 | 12q |
|
0.008 |
| CHR | 11090 | 12q13 |
|
0.008 |
| CHR | 11292 | 17q25 |
|
0.014 |
In addition to molecular changes known from gene expression studies, enrichment analysis of our proteomic data identified statistically significant down-regulation of proteins involved in epidermal/epithelial development and differentiation in HPV+ compared to HPV− OPC (Table 1). A large number of differential proteins in these newly identified classes were keratins and extracellular matrix proteins (EVPL, COL1A2, PPL etc.), possibly reflecting the less differentiated histological appearance of HPV+ compared to HPV− OPC. A second class of proteins were those involved in defense and immune responses that were identified by GO and WP enrichment analyses. Proteins observed at lower levels in HPV+ OPC compared to HPV− OPC included immunoglobulins, lactotransferrins and others. These changes might indicate decreased immunesurveillance related to HPV infection. Enrichment for chromosomal location identified significantly reduced expression in HPV+ OPC of proteins encoded on 12q13 and 17q25. A large cluster of type II keratins is located in a single cluster on chromosome 12q11-13 reflecting enrichment in HPV− OPC. The second cluster of type I keratins is localized at two loci on chromosome 17 (17p11-12 and 17q11-22) but these did not overlap with the proteins identified from 17q25.
Proteins with differential expression between normal epithelium and HPV− OPC
The comparison between normal epithelium and HPV− OPC yielded 1,946 proteins with at least 4 spectra identified for each protein and a 2.7% protein FDR. Of this set of proteins, 159 proteins had at least 2-fold higher levels in HPV− OPC while 107 proteins had at least 2-fold higher levels normal epithelium (supplemental table S5). Webgestalt analysis by GO categories showed significant enrichment for cell adhesion, immune response and epidermis development in HPV− OPC, while epithelial/epidermal differentiation, epithelium development and keratinocyte differentiation was enriched in normal epithelium (Table 2). Examples of proteins with higher levels in HPV− OPC are COL1A2, CALML5 and EMILIN1, indicating enrichment for GO classes of extracellular matrix organization and epidermis development. Analysis by KEGG categories identified enrichment for extracellular matrix interactions and focal adhesion in HPV− OPC, while tight junctions were enriched in normal epithelium. These results indicate an increase in the extracellular matrix component in HPV− OPC compared to normal epithelium, while the contribution from tight junctions are decreased. Increased levels of proteins associated with inflammation may reflect a more pro-inflammatory microenvironment in cancer versus normal tissue. GO and KEGG enrichment analyses also indicate changes in smooth muscle-associated proteins, in large part due to higher levels of a large number of myosins in the normal epithelium specimens. Analysis of transcription factor enrichment identified decreased activity of MEF2, TATA and P53 transcription factors in HPV− OPC compared to normal epithelium. Consistent with the decreased levels of myosins in HPV− OPC, reduced levels of MEF2 were also discovered. MEF2 activates many muscle-specific genes but also growth factor- and stress-induced genes. Likewise, a lower number of p53-response genes was observed in HPV− OPC, likely reflecting inactivation of p53 by deletion and/or mutation commonly observed in these tumors 34, 35. This was also reflected in a suggested enrichment for other proteins encoded on chromosome 17p13 in normal epithelium compared to HPV− OPC, although this enrichment did not reach statistical significance.
Table 2.
Selected pathways identified by enrichment analysis of normal epithelium versus HPV− OPC
| Database | Database ID | Description | Up/Down in HPV− OPC |
p- value |
|---|---|---|---|---|
| GO (BP) | 0007155/0022610 | Cell/biological adhesion |
|
<0.0001 |
| GO (BP) | 0006955 | Immune response |
|
0.0007 |
| GO (BP) | 0043062 | Extracellular structure organization |
|
0.0016 |
| GO (BP) | 0008544 | Epidermis development |
|
0.007 |
| GO (BP) | 0030855/0009913 | Epithelial/Epidermal cell differentiation |
|
<0.0001 |
| GO (BP) | 0009888/0060429 | Tissue/Epithelium development |
|
<0.0001 |
| GO (BP) | 0030216/0031424 | Keratinocyte differentiation/Keratinization |
|
<0.0001 |
| GO (BP) | 0006941 | Striated muscle contraction |
|
0.0004 |
| GO (BP) | 0005509 | Calcium ion binding |
|
0.0023 |
| GO (BP) | 0030414 | Peptidase inhibitor activity |
|
0.008 |
| GO (MF) | 0005201 | Extracellular matrix structural constituent |
|
0.004 |
| GO (MF) | 0005509 | Calcium ion binding |
|
0.004 |
| GO (MF) | 0008307 | Structural constituent of muscle |
|
<0.0001 |
| GO (MF) | 0005198 | Structural molecule activity |
|
0.0005 |
| KEGG | 04512 | ECM receptor interaction |
|
<0.0001 |
| KEGG | 04510 | Focal adhesion |
|
0.009 |
| KEGG | 04530 | Tight junction |
|
0.0042 |
| KEGG | 05416 | Viral myocarditis |
|
0.0042 |
| KEGG | 04260 | Cardiac muscle contraction |
|
0.0042 |
| WP | 619 | Type II interferon signaling |
|
0.002 |
| WP | 453 | Inflammatory response pathway |
|
0.002 |
| WP | 383 | Striated muscle contraction |
|
<0.0001 |
| PC | 560 | Integrin cell surface interactions |
|
0.002 |
| MSigDB (TF) | 2287 | NKX25_2 |
|
0.034 |
| MSigDB (TF) | 1876 | MEF2_02 |
|
0.023 |
| MSigDB (TF) | 1961 | TATA_01 |
|
0.023 |
| MSigDB (TF) | 2174 | P53 |
|
0.023 |
| CHR | 11177 | 4q28 |
|
0.024 |
| CHR | 11220 | 17p13 |
|
0.085 |
Proteins with differential expression between normal epithelium and HPV+ OPC
A total of 2,582 proteins were identified by at least 4 confident peptide identifications in the comparison between normal epithelium and HPV+ OPC (2.8% protein FDR). A total of 184 proteins had at least 2-fold higher levels in normal epithelium, while 309 proteins had higher levels in HPV+ OPC at p<0.05 (supplemental table S6). This list did not include the p16, pRB or p53 proteins since they did not reach detectable levels in the dataset, but we observed increased levels of MCM5, 6 and 7 in HPV+ OPC compared to normal epithelium. Webgestalt enrichment analysis revealed significant enrichment of several GO categories related to DNA metabolism in HPV+ OPC, reflecting a higher growth rate compared to normal epithelium (Table 3). Loss of epithelial differentiation proteins was apparent in highly significant enrichment for GO classes of epidermal, epithelial and keratinocyte differentiation in normal epithelium compared to HPV+ OPC. These factors were also reflected in enrichment analyses using different classification strategies. For instance, the WIKI pathways for DNA replication, cell cycle and G1 to S cell cycle control were all highly enriched in HPV+ OPC compared to normal epithelium. One of the major drivers of these differences is likely high activity of E2F transcription factors in HPV+ cells as was already apparent from the comparison of HPV+ and HPV− OPC. Similarly, we also observed enrichment for MYC and MAX transcription factors in HPV+ OPC compared to normal epithelium.
Table 3.
Selected pathways identified by enrichment analysis of normal epithelium versus HPV+ OPC
| Database | Database ID | Description | Up/Down in HPV− OPC |
p- value |
|---|---|---|---|---|
| GO (BP) | 0006261 | DNA-dependent DNA replication |
|
0.007 |
| GO (BP) | 0006139 | Nucleobase and nucleic acid metabolic process |
|
0.007 |
| GO (BP) | 0006270 | DNA replication initiation |
|
0.007 |
| GO (BP) | 0009913/0030855 | Epidermal/Epithelial cell differentiation |
|
<0.0001 |
| GO (BP) | 0030216 | Keratinocyte differentiation |
|
<0.0001 |
| GO (BP) | 0008544 | Epidermis development |
|
<0.0001 |
| GO (BP) | 0019433 | Triglyceride catabolic process |
|
0.001 |
| GO (MF) | 0003677 | DNA binding |
|
0.006 |
| GO (MF) | 0003676 | Nucleic acid binding |
|
0.014 |
| GO (MF) | 0005198 | Structural molecule activity |
|
0.0003 |
| KEGG | 03030 | DNA replication |
|
<0.0001 |
| KEGG | 04514 | Cell adhesion molecules |
|
0.001 |
| KEGG | 04612 | Antigen processing and presentation |
|
0.005 |
| KEGG | 00350 | Tyrosine metabolism |
|
0.05 |
| WP | 466 | DNA replication |
|
<0.0001 |
| WP | 179 | Cell cycle |
|
0.002 |
| WP | 45 | G1 to S cell cycle control |
|
0.002 |
| WP | 306 | Focal adhesion |
|
0.013 |
| WP | 383 | Striated muscle contraction |
|
0.033 |
| PC | 275 | DNA strand elongation |
|
0.0002 |
| PC | 276 | Unwinding of DNA |
|
0.0003 |
| PC | 270 | Activation of the pre-replicative complex |
|
0.0003 |
| MSigDB (TF) | 2432 | E2F_02 |
|
0.009 |
| MSigDB (TF) | 2081 | MAX_01 |
|
0.009 |
| MSigDB (TF) | 1946 | MYC_Q2 |
|
0.023 |
| MSigDB (TF) | 1961 | TATA_01 |
|
0.017 |
| CHR | 11359 | 6p |
|
0.027 |
| CHR | 11110 | 1q21 |
|
0.004 |
| CHR | 11090 | 12q13 |
|
0.008 |
Verification of shotgun proteomic results by targeted LC-MRM-MS protein analyses
Targeted analysis of representative peptides by liquid chromatography-tandem mass spectrometry by multiple reaction monitoring (LC-MRM-MS) affords a systematic approach to protein quantitation 36, 37. In contrast to antibody-based analyses, where antibody availability and specificity are often limiting, LC-MRM-MS enables configuration of an assay for essentially any protein. In practice, this approach has proven sensitive enough to apply to challenging protein quantitation problems. Because purchase of stable-isotope labeled reference peptides is cost-prohibitive for this type of verification study, we used our newly developed Labeled Reference Peptide (LRP) strategy, which is sensitive to 10-100 fmol/ul protein 27. We applied this method to verify differential expression of 31 proteins in pooled lysates consisting of HPV+ and HPV− OPC and normal epithelium (supplemental table S7). A complete list of all measured proteins, peptides and transitions is provided in supplemental table S8. Proteins were chosen because they were highly differential between the three groups, while a small number of proteins were selected because they did not appear to change between normal epithelium and the two OPC groups. Examples of 6 differential proteins among OPC by HPV status are shown in Figure S2. These studies confirmed the high levels of RFC4, MCM6, PML, ASS1 and others in HPV+ compared to HPV− OPC. Several of these proteins are known markers for HPV infection (MCM6, RFC4) but many have not previously been identified in relation to HPV (PML, ASS1, etc.) 6, 7.
Analysis of ASS1 by tissue micro array (TMA)
Given the consistent results indicating increased expression of ASS1 in HPV+ OPC, we chose this protein for confirmation by immunohistochemistry on a larger number of individual OPCs. ASS1 is a rate-limiting enzyme in the penultimate biosynthesis step of L-arginine, a semi-essential amino acid. Arginine is not only involved in tumor cell metabolism but is also important in the synthesis of nitric oxide and nucleotides. It was reported that several tumor types, including melanoma, hepatocellular, prostate and bladder carcinoma show variable loss of ASS1 and become dependent on extracellular arginine because of their inability to synthesize arginine 38. To test a possible association between HPV and increased levels of ASS1 protein in OPC we analyzed a TMA containing duplicate punches from 36 OPCs, of which 12 were HPV−, 21 HPV+ and 3 had unknown HPV status (Figure 3). Staining for ASS1 confirmed the large difference in protein levels between HPV+ and HPV− OPC, 17 of 21 HPV+ and 3 of 11 HPV− OPC had high levels of ASS1 (p<0.005, Fisher’s Exact test). No association with age, sex or smoking status was observed, however, because of the strong association with HPV, ASS1 positivity was also associated with a favorable overall survival pattern (Log-rank test p<0.05).
Figure 3. Analysis of ASS1 protein expression using tissue microarray (TMA).
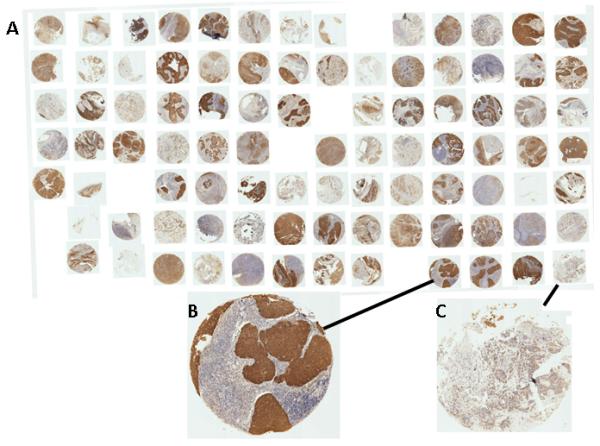
A total of 36 OPCs are represented in duplicate on the TMA. Of these tumors, 12 were HPV−, 21 HPV+ and 3 had unknown HPV status. Panel A represents the full TMA, Panel B is an example of an ASS1-positive OPC and Panel C an example of an ASS1-negative OPC.
Discussion
There is now strong evidence linking HPV infection to a sub-class of OPC that can be identified through a distinct group of clinical, molecular, and biological features 4. Genetic analysis of HPV+ OPC by us and others has indicated increased expression of genes related to DNA transcription and cell cycle regulation 6-8. Many of the hallmark differences identified by these studies relate to direct action of the viral oncogenes E6 and E7. Other findings were not directly predicted by knowledge on E6 and E7 interactions, such as our earlier finding of an increased gene expression of testis-specific genes and of a cluster of genes on the long arm of chromosome 3 (3q24-qter). These studies have provided further insight into the molecular pathways important in HPV+ OPC and how these specific gene expression profiles relate to biological behavior of this cancer. However, a comprehensive analysis of HPV-related proteomic differences had not been performed.
We have previously demonstrated that global proteome analysis can identify driving pathways in a cell line model system where perturbation of a single gene led to a specific pattern of proteomic changes 11. Many of the proteomic changes were also reflected in gene expression profiles from the same cells although a sub-set of proteins were altered in ways that were not apparent from gene expression analyses. The same general principle holds when we compare the proteomic results from the current study to prior data on gene expression differences related to HPV infection in OPC. Again, the central role of DNA transcription and cell cycle regulation is one of the dominant themes in the enrichment analyses. With respect to DNA replication, the most clearly differential proteins are the minichromosome maintenance (MCM) proteins, which function in the early stages of DNA replication during the cell cycle G1 phase, help load the pre-replication complex onto DNA and function as helicases for DNA unwinding. Several studies have shown that MCMs are overexpressed in cervical and several other types of cancer and that they are useful for early detection of disease 39. Downregulation of MCM3 causes G1 cell cycle arrest, downregulation of MCM 2 and 7 caused G2/M cell cycle arrest, while exogenous overexpression of these MCMs resulted in increased anchorage-independent growth and increased cell migration/invasion in medulloblastoma cells 40. Thus, the MCM complex is a potential target for anticancer drug development, although no potent chemical inhibitors for clinical use have been described yet. Other DNA replication-related proteins with increased expression in HPV(+) OPC were PCNA, POLD1 and SMC1A, changes that have previously been observed in gene expression studies.
Several molecular pathway alterations could be observed from the proteome that were not apparent from earlier gene expression studies. One of the most striking examples relates to a HPV− OPC-associated increase in extracellular matrix proteins and proteins involved in epidermal and epithelial differentiation. Examples of such proteins are EVPL, SCEL, PPL, and many KRT forms, which are frequently upregulated during the terminal differentiation of epidermal keratinocytes 41, which suggests a less differentiated phenotype of HPV+ OPC relative to HPV− OPC.
In the comparison of HPV+ with HPV− OPC, enrichment analysis for transcription factor activity revealed highly significant changes in proteins controlled by E2F-type transcription factors, a result that was expected because of the direct activation of E2Fs by E7-mediated degradation of pRB 42. This observation was driven by the increases in protein levels for MCMs, POLD1, TMPO, EIF4A1, ALDH6A1 and other proteins that are responsive to E2F1 and E2F2 transcriptional activation. In addition to known E2F activation, the proteomic profiles also indicated higher levels of MYC and MAX response proteins. This is a novel finding that was not observed from earlier gene expression studies although enhanced MYC levels were reported in cells expressing HPV E7 43, 44. MYC is a key transcriptional factor that is almost universally involved in cell cycle progression, proliferation, metabolism, transformation and apoptosis through targeting of downstream genes containing E-box promoter motifs 45. MAX is a bHLH-LZ protein required for MYC activity and through their association, the MYC/MAX complex is able to activate the transcription of MYC target genes, but also to repress expression of other genes 46. It has been shown that higher MYC levels can be detected in the presence of E6 47, 48. Moreover, in the presence of E6, MYC also induces TERT transcription through its binding to the TERT promoter proximal E box 47, 48. Another bHLH-LZ protein, USF1, was also identified though enrichment analysis. Like MYC, USF1 also targets genes containing E-box motifs and this was apparent from the overlap in proteins identifying USF1 in our analysis. These results suggest that MYC/MAX play an important role in HPV-associated OPC, but further research will be needed to study the specific roles each of these transcription factors in OPC.
A key finding in both the shotgun and MRM analyses was the high expression of ASS1 in HPV+ OPC. ASS1 is involved in the penultimate, and rate-limiting, step of arginine biosynthesis. Arginine is a semi-essential amino acid and many cells depend on external sources of arginine for their survival, and clinical trials for the treatment of cancer that are based on arginine depletion by pegylated arginine deiminase are currently under way 38. In general, carcinomas with low ASS1 levels tend to be more resistant to chemotherapy, but in the case of HPV− OPC, dependence on extracellular ariginine might be explored through concomitant arginine depletion using arginine deiminase (ADI)-PEG20 treatment. The possible clinical utility of ASS1 and several of the other proteins identified in this study will need to be established in the future.
The strength of state-of-the-art mass spectrometry analyses is evident from the large number of identified proteins we were able to identify in a relatively small number of primary tumors and normal tissues. We identified functionally meaningful proteomic signatures that reflect prior data from gene expression analyses, as well as key changes that are not evident from transcript profiles. Future analyses using individual tumor specimens with paired normal epithelium or pre- and post-treatment specimens will undoubtedly yield more informative proteomic datasets and provide an even better description of the molecular processes that drive OPC carcinogenesis.
Supplementary Material
Novelty & Impact Statements.
Global proteomic analysis of oropharyngeal carcinomas by HPV status revealed differential regulation of proteins involved in DNA metabolism and cell cycle control. Proteins could be traced to upregulation of E2F, myc and other transcription factors in HPV-positive tumors. One of the most consistently upregulated proteins was argininosuccinate synthase 1, a rate-limiting enzyme in the metabolism of arginine, a semi-essential amino acid. Arginine depletion may have potential clinical utility in the treatment of HPV-positive oropharyngeal carcinoma.
Acknowledgements
This work was supported by the Jim Ayers Foundation, the Barry Baker Research Endowment, the Robert J. Kleberg, Jr. and Helen C. Kleberg Foundation and NIH Grant U24 CA126479. NJ was funded by the Federal Ministry of Education and Research and the Ministry of Cultural Affairs of the Federal State of Mecklenburg - West Pomerania (03IS2061A) as a part of the research project Greifswald Approach to Individualized Medicine (GANI_MED).
Literature
- 1.Mork J, Lie AK, Glattre E, Hallmans G, Jellum E, Koskela P, Moller B, Pukkala E, Schiller JT, Youngman L, Lehtinen M, Dillner J. Human papillomavirus infection as a risk factor for squamous-cell carcinoma of the head and neck. N Engl J Med. 2001;344:1125–31. doi: 10.1056/NEJM200104123441503. [DOI] [PubMed] [Google Scholar]
- 2.Dai M, Clifford GM, le Calvez F, Castellsague X, Snijders PJ, Pawlita M, Herrero R, Hainaut P, Franceschi S. Human papillomavirus type 16 and TP53 mutation in oral cancer: matched analysis of the IARC multicenter study. Cancer Res. 2004;64:468–71. doi: 10.1158/0008-5472.can-03-3284. [DOI] [PubMed] [Google Scholar]
- 3.McKaig RG, Baric RS, Olshan AF. Human papillomavirus and head and neck cancer: epidemiology and molecular biology. Head Neck. 1998;20:250–65. doi: 10.1002/(sici)1097-0347(199805)20:3<250::aid-hed11>3.0.co;2-o. [DOI] [PubMed] [Google Scholar]
- 4.Chung CH, Gillison ML. Human papillomavirus in head and neck cancer: its role in pathogenesis and clinical implications. Clin Cancer Res. 2009;15:6758–62. doi: 10.1158/1078-0432.CCR-09-0784. [DOI] [PubMed] [Google Scholar]
- 5.Braakhuis BJ, Snijders PJ, Keune WJ, Meijer CJ, Ruijter-Schippers HJ, Leemans CR, Brakenhoff RH. Genetic patterns in head and neck cancers that contain or lack transcriptionally active human papillomavirus. J Natl Cancer Inst. 2004;96:998–1006. doi: 10.1093/jnci/djh183. [DOI] [PubMed] [Google Scholar]
- 6.Slebos RJ, Yi Y, Ely K, Carter J, Evjen A, Zhang X, Shyr Y, Murphy BM, Cmelak AJ, Burkey BB, Netterville JL, Levy S, et al. Gene expression differences associated with human papillomavirus status in head and neck squamous cell carcinoma. Clin Cancer Res. 2006;12:701–9. doi: 10.1158/1078-0432.CCR-05-2017. [DOI] [PubMed] [Google Scholar]
- 7.Pyeon D, Newton MA, Lambert PF, den Boon JA, Sengupta S, Marsit CJ, Woodworth CD, Connor JP, Haugen TH, Smith EM, Kelsey KT, Turek LP, et al. Fundamental differences in cell cycle deregulation in human papillomavirus-positive and human papillomavirus-negative head/neck and cervical cancers. Cancer Res. 2007;67:4605–19. doi: 10.1158/0008-5472.CAN-06-3619. [DOI] [PMC free article] [PubMed] [Google Scholar]
- 8.Lohavanichbutr P, Houck J, Fan W, Yueh B, Mendez E, Futran N, Doody DR, Upton MP, Farwell DG, Schwartz SM, Zhao LP, Chen C. Genomewide gene expression profiles of HPV-positive and HPV-negative oropharyngeal cancer: potential implications for treatment choices. Arch Otolaryngol Head Neck Surg. 2009;135:180–8. doi: 10.1001/archoto.2008.540. [DOI] [PMC free article] [PubMed] [Google Scholar]
- 9.Braakhuis BJ, Brakenhoff RH, Leemans CR. Gene expression profiling in head and neck squamous cell carcinoma. Curr Opin Otolaryngol Head Neck Surg. 2010;18:67–71. doi: 10.1097/MOO.0b013e32833693ce. [DOI] [PubMed] [Google Scholar]
- 10.Sprung RW, Jr., Brock JW, Tanksley JP, Li M, Washington MK, Slebos RJ, Liebler DC. Equivalence of protein inventories obtained from formalin-fixed paraffin-embedded and frozen tissue in multidimensional liquid chromatography-tandem mass spectrometry shotgun proteomic analysis. Mol Cell Proteomics. 2009;8:1988–98. doi: 10.1074/mcp.M800518-MCP200. [DOI] [PMC free article] [PubMed] [Google Scholar]
- 11.Halvey P, Zhang B, Coffey RJ, Liebler DC, Slebos RJC. Proteomic Consequences of a Single Gene Mutation in a Colorectal Cancer Model. J Proteome Res. 2012;11:1184–95. doi: 10.1021/pr2009109. [DOI] [PMC free article] [PubMed] [Google Scholar]
- 12.Patel V, Hood BL, Molinolo AA, Lee NH, Conrads TP, Braisted JC, Krizman DB, Veenstra TD, Gutkind JS. Proteomic analysis of laser-captured paraffin-embedded tissues: a molecular portrait of head and neck cancer progression. Clin Cancer Res. 2008;14:1002–14. doi: 10.1158/1078-0432.CCR-07-1497. [DOI] [PubMed] [Google Scholar]
- 13.Paulovich AG, Billheimer D, Ham AJ, Vega-Montoto L, Rudnick PA, Tabb DL, Wang P, Blackman RK, Bunk DM, Cardasis HL, Clauser KR, Kinsinger CR, et al. Interlaboratory study characterizing a yeast performance standard for benchmarking LC-MS platform performance. Mol Cell Proteomics. 2010;9:242–54. doi: 10.1074/mcp.M900222-MCP200. [DOI] [PMC free article] [PubMed] [Google Scholar]
- 14.Tabb DL, Vega-Montoto L, Rudnick PA, Variyath AM, Ham AJ, Bunk DM, Kilpatrick LE, Billheimer DD, Blackman RK, Cardasis HL, Carr SA, Clauser KR, et al. Repeatability and reproducibility in proteomic identifications by liquid chromatography-tandem mass spectrometry. J Proteome Res. 2010;9:761–76. doi: 10.1021/pr9006365. [DOI] [PMC free article] [PubMed] [Google Scholar]
- 15.Resnick RM, Cornelissen MT, Wright DK, Eichinger GH, Fox HS, ter Schegget J, Manos MM. Detection and typing of human papillomavirus in archival cervical cancer specimens by DNA amplification with consensus primers. J Natl Cancer Inst. 1990;82:1477–84. doi: 10.1093/jnci/82.18.1477. [DOI] [PubMed] [Google Scholar]
- 16.Wang H, Qian WJ, Chin MH, Petyuk VA, Barry RC, Liu T, Gritsenko MA, Mottaz HM, Moore RJ, Camp Ii DG, Khan AH, Smith DJ, et al. Characterization of the mouse brain proteome using global proteomic analysis complemented with cysteinyl-peptide enrichment. J Proteome Res. 2006;5:361–9. doi: 10.1021/pr0503681. [DOI] [PMC free article] [PubMed] [Google Scholar]
- 17.Slebos RJ, Brock JW, Winters NF, Stuart SR, Martinez MA, Chambers MC, Zimmerman LJ, Ham AJ, Tabb DL, Liebler DC. Evaluation of Strong Cation Exchange versus Isoelectric Focusing of Peptides for Multidimensional Liquid Chromatography-Tandem Mass Spectrometry. J Proteome Res. 2008;119:1531–37. doi: 10.1021/pr8004666. [DOI] [PMC free article] [PubMed] [Google Scholar]
- 18.Kessner D, Chambers M, Burke R, Agus D, Mallick P. ProteoWizard: open source software for rapid proteomics tools development. Bioinformatics. 2008;24:2534–6. doi: 10.1093/bioinformatics/btn323. [DOI] [PMC free article] [PubMed] [Google Scholar]
- 19.Tabb DL, Fernando CG, Chambers MC. MyriMatch: highly accurate tandem mass spectral peptide identification by multivariate hypergeometric analysis. J Proteome Res. 2007;6:654–61. doi: 10.1021/pr0604054. [DOI] [PMC free article] [PubMed] [Google Scholar]
- 20.Ma ZQ, Dasari S, Chambers MC, Litton MD, Sobecki SM, Zimmerman LJ, Halvey PJ, Schilling B, Drake PM, Gibson BW, Tabb DL. IDPicker 2.0: Improved Protein Assembly with High Discrimination Peptide Identification Filtering. J Proteome Res. 2009;8:3872–81. doi: 10.1021/pr900360j. [DOI] [PMC free article] [PubMed] [Google Scholar]
- 21.Zhang B, Chambers MC, Tabb DL. Proteomic parsimony through bipartite graph analysis improves accuracy and transparency. J Proteome Res. 2007;6:3549–57. doi: 10.1021/pr070230d. [DOI] [PMC free article] [PubMed] [Google Scholar]
- 22.Liu H, Sadygov RG, Yates JR., 3rd A model for random sampling and estimation of relative protein abundance in shotgun proteomics. Anal Chem. 2004;76:4193–201. doi: 10.1021/ac0498563. [DOI] [PubMed] [Google Scholar]
- 23.Zybailov B, Coleman MK, Florens L, Washburn MP. Correlation of relative abundance ratios derived from peptide ion chromatograms and spectrum counting for quantitative proteomic analysis using stable isotope labeling. Anal Chem. 2005;77:6218–24. doi: 10.1021/ac050846r. [DOI] [PubMed] [Google Scholar]
- 24.Breslow N. Test of hypotheses in overdispersed Poisson regression and other quasi-likelihood modelsed. vol. 85. Brown University; Providence: 1990. [Google Scholar]
- 25.Benjamini Y, Hochberg Y. Controlling the false discovery rate: a practical and powerful approach to multiple testing. J R Stat Soc Ser B. 1995;57:289–300. [Google Scholar]
- 26.Li M, Gray W, Zhang H, Chung CH, Billheimer D, Yarbrough WG, Liebler DC, Shyr Y, Slebos RJ. Comparative shotgun proteomics using spectral count data and quasi-likelihood modeling. J Proteome Res. 2010;9:4295–305. doi: 10.1021/pr100527g. [DOI] [PMC free article] [PubMed] [Google Scholar]
- 27.Zhang H, Liu Q, Zimmerman LJ, Ham AJ, Slebos RJ, Rahman J, Kikuchi T, Massion PP, Carbone DP, Billheimer D, Liebler DC. Methods for peptide and protein quantitation by liquid chromatography-multiple reaction monitoring mass spectrometry. Mol Cell Proteomics. 2011;10 doi: 10.1074/mcp.M110.006593. [DOI] [PMC free article] [PubMed] [Google Scholar]
- 28.Zhang B, Kirov S, Snoddy J. WebGestalt: an integrated system for exploring gene sets in various biological contexts. Nucleic Acids Res. 2005;33:W741–8. doi: 10.1093/nar/gki475. [DOI] [PMC free article] [PubMed] [Google Scholar]
- 29.Kirov SA, Zhang B, Snoddy JR. Association analysis for large-scale gene set data. Methods Mol Biol. 2007;408:19–33. doi: 10.1007/978-1-59745-547-3_2. [DOI] [PubMed] [Google Scholar]
- 30.Gao J, Opiteck GJ, Friedrichs MS, Dongre AR, Hefta SA. Changes in the protein expression of yeast as a function of carbon source. J Proteome Res. 2003;2:643–9. doi: 10.1021/pr034038x. [DOI] [PubMed] [Google Scholar]
- 31.Fan X, Liu Y, Chen JJ. Activation of c-Myc contributes to bovine papillomavirus type 1 E7-induced cell proliferation. J Biol Chem. 2003;278:43163–8. doi: 10.1074/jbc.M306008200. [DOI] [PubMed] [Google Scholar]
- 32.Anantharaman A, Lin IJ, Barrow J, Liang SY, Masannat J, Strouboulis J, Huang S, Bungert J. Role of helix-loop-helix proteins during differentiation of erythroid cells. Mol Cell Biol. 2011;31:1332–43. doi: 10.1128/MCB.01186-10. [DOI] [PMC free article] [PubMed] [Google Scholar]
- 33.Nishitoh H. CHOP is a multifunctional transcription factor in the ER stress response. J Biochem. 2011 doi: 10.1093/jb/mvr143. [DOI] [PubMed] [Google Scholar]
- 34.Stransky N, Egloff AM, Tward AD, Kostic AD, Cibulskis K, Sivachenko A, Kryukov GV, Lawrence MS, Sougnez C, McKenna A, Shefler E, Ramos AH, et al. The mutational landscape of head and neck squamous cell carcinoma. Science. 2011;333:1157–60. doi: 10.1126/science.1208130. [DOI] [PMC free article] [PubMed] [Google Scholar]
- 35.Agrawal N, Frederick MJ, Pickering CR, Bettegowda C, Chang K, Li RJ, Fakhry C, Xie TX, Zhang J, Wang J, Zhang N, El-Naggar AK, et al. Exome sequencing of head and neck squamous cell carcinoma reveals inactivating mutations in NOTCH1. Science. 2011;333:1154–7. doi: 10.1126/science.1206923. [DOI] [PMC free article] [PubMed] [Google Scholar]
- 36.Anderson L, Hunter CL. Quantitative mass spectrometric multiple reaction monitoring assays for major plasma proteins. Mol Cell Proteomics. 2006;5:573–88. doi: 10.1074/mcp.M500331-MCP200. [DOI] [PubMed] [Google Scholar]
- 37.Addona TA, Abbatiello SE, Schilling B, Skates SJ, Mani DR, Bunk DM, Spiegelman CH, Zimmerman LJ, Ham AJ, Keshishian H, Hall SC, Allen S, et al. Multi-site assessment of the precision and reproducibility of multiple reaction monitoring-based measurements of proteins in plasma. Nat Biotechnol. 2009;27:633–41. doi: 10.1038/nbt.1546. [DOI] [PMC free article] [PubMed] [Google Scholar]
- 38.Delage B, Fennell DA, Nicholson L, McNeish I, Lemoine NR, Crook T, Szlosarek PW. Arginine deprivation and argininosuccinate synthetase expression in the treatment of cancer. Int J Cancer. 2010;126:2762–72. doi: 10.1002/ijc.25202. [DOI] [PubMed] [Google Scholar]
- 39.Martin CM, Astbury K, McEvoy L, O’Toole S, Sheils O, O’Leary JJ. Gene expression profiling in cervical cancer: identification of novel markers for disease diagnosis and therapy. Methods Mol Biol. 2009;511:333–59. doi: 10.1007/978-1-59745-447-6_15. [DOI] [PubMed] [Google Scholar]
- 40.Lau KM, Chan QK, Pang JC, Li KK, Yeung WW, Chung NY, Lui PC, Tam YS, Li HM, Zhou L, Wang Y, Mao Y, et al. Minichromosome maintenance proteins 2, 3 and 7 in medulloblastoma: overexpression and involvement in regulation of cell migration and invasion. Oncogene. 2010;29:5475–89. doi: 10.1038/onc.2010.287. [DOI] [PubMed] [Google Scholar]
- 41.Ruhrberg C, Hajibagheri MA, Parry DA, Watt FM. Periplakin, a novel component of cornified envelopes and desmosomes that belongs to the plakin family and forms complexes with envoplakin. J Cell Biol. 1997;139:1835–49. doi: 10.1083/jcb.139.7.1835. [DOI] [PMC free article] [PubMed] [Google Scholar]
- 42.Munger K, Phelps WC. The human papillomavirus E7 protein as a transforming and transactivating factor. Biochim Biophys Acta. 1993;1155:111–23. doi: 10.1016/0304-419x(93)90025-8. [DOI] [PubMed] [Google Scholar]
- 43.Gewin L, Galloway DA. E box-dependent activation of telomerase by human papillomavirus type 16 E6 does not require induction of c-myc. J Virol. 2001;75:7198–201. doi: 10.1128/JVI.75.15.7198-7201.2001. [DOI] [PMC free article] [PubMed] [Google Scholar]
- 44.Oh ST, Kyo S, Laimins LA. Telomerase activation by human papillomavirus type 16 E6 protein: induction of human telomerase reverse transcriptase expression through Myc and GC-rich Sp1 binding sites. J Virol. 2001;75:5559–66. doi: 10.1128/JVI.75.12.5559-5566.2001. [DOI] [PMC free article] [PubMed] [Google Scholar]
- 45.Adhikary S, Eilers M. Transcriptional regulation and transformation by Myc proteins. Nat Rev Mol Cell Biol. 2005;6:635–45. doi: 10.1038/nrm1703. [DOI] [PubMed] [Google Scholar]
- 46.Eilers M, Eisenman RN. Myc’s broad reach. Genes Dev. 2008;22:2755–66. doi: 10.1101/gad.1712408. [DOI] [PMC free article] [PubMed] [Google Scholar]
- 47.McMurray HR, McCance DJ. Human papillomavirus type 16 E6 activates TERT gene transcription through induction of c-Myc and release of USF-mediated repression. J Virol. 2003;77:9852–61. doi: 10.1128/JVI.77.18.9852-9861.2003. [DOI] [PMC free article] [PubMed] [Google Scholar]
- 48.Patel JH, Loboda AP, Showe MK, Showe LC, McMahon SB. Analysis of genomic targets reveals complex functions of MYC. Nat Rev Cancer. 2004;4:562–8. doi: 10.1038/nrc1393. [DOI] [PubMed] [Google Scholar]
Associated Data
This section collects any data citations, data availability statements, or supplementary materials included in this article.