

Abstract
Multiple techniques exist for the automated segmentation of magnetic resonance images (MRIs). The validity of these techniques can be assessed by evaluating test–retest reliability, interscanner reliability, and consistency with manual segmentation. We evaluate these measures for the FSL/FIRST subcortical segmentation tool. We retrospectively analyzed 190 MRI scans from 87 subjects with mood or anxiety disorders and healthy volunteers scanned multiple times on different platforms (N = 56) and/or the same platform (N = 45, groups overlap), and 146 scans from subjects who underwent both high‐resolution and whole brain imaging in a single session, for comparison with manual segmentation of the hippocampus. The thalamus, caudate, putamen, hippocampus, and pallidum were reliably segmented in different sessions on the same scanner (Intraclass correlation coefficient (ICC) > 0.83 scanners and diagnostic groups pooled). In these regions, the range of between platform reliabilities were lower (0.527 < ICC < 0.953), although values below 0.7 were due to systematic differences between platforms or low reliability in the hippocampus between eight‐ and single‐channel coil platforms. Accumbens and amygdala segmentations were generally unreliable within and between scanning platforms. ICC values for hippocampal volumes between automated and manual segmentations were acceptable (ICC > 0.7, groups pooled), and both methods detected significant differences between genders. In addition, FIRST segmentations were consistent with manual segmentations (in a subset of images; N = 20) in the left caudate and bilateral putamen. This retrospective analysis assesses realistic performance of the algorithm in conditions like those found in multisite trials or meta‐analyses. In addition, the inclusion of psychiatric patients establishes reliability in subjects exhibiting volumetric abnormalities, validating patient studies. Hum Brain Mapp 34:2313–2329, 2013. © 2012 Wiley Periodicals, Inc.
Keywords: brain, volume, amygdale, hippocampus, caudate, putamen, pallidum, accumbens, thalamus
INTRODUCTION
A wide variety of neurological and psychiatric disorders manifest with abnormalities in volumes of subcortical structures [for example, Bielau et al. (2005); Emsell and McDonald (2009); Konarski et al. (2008)]. In some cases, the effect size of the difference between patients and healthy controls is relatively small, so it becomes imperative that these subtle abnormalities in volumes of subcortical structures are reliably detected. Therefore, there is much interest in development of a rapid, reliable, automated technique for extraction of these measurements. Several tools have been developed, with the FSL (FMRIB Software Library, Oxford Centre for Functional magnetic resonance image (MRI) of the Brain, Oxford, UK) tool FIRST (FMRIB's Integrated Registration and Segmentation Tool), and FreeSurfer (Athinoula A Martinos Center for Biomedical Imaging, Massachusetts General Hospital, Boston, MA) being the most widely used.
There have been two published studies examining the validation of FIRST, by assessing test–retest reliability on the same scanning platform (Morey et al., 2010), and reliability between automated and manual segmentations in the hippocampus and amygdala (Morey et al., 2009). To our knowledge, however, no study has investigated the reliability of FIRST across different scanning platforms, limiting its validity in multisite trials or metaanalyses. Furthermore, this is the first study to use an independent dataset of subjects including those with neuropsychiatric disorders. We hope that this will replicate the high degree of reliability seen in the leave‐one‐out cross‐validation performed by the authors of the tool, using the software's training set, which included a variety of pathologies. Volumetric measures with acceptable test–retest within scanner ICCs across patient groups would be valid for healthy versus patient comparison studies acquired on a single scanning platform. Volumetric measures with acceptable between scanner ICCs would be valid for studies spanning multiple platforms and imaging sites.
In this study, we first retrospectively analyzed a set of 190 MRI acquired in 87 subjects over an 8‐year period at the National Institute of Mental Health. These images were acquired on four different scanning platforms [two of which were maintained as identical and we regard as interchangeable, consistent with prior studies (Nugent et al., 2006)]. In addition, we retrospectively analyzed a set of 146 whole brain and 146 high‐resolution images acquired on a single scanner during the same session. The left and right hippocampus were traced on the high‐resolution image by a single rater blind to subject characteristics and automated segmentation results, whereas FIRST segmentations were calculated using the whole brain image; volumes for these two methods are compared. This is the first study to assess the validity of the FIRST tool for data combined across multiple scanning platforms, providing validation for the tool's use in multisite studies. This is also the first validation of the FIRST tool, using data independent from the training dataset, in individuals with psychiatric disorders, potentially lending credibility to studies applying the FIRST tool to detect abnormalities in these patient groups.
METHODS
Subjects
A total of 87 subjects were included in the test–retest between and within scanning platform analysis. These subjects were drawn from a larger database of subjects receiving MRI scans in our laboratory over an 8‐year period, and details of selection appear in Figure 1. Images from subjects participating in more than one session on the included scanning platforms were entered into the analysis, if they were free from major technical artifacts. Subjects were recruited under several different studies, which were approved by the Combined Neuroscience Institutional Review Board (IRB) at the NIH. Subjects gave written informed consent for study participation. The present retrospective analysis of these data also was approved by this IRB. All subjects were scanned on three platforms, which we refer to throughout this manuscript as Scanners A, B, and C (scanner details are given in the following section). All subjects were medically healthy as determined by clinical history and physical examination, electrocardiogram, and laboratory tests of the blood and urine. Subjects were free of a history of head trauma, substance abuse (in the previous 90 days), or substance dependence in the previous 5 years (excepting nicotine). Psychiatric diagnoses were made using the Structured Clinical Interview for DSM‐IV and an unstructured psychiatric interview by a psychiatrist. Subjects who were taking medications at the time of scanning were maintained on the same medication during both scans, with the exception of one subject in the within platform comparison for Scanner C. Some images were obtained during pharmacologic challenges, which have not been demonstrated to affect brain volumes acutely.
Figure 1.

Diagram showing image selection process and group details. Note that there is overlap between groups, that is, subjects who were scanned twice on more than one scanner or were included in both A versus B and A versus C comparisons.
Forty‐four subjects were scanned on more than one scanning platform. Demographic information is given in Table 1, and we summarize the numbers of subjects included in each analysis here. In the Scanner A versus Scanner B comparison, 26 subjects were scanned, of which 14 were psychiatrically healthy, and 12 had major depressive disorder (MDD) in the depressed phase. In the Scanner A versus Scanner C comparison, 19 subjects were scanned (one subject was scanned on all three platforms and was thus included in both comparisons). Of these, 13 were psychiatrically healthy, and five were diagnosed with MDD.
Table 1.
Demographic data for individual reliability analyses
| All subjects | Healthy subjects | Patients | ||||||||||
|---|---|---|---|---|---|---|---|---|---|---|---|---|
| N | Gender N (%) female | Age (SD) | Months between scans (SD, range) | N | Gender N (%) female | Age ( SD) | Months between scans (SD, range) | N | Gender N (%) female | Age (SD) | Months between scans (SD, range) | |
| Scanner A versus A | 23 | 14 (61) | 30 (8.9) | 6.0 (8.7, 0–39) | 8 | 5 (63) | 30 (7.1) | 9 (13.4, 0–39) | 15 | 9 (60) | 29 (9.9) | 4 (4.6, 0–12) |
| Scanner B versus B | 9 | 3 (33) | 33 (7.9) | 2 (2.9, 0–10) | 9 | 3 (33) | 33 (7.9) | 2 (2.9, 0–10) | 0 | N/A | N/A | N/A |
| Scanner C versus C | 25 | 19 (76) | 40 (11.5) | 8 (12.0, 0–45) | 7 | 6 (86) | 32 (8.8) | 19 (12.7, 0–45) | 18 | 13 (72) | 44 (10.8) | 4 (8.4, 0–35) |
| Combined | 56 | 36 (64) | 35 (11.1) | 6 (9.9, 0–45) | 23 | 14 (61) | 32 (7.8) | 9 (12.7, 0–45) | 33 | 22 (67) | 37 (12.6) | 4 (6.8, 0–35) |
| Test–Retesta | ||||||||||||
| Scanner A versus B | 26 | 10 (38) | 34 (10.3) | 8 (14.5, 0–50) | 14 | 3 (21) | 31 (9.8) | 11 (18.4, 0–50) | 12 | 7 (58) | 38 (10.2) | 5 (7.5, 0–23) |
| Scanner A versus C | 19 | 11 (58) | 33 (8.6) | 12 (16.8, 0–68) | 13 | 7 (54) | 34 (6.9) | 14 (19.1, 0–68) | 6 | 4 (67) | 30 (11.9) | 8 (10.5, 0–28) |
| FIRST versus manual | 146 | 100 (69) | 39 (11.7) | N/A | 45 | 30 (67) | 37 (11.3) | N/A | 101 | 70 (69) | 40 (11.8) | N/A |
One subject was scanned twice on Scanner A and twice on Scanner B, and the A versus A pair was removed from the combined analysis.
Fifty‐six subjects were scanned multiple times on the same scanning platform (again, the reader is referred to Table 1). On Scanner A, 23 subjects were scanned twice, of whom eight were psychiatrically healthy, and 15 were diagnosed with MDD. On Scanner B, nine subjects, all of whom were healthy, were scanned twice. On Scanner C, 25 subjects were scanned twice, of whom seven were healthy, 10 had bipolar disorder type II (BDII), and eight were diagnosed with MDD. These figures include one subject who was scanned twice on both Scanner A and Scanner C.
One hundred and forty‐six subjects underwent both whole brain and high‐resolution imaging on Scanner C. These high‐resolution images were used for manual segmentation of the hippocampus by a single rater, whereas the whole brain images were processed using FIRST. Of these subjects, 45 were healthy, six had bipolar disorder type I (BDI), 24 had BDII, 52 had MDD, and 19 had post traumatic stress disorder (PTSD).
Image Acquisition
Three hardware and software protocols were used for whole brain image data collection. Scanner A was a short bore GE 3T scanner, acquiring IR‐fSPGR images with an eight‐channel coil (TR = 5.9 ms, TE = 2.6 ms, inversion time = 450 ms). Scanner B was one of two identically maintained long‐bore GE 3T scanners, which we have previously treated as interchangeable (Nugent et al., 2006). An MPRAGE sequence was acquired using an eight‐channel coil (TE = 2.7 ms, TR = 7.3 ms, prep time = 725 ms). Scanner C was identical to scanner B, except that images were acquired using a single‐channel coil. For all platforms, the TR and TE were both set as the minimum allowable (for a full echo), so changes in operating system of the scanners over the 8‐year time period may have resulted in small changes in these parameters which would not be expected to alter results. Reconstructed resolution was 256 × 256 × 124, with a 22‐cm field of view (inplane resolution is 0.86 × 0.86 mm2) and 1.2 mm thick slices for all the whole brain images acquired across these scanning platforms. All images were acquired in axial orientation.
High‐resolution images additionally were obtained to facilitate accurate manual segmentation of the hippocampus on Scanner C using an MPRAGE sequence (TE = 4.94 ms, TR = 11.6 ms, prep time = 725 ms). Images were acquired in 124 axial slices, 0.6 mm thick, with a field of view of 14 cm and inplane resolution of 224 × 224 voxels, resampled to 256 × 256 for reconstruction. Two to four 13‐min scans were acquired and averaged, with a final resolution of 0.55 × 0.55 × 0.6 mm3.
Image Processing
Following acquisition, images were first processed using the MINC (McConnell Brain Imaging Centre, Montreal Neurological Institute, McGill University, Montreal, Canada) tool N3 to correct intensity inhomogeneity across the image. Typically, this corrects increased intensity in the center of images acquired with a single channel coil, and increased intensity in the periphery of images acquired with multichannel coils. We found that for most structures, the application of the intensity correction resulted in mean changes in volumes of segmented structures of less than 1%; percent differences were greater only in the accumbens and amygdala. Following nonuniformity correction, images were processed using the run_first_all routine provided as part of the FIRST version 1.2 distribution. In this routine, the image initially is registered to the MNI 1mm T1 MRI standard brain template. This is conducted as a two‐step procedure, where the first step performs a typical registration, and the second step optimizes the registration to the subcortical structures using a mask. The initial registration parameters were changed slightly, as has been previously suggested (Hibar et al., 2011), to specify a larger search region and a normalized mutual information cost function, as default parameters resulted in many gross failures in registration. Following spatial normalization, the images were processed by the FIRST software [details described in Patenaude et al. (2011)]. Briefly, the FIRST algorithm models each individual's subcortical structure as a surface mesh, using a Bayesian model incorporating a training set of 336 images incorporating healthy subjects as well as subjects with schizophrenia, Alzheimer's disease, attention deficit and hyperactivity disorder (ADHD), and prenatal cocaine exposure. Structures segmented included the right and left lateral ventricles, thalamus, caudate, putamen, pallidum, amygdala, hippocampus, and accumbens area. No data are reported from the ventricles, as this area failed to segment properly in a large number of cases. The run_first_all routine also includes a correction to determine whether voxels on the boundary of the surface mesh should be included within the structure. The correction algorithm classifies border voxels as part of the structure or not using a Gaussian mixture‐model and Markov Random field [more details are available in Patenaude et al. (2011)].
To calculate total intracranial volume (TIV), nonbrain matter was first removed using the AFNI tool 3dSkullStrip (Analysis of Functional NeuroImages, NIMH Scientific and Statistical Computing Core, NIH, Bethesda). These images were then registered to a version of the MNI standard template with the skull removed (using the FSL tool FLIRT), and the determinant of the transformation matrix to standard space was calculated. The determinant is essentially a scaling factor, which expresses volume of the input image as a proportion of the template brain volume.
For manual hippocampal segmentation, the high‐resolution images were resliced in the coronal plane, and adjacent slices were summed to increase signal‐to‐noise (resampled slice thickness = 1.1 mm). One rater (SW), blind to diagnosis and automated segmentation results, manually segmented the hippocampus using anatomical boundaries described by Duvernoy (1998). Inter‐rater reliability (ICCLeft = 0.868 ICCRight = 0.930) was established previously between SW and another rater trained on a small sample of image to establish validity of the method. Intrarater reliability was also established (ICCLeft = 0.970 ICCRight = 0.968). The anterior aspect was delimited from the amygdala by the temporal horn of the lateral ventricle and the alveus. The posterior aspect of the hippocampal tail was delimited from the pulvinar and caudate tail. The remainder of the head, body, and tail of the hippocampus were bounded laterally and dorsally by the lateral ventricle and fimbria, ventrally by the parahippocampal gyrus white matter, and medially by a vertical line placed at the dorsomedial tip of this white matter. These methods are similar to those of the popular center for morphometric analysis (CMA) method [Massachusetts General Hospital, see Makris, et al. (2004)], although the high tissue contrast of our images permitted the use of more precise anatomical landmarks along some aspects of the hippocampal surface.
To ascertain the overlap of FIRST with other segmentation approaches, a post hoc analysis was carried out using a subset of 20 images (11 from Scanner A and 9 from Scanner B). These images were processed through the FreeSurfer (Dale et al., 1999) work flow, through the subcortical segmentation step (no surfaces were created). Because recommended imaging protocols for FreeSurfer generally use eight‐channel coils, we included only scans from Scanner A and Scanner B. A subset of images was chosen due to prohibitively long computational times (11+ h). In addition, the caudate and putamen were manually traced by an experienced rater (WB) for this subset of images, according to previously mentioned CMA guidelines. Briefly, the caudate was segmented in coronal sections beginning at the anterior pole. The medial/dorsomedial border was formed by the subcallosal stratum, fasiculus, corpus callosum, and lateral ventricles; the lateral border was formed by the internal capsule (IC) and external capsule; and the ventral border was formed by the subcallosal stratum, accumbens area, and stria terminalis. The caudate tail was excluded by defining the posterior boundary as the coronal plane before the descending curvature of the caudate tail, and the accumbens was excluded using an oblique line from the ventral tip of the frontal horn of the lateral ventricle to the ventral tip of the IC. The anterior border of the accumbens was the coronal plane where the IC first divided caudate and putamen, and the posterior boundary was the coronal plan anterior to the plane containing the anterior aspect of the anterior commissure. The putamen was segmented in coronal sections beginning at the anterior pole and was bounded medially by the IC and laterally by the external capsule. The ventral boundary was defined by the external capsule or accumbens area, and the posterior boundary was the posterior‐most plane, in which putamen gray matter was visible.
The pallidum, thalamus, and independent accumbens regions were not included in the validation against manual segmentation, as the reliability of manual segmentation of these structures across raters is relatively lower than for the hippocampus, putamen, and caudate. In contrast to these latter structures, the pallidum, thalamus, and accumbens exhibit low intensity contrast with the tissues belonging to adjacent brain structures along some aspects of their boundaries, such that manual segmentations of these regions depend partly on arbitrarily defined external landmarks. For example, the ventromedial aspect of the pallidum is difficult to resolve from the adjacent basal forebrain, the ventrolateral boundary of the thalamus is indistinct from the adjacent white matter in many individuals, and the accumbens cannot be delineated accurately from the ventromedial caudate. Furthermore, extant automated segmentation algorithms have been “trained” by datasets manually segmented by “gold standard” raters. Given that our rater was not trained by the same raters who provided the training datasets for FreeSurfer and FIRST, correlations between our manual segmentations of these areas and those obtained by the automated algorithms would likely have proven less informative than the correlations involving regions where boundaries are clear.
Quality Control
Images were visually inspected at several intervals in the process. First, registration of the brain following the two‐stage registration procedure was examined. Images in which neither the gross brain outline nor the subcortical structures were well aligned with the template brain were rerun through the run_first_all procedure using an image with the skull removed using 3dSkullStrip. This was sufficient to improve the registration quality in all cases. Next, the subcortical segmentations were visually inspected. One subject which we originally identified as appropriate for inclusion was removed from the analysis because there were widespread, obvious inaccuracies with the segmentation. (this subject is not included in the N or demographics reported above). Minor inaccuracies of the automated segmentation were noted, but cases were not excluded from the analysis. Finally, the registration of the brain (with skull removed) to the template brain for TIV calculation was visually inspected to ensure accuracy. For the post hoc FreeSurfer comparison, images were inspected for accuracy following registration to Talairach space and removal of nonbrain material.
Statistical Analysis
Test retest reliability
All statistical analyses were carried out using the Statistical Package for the Social Sciences (SPSS, IBM Corporation, Armonk, NY). We report the intraclass correlation coefficient (ICC) as an index of reliability. The ICC measure uses a two‐way mixed model to determine the variance due to the measurement on different days, and the random effect of the subjects measured. We used an absolute agreement standard, thus calculating the ICC as the variance of the measurement, divided by the sum of the variance of the measurement and the variance over subjects. We considered ICC > 0.7 to be acceptable. Acceptable values of ICC in the literature vary widely, with some authors recommending 0.60 as minimum acceptable (Anastasi, 1998), others advocating 0.75 or 0.8 (Shrout and Fleiss, 1979), and others arguing that ICC must be greater than 0.9 if individual decision making is involved (Nunnally and Bernstein, 1994), although these recommendations were arbitrarily rather than empirically determined. As most studies attempt to characterize group means, and not to make individual diagnostic decisions, we used ICC > 0.7 to provide a conservative balance between Type I and Type II error for studies of this type. However, structures for which FIRST performs significantly more reliably than this may be appropriate for other types of analyses as well. We report reliability measures for the entire group, the healthy control subjects only, and the subjects with psychiatric disorders only on each scanner individually. We also report a general test–retest reliability combining data from all three scanners. Because ICC is highly dependent on the variance of the underlying observed quantity, maximization of the number of cases included will give the best estimate of inherent variability of the technique. In addition to the ICC, we also report Dice's coefficient for each structure on each of the three scanners. To calculate the Dice overlap coefficient, the images from each session were transformed to the same stereotaxic space using the AFNI routine 3dAllineate. This routine derives a 12 parameter affine transformation matrix using a Hellinger metric cost function. This transformation matrix was then applied to the segmentation images using nearest neighbor resampling. Following transformation, the Jaccard coefficient (J) was calculated as the intersection of the segmentation masks (for each structure) acquired from the two sessions, divided by the union of the masks, using the AFNI routine 3dABOverlap. Then, Dice's overlap coefficient was calculated as 2*J/(1+J). As with ICC, a strict threshold is difficult to establish; however, we flagged values lower than 0.75 as potentially problematic. To determine the effects of the interval between scans, we used paired t tests to assess systematic differences between the first and second scans, and computed Pearson correlations between the volumetric difference between scans and the time between scans. Results are reported for findings significant at P <0.0036 (equal to 0.05 divided by the number of regions assessed) to correct for multiple comparisons.
Interscanner Reliability
ICC was calculated using a two‐way mixed model, and measures are reported for a single measure using absolute agreement. Where low ICC values appeared to be the result of systematic differences between scanners, we calculated the ICC with a consistency definition, which gives high values for measurements that are consistent across scanners (i.e., the largest volumes using one scanner are also the largest volumes using another scanner), even though they do not necessarily agree on absolute value. We report results for Scanner A versus Scanner B, and Scanner A versus Scanner C. We report reliability for healthy control subjects and patients combined as well as for each group separately. Dice's coefficient is also reported for the same comparisons, calculated as for test retest reliability. We also performed paired t tests to compare data obtained by different scanners to assess systematic differences, both within diagnostic groups, and for the combined group. Differences significant at P <0.0036 are indicated.
FIRST versus Manual Hippocampal Segmentation
The ICC was calculated using a two‐way mixed model, and measures are reported for a single measure using absolute agreement. Paired t tests were performed to assess systematic differences. We report reliability for the entire group, healthy control subjects only, and patients only. Dice's coefficients were not calculated for this analysis due to the difficulties in registering the high‐resolution images used for manual segmentation, which only encompassed a slab of the brain, with the whole brain anatomical images. Next, we use an ANCOVA to test for effects of age, diagnostic category (patient or control), gender, and the gender by diagnosis interaction in both the FIRST and the hand‐segmented results separately. The purpose of this analysis is to determine if differences observable in a “gold standard” manually segmented dataset are also observable using the automated segmentation method. We calculate Cohen's d for the main effects of group and gender. Percent differences noted in the text are calculated as the difference in mean volume between techniques divided by the average of the mean volumes derived from each technique.
Post Hoc FIRST versus FreeSurfer Analysis and Additional Manual Segmentations
For the FIRST versus FreeSufer comparisons, the ICC was calculated using a two‐way mixed model, and measures are reported for a single measure using absolute agreement. Dice's coefficient is reported for this comparison, calculated as for test–retest reliability. For comparison of the caudate and putamen manual segmentations with FreeSurfer and FIRST, we compute Pearson correlation coefficients, and ICCs calculated using a two‐way mixed model for a single measure for both consistency and absolute definitions. We also calculate paired t tests between manual segmentations and automated results. Percent differences noted in the text are calculated as the difference in mean volume between techniques divided by the average of the mean volumes derived from each technique.
RESULTS
Subjects
Demographics for the subject samples appear in Table 1. Mean age and gender proportions did not differ between healthy and patient groups in the automated versus manual segmentation analysis. Figure 1 shows the image selection process and details of each group. To present an example of a typical segmentation, we show in Figure 2 sagittal slices from a single subject scanned on platform A and C. Note that the images are not coregistered, but we attempted to select corresponding slices.
Figure 2.
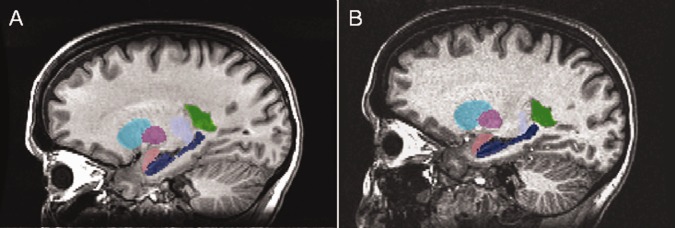
Sagittal images of FIRST segmentations overlaid on corresponding anatomical images for a single subject imaged on (A) scanner A and (B) scanner C. These images are not coregistered, so similar but not identical slices are shown. Visible are the right putamen (teal), caudate (magenta), amygdala (pink), hippocampus (dark blue), thalamus (pale blue), and lateral ventricle (green, segmented but not analyzed).
Test–Retest Reliability
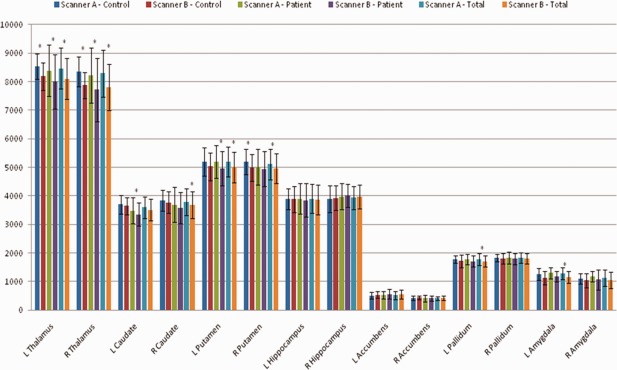
Results for all scanners are shown in Tables 2 and 3. On scanner A, in all subjects combined, all regions were segmented with acceptable reliability (ICC > 0.7) except for the left accumbens and right amygdala. Likewise, all regions showed sufficient overlap (D > 0.75) except for bilateral accumbens and right amygdala. A separate analysis of healthy control images performed similarly. However, segmentations of patient images had good reliability in the right amygdala (ICC = 0.822) and low reliability (ICC < 0.7) in the bilateral accumbens as well as poor overlap (D < 0.75) between segmented images in bilateral amygdala and accumbens. Scatter plots showing volumes for bilateral accumbens and right amygdala are shown in Figure 3. Several individual cases that were particularly unreliably segmented in one structure are highlighted, and shown for all three structures, to illustrate that one structure may be segmented unreliably, but other structures may be reliably segmented in the same images. Only one of the unreliable cases (outlined in red in Fig. 3a) was outside three standard deviations from the mean value (left accumbens volume). When this case was removed, the left accumbens reliability increased only to ICC = 0.32 for all subjects, and ICC = 0.32 for patients alone. There were no systematic differences between volumes in scan 2 versus scan 1 in any region, either in the combined group or diagnostic group separately. Only the left amygdala volume difference between scans inversely correlated with the time between scans (r = 0.61, P =0.002).
Table 2.
Reliability measurements for all three scanning platforms
| Scanner A versus A | Scanner B versus B | Scanner C versus C | Combined test–retest | |||||||
|---|---|---|---|---|---|---|---|---|---|---|
| All (N = 23) | Controls (N = 8) | Patients (N = 15) | Controls (N = 9) | All (N = 25) | Controls (N = 7) | Patients (N = 18) | All (N = 56) | Controls (N = 23) | Patients (N = 33) | |
| ICCabs | ICCabs | ICCabs | ICCabs | ICCabs | ICCabs | ICC (absolute) | ICC (absolute) | ICC (absolute) | ||
| L Thalamus | 0.917 | 0.991 | 0.879 | 0.850 | 0.940 | 0.669 | 0.965 | 0.940 | 0.895 | 0.953 |
| R Thalamus | 0.944 | 0.984 | 0.922 | 0.971 | 0.902 | 0.442 | 0.969 | 0.938 | 0.842 | 0.966 |
| L Caudate | 0.891 | 0.879 | 0.904 | 0.953 | 0.980 | 0.949 | 0.983 | 0.968 | 0.946 | 0.975 |
| R Caudate | 0.773 | 0.877 | 0.752 | 0.814 | 0.977 | 0.919 | 0.982 | 0.920 | 0.853 | 0.934 |
| L Putamen | 0.935 | 0.920 | 0.941 | 0.896 | 0.943 | 0.841 | 0.967 | 0.948 | 0.896 | 0.967 |
| R Putamen | 0.951 | 0.927 | 0.959 | 0.955 | 0.948 | 0.804 | 0.958 | 0.960 | 0.914 | 0.968 |
| L Hippocampus | 0.923 | 0.982 | 0.888 | 0.952 | 0.850 | 0.890 | 0.835 | 0.901 | 0.942 | 0.873 |
| R Hippocampus | 0.880 | 0.954 | 0.846 | 0.949 | 0.799 | 0.900 | 0.772 | 0.872 | 0.940 | 0.824 |
| L Accumbens | −0.128 | −0.427 | −0.256 | 0.833 | 0.907 | 0.709 | 0.945 | 0.554 | 0.678 | 0.421 |
| R Accumbens | 0.705 | 0.857 | 0.613 | 0.524 | 0.437 | 0.953 | 0.205 | 0.545 | 0.864 | 0.355 |
| L Pallidum | 0.924 | 0.888 | 0.949 | 0.480 | 0.728 | 0.559 | 0.749 | 0.830 | 0.786 | 0.842 |
| R Pallidum | 0.906 | 0.930 | 0.900 | 0.838 | 0.741 | −0.343 | 0.922 | 0.856 | 0.700 | 0.929 |
| L Amygdala | 0.756 | 0.746 | 0.773 | 0.633 | 0.842 | 0.580 | 0.895 | 0.790 | 0.652 | 0.882 |
| R Amygdala | 0.584 | −0.726 | 0.822 | 0.707 | 0.707 | 0.692 | 0.704 | 0.710 | 0.666 | 0.744 |
| TIV | 0.997 | 0.996 | 0.998 | 0.991 | 0.990 | 0.985 | 0.992 | 0.994 | 0.992 | 0.995 |
All intraclass correlation coefficients are for absolute agreement. Acceptable Intraclass correlation coefficients are shown in boldface, low Intraclass correlation coefficients and Pearson correlation coefficients are highlighted in gray.
Table 3.
Dice's coefficient of overlap for test–retest reliability on all three scanners
| Scanner A versus A | Scanner B versus B | Scanner C versus C | |||||
|---|---|---|---|---|---|---|---|
| ALL (N = 23) | Controls (N = 8) | Patients (N = 15) | Controls (N = 9) | ALL (N = 25) | Controls (N = 7) | Patients (N = 18) | |
| Dice coeff | Dice coeff | Dice coeff | Dice coeff | Dice coeff | Dice coeff | Dice coeff | |
| L Thalamus | 0.904 | 0.901 | 0.905 | 0.903 | 0.907 | 0.912 | 0.906 |
| R Thalamus | 0.905 | 0.903 | 0.906 | 0.903 | 0.906 | 0.900 | 0.909 |
| L Caudate | 0.810 | 0.798 | 0.816 | 0.806 | 0.807 | 0.812 | 0.805 |
| R Caudate | 0.809 | 0.808 | 0.810 | 0.791 | 0.812 | 0.817 | 0.809 |
| L Putamen | 0.866 | 0.864 | 0.867 | 0.856 | 0.869 | 0.874 | 0.867 |
| R Putamen | 0.863 | 0.865 | 0.862 | 0.864 | 0.868 | 0.877 | 0.864 |
| L Hippocampus | 0.799 | 0.801 | 0.798 | 0.789 | 0.791 | 0.794 | 0.790 |
| R Hippocampus | 0.792 | 0.794 | 0.791 | 0.795 | 0.797 | 0.788 | 0.801 |
| L Accumbens | 0.665 | 0.696 | 0.649 | 0.699 | 0.725 | 0.728 | 0.723 |
| R Accumbens | 0.676 | 0.700 | 0.662 | 0.662 | 0.681 | 0.705 | 0.672 |
| L Pallidum | 0.866 | 0.864 | 0.867 | 0.826 | 0.827 | 0.829 | 0.826 |
| R Pallidum | 0.833 | 0.837 | 0.830 | 0.829 | 0.832 | 0.820 | 0.837 |
| L Amygdala | 0.750 | 0.753 | 0.749 | 0.753 | 0.754 | 0.750 | 0.755 |
| R Amygdala | 0.732 | 0.736 | 0.731 | 0.736 | 0.713 | 0.690 | 0.722 |
Values below 0.75 are highlighted in gray.
Figure 3.
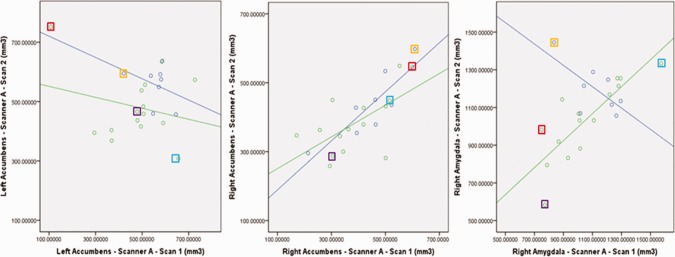
Correlation of test–retest volumes on Scanner A, for regions with low reliability: left accumbens, right accumbens, and right amygdala. Lines are shown fitted to both patient and control subject groups. Selected individual cases are outlined with colored boxes to illustrate that a case which exhibits an unreliable segmentation of one structure may have reliable segmentations of other structures.
Similar to Scanner A, the test–retest reliability for Scanner B was acceptable (ICC > 0.7) for segmentations of all regions besides the right accumbens, left amygdala, and left pallidum. Overlap was unacceptable (D < 0.75) in bilateral accumbens and right amygdala. For the regions with low reliability, there were no significant outliers. There were no systematic differences between volumes in scan 2 versus scan 1 in any region, and there was no correlation of the time between scans with the volumetric difference between scan 1 and scan 2.
When data from subjects in both diagnostic groups were combined, reliability of the FIRST tool on Scanner C was acceptable (ICC > 0.7) in all regions except the right accumbens, and the segmentation of patients by themselves performed similarly. There was one outlying volume in the right accumbens measurement in the patient sample; when this outlier was removed, ICC increased to 0.818 for the whole group and 0.757 for the patients, from 0.437 to 0.205, respectively. There was also a volumetric outlier in left pallidum in the patient group, when removed ICC increased to 0.909 for the whole group and 0.967 for the patients, from 0.727 to 0.748, respectively. Segmentations in the control subjects showed high reliability in the right accumbens (ICC = 0.953), but low reliability in the bilateral pallidum and amygdala, and left thalamus (ICC < 0.7). On examination of the graphs, the low reliability of the left thalamus measure in the healthy controls was attributable to a small range of volumes in this small (N = 7) group and systematic differences between time points (See Fig. 4). Overlap values were acceptable in all subject groups (D > 0.75) for all structures except bilateral accumbens and right amygdala. There were no significant differences after correcting for multiple comparisons between volumes in scan2 versus scan 1 in any region, either for the combined group or each diagnostic group, although there was a trend in the left thalamus for smaller volumes in the second scan in the combined group, t = 2.96, P = 0.007. Only the volumetric change between scans in the right thalamus correlated with the time between scans (R = 0.632, P = 0.001).
Figure 4.
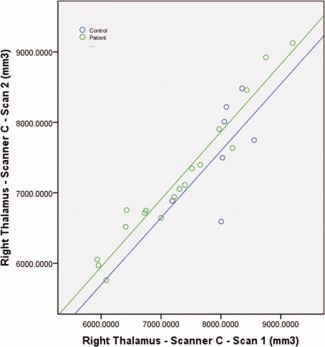
Scatter plot showing the right thalamus volume from two separate scanning sessions on Scanner C. Reduced ICC in the control sample appeared to be attributable to the relatively smaller range of volumes in that group, as well as systematic differences between the scanning sessions (scales are equal between X and Y axis).
When data was combined for the three scanners (N = 57), reliability was acceptable (ICC > 0.7) in all structures except for the accumbens in the combined group, the segmentation performed similarly in the patient group. Segmentation of healthy subject images was unreliable in the bilateral amygdala as well as accumbens. For images from all three scanners, and all groups, calculation of the TIV was highly reliable (ICC > 0.98).
Interscanner Validity
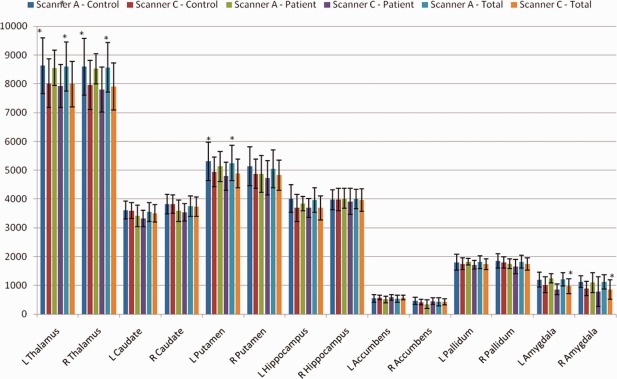
Results for Scanner A versus Scanner B are shown in Tables 4 and 5; mean structure volumes are shown in Figure 5. In the combined group, ICCs were high (ICC > 0.77) for segmentations in all structures except the accumbens and amygdala, and segmentations of the patient images performed similarly. Segmentations of control subject images additionally showed low reliability in the bilateral thalamus and right pallidum (0.56 < ICC < 0.63). Scatter plots for the thalamus segmentations were similar to Figure 4, with a reduced range of values in the healthy sample contributing to the lower ICC as well as a significant systematic difference between segmentations derived from Scanner A versus Scanner B (P < 0.001, paired t test). Post hoc calculation of the ICC using a consistency definition produced much greater ICCs in all subjects, particularly improving ICCs of healthy control segmentations (ICC > 0.86). There was one outlying volume in the left pallidum in the healthy control sample, removing it increased the absolute agreement ICC to 0.810 in the combined group but reduced the ICC to 0.737 in the healthy group. The ICC for TIV was high for all groups (ICC > 0.97). Dice's coefficient (Table 5) was more consistent across groups, with bilateral amygdala and accumbens the only structures exhibiting an unacceptable degree of overlap between segmentations (D < 0.75).
Table 4.
Reliability measurements for Scanner A versus Scanner B, and Scanner A versus Scanner C
| Scanner A versus Scanner B | Scanner A versus Scanner C | ||||
|---|---|---|---|---|---|
| All (N = 26) | Controls (N = 14) | Patients (N = 12) | ALL (N = 19) | Controls (N = 13) | Patients (N = 6) |
| ICCabs | ICCabs | ICCabs | ICCabs | ICCabs | ICCabs |
| 0.819 a | 0.629a | 0.892 a | 0.685a | 0.744 a | 0.524 |
| 0.78 a | 0.565a | 0.862 a | 0.688a | 0.769 a | 0.456 |
| 0.908 | 0.854 | 0.927 a | 0.924 | 0.942 | 0.876 |
| 0.956 a | 0.941 | 0.964 | 0.953 | 0.958 | 0.931 |
| 0.825 a | 0.761 | 0.885 a | 0.754 a | 0.763 a | 0.748 |
| 0.889 a | 0.820 a | 0.943 | 0.820 | 0.780 | 0.922 |
| 0.919 | 0.930 | 0.917 | 0.527 | 0.497 | 0.791 |
| 0.818 | 0.898 | 0.722 | 0.686 | 0.614 | 0.854 |
| 0.334 | −0.012 | 0.581 | 0.661 | 0.641 | 0.738 |
| 0.583 | 0.090 | 0.852 | 0.516 | 0.618 | 0.498 |
| 0.783 a | 0.750 | 0.836 | 0.822 | 0.887 | 0.484 |
| 0.775 | 0.686 | 0.854 | 0.821 | 0.917 | 0.591 |
| 0.449 | 0.416 | 0.512 | 0.137a | 0.294 | −0.096 |
| 0.584 | 0.599 | 0.586 | 0.356a | −0.022 | 0.667 |
| 0.986 a | 0.972 | 0.991 | 0.969 a | 0.975 | 0.917 |
Acceptable Intraclass correlation coefficients (> 0.7) are shown in boldface, low (<0.7) intraclass correlation coefficients are highlighted in gray.
Volumes differ by paired t‐test between scanners
Table 5.
Dice's coefficient of overlap for interscanner combinations
| SCANNER A vs Scanner B | SCANNER A vs Scanner C | |||||
|---|---|---|---|---|---|---|
| ALL (N=26) | Controls (N=14) | Patients (N=12) | ALL (N=19) | Controls (N=13) | Patients (N=6) | |
| Dice Coeff | Dice Coeff | Dice Coeff | Dice Coeff | Dice Coeff | Dice Coeff | |
| L Thalamus | 0.876 | 0.881 | 0.869 | 0.863 | 0.866 | 0.858 |
| R Thalamus | 0.867 | 0.873 | 0.861 | 0.867 | 0.872 | 0.855 |
| L Caudate | 0.791 | 0.797 | 0.784 | 0.802 | 0.808 | 0.788 |
| R Caudate | 0.795 | 0.800 | 0.789 | 0.801 | 0.806 | 0.791 |
| L Putamen | 0.841 | 0.848 | 0.834 | 0.839 | 0.842 | 0.833 |
| R Putamen | 0.842 | 0.838 | 0.847 | 0.844 | 0.845 | 0.844 |
| L Hipp | 0.783 | 0.787 | 0.778 | 0.762 | 0.764 | 0.757 |
| R Hipp | 0.794 | 0.797 | 0.790 | 0.784 | 0.792 | 0.766 |
| L Accmbn | 0.684 | 0.678 | 0.692 | 0.706 | 0.697 | 0.727 |
| R Accmbn | 0.690 | 0.707 | 0.670 | 0.677 | 0.665 | 0.703 |
| L Pallidum | 0.806 | 0.806 | 0.804 | 0.813 | 0.820 | 0.797 |
| R Pallidum | 0.814 | 0.810 | 0.819 | 0.809 | 0.820 | 0.787 |
| L Amygdala | 0.725 | 0.730 | 0.719 | 0.648 | 0.670 | 0.600 |
| R Amygdala | 0.696 | 0.707 | 0.684 | 0.612 | 0.641 | 0.547 |
Values below 0.75 are highlighted in gray.
Figure 5.
Interscanner validity for Scanner A versus Scanner B. Mean volume for each structure, shown by scanner and subject group, as well as for both patient groups combined. Note that both scanning platforms used eight‐channel coils. Standard errors were too small to be visible on the graph, thus standard deviation is shown to illustrate variance of the data. *Indicates a significant difference between scanners on paired t test (P <0.0036).
Results for Scanner A versus Scanner C were similar (Fig. 6). In the combined group, ICCs were acceptable (ICC > 0.75) for the caudate, putamen, and pallidum, but lower in the thalamus, hippocampus, accumbens, and amygdala (ICC < 0.7). The ICCs for segmentations from healthy control images were similar to those of the combined group, although ICCs for absolute agreement in the thalamus were acceptable (ICC>0.74). Segmentations from patient images, in contrast, showed poorer reliability in the thalamus and pallidum (0.45 < ICC < 0.53) but acceptable reliability in the hippocampus and left accumbens (ICC > 0.73). Scatter plots for thalamus volumes illustrate a systematic difference between segmentations from Scanner A and those from Scanner C, although paired t tests were significant after correction for multiple comparisons in healthy subjects (P < 0.001) but not patients (P = 0.031 and P = 0.017 for left and right thalamus, respectively). Post hoc calculations of the ICC with a consistency definition gave acceptable measures of reliability for all groups (ICC > 0.7). Segmentations in patient images showed lower reliability for the pallidum volume, although this may be underestimated due to the low sample size. Interestingly, only patients showed good reliability (ICC > 0.79) across these two scanners in the hippocampus. The ICC for TIV was very high for all groups (ICC > 0.91). Again, Dice's coefficient (Table 5) was consistent across groups, with bilateral amygdala and accumbens exhibiting unacceptable overlap between segmentations (D < 0.75).
Figure 6.
Interscanner validity for Scanner A versus Scanner C. Mean volume for each structure, shown by scanner and subject group, as well as for both patient groups combined. Standard errors were too small to be visible on the graph, thus, standard deviation is shown to illustrate variance of the data. Note that both scanning platforms used eight‐channel coils. *Indicates a significant difference between scanners on paired t test (P < 0.0036).
Automated Segmentation Using FIRST Versus Manual Hippocampal Segmentation
The ICC measures for absolute agreement (See Table 6) were acceptable for all groups and hemispheres except for the left hippocampus in the patients only (ICC = 0.665). Scatter plots of manual versus FIRST segmentation are shown in Figure 7. In the patient group, there were two volumetric outliers for both left and right hippocampus. Removing these outliers did not improve reliability. Paired t tests comparing manual to FIRST segmentations were significant for both left (t = 4.73, P <0.001) and right (t = 5.45, P <0.001) hippocampus, with FIRST segmentations resulting in larger volumes (4.5% and 4.7% difference, left and right, respectively, for all subjects).
Table 6.
Mean volumes and reliability measures for manual versus FIRST segmentation of the hippocampus
| Mean–Manual | Mean–FIRST | Manual versus FIRST Segmentation | |||||
|---|---|---|---|---|---|---|---|
| All Subjects | N = 146 | R | ICCcon | ICCabs | Paired t | P | |
| L Hippocampus | 3460 ± 454.7 | 3621 ± 450.3 | 0.585 | 0.585 | 0.711 | 4.728 | < 0.001 |
| R Hippocampus | 3567 ± 460.3 | 3739 ± 399.6 | 0.617 | 0.611 | 0.724 | 5.451 | |
| Controls Only | N = 45 | ||||||
| L Hippocampus | 3585 ± 393.3 | 3706 ± 478.8 | 0.688 | 0.675 | 0.791 | 2.307 | 0.026 |
| R Hippocampus | 3694 ± 399.0 | 3826 ± 365.3 | 0.614 | 0.612 | 0.736 | 2.621 | 0.012 |
| Patients Only | N = 101 | ||||||
| L Hippocampus | 3404 ± 470.7 | 3583 ± 434.1 | 0.537 | 0.535 | 0.665 | 4.123 | < 0.001 |
| R Hippocampus | 3510 ± 476.1 | 3700 ± 409.7 | 0.605 | 0.598 | 0.710 | 4.777 | < 0.001 |
ICCs greater than 0.7 are indicated in boldface.
Figure 7.
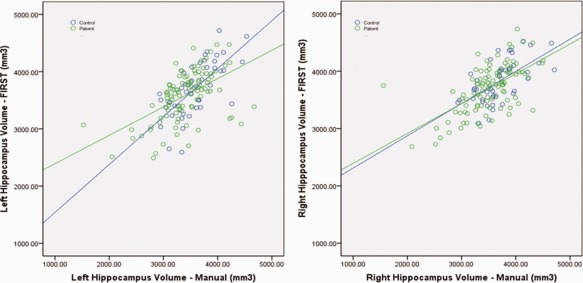
Scatter plots of left and right hippocampal volume for automated FIRST segmentations versus manual segmentations. Line in black (FIRST = manual) is given for reference, and fit lines to the reliability data are shown separately for patients and controls. Lines are shown fitted to both patient and control subject groups.
Next, we investigated the effects of gender, age, and diagnostic status (patient or controls) on the manual and automated segmentation data (Table 7, Fig. 8). Males and females were similar in mean age (39 in both groups), as were patients and controls (40 and 37, respectively). Controls were 67% female, whereas patients were 69% female. Male and female hippocampal volumes differed for both hemispheres, using FIRST or manual segmentation. The main effect of diagnosis was only significant for the right hippocampus using FIRST (P = 0.012), although a trend toward significance was observed (0.05 < p < 0.1) in the manually segmented volumes. Neither the effect of age nor the interaction between gender and diagnosis were significant. Effect sizes were slightly larger for the manually segmented volumes (Cohen's d, main effect of diagnosis: Left = 0.42, Right = 0.42; main effect of gender: Left = 0.95, Right = 0.92) as compared to the automated segmentations (Cohen's d, main effect of diagnosis: Left = 0.27, Right = 0.33; main effect of gender: Left = 0.73, Right = 0.44). Under a simpler post hoc model with the nonsignificant effects removed the effect of diagnostic group reached significance (left: P = 0.023, right: P = 0.022) for the manual segmentations, although the effect of diagnostic group in the right hippocampus in the FIRST data was reduced to a trend (P = 0.083).
Table 7.
Results of a general linear model showing the main effect of diagnosis and gender for both FIRST and manually segmented hippocampal volumes
| Main effect of diagnosis | Main effect of gender | |||||
|---|---|---|---|---|---|---|
| F | P | Cohen's d | F | P | Cohen's d | |
| L Hipp–FIRST | 2.063 | 0.153 | 0.269 | 13.881 | < 0.001 | 0.728 |
| R Hipp–FIRST | 4.373 | 0.038 | 0.325 | 6.814 | 0.010 | 0.438 |
| L Hipp–Hand | 3.014 | 0.085 | 0.415 | 20.013 | < 0.001 | 0.948 |
| R Hipp–Hand | 2.869 | 0.093 | 0.419 | 17.230 | < 0.001 | 0.919 |
Effect size (Cohen's d) is also given.
Figure 8.
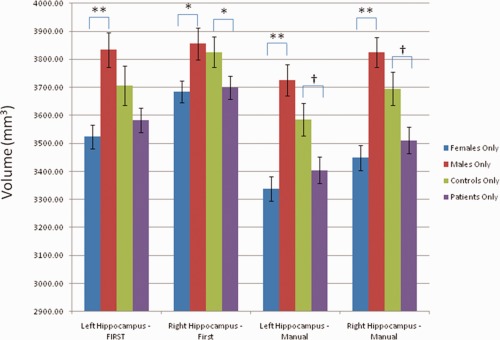
Mean hippocampal volumes and standard errors for control subjects, patients, females, and males. *Significant at P < 0.05, **Significant at P < 0.001 †Trend toward significance (0.05 < P < 0.1).
Post Hoc Comparison between FreeSurfer and FIRST
Results of the post hoc comparison between FIRST and FreeSurfer are shown in Table 8. The FIRST and FreeSurfer methods were found to have poor ICC's using an absolute agreement criterion, with only the bilateral caudate volumes exhibiting sufficient agreement (ICC > 0.7) between the two techniques. Using a consistency criterion, ICC's were slightly higher, reflective of systematic differences between methods; this was also demonstrated by paired t tests. Nonetheless, even with the consistency definition, only bilateral caudate volumes were in sufficient agreement (ICC > 0.7). Dice's coefficient of overlap did not show acceptable overlap between the two techniques for any region.
Table 8.
Comparison between volumes calculated by FIRST and FreeSurfer on a subset of subjects (N = 20)
| Mean–FIRST | Mean–FreeSurfer | ICCABS | ICCCons | Dice's Coeff | Paired‐T | P | |
|---|---|---|---|---|---|---|---|
| L Thalamus | 8502 ± 725.8 | 7154 ± 802.3 | 0.242 | 0.613 | 0.685 | −8.960 | <0.001 |
| R Thalamus | 8353 ± 753.9 | 7102 ± 837.5 | 0.289 | 0.641 | 0.693 | −8.287 | <0.001 |
| L Caudate | 3600 ± 404.0 | 3744 ± 386.3 | 0.775 | 0.819 | 0.644 | 2.697 | 0.014 |
| R Caudate | 3747 ± 431.4 | 3837 ± 426.7 | 0.755 | 0.762 | 0.641 | 1.354 | 0.192 |
| L Putamen | 5232 ± 498.0 | 6062 ± 517.5 | 0.283 | 0.657 | 0.697 | 8.828 | <0.001 |
| R Putamen | 5206 ± 434.4 | 5799 ± 507.2 | 0.382 | 0.677 | 0.698 | 6.990 | <0.001 |
| L Hippocampus | 3898 ± 499.6 | 4162 ± 481.0 | 0.505 | 0.567 | 0.635 | 2.588 | 0.018 |
| R Hippocampus | 3951 ± 432.0 | 4176 ± 458.0 | 0.385 | 0.423 | 0.633 | 2.105 | 0.049 |
| L Accumbens | 560 ± 106.9 | 643 ± 148.7 | 0.241 | 0.282 | 0.459 | 2.401 | 0.027 |
| R Accumbens | 442 ± 82.6 | 610 ± 135.5 | 0.156 | 0.324 | 0.462 | 5.740 | <0.001 |
| L Pallidum | 1804 ± 145.1 | 1747 ± 208.2 | 0.337 | 0.342 | 0.637 | −1.224 | 0.236 |
| R Pallidum | 1892 ± 180.4 | 1636 ± 232.0 | 0.243 | 0.421 | 0.594 | −5.120 | <0.001 |
| L Amygdala | 1128 ± 204.3 | 1661 ± 260.4 | 0.091 | 0.325 | 0.587 | 8.759 | <0.001 |
| R Amygdala | 1032 ± 240.9 | 1804 ± 324.6 | 0.132 | 0.609 | 0.580 | 13.659 | <0.001 |
Post Hoc Comparison Between Manual and Automated Segmentation in the Caudate and Putamen
Results are show in Table 9. For all regions, FreeSurfer produced the largest volumes, and manual segmentation produced the smallest volumes, with volumes obtained from FIRST lying in between. Correlations and ICC's based on a consistency definition were high (>0.7) comparing left and right putamen and left caudate volumes obtained with manual segmentation and the automated techniques. However, there were systematic biases in the putamen volumes obtained with each method, as evidenced by the high t values in the paired t test comparisons and the relatively low ICC values based on an absolute definition. There were also systematic biases between the volumes derived from FreeSurfer and those derived from manual segmentation in the left and right caudate; and between the volumes derived from FIRST and those derived from manual segmentation in the right caudate. Nevertheless, both FIRST and FreeSurfer exhibited high ICCs (> 0.7) for both consistency and absolute definitions in the left caudate. In contrast, neither FIRST nor FreeSurfer were adequately reliable as compared to manual segmentation in the right caudate.
Table 9.
Mean volumes and reliability measures for manual segmentations, FIRST, and FreeSurfer in the Caudate and Putamen (N = 20)
| Mean volume | Manual versus FIRST | Manual versus FreeSurfer | |||||||||||
|---|---|---|---|---|---|---|---|---|---|---|---|---|---|
| Manual | FIRST | FreeSurfer | R | ICCcon | ICCabs | Paired t | P | R | ICCcon | ICCabs | Paired t | P | |
| L Caudate | 3564 ± 343.9 | 3600 ± 404.0 | 3744 ± 386 | 0.718 | 0.709 | 0.716 | −0.571 | 0.575 | 0.820 | 0.814 | 0.732 | −3.611 | 0.002 |
| R Caudate | 3550 ± 304.7 | 3747 ± 431.4 | 3837 ± 426.7 | 0.552 | 0.449 | 0.404 | −2.251 | 0.036 | 0.687 | 0.660 | 0.515 | −4.198 | <0.001 |
| L Putamen | 4584 ± 480.0 | 5232.3 ± 498.0 | 6062 ± 517.5 | 0.764 | 0.763 | 0.407 | −8.638 | <0.001 | 0.764 | 0.762 | 0.141 | −19.243 | <0.001 |
| R Putamen | 4544 ± 486.7 | 5206 ± 434.4 | 5799 ± 507.2 | 0.832 | 0.826 | 0.409 | −10.888 | <0.001 | 0.745 | 0.744 | 0.178 | −15.789 | <0.001 |
ICCs greater than 0.7 are indicated in boldface.
DISCUSSION
Through a retrospective analysis of a large number of MRI scans, acquired on three different scanning platforms, we assessed measures of reliability for FIRST on within scanner longitudinal measurements, between scanner measurements, and as compared to manual segmentation.
From within‐scanner data, we conclude that volumes derived using FIRST for the thalamus, caudate, putamen, and hippocampus are reliable, and derived volumes exhibit a sufficiently high degree of overlap. In contrast, the algorithm often performed poorly when segmenting the accumbens and amygdala. Although measurements of the pallidum proved marginal in reliability, the degree of overlap between sessions was acceptable. One factor that likely contributed to the lower reliability measures obtained in these three structures is that they are the smallest in size, so the component of the variance attributable to measurement error would have been relatively larger in comparison with the total volume of these structures. It is also noteworthy that ICCs and Dice's coefficient were generally comparable across scanning platforms, indicating that imaging platform did not substantially affect segmentation reliability. One notable exception is that the ICCs for hippocampus volumes were typically lower on Scanner C, the single‐channel coil platform. Qualitatively, however, we observed similar errors in segmentation of this structure (i.e., usually overflow of the structure posteriorly into parahippocampal gyrus) on all scanning platforms. In addition, Dice's coefficient was consistent across the three platforms.
Our between‐scanner data were largely consistent with the within scanner results. The amygdala and accumbens, which appeared to be particularly problematic in the within‐scanner analysis, also performed poorly in the between‐scanner analysis. We conclude that for images that have similar signal‐to‐noise properties to the scanning technologies we applied, these FIRST‐derived measures were insufficiently reliable to support valid comparisons across time or between populations. Consistent with our within‐scanner results, FIRST measurements of the pallidum were unreliable for some small (N < 15) groups. Dice's coefficient, however, was consistently greater than 0.75 for all groups on all scanners, in all structures except bilateral amygdala and accumbens.
Two other measurements merit comment. Systematic differences in volumes between scanners were evident in multiple structures, but most consistently in the thalamus and putamen, which often lowered ICC measures for the thalamic segmentations. However, the high test–retest reliability of this measure is reflected in high measures of ICC calculated using a consistency‐based definition for the between‐scanners analysis. In contrast, the reliability of the hippocampal segmentation proved particularly low when comparing between Scanners A and C. This comparison involved images collected using a single‐channel coil (Scanner C) versus segmentations from images collected using an eight‐channel coil (Scanner A), thus, the signal‐to‐noise ratio (SNR) would have differed significantly between image sets (i.e., being superior in the images acquired with the eight‐channel coil). Qualitatively, we did not observe more segmentation “errors” in the lower SNR data, although we did not attempt to measure this objectively. Nevertheless, it is hard to dismiss segmentations derived from images on the lower SNR Scanner C, given the consistency between the automated segmentations and the manual segmentations from Scanner C, and the observation that the measurements of Dice's coefficient were roughly equivalent to those on scanning platforms characterized by higher SNR. These data may suggest caution against combining hippocampal measures obtained using different scanners with significant differences in imaging hardware (i.e., single versus eight‐channel coils) unless the relative proportions of each group studied on each platform are carefully balanced.
When compared to manually segmented volumes, hippocampal volumes derived from FIRST showed acceptable ICC values for absolute agreement. Moreover, although the volumes obtained using FIRST showed a bias of being systematically larger than those obtained using manual segmentation, the difference between the mean volumes across techniques was relatively small (4.54.7% for all subjects combined). A significant main effect of gender was observed in both the FIRST and the manually segmented hippocampal volumes, and an effect of diagnosis was significant in the right hippocampus for the FIRST segmentations, although this difference was reduced to a nonsignificant trend, bilaterally, in the manually segmented hippocampi.
With respect to structures for which the automated segmentation proved particularly robust, we found that volumes for the caudate and putamen acquired using FIRST were reliable across multiple scanning platforms. Thalamic volumes may also be comparable across scanning platforms, although our results indicate that this structure in particular is susceptible to systematic differences in absolute volume across scanners, although segmentations are consistent, in that images with the largest volumes on one scanner will also be among the largest volumes measured on another scanner. Thus, we would suggest that group comparisons involving data acquired across multiple scanning platforms should be balanced with respect to the proportion of each group scanned on each platform, so as not to confound results.
The FIRST‐derived hippocampal volumes appeared to be highly reliable for scans acquired using multichannel coils (which afford higher SNR relative to single‐channel coils). In contrast, volumes derived using automated segmentation of images acquired using single‐channel coils showed lower reliability, although these volumes agreed modestly with the manual segmentations and had high Dice's coefficients. The reliability of pallidum was reasonably high, although the substantial relative variance of volumetric measures of this small structure suggests that this measure may best be limited to large groups. In contrast, based on the reliability results presented, we were unable to establish the validity of either the amygdala or the accumbens volumes obtained using FIRST.
As indicated in the Introduction Section, two previous studies examined the reliability of FIRST. Morey et al. (2009) reported a small sample of 20 healthy volunteers, in which the hippocampus and amygdala were both manually segmented and segmented by FIRST. The percent volume overlap between the two methods was between 77 and 80% for left and right hippocampus, and 70% for both left and right amygdala. Manual segmentations correlated well with FIRST volumes in the hippocampus (R = 0.66, P < 105), but correlated poorly in the amygdala (R = 0.28,). Shape analysis revealed that FIRST hippocampal segmentations showed the greatest differences from manual segmentations in the head and tail. In addition, Morely et al. calculated that a substantial increase in sample size would be needed to demonstrate a difference between groups over a range of effect sizes. We suspect that the slightly lower values for reliability we found in the FIRST versus manual comparison were due to the fact that our images were acquired with a single‐channel coil, with presumably lower SNR than the images collected in the Morely et al. study (which used a phased array coil for image acquisition). In the same article, the authors were unable to detect a difference between hippocampal volume in a small (N = 9) sample of depressed subjects compared with a control group (N = 10).
The second study of FIRST's reliability (Morey et al., 2010) directly evaluated test–retest reliability in a small sample of healthy subjects. Twenty‐three subjects were scanned four times, in two imaging sessions separated by a span of 79 days, using a 3‐Tesla MRI system and an eight‐channel coil. Consistent with our results, they found low reliability (ICC < 0.7) for segmentations of the accumbens and amygdala. In contrast to our findings, however, the authors also observed low reliability across scanning sessions (i.e., within subjects) for the left putamen. In general, the ICC values they reported were higher than those we obtained herein, although they do not state whether the given ICC was for a single or an averaged measurement. This conceivably may have been related to the longer time duration over which the within subjects scanning was performed in our study, although we did not consistently find a correlation between volumetric differences and interval (i.e., up to 68 months, average = 8 months) between scanning sessions (only volumes of left amygdala on scanner A and right thalamus on scanner C significantly correlated with interval between scans).
Although this study is the only one examining interscanner reliability of FIRST, other studies have assessed interscanner reliability of other volumetric measures. One study that measured gray and white matter volume in the frontal, temporal, parietal, and occipital lobes found that the inclusion of multiple sites increased variability, particularly in white matter in the parietal and occipital lobes (Reig et al., 2009). Another study of a new gray‐white matter segmentation tool found ICC values above 0.9 between scanners of differing field strengths (Brouwer et al., 2010). A study of five sites also showed ICCs greater than 0.9 for segmentation of the cerebellum and lateral ventricle, and lower but acceptable reliability for gray matter (ICC>0.84) and white matter (ICC>0.78) volumes (Schnack et al., 2004). That study suggests the use of a calibration factor when combining scans from multiple sites. A study by Jovicich et al. (2009) assesses the reliability of FreeSurfer across scanning platforms. The Jovicich study found reproducibility errors less than 6.2% for the subcortical nuclei in young healthy subjects (N = 5), with the highest errors in the amygdala, with slightly higher reproducibility errors (< 7.7%, D > 0.78) in a larger, older group (N = 15). They determined that the primary factors affecting reliability were related to differences in image quality (contrast and SNRs). These studies support the validity of combining data across scanners, and are consistent with our results that in general, reliability decreases as the size of the region segmented becomes smaller.
Our post hoc analysis of validity of FIRST versus FreeSurfer showed that segmentations produced by these two methods differ significantly (from a minimum of 2.4% in the right caudate, to 54.4% in the right amygdala). Reported Dice coefficients for interscanner validity of FreeSurfer (Jovicich et al., 2009) are slightly higher than those we measured using FIRST, particularly in the amygdala and accumbens. In addition, reported ICC's for intrascanner validity of FreeSurfer (Morey et al., 2010) are also slightly higher than our FIRST findings, most prominently in the amygdala and accumbens. In other regions, however, the differences in the ICC values obtained for FIRST versus FreeSurfer were relatively modest.
A previous comparison of FreeSurfer and FIRST with hand segmentation (Morey et al., 2009) asserted that FreeSurfer was more accurate as compared with manual segmentation in the hippocampus as compared to FIRST. It is difficult, however, to use manual segmentation data to make a statement as to the “better” segmentation tool. In regions that are difficult to delineate using manual segmentation (e.g., hippocampus, thalamus, and pallidum) the ideal validation would involve manual segmentations performed using the same rules (and ideally the same raters) that had been used for the original training set for the algorithm. Because of the low tissue contrast between these areas and surrounding structures, manual segmentation depends in part on arbitrary landmarks. Ultimately, without the same training and validation procedures, even experienced anatomists may produce different tracings of the same structure. Even in relatively easily delineated regions such as the caudate and putamen, experienced raters may produce results that are highly consistent, but systematically different. Consistent with this, our putamen volumes derived from manual tracing and those derived from FIRST and FreeSurfer were highly consistent but differed in absolute sizes (13.2–13.6% difference between manual and FIRST, 24.3–27.8% difference between manual and FreeSurfer, calculated as difference in means divided by mean manual segmentation volume). The volumes obtained via both automated methods and manual segmentation also were consistent in the left caudate but not the right caudate (caudate volumes derived with FIRST differed by 1.0–5.4% from volumes derived by manual segmentation, volumes derived with FreeSurfer differed by 4.9–7.8% from volumes derived by manual segmentation). The lack of agreement between FreeSurfer and FIRST also may reflect differences across raters, as the algorithms were informed by training datasets segmented by different sets of raters. Given our findings of high internal consistency of the FIRST technique, as evidenced by high interscanner and intrascanner reliability, and the detection of group differences by both FIRST and manual segmentation (in the hippocampus), FIRST appears to be a robust and computationally rapid alternative to FreeSurfer segmentation of subcortical structures.
Our study has several limitations. The first limitation is that our study was retrospective, so study procedures were not standardized across the image acquisitions. We also allowed the inclusion of two scanners considered interchangeable, which may have introduced nonspecific variability, reducing the reliabilities obtained from scanner C. We had differing proportions of patients versus controls who had been imaged on each scanner, and varying time intervals between scans. All these issues may have resulted in lower reliability measurements; the fact that we found acceptable reliability despite these limitations supports the use of FIRST in large, multicenter trials for at least some structures. Our inclusion of patients also supports the use of FIRST in characterizing subcortical volumetric abnormalities in mood and anxiety disorders. In summary, the results of our study support the use of the FIRST tool for longitudinal studies, multicenter trials, and the study of psychiatric patients in the hippocampus, caudate, putamen, thalamus and pallidum but not in the amygdala and accumbens.
Acknowledgments
This study used the high‐performance computational capabilities of the Helix Systems at the National Institutes of Health, Bethesda, MD (http://helix.nih.gov).
REFERENCES
- Anastasi A (1998): Psychological Testing. New York, NY: Macmillan. [Google Scholar]
- Bielau H, Trubner K, Krell D, Agelink MW, Bernstein HG, Stauch R, Mawrin C, Danos P, Gerhard L, Bogerts B, et al. (2005): Volume deficits of subcortical nuclei in mood disorders A postmortem study. Eur Arch Psychiatry Clin Neurosci 255:401–412. [DOI] [PubMed] [Google Scholar]
- Brouwer RM, Hulshoff Pol HE, Schnack HG. (2010): Segmentation of MRI brain scans using nonuniform partial volume densities. Neuroimage 49:467–477. [DOI] [PubMed] [Google Scholar]
- Dale AM, Fischl B, Sereno MI. (1999): Cortical surfacebased analysis. I. Segmentation and surface reconstruction. Neuroimage 9:179–194. [DOI] [PubMed] [Google Scholar]
- Duvernoy HM.1998. The Human Hippocampus: Functional Anatomy, Vascularization and Serial Sections with MRI. 2nd edition. Berlin Heidelberg New York: Springer-Verlag. [Google Scholar]
- Emsell L, McDonald C. (2009): The structural neuroimaging of bipolar disorder. Int Rev Psychiatry 21:297–313. [DOI] [PubMed] [Google Scholar]
- Hibar D, Jahanshad N, Stein J, Winkler A, Toro R, Jenkinson M (2011): Enigma Consortium First Protocol. http://enigma.loni.ucla.edu/protocols/imagingprotocols/firstprotocol. Accessed on 4 January, 2011.
- Jovicich J, Czanner S, Han X, Salat D, van der Kouwe A, Quinn B, Pacheco J, Albert M, Killiany R, Blacker D, et al. (2009): MRIderived measurements of human subcortical, ventricular and intracranial brain volumes: Reliability effects of scan sessions, acquisition sequences, data analyses, scanner upgrade, scanner vendors and field strengths. Neuroimage 46:177–192. [DOI] [PMC free article] [PubMed] [Google Scholar]
- Konarski JZ, McIntyre RS, Kennedy SH, RafiTari S, Soczynska JK, Ketter TA. (2008): Volumetric neuroimaging investigations in mood disorders: bipolar disorder versus major depressive disorder. Bipolar Disord 10:1–37. [DOI] [PubMed] [Google Scholar]
- Makris N, Kennedy DN, Meyer J, Worth A, Caviness VS, Seidman L, Goldstein J, Goodman J, Hoge E, Macpherson C, Tourville J, Klaveness S, Hodge SM, Melrose R, Rauch S, Kim H, Harris G, Boehland A, Glode B, Koch J, Segal E, Sonricker A, Dieterich M, Papadimitriou G, Normandin JJ, Cullen N, Boeriel,D , Sanders H. (2004): General Brain Segmentation—Method and Utilization. http://www.cma.mgh.harvard.edu/manuals/segmentation. Accessed on 4 January, 2011.
- Morey RA, Petty CM, Xu Y, Hayes JP, Wagner HR, 2nd, Lewis DV, LaBar KS, Styner M, McCarthy G. (2009): A comparison of automated segmentation and manual tracing for quantifying hippocampal and amygdala volumes. Neuroimage 45:855–866. [DOI] [PMC free article] [PubMed] [Google Scholar]
- Morey RA, Selgrade ES, Wagner HR 2nd, Huettel SA, Wang L, McCarthy G. (2010): Scan-rescan reliability of subcortical brain volumes derived from automated segmentation. Hum Brain Mapp 31:1751--1762. [DOI] [PMC free article] [PubMed] [Google Scholar]
- Nugent AC, Milham MP, Bain EE, Mah L, Cannon DM, Marrett S, Zarate CA, Pine DS, Price JL, Drevets WC. (2006): Cortical abnormalities in bipolar disorder investigated with MRI and voxelbased morphometry. Neuroimage 30:485–497. [DOI] [PubMed] [Google Scholar]
- Nunnally JC, Bernstein IH (1994): Psychometric Theory. New York, NY: McCrawHill. [Google Scholar]
- Patenaude B, Smith SM, Kennedy DN, Jenkinson M (2011): A Bayesian model of shape and appearance for subcortical brain segmentation. Neuroimage 56:907–922. [DOI] [PMC free article] [PubMed] [Google Scholar]
- Reig S, SanchezGonzalez J, Arango C, Castro J, GonzalezPinto A, Ortuno F, CrespoFacorro B, Bargallo N, Desco M (2009): Assessment of the increase in variability when combining volumetric data from different scanners. Hum Brain Mapp 30:355–368. [DOI] [PMC free article] [PubMed] [Google Scholar]
- Schnack HG, van Haren NE, Hulshoff Pol HE, Picchioni M, Weisbrod M, Sauer H, Cannon T, Huttunen M, Murray R, Kahn RS (2004): Reliability of brain volumes from multicenter MRI acquisition: A calibration study. Hum Brain Mapp 22:312–320. [DOI] [PMC free article] [PubMed] [Google Scholar]
- Shrout PE, Fleiss JL (1979): Intraclass Correlations—Uses in Assessing Rater Reliability. Psychol Bull 86:420–428. [DOI] [PubMed] [Google Scholar]