

Eukaryotic releasing factor GSPT/eRF3 mediates translation termination-coupled mRNA decay via interaction with a cytosolic poly(A)-binding protein (PABPC1). A region of eRF3 containing two overlapping PAM2 (PABPC1-interacting motif 2) motifs is assumed to bind to the PABC domain of PABPC1, on the poly(A) tail of mRNA. PAM2 motifs are also found in the major deadenylases Caf1–Ccr4 and Pan2–Pan3, whose activities are enhanced upon PABPC1 binding to these motifs. Their deadenylase activities are regulated by eRF3, in which two overlapping PAM2 motifs competitively prevent interaction with PABPC1. However, it is unclear how these overlapping motifs recognize PABC and regulate deadenylase activity in a translation termination-coupled manner. The authors used a dominant-negative approach to demonstrate that the N-terminal PAM2 motif is critical for eRF3 binding to PABPC1 and that both motifs are required for function.
Keywords: translation, mRNA decay, eRF3, poly(A)-binding protein, PAM2, chemical exchange
Abstract
Eukaryotic releasing factor GSPT/eRF3 mediates translation termination-coupled mRNA decay via interaction with a cytosolic poly(A)-binding protein (PABPC1). A region of eRF3 containing two overlapping PAM2 (PABPC1-interacting motif 2) motifs is assumed to bind to the PABC domain of PABPC1, on the poly(A) tail of mRNA. PAM2 motifs are also found in the major deadenylases Caf1–Ccr4 and Pan2–Pan3, whose activities are enhanced upon PABPC1 binding to these motifs. Their deadenylase activities are regulated by eRF3, in which two overlapping PAM2 motifs competitively prevent interaction with PABPC1. However, it is unclear how these overlapping motifs recognize PABC and regulate deadenylase activity in a translation termination-coupled manner. We used a dominant-negative approach to demonstrate that the N-terminal PAM2 motif is critical for eRF3 binding to PABPC1 and that both motifs are required for function. Isothermal titration calorimetry (ITC) and NMR analyses revealed that the interaction is in equilibrium between the two PAM2–PABC complexes, where only one of the two overlapping PAM2 motifs is PABC-bound and the other is PABC-unbound and partially accessible to the other PABC. Based on these results, we proposed a biological role for the overlapping PAM2 motifs in the regulation of deadenylase accessibility to PABPC1 at the 3′ end of poly(A).
INTRODUCTION
Degradation of mRNA (mRNA decay) is an important process for the down-regulation of gene expression. General decay of eukaryotic mRNA occurs via shortening of the 3′-poly(A) tail (deadenylation), which is a rate-limiting step for mRNA decay (Decker and Parker 1993; Fritz et al. 2004; Meyer et al. 2004; Parker and Song 2004).
Deadenylation is mediated by two cytoplasmic deadenylase complexes, Pan2–Pan3 and Caf1–Ccr4 (Daugeron et al. 2001; Tucker et al. 2001; Yamashita et al. 2005). Pan2 and Pan3 are catalytic and regulatory subunits, respectively (Sachs and Deardorff 1992; Uchida et al. 2004), while Caf1 and Ccr4 possess deadenylase activity (Tucker et al. 2001; Chen et al. 2002; Bianchin et al. 2005). Caf1 interacts with anti-proliferative proteins Tob (Tob1) and Tob2, members of the BTG/Tob family (Ikematsu et al. 1999; Prevot et al. 2001; Yoshida et al. 2001) unique to metazoa (Tirone 2001; Jia and Meng 2007). Tob/Tob2 consists of an N-terminal BTG domain responsible for Caf1 binding (Mauxion et al. 2009) and a C-terminal unstructured region (Ruan et al. 2010).
In mammalian cells, the catalytic activities of these deadenylase complexes are enhanced by poly(A)-binding protein (PABPC1), which tightly associates with the 3′-poly(A) tail (Uchida et al. 2004; Ezzeddine et al. 2007; Funakoshi et al. 2007). Interaction with PABPC1 recruits the deadenylase complexes to their substrate, the 3′-poly(A) tail, enhancing catalytic activity. Mutagenesis studies identified the direct binding sites as the C-terminal domain of PABPC1, referred to as PABC (residues 541–623 in human PABPC1), and PABPC1-binding motif 2 (PAM2) in Pan3 and Tob (Fig. 1; Ezzeddine et al. 2007; Funakoshi et al. 2007; Siddiqui et al. 2007).
FIGURE 1.

Sequence alignment of the PAM2 motifs. Numbers above the sequences indicate positions in the PAM2 motif (Kozlov et al. 2004). Numbers at both ends of the sequences represent residue numbers in mouse eRF3a/b, human Pan3 (Uchida et al. 2004), Tob (Ruan et al. 2010), and Tob2 (Kozlov et al. 2004). The unconserved residues between eRF3a and b are enclosed by rectangles. (Green) The overlapped residues of eRF3 within 12 residues of PAM2.
We demonstrated that deadenylation is mediated by a complex of eukaryotic releasing factors eRF3 and eRF1, coupled to translation termination (Funakoshi et al. 2007). eRF1 recognizes all three stop codons, releasing newly synthesized polypeptides from ribosomes (Frolova et al. 1994). eRF3 contains a conserved GTPase domain that binds to the C terminus of eRF1, which mediates GTP-dependent translation termination (Zhouravleva et al. 1995). The N terminus of eRF3, which is less conserved among eukaryotes, associates with the C terminus of PABPC1 (Hoshino et al. 1999b), in which the direct binding sites are PABC in PABPC1 and PAM2 in eRF3 (Fig. 1; Funakoshi et al. 2007). It should be noted that there is no PAM2 in yeast eRF3 (Kononenko et al. 2010), and PABC in yeast Pab1p is less well conserved from mammalian PABPC1 (Kozlov et al. 2002). Therefore, the interaction mode between Pab1p and eRF3 in yeast differs from that in mammals, although the interaction is evolutionarily conserved (Hoshino et al. 1999a; Kozlov et al. 2001; Cosson et al. 2002; Uchida et al. 2002; Hosoda et al. 2003). PAM2 was reported as the second PABPC1 binding motif in Paip2 (Roy et al. 2002), which is found in several metazoan proteins (Albrecht and Lengauer 2004). The consensus sequence is “xxΦxxxAxxFΦP” (x: any amino acid, Φ: hydrophobic amino acid) (Albrecht and Lengauer 2004), in which the well-conserved phenylalanine residue at position 10 is critical to PABC binding affinity (Kozlov et al. 2004; Kozlov and Gehring 2010; Kozlov et al. 2010). Indeed, alanine substitution of the phenylalanine residue of PAM2 in Paip2 diminished its binding affinity (Kozlov et al. 2004).
In our previous report (Funakoshi et al. 2007), we demonstrated that translation termination-coupled deadenylation was slowed by mutation of the region containing the well-conserved tenth Phe residue of PAM2 motif(s) in eRF3, Pan3, or Tob. Furthermore, interaction of the deadenylases with PABPC1 is competitively inhibited by eRF3. Based on these results, we proposed a working model of deadenylation: The termination complex, eRF1–eRF3, which dominantly associates with PABC in poly(A)-bound PABPC1, is recruited from the PABC domain to the ribosomes upon translational termination, increasing the catalytic activities of the deadenylase complexes by allowing them to access PABC on poly(A)-bound PABPC1 and the 3′ end of poly(A) (Funakoshi et al. 2007). Therefore, competitive interaction of eRF1–eRF3, Pan2–Pan3, and Caf1–Ccr4 with PABC plays a central role in coupling translation termination and deadenylation.
Interestingly, eRF3 possesses two PAM2 motifs (residues 67–78 and 76–87 in eRF3a, referred to as PAM2-N and PAM2-C, respectively) that partially overlap (Fig. 1). Among a variety of PAM2-containing proteins, the overlapping PAM2 motifs are only found in eRF3 and are distributed widely in metazoan eRF3s (Kononenko et al. 2010). Although the PAM2-C motif—but not PAM2-N—in eRF3 reportedly plays a critical role in PABPC1 binding (Kononenko et al. 2010), a previous study indicated that either PAM2 motif peptide is active for PABC binding (Kozlov et al. 2004). The crystal structures of PABC in complex with peptides containing PAM2-N or PAM2-C have been reported (Kozlov and Gehring 2010). Therefore, the overlapping PAM2 motifs seem to provide eRF3 with a notable function among the many PAM2-containing proteins. However, the physiological function of these eRF3 motifs in translation termination-dependent regulation of deadenylase activity has remained elusive.
Here, we demonstrated that dominant-negative mutants of either PAM2 motif slowed eRF3-mediated deadenylation, showing that both are required for function. Isothermal titration calorimetry (ITC) and NMR analyses revealed that the interaction is in equilibrium between the two states, where either PAM2-N or PAM2-C of eRF3 binds to PABC of PABPC1. These results indicate that when one of the PAM2 motifs of eRF3 binds to PABC, another PAM2 is partially accessible to the other PABC. Based on these results, we propose a biological role for the PAM2 motifs in the regulation of deadenylase accessibility to the PABPC1 molecule at the 3′ end of poly(A).
RESULTS
Both PAM2 motifs mediate poly(A) degradation
To explore the roles of the overlapping PAM2 motifs in eRF3, we prepared single alanine mutants of the phenylalanine residues at position 10 of the PAM2-N and C motifs (F66A and F75A of eRF3b); each is supposed to inactivate a single motif, which left the other active. In addition, we prepared a double mutant (F66A/F75A) to abolish affinity for PABPC1 (see below for the effects of these mutations on PABC binding affinity). The effect of ectopic expression of these mutants and wild-type eRF3b on eRF3-mediated mRNA normal decay was assessed by a dominant-negative approach.
First, HeLa cells were cotransfected with a β-globin reporter plasmid, a plasmid expressing tetracycline repressor, a reference plasmid expressing 5xFlag-EGFP as a transfection/loading control, and a plasmid expressing either 5xMyc-eRF3b or a mutant derivative (F66A, F75A, or F66A/F75A). Deadenylation kinetics were examined by transcriptional pulse-chase experiments (Fig. 2A,B). Transcription of the reporter gene was driven by pulsed addition of tetracycline and metabolism of the newly transcribed mRNAs was followed after transcription shut-off by removal of tetracycline from the culture medium. Overexpression of F66A, F75A, or F66A/F75A to ∼10-fold the level of endogenous eRF3 (Supplemental Fig. 1) suppressed the rate of deadenylation and significantly prolonged mRNA half-life. The mutants had no effect on translation termination in a translational read-through assay (Supplemental Fig. 2).
FIGURE 2.

Comparison of deadenylation rates and mRNA half-lives in HeLa cells. (A) Flag-β-globin and 5xFlag-EGFP mRNAs were analyzed by Northern blotting. HeLa cells were cotransfected with pFlag-CMV5/TO-Gl, pCMV-5xFlag-EGFP, pcDNA6-T7-TR, and either pCMV-5xMyc (lanes 1–4), pCMV-5xMyc-eRF3b (F66A) (lanes 5–8), pCMV-5xMyc-eRF3b (F75A) (lanes 9–12), pCMV-5xMyc-eRF3b (F66A/F75A) (lanes 13–16), or pCMV-5xMyc-eRF3b (lanes 17–20). One day later, Flag-β-globin mRNA was induced by tetracycline for 2.5 h, and cells were harvested at the specified times transcription was stopped. To analyze steady-state mRNAs, Flag-β-globin transcription was induced by treatment with tetracycline for 12 h (lanes 21,22). To mark deadenylated (A0) RNA, the steady-state mRNAs were digested with RNase H in the presence of oligo(dT) (lane 22). 5xFlag-EGFP mRNA served as a loading control. (B) Deadenylation rates and mRNA half-lives were calculated. (*) P < 0.05 compared with cells transfected with pCMV-5xMyc. The results in panel B are expressed as means ± SD of data from three independent experiments. (C) HeLa cells were transfected with pCMV-5xMyc (lanes 1,6,7), pCMV-5xMyc-eRF3b (lanes 2,8), pCMV-5xMyc-eRF3b (F66A) (lanes 3,9), pCMV-5xMyc-eRF3b (F75A) (lanes 4,10), or pCMV-5xMyc-eRF3b (F66A/F75A) (lanes 5,11). Cytoplasmic extracts were immunoprecipitated (IP) using anti-PABPC1 (lanes 7–11) or, as a control, preimmune serum (lane 6). The immunoprecipitates (lanes 6–11) and inputs (lanes 1–5) were analyzed by Western blotting using anti-PABPC1, anti-Myc, or anti-eRF3. Numbers immediately below the panel represent IP efficiencies of cellular eRF3 normalized to cellular PABPC1, where the normalized efficiency of cellular eRF3 calculated from lane 7 was defined as 100%. (N.D.) Indicates that cellular eRF3 was not detected. Results are representative of two independent experiments.
Then, we examined dominant-negative binding of these mutants to cellular PABPC1. Figure 2C (lanes 1–5) indicates that comparable levels of eRF3b protein were expressed, as shown in Supplemental Figure 1. Coimmunoprecipitation (Fig. 2C, lanes 6–8) indicated that the overexpressed eRF3 and F75A mutant competitively excluded endogenous eRF3 from cellular PABPC1, while the F66A and F66A/F75A mutants did not. These results strongly suggest that PAM2-N—which is active in the F75A mutant and inactive in the F66A and F66A/F75A mutants—is critical for binding to PABPC1, while PAM2-C, which is inactivated by the F75A mutant, mediates acceleration of deadenylation, thereby shortening of the mRNA half-life.
The PABC binding site on eRF3a is located within residues 64–94
To physicochemically characterize the interaction between eRF3 and PABPC1, we first aimed to identify the PABC binding site on eRF3 by ITC and NMR analyses. Here, we used fragments of eRF3a, instead of eRF3b, because the amount of the bacterial expression of the eRF3a fragments was larger than that of eRF3b. Since the PAM2 sequences lie between residues 67 and 87 in eRF3a (residues 67–78 and 76–87 for PAM2-N and PAM2-C, respectively), we compared the PABC binding affinity of the entire N-terminal region of eRF3a (residues 1–207) with those of the truncated eRF3a fragments, residues 51–102 and residues 64–94, both of which contain the overlapping PAM2 sequences, to see whether any other region contributes to PABC binding.
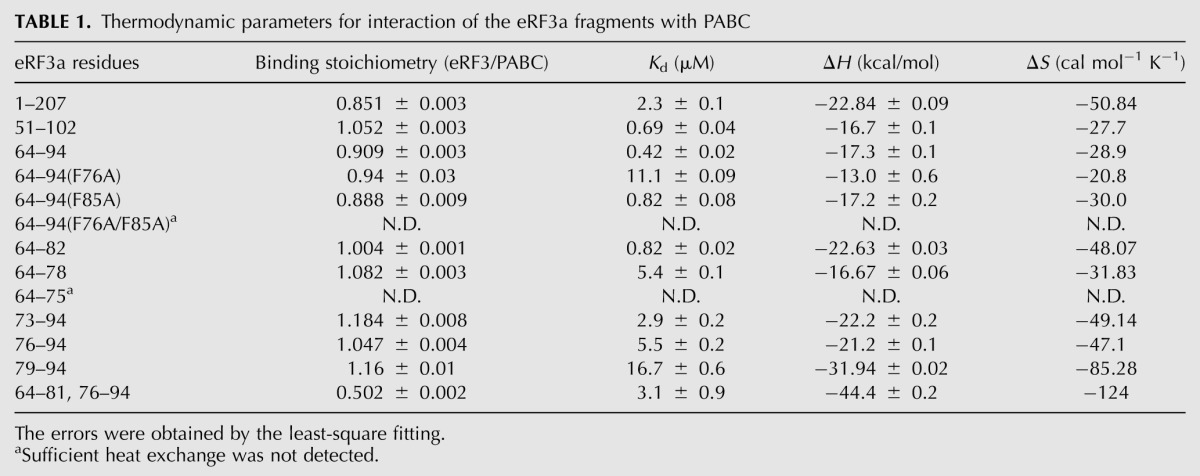
Fitting of the ITC results (Fig. 3; Table 1) provided comparable dissociation constants (Kd) of 0.4–2.3 μM with a binding stoichiometry of 1:1 for the three regions of eRF3a tested, indicating that the PABC binding site lies within residues 64–94 of eRF3a. Slightly higher affinity for the shorter fragment suggests that the shorter peptide possesses more flexibility to fit the binding site on PABC.
FIGURE 3.

Isothermal titration microcalorimetric analyses of the interactions between eRF3a fragments and PABC. (A, upper panel) Trace of the calorimetric titration of 29 10-μL aliquots of eRF3a(51–102) into the cell containing PABC. (Lower panel) The integrated binding isotherm obtained from the experiment was fitted using a single-site model. The parameters obtained from the best fit (solid line) with the error values calculated from the fittings are summarized in Table 1. (B) Amino acid sequence alignment of the peptides used for the ITC analyses. PAM2-N (blue), PAM2-C (cyan), and their overlapping region (red). (Gray) Sequences derived from cloning artifacts.
TABLE 1.
Thermodynamic parameters for interaction of the eRF3a fragments with PABC
Then, we observed the 1H–15N HSQC spectra of 15N-labeled eRF3a (residues 51–102) in the presence or absence of PABC. The spectrum in the PABC-free state exhibited narrow signal dispersion in the 1H dimension, indicating that this region is unstructured (Fig. 4A, black). Upon addition of PABC to 15N-labeled eRF3a(51–102), chemical shift changes and significant line broadening were observed (Fig. 4A, red). Broadening was also reported for the interaction of eRF3a (residues 64–91) with PABC (Kozlov et al. 2004). Backbone assignments obtained by a series of triple resonance experiments using uniformly 13C,15N-labeled eRF3a(51–102) revealed that the signals perturbed by the addition of PABC were for residues 64–94.
FIGURE 4.

Chemical shift changes of uniformly 15N-labeled eRF3a(51–102) upon addition of PABC. (A) Overlay of the 1H–15N HSQC spectra of 15N-labeled eRF3a(51–102) in the absence (black) and presence (red) of PABC. (B) The chemical shift changes are plotted versus the residue number of eRF3a. Signals from residues 70–92 disappeared upon addition of PABC.
We concluded that the PABC-binding site on eRF3a is located within residues 64–94.
Only one PAM2 motif at a time interacts with PABC
Further ITC analyses were performed to characterize PABC binding of eRF3a(64–94) single mutants [position 10 in PAM2-N (F76A) and PAM2-C (F85A)] and the double mutant F76A/F85A, each of which corresponds to F66A, F75A, and F66A/F75A of eRF3b in Figure 2 (see also Fig. 1). Kd values of 11 and 0.8 μM with a binding stoichiometry of 1:1 were obtained for the F76A and F85A mutants, respectively. These results indicate that PAM2-N possesses higher affinity for PABC than PAM2-C, which is consistent with the results of the coimmunoprecipitation analysis (Fig. 2C). The double mutant F66A/F75A showed no heat exchange reflecting binding (Table 1).
In addition, ITC analyses for several shorter eRF3a fragments (Fig. 3B) revealed that eRF3a residues 64–82 and 73–94, containing PAM2-N and PAM2-C, respectively, exhibited Kd values of 0.82 and 2.9 μM and a binding stoichiometry of 1:1. These values are comparable to those obtained with fragments containing both PAM2 motifs (residues 1–207, 51–102, and 64–94) (Table 1). On the other hand, fragments containing an incomplete PAM2 motif (peptides derived from residues 64–75, 64–78, 76–94, and 79–94) exhibited impaired affinity. These results indicate that the PABC interaction can occur at either PAM2 motif.
We prepared a synthetic peptide containing the two PAM2 motifs of eRF3 separated by a 6-residue repeat (residues 64–81 followed by 76–94) (Fig. 3B). Although a similar Kd of 3.1 μM was obtained for the interaction between this peptide and PABC, the binding stoichiometry was 1:2 (Table 1), supporting the notion that simultaneous binding of two PABC molecules to an eRF3a molecule is precluded by the overlap of the two PAM2 motifs, despite both motifs being able to bind PABC.
We concluded that both PAM2 motifs in eRF3 can bind to PABC, although PAM2-N possesses higher affinity than PAM2-C, and either motif can bind to PABC at a time.
Binding of eRF3 to PABC with chemical exchange between the two complexes: PABC in complex with PAM2-N and PAM2-C
We investigated the spectral changes of 15N-labeled PABC upon interaction with eRF3a(64–82) and eRF3a(73–94), which contain PAM2-N and PAM2-C, respectively. 1H–15N HSQC spectra of 15N-labeled PABC showed sharp PABC signals when complexed with either eRF3a(64–82) or eRF3a(73–94), while significant line broadening was observed for 15N-labeled PABC upon addition of increasing amounts of eRF3a(64–94), which contains the two overlapping PAM2 motifs. The broadened signals observed for 15N-labeled PABC–eRF3a(64–94) exist midway between the corresponding signals in the spectra of 15N-labeled PABC in complex with eRF3a(64–82) and eRF3a(73–94) (L585, E601, and E621) (Fig. 5A). There are also signals split into two peaks, each of which overlaps with the corresponding signals in complex with eRF3a(64–82) and eRF3a(73–94) (S591, V607, and Q608) (Fig. 5A). The assignments of these broadened or split signals were confirmed by tracing the signals through titration experiments (Fig. 5B).
FIGURE 5.

Binding of eRF3 to PABC with chemical exchange between complexes PABC–PAM2-N and PABC–PAM2-C. (A) Spectral overlay of 1H–15N HSQC of 15N-labeled PABC in the presence of eRF3a fragments. Spectra in the presence of eRF3a fragments, residues 64–82 (black), 73–94 (red), and 64–94 (green). (B) Spectral changes of 1H–15N HSQC of 15N-labeled PABC upon sequential additions of eRF3a (64–94). The molar ratios are indicated. (C) Schematic drawing of the chemical exchange between complexes PABC–PAM2-N and PABC–PAM2-C. PAM2-N (purple); PAM2-C (red); the overlapping regions (yellow).
It is well known that broadening or splitting of NMR signals is observed in residues experiencing chemical exchange between two states, where the exchange rate is comparable to or slower than the chemical shift difference between states (Cavanagh et al. 2006). Therefore, our NMR results strongly suggest chemical exchange between two complexes: the PAM2-N-bound PABC and the PAM2-C-bound PABC (Fig. 5C). One of the split signals that corresponds to those in complex with eRF3a(64–82) is about twofold stronger than counterparts derived from the complex with eRF3a(79–94), which is consistent with the ITC findings in which eRF3a(64–82) possessed higher affinity for PABC than eRF3a(79–94). At the experimental concentration of 300 μM for PABC and eRF3, the Kd value of 0.4 μM (Table 1) suggests that 96% of the PABC molecules are in the eRF3-bound state. Thus, populations of PABC in the free state and PABC in complex with PAM2-N or PAM2-C are ∼4%, 64%, and 32%, respectively.
The 1H chemical shift differences of 15N-labeled PABC in complex with eRF3a(64–82) and eRF3a(73–94) for the broadened residues (e.g., E564, L585, M596, and V607 in Fig. 5A) upon binding to eRF3a(51–102) ranged from 30 to 120 Hz, indicating that the chemical exchange rate between states is on the order of 102/sec at the experimental temperature of 303 K.
Three-dimensional structures of PABC in complex with PAM2-N and PAM2-C
To describe the two exchanging states, we determined the three-dimensional structures of each complex: PABC in complex with eRF3a(64–82; PAM2-N) and eRF3a(73–94; PAM2-C). Statistics for these structures are summarized in Table 2. Figure 6 shows the solution structures of PABC–eRF3a(64–82) and PABC–eRF3a(73–94). The structure of the N-terminal helix 1 was less well defined due to the fewer NOEs observed for this region, suggesting that helix 1 is loosely packed with other helices. The region containing helices 2–5 contains hydrophobic pockets, one between helices 2 and 3 (N-pocket), consisting of L585, I588, V607, and A610, and another between helices 3 and 5 (C-pocket), consisting of G563, F567, T582, and L586 (Fig. 6C,D; Kozlov et al. 2004). These pockets play critical roles in recognition of the PAM2 hydrophobic residues.
TABLE 2.
NMR and refinement statistics for protein structures
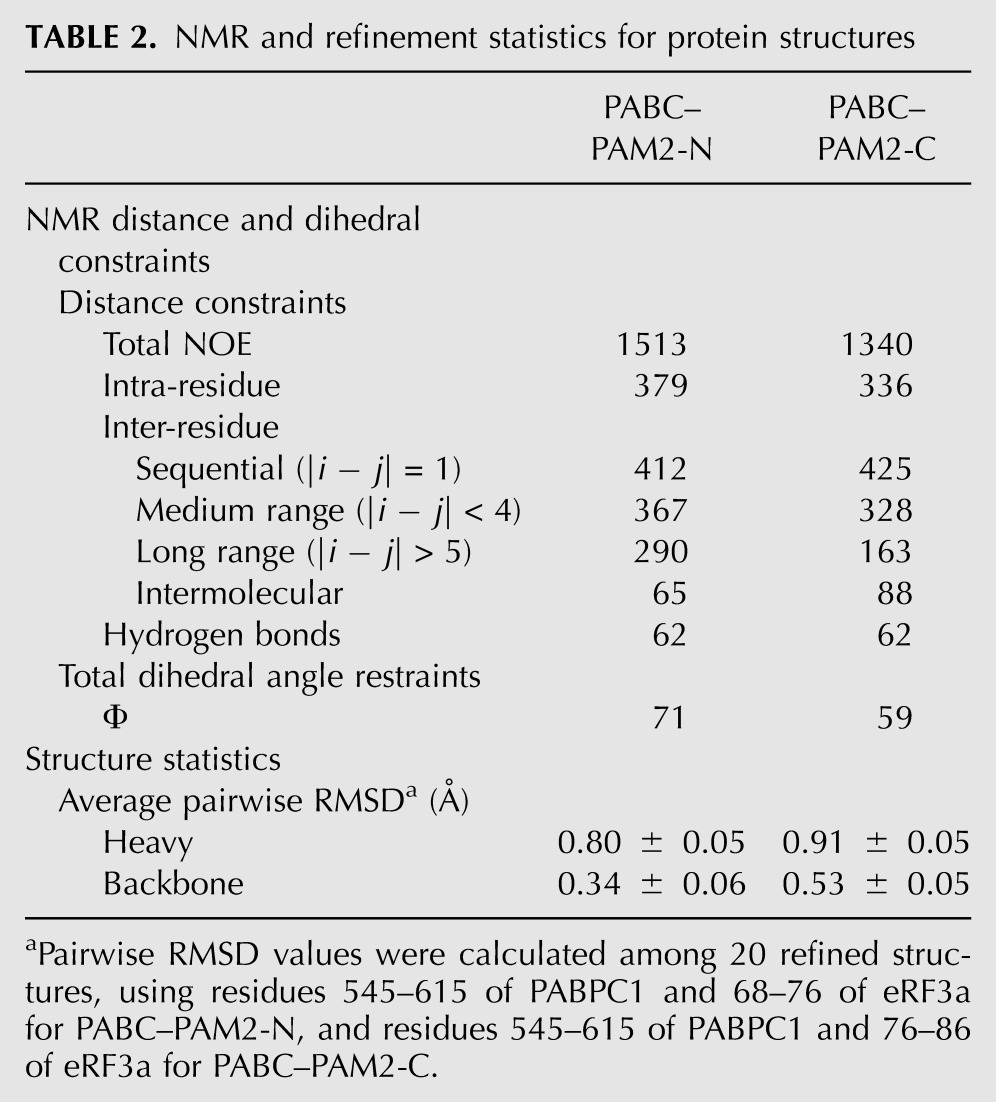
FIGURE 6.

Overlay of the 20 structures of (A) PABC–eRF3a(64–82), PDB code 2rqg (BMRB code 10019), and (B) PABC–eRF3a(73–94), PDB code 2rgh (BMRB code 7033). (A,B) Backbone structures of the PABC residues 543–619 (green). Heavy atoms of eRF3a residues 65–80 and 75–88 are shown in A and B. Residue numbers for both termini are indicated. (C,D) Molecular surfaces of PABC, colored by the electrostatic potential, are shown with a ball-and-stick model of the bound eRF3a residues 65–80 (C) and 75–88 (D). The hydrophobic pockets on PABC (N- and C-pockets) are indicated by ovals.
A specific tertiary structure is induced in each PAM2 motif by binding to PABC. In spite of differences in the sequences at positions 1–3, 6, 8, and 9 of PAM2-N and PAM2-C (Fig. 1), both motifs adopt similar backbone structures in which the residues at positions 4–7 (N70, V71, N72, and A73 for PAM2-N and N79, V80, H81, and A82 for PAM2-C) form a type-II β-turn. The side chains of V71 and V80 at position 5 face outside from the turn, interacting with V613 and L614 within helix 5 of PABC. No notable intermolecular interaction was observed for residues N72 and H81 at position 6, whose side chains are exposed to the solvent, suggesting that a hydrophilic residue is preferable for this position. While the PABC-bound PAM2 of Paip1 and 2 contains two β-turn structures, only one β-turn was observed for the PAM2 motifs of eRF3.
The residues at position 10 of PAM2-N and C, F76 and F85, are accommodated in the N-pocket of PABC. The hydrophobic residues at position 3, L69 in PAM2-N and P78 in PAM2-C, bind to the C-pocket. In addition to these interactions, which were observed for the PAM2 motifs in Paip1 and 2 (Kozlov et al. 2004), the C-pocket also accommodates a phenylalanine side chain at the N-terminal position −2 of PAM2-N (F65) and position 1 of PAM2-C (F76). It should be noted that residues F76, V77, and P78 play different roles in these structures; they bind to the N-pocket as a part of PAM2-N and to the C-pocket as a part of PAM2-C, providing a structural basis for the prevention of simultaneous binding of two PABC molecules.
eRF3 interaction with PABPC1 multimers on poly(A)
We further investigated whether the eRF3–PABC interaction characterized by ITC and NMR can be extrapolated to the interaction of eRF3 with PABPC1 multimers on the poly(A) tail. We performed the ITC experiments by injecting eRF3a(64–94) into full-length human PABPC1 in the presence or absence of poly(A). We used commercially available poly(A) that was 1000 nt long on average (GE Healthcare, hereafter referred to as A1000), on which more than 10 PABPC1 molecules can multimerize (Gorlach et al. 1994). We confirmed there was no heat exchange during injection of eRF3a(64–94) into the buffer or A1000 solution.
The ITC isotherms are shown in Figure 7, and the binding stoichiometry and Kd values obtained by fitting of the titration curve are summarized in Table 3. The binding stoichiometry values were ∼0.5 for all ITC results, regardless of the presence or absence of poly(A), indicating that multimerization of PABPC1 on poly(A) does not affect the binding stoichiometry. All PABPC1 molecules in multimers on poly(A) bind to eRF3, as does PABPC1 in the absence of poly(A). The value of 0.5 indicates that ∼50% of PABPC1 molecules are not active for eRF3 binding, probably due to aggregation and/or instability of PABPC1 during nucleic acid–free preparation.
FIGURE 7.

Isothermal titration microcalorimetric analyses of the interactions between eRF3a(64–94) and full-length PABPC1. (Upper panels) Trace of the calorimetric titration of 19 2-μL aliquots of eRF3a(64–94) into the cell containing PABPC1 in the presence (A) or absence (B) of A1000. (Lower panels) The integrated binding isotherm obtained from the experiment was fitted using a single-site model. Parameters obtained from the best fit (solid line) with error values calculated from the fittings are summarized in Table 3.
TABLE 3.
Binding stoichiometry and dissociation constant values for interaction of eRF3a(64–94) and its mutant derivative with PABPC1
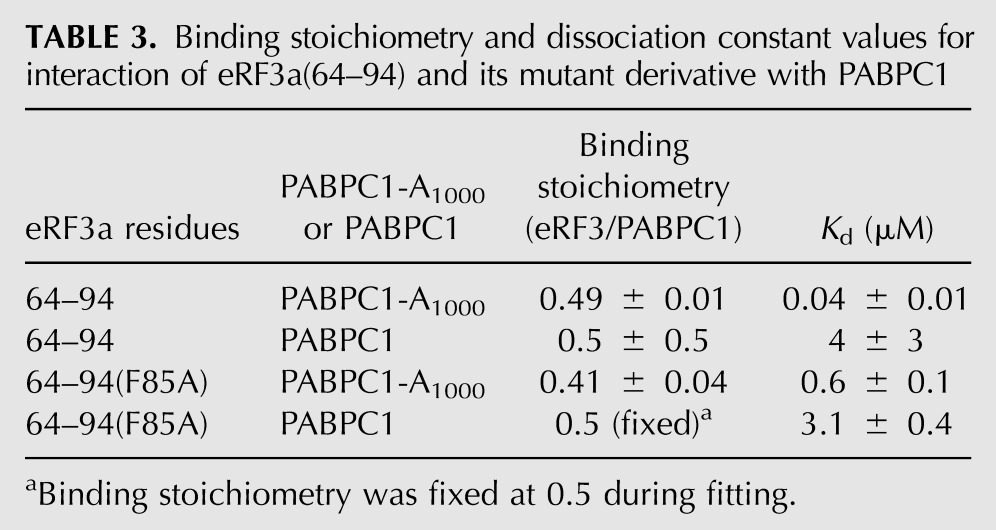
Interestingly, PABPC1 affinity increased 100-fold and fivefold for eRF3a(64–94) and F85A in a poly(A)-dependent manner. This is partly due to the increased local concentration of PABPC1 on poly(A), which enhances rebinding of eRF3 to PABPC1. The affinity enhancement for eRF3a(64–94) is remarkably higher than the F85A mutant, suggesting that PAM2-C, which is inactivated in the F85A mutant, also contributes to the rebinding to the PABPC1 multimer on poly(A).
DISCUSSION
We have proposed that in human cells, translation termination-coupled deadenylation is mediated by the termination complex eRF1–eRF3 (Funakoshi et al. 2007). We demonstrated that eRF1–eRF3 competes with the deadenylase complexes Caf1–Ccr4 and Pan2–Pan3 via interaction of the PAM2 motifs and PABC of PABPC1 (Fig. 8A). Thus, upon translational termination, recruitment of PABPC1-associated eRF1–eRF3 to the ribosomes permits access of the deadenylase complexes to the 3′ end of poly(A), thus coupling up-regulation of deadenylase complex activity and translation termination (Fig. 8B; Ruan et al. 2010).
FIGURE 8.

Schematic drawing of the translation termination-coupled regulation of the PAM2-containing deadenylase complexes by eRF3. (A) Competitive suppression of deadenylase activity by eRF3 binding to PABPC1. (B) Activation of PAM2-containing deadenylases through the dual interactions of PAM2–PABC and deadenylase–poly(A). (C) Possible role of the overlapping PAM2 motifs in eRF3. Upon the recruitment of one of the eRF3 molecules to the ribosome, relocation of eRF3 among the poly(A)-bound PABPC1 molecules would eventually allow a particular PABPC1 to become available for the dual deadenylase interactions, as shown in B.
Among the PAM2-containing proteins (eRF3, Tob, and Pan3), only eRF3 possesses two overlapping motifs. We investigated their biological role by testing the effect of phenylalanine-to-alanine substitutions at PAM2 (position 10) on the rate of deadenylation and mRNA decay, by a dominant-negative approach. We prepared single mutants of eRF3b, namely, F66A and F75A, and the double mutant F66A/F75A, which are supposed to inactivate the PABC-binding affinities of PAM2-N, C, and both motifs, respectively. Overexpression of any of these mutants significantly slowed deadenylation and mRNA decay in comparison to wild-type eRF3b (Fig. 2A,B), suggesting that both PAM2 motifs are required for translation termination-coupled deadenylation. Coimmunoprecipitation demonstrated that overexpression of wild-type eRF3b or F75A excluded endogenous eRF3 from cellular PABPC1, but F66A or F66A/F75A overexpression did not (Fig. 2C), indicating that PAM2-N is critical for PABPC1 binding and that the F75A and other mutants slowed deadenylation by different mechanisms.
Overexpression of F66A or F66A/F76A leaves the endogenous eRF3 molecules on PABPC1 (Fig. 2C), competitively inhibiting access of the deadenylases and slowing deadenylation. Endogenous eRF3 in the translation termination complex is replaced by the overexpressed mutants, which function normally in the translation termination process (Supplemental Fig. 2).
On the other hand, overexpression of F75A excluded endogenous eRF3 from PABPC1 as the wild type did, but suppressed deadenylation and mRNA decay (Fig. 2). These results strongly suggest that PAM2-C is required for full activity of eRF3 on deadenylation and mRNA decay.
Although PAM2-C was unable to exclude endogenous eRF3 from cellular PABPC1, as demonstrated by the F66A mutants (Fig. 2C), ITC and NMR analyses demonstrated that PAM2-C also possesses binding affinity for PABC that is 3.5-fold weaker than that of PAM2-N (Table 1). Only one PAM2 motif binds to PABC at a time; PABC in complex with PAM2-N or PAM2-C of eRF3 exchange with each other at an estimated rate of 102/sec (Fig. 5). The reported crystal structures (Kozlov and Gehring 2010) and our solution structures of the exchanging complexes (Fig. 6) showed that the overlapping region (residues F76, V77, and P78 in eRF3a) plays a different role in each complex, where the region binds to PABC helices α2 and α3 as a part of PAM2-N, and to helices α3 and α5 as a part of PAM2-C.
We further investigated the interaction of eRF3 with poly(A)-bound PABPC1 multimers (Fig. 7). The stoichiometry was unchanged upon binding to either poly(A)-bound or free PABPC1 or PABC (Table 3), suggesting that most PABPC1 molecules on poly(A) can bind to eRF3. Interestingly, PABPC1 affinity increased 100-fold and fivefold for eRF3a(64-94) and F85A, respectively, in a poly(A)-dependent manner. These results suggest that when multiple PABPC1 molecules are accumulated on poly(A), rebinding of eRF3 to PABPC1 is enhanced. The remarkable 100-fold enhancement of eRF3a(64–94), which contains two overlapping PAM2 motifs, versus fivefold enhancement for the F85A mutant that inactivates PAM2-C, strongly suggests that PAM2-C contributes to rebinding. Since enhanced affinity is observed only when the local PABPC1 concentration increases on poly(A), rebinding to the neighboring molecules of PABPC1 on poly(A) should occur; i.e., eRF3 seems to translocate multiple PABPC1 molecules on poly(A). Therefore, the overlapping PAM2 motifs not only increase affinity for the multimerized PABPC1 but also enable eRF3 to translocate among multiple PABPC1 molecules on poly(A).
This unique interaction mode seems to explain the biological role of the overlapping PAM2 motifs. Tighter binding to the multimerized PABPC1 on poly(A) is beneficial to preclude access of the deadenylases. Enhanced rebinding and translocation increase the probability that the PABPC1 molecule at the most 3′ end of poly(A) enters the eRF3-unbound state and becomes available for the deadenylase complexes (Fig. 8B) when one of the PABPC1-bound termination complexes is recruited to the ribosome upon translation termination (Fig. 8C). This allows the up-regulation of deadenylase catalytic activity (Fig. 8B). We propose that this is the molecular mechanism of translation termination-coupled deadenylation, achieved by interaction of overlapping PAM2 motifs with multimerized PABPC1 on poly(A).
MATERIALS AND METHODS
Plasmids
pcDNA6-T7-TR was generated by inverse PCR using pcDNA6/TR (Invitrogen) and the primer pair 5′-CGGCGGCCAGCAGATGGGCTCTAGATTAGATAAAAGTAAAGTG-3′ (sense) and 5′-GTCATGCTGGCCATGGTGGCCAATTCTTTGCCAAAATGATGAG-3′ (antisense). To construct pCMV-5xMyc-eRF3b, cDNA encoding mouse eRF3b was inserted into the EcoRI and XhoI sites of pCMV-5xMyc (Hosoda et al. 2011). pCMV-5xMyc-eRF3b mutants were generated by converting TTC (F66, F75) to GCC (Ala) using the QuikChange® Site-Directed Mutagenesis Kit (Stratagene).
Immunoprecipitation
HeLa cells were lysed in buffer A (20 mM Tris-HCl at pH 7.5, 50 mM NaCl, 2.5 mM EDTA, 0.5% Nonidet P-40, 0.1 mM PMSF, 2 μg/mL aprotinin, 2 μg/mL leupeptin, and 1 μg/mL RNase A) for 30 min at 4°C. After centrifugation at 15,000g for 10 min, the supernatant was incubated with anti-PABPC1 or preimmune serum and Protein A Sepharose 4 Fast Flow (GE Healthcare). The resin was washed three times with buffer A. Bound protein was eluted with SDS-PAGE sample buffer and analyzed by Western blotting using anti-PABPC1, anti-Myc, or anti-eRF3.
Transcriptional pulse-chase analysis
HeLa cells were cotransfected with the pFlag-CMV5/TO-Gl (Funakoshi et al. 2007) reporter plasmid, pCMV-5xFlag-EGFP reference plasmid (Hosoda et al. 2011), pcDNA6-T7-TR repressor plasmid, and either pCMV-5xMyc, pCMV-5xMyc-eRF3b, pCMV-5xMyc-eRF3b (F66A), pCMV-5xMyc-eRF3b (F75A), or pCMV-5xMyc-eRF3b (F66A/F75A). After 24 h, cells were treated with 10 ng/mL tetracycline for 2.5 h to induce transcription, washed three times with phosphate-buffered saline to remove the tetracycline, and harvested after transcription shut-off. Total RNA was isolated as described previously (Funakoshi et al. 2007). To analyze deadenylated mRNA, 20 μg of total RNA was incubated with RNase H and oligo(dT)20, as described previously (Hosoda et al. 2011). 5xFlag-EGFP and Flag-β-globin mRNAs were detected by Northern blotting using [32P]-labeled oligonucleotides: 5′-CTCCTCAGGAGTCAGGTGCACCAT-3′, 5′-GGTCCAAGGGTAGACCACCAGCAG-3′, and 5′-CTTATCGTCGTCATCCTTGTAATC-3′. The average length of poly(A) tails at each time point was calculated by auto peak search analysis using Image Gauge Ver. 4.23 (FUJIFILM) software. The half-life of Flag-β-globin mRNA, which was normalized by 5xFlag-EGFP mRNA, was determined by measuring the intensity of the radioactive band with Image Gauge Ver. 4.23 (FUJIFILM) software.
Protein expression and purification
The N-terminal domain of eRF3a (residues 1–207), PABC (residues 541–623 of human PABPC1), and full-length human PABPC1 were expressed as glutathione S-transferase (GST)-fusion proteins in BL21(DE3) (Invitrogen) Escherichia coli, using the vector pET-42b (Novagen). Other fragments of eRF3a (residues 51–102, 64–94, 64–82, and 79–94) and three mutants of eRF3a (residues 64–94), F76A, F85A, and F76A/F85A, were also expressed as GST-fusion proteins, using the vector pGEX-6P1 (GE Healthcare). The GST-fusion proteins were purified on a Glutathione-Sepharose 4B column (GE Healthcare), followed by digestion with factor Xa (Novagen) or PreScission Protease (GE Healthcare). The cleaved GST and the uncleaved fusion proteins were removed by chromatography on a Glutathione-Sepharose 4B column. Further purification using a reverse-phase C18 column was carried out for the eRF3a fragments (residues 51–102, 64–94, and 64–82), and the three mutants of eRF3a (residues 64–94) and PABC. For full-length PABPC1, bound nucleotides were removed by a poly(U)-Sepharose column followed by a MonoS column to remove partially digested PABPC1. The molecular weights of all eRF3 fragments and PABC were confirmed using matrix-assisted laser desorption/ionization mass spectroscopy. These proteins were lyophilized and dialyzed against the buffer used for each analysis. PABC refolded upon dissolving in the buffer, which was confirmed by the chemical shift dispersion of the 1H-NMR spectra. Four eRF3a peptides, for residues 64–75, 64–78, 73–94, and 76–94, were synthesized by QIAGEN K.K. A 37-residue peptide consisting of residues 64–81, followed by residues 76–94, was synthesized by Funakoshi Co., Ltd. Hereafter, we refer to the eRF3a fragment peptide consisting of the residues x to y as eRF3a(x–y).
Isothermal titration calorimetry
Binding of eRF3a fragments to PABC and of eRF3a(64–94) to full-length PABPC1 were measured by isothermal titration calorimetry (ITC) (Wiseman et al. 1989) using a MicroCal VP-ITC or iTC200 MicroCalorimeter (MicroCal Inc.). Protein samples were dialyzed against a buffer containing 10 mM Tris-HCl (pH 7.4) and 1 mM dithiothreitol. Experiments were performed at 25°C. PABC (20–50 μM) was titrated with different eRF3a fragments (0.2–0.5 mM), or a fixed amount of PABPC1 (4.5 μM) was titrated with eRF3a(64–94) or its F85A derivative (58 μM). Poly(A) (A1000) was dialyzed to remove shorter fragments of poly(A), and the length was examined by agarose gel electrophoresis. Then, A1000 was quantified based on the extinction coefficient of 16 or 24 bases of poly(A) tract (A16 or A24), and mixed with PABPC1 at a concentration corresponding to 4.5 μM A16 or A24. Heats of dilution were determined by titration into the dialysis buffer and were subtracted from the raw titration data before analysis, using the MicroCal Origin software version 5.0, provided by the manufacturer. A single-site binding model was assumed. The thermodynamic parameters with error values were calculated from the fittings.
NMR spectroscopy
NMR samples were prepared at 0.5–1.0 mM in 95% H2O, 5% 2H2O buffer (20 mM K2HPO4, 150 mM NaCl at pH 6.7). NMR spectra were recorded at 30°C on a Bruker Avance 600 spectrometer, equipped with a triple axis gradient probe. Titrations of the 15N-labeled PABC with unlabeled eRF3 fragments or 15N-labeled eRF3 fragments with unlabeled PABC were monitored by 1H–15N HSQC spectra. NMR data processing and analysis were performed using XwinNMR (Bruker A.G.) and Sparky (T.D. Goddard and D.G. Kneller, SPARKY 3, University of California, San Francisco).
PABC in complex with eRF3a(64–82), containing PAM2-N with a GPLGS sequence at its N terminus, and PABC in complex with eRF3a(76–94) containing PAM2-C were prepared at a stoichiometry of 1:1. For heteronuclear NMR experiments, 13C,15N-labeled PABC–eRF3a(64–82); 13C,15N-labeled PABC–eRF3a(79–94); and PABC–15N-labeled eRF3a(64–82) were prepared.
Sequential assignments of the backbone resonances of PABC were achieved by HNCACB, CBCA(CO)NH, HBHANH, HBHA(CBCACO)NH, 15N-edited TOCSY-HSQC, and 15N-edited NOESY-HSQC experiments. Side-chain assignments were obtained from H(CCO)NH, C(CO)NH, and HCCH-TOCSY experiments. Stereospecific assignments of the valine and leucine methyl groups of PABC were obtained by analyzing constant time 1H–13C HSQC spectra of 10% 13C-enriched PABC complexed with eRF3a(64–82) and eRF3a(79–94), respectively (Neri et al. 1989).
Assignments of the 15N-labeled eRF3a(64–82) of eRF3a in complex with PABC were carried out by analyzing 15N-edited NOESY-HSQC and 15N-edited TOCSY-HSQC, while assignments of eRF3a(79–94) in complex with 13C,15N-labeled PABC were based on NOE connectivities by analyzing a series of isotope filter experiments using [13C,15N/F2]-filtered NOESY and TOCSY, [13C/F1,F2]-filtered NOESY.
Structure calculation
Approximate interproton distances were obtained from 13C-edited NOESY-HSQC, 15N-edited NOESY-HSQC, [13C/F3]-filtered [13C/F1]-edited HMQC-NOESY, and isotope-filtered NOESY spectra. The mixing time was 150 msec for all NOESY experiments.
The backbone coupling constants 3JNHα were measured from an HNHA experiment. The ϕ dihedral angle restraints were derived from the 3JNHα coupling constants and the chemical shift indices. Values of −60° ± 30° were used for the ϕ dihedral angles for α-helical regions.
A series of 1H–15N HSQC spectra was acquired on a sample freshly dissolved in 2H2O to identify the slowly exchanging amides. Amides that had not exchanged after 1 h and were located in regions with defined secondary structure based on NOE data were restrained to form HN–CO hydrogen bonds using the distance restraints dO-N = 3.3 Å and dO-HN = 2.3 Å.
CYANA version 2.1 (Guntert 2004; Nederveen et al. 2005) was used to compute seven cycles, each with 600 structures. The input data and structure calculation statistics are summarized in Table 2. The accuracy of the NMR models may be assessed based on the criteria for successful structure calculation using the program CYANA, as defined by Jee and Guntert (2003). The 20 lowest-energy (total energy) structures were chosen for the final structural ensemble. The Ramachandran plots of the final 20 structures, calculated for PABC in complex with eRF3a(64–82) and eRF3a(79–94) using PROCHECK version 3.4.4, showed 76.0% and 81.4%, 22.9% and 18.2%, 1.1% and 0.2%, and 0.0% and 0.2% of the residues in the most favored, additionally allowed, generously allowed, and disallowed regions, respectively (Laskowski et al. 1996).
DATA DEPOSITION
The 1H, 13C, and 15N resonance assignments have been deposited in the BioMagResBank with accession numbers 10019 and 7033 for PABC–eRF3a(64–82) and PABC–eRF3a(79–94), respectively. The structures of the PABC–eRF3a(64–82) and PABC–eRF3a(79–94) complexes have been deposited in the Protein Data Bank with accession codes 2rqg and 2rqh.
SUPPLEMENTAL MATERIAL
Supplemental material is available for this article.
ACKNOWLEDGMENTS
This work was supported in part by grants from the Japan New Energy and Industrial Technology Development Organization (NEDO) and the Ministry of Economy, Trade, and Industry (METI) (to I.S.); a Grant-in-Aid for Scientific Research on Priority Areas from the Japanese Ministry of Education, Culture, Sports, Science, and Technology (to M.O. and I.S.); and a grant from the Takeda Science Foundation (to M.O.).
Footnotes
Article published online ahead of print. Article and publication date are at http://www.rnajournal.org/cgi/doi/10.1261/rna.035311.112.
REFERENCES
- Albrecht M, Lengauer T 2004. Survey on the PABC recognition motif PAM2. Biochem Biophys Res Commun 316: 129–138 [DOI] [PubMed] [Google Scholar]
- Bianchin C, Mauxion F, Sentis S, Seraphin B, Corbo L 2005. Conservation of the deadenylase activity of proteins of the Caf1 family in human. RNA 11: 487–494 [DOI] [PMC free article] [PubMed] [Google Scholar]
- Cavanagh J, Fairbrother WJ, Palmer AG III, Rance M, Skelton NJ 2006. Chemical exchange effects in NMR spectroscopy. In Protein NMR spectroscopy principles and practice, 2nd ed., pp. 391–404. Elsevier Academic Press, Burlington, MA [Google Scholar]
- Chen J, Chiang YC, Denis CL 2002. CCR4, a 3′–5′ poly(A) RNA and ssDNA exonuclease, is the catalytic component of the cytoplasmic deadenylase. EMBO J 21: 1414–1426 [DOI] [PMC free article] [PubMed] [Google Scholar]
- Cosson B, Couturier A, Chabelskaya S, Kiktev D, Inge-Vechtomov S, Philippe M, Zhouravleva G 2002. Poly(A)-binding protein acts in translation termination via eukaryotic release factor 3 interaction and does not influence [PSI+] propagation. Mol Cell Biol 22: 3301–3315 [DOI] [PMC free article] [PubMed] [Google Scholar]
- Daugeron MC, Mauxion F, Seraphin B 2001. The yeast POP2 gene encodes a nuclease involved in mRNA deadenylation. Nucleic Acids Res 29: 2448–2455 [DOI] [PMC free article] [PubMed] [Google Scholar]
- Decker CJ, Parker R 1993. A turnover pathway for both stable and unstable mRNAs in yeast: Evidence for a requirement for deadenylation. Genes Dev 7: 1632–1643 [DOI] [PubMed] [Google Scholar]
- Ezzeddine N, Chang TC, Zhu W, Yamashita A, Chen CY, Zhong Z, Yamashita Y, Zheng D, Shyu AB 2007. Human TOB, an antiproliferative transcription factor, is a poly(A)-binding protein-dependent positive regulator of cytoplasmic mRNA deadenylation. Mol Cell Biol 27: 7791–7801 [DOI] [PMC free article] [PubMed] [Google Scholar]
- Fritz DT, Bergman N, Kilpatrick WJ, Wilusz CJ, Wilusz J 2004. Messenger RNA decay in mammalian cells: The exonuclease perspective. Cell Biochem Biophys 41: 265–278 [DOI] [PubMed] [Google Scholar]
- Frolova L, Le Goff X, Rasmussen HH, Cheperegin S, Drugeon G, Kress M, Arman I, Haenni AL, Celis JE, Philippe M, et al. 1994. A highly conserved eukaryotic protein family possessing properties of polypeptide chain release factor. Nature 372: 701–703 [DOI] [PubMed] [Google Scholar]
- Funakoshi Y, Doi Y, Hosoda N, Uchida N, Osawa M, Shimada I, Tsujimoto M, Suzuki T, Katada T, Hoshino S 2007. Mechanism of mRNA deadenylation: Evidence for a molecular interplay between translation termination factor eRF3 and mRNA deadenylases. Genes Dev 21: 3135–3148 [DOI] [PMC free article] [PubMed] [Google Scholar]
- Gorlach M, Burd CG, Dreyfuss G 1994. The mRNA poly(A)-binding protein: Localization, abundance, and RNA-binding specificity. Exp Cell Res 211: 400–407 [DOI] [PubMed] [Google Scholar]
- Guntert P 2004. Automated NMR structure calculation with CYANA. Methods Mol Biol 278: 353–378 [DOI] [PubMed] [Google Scholar]
- Hoshino S, Hosoda N, Araki Y, Kobayashi T, Uchida N, Funakoshi Y, Katada T 1999a. Novel function of the eukaryotic polypeptide-chain releasing factor 3 (eRF3/GSPT) in the mRNA degradation pathway. Biochemistry (Mosc) 64: 1367–1372 [PubMed] [Google Scholar]
- Hoshino S, Imai M, Kobayashi T, Uchida N, Katada T 1999b. The eukaryotic polypeptide chain releasing factor (eRF3/GSPT) carrying the translation termination signal to the 3′-poly(A) tail of mRNA. Direct association of erf3/GSPT with polyadenylate-binding protein. J Biol Chem 274: 16677–16680 [DOI] [PubMed] [Google Scholar]
- Hosoda N, Kobayashi T, Uchida N, Funakoshi Y, Kikuchi Y, Hoshino S, Katada T 2003. Translation termination factor eRF3 mediates mRNA decay through the regulation of deadenylation. J Biol Chem 278: 38287–38291 [DOI] [PubMed] [Google Scholar]
- Hosoda N, Funakoshi Y, Hirasawa M, Yamagishi R, Asano Y, Miyagawa R, Ogami K, Tsujimoto M, Hoshino S 2011. Anti-proliferative protein Tob negatively regulates CPEB3 target by recruiting Caf1 deadenylase. EMBO J 30: 1311–1323 [DOI] [PMC free article] [PubMed] [Google Scholar]
- Ikematsu N, Yoshida Y, Kawamura-Tsuzuku J, Ohsugi M, Onda M, Hirai M, Fujimoto J, Yamamoto T 1999. Tob2, a novel anti-proliferative Tob/BTG1 family member, associates with a component of the CCR4 transcriptional regulatory complex capable of binding cyclin-dependent kinases. Oncogene 18: 7432–7441 [DOI] [PubMed] [Google Scholar]
- Jee J, Guntert P 2003. Influence of the completeness of chemical shift assignments on NMR structures obtained with automated NOE assignment. J Struct Funct Genomics 4: 179–189 [DOI] [PubMed] [Google Scholar]
- Jia S, Meng A 2007. Tob genes in development and homeostasis. Dev Dyn 236: 913–921 [DOI] [PubMed] [Google Scholar]
- Kononenko AV, Mitkevich VA, Atkinson GC, Tenson T, Dubovaya VI, Frolova LY, Makarov AA, Hauryliuk V 2010. GTP-dependent structural rearrangement of the eRF1:eRF3 complex and eRF3 sequence motifs essential for PABP binding. Nucleic Acids Res 38: 548–558 [DOI] [PMC free article] [PubMed] [Google Scholar]
- Kozlov G, Gehring K 2010. Molecular basis of eRF3 recognition by the MLLE domain of poly(A)-binding protein. PLoS ONE 5: e10169 doi: 10.1371/journal.pone.0010169 [DOI] [PMC free article] [PubMed] [Google Scholar]
- Kozlov G, Trempe JF, Khaleghpour K, Kahvejian A, Ekiel I, Gehring K 2001. Structure and function of the C-terminal PABC domain of human poly(A)-binding protein. Proc Natl Acad Sci 98: 4409–4413 [DOI] [PMC free article] [PubMed] [Google Scholar]
- Kozlov G, Siddiqui N, Coillet-Matillon S, Trempe JF, Ekiel I, Sprules T, Gehring K 2002. Solution structure of the orphan PABC domain from Saccharomyces cerevisiae poly(A)-binding protein. J Biol Chem 277: 22822–22828 [DOI] [PubMed] [Google Scholar]
- Kozlov G, De Crescenzo G, Lim NS, Siddiqui N, Fantus D, Kahvejian A, Trempe JF, Elias D, Ekiel I, Sonenberg N, et al. 2004. Structural basis of ligand recognition by PABC, a highly specific peptide-binding domain found in poly(A)-binding protein and a HECT ubiquitin ligase. EMBO J 23: 272–281 [DOI] [PMC free article] [PubMed] [Google Scholar]
- Kozlov G, Menade M, Rosenauer A, Nguyen L, Gehring K 2010. Molecular determinants of PAM2 recognition by the MLLE domain of poly(A)-binding protein. J Mol Biol 397: 397–407 [DOI] [PubMed] [Google Scholar]
- Laskowski RA, Rullmannn JA, MacArthur MW, Kaptein R, Thornton JM 1996. AQUA and PROCHECK-NMR: Programs for checking the quality of protein structures solved by NMR. J Biol NMR 8: 477–486 [DOI] [PubMed] [Google Scholar]
- Mauxion F, Chen CY, Seraphin B, Shyu AB 2009. BTG/TOB factors impact deadenylases. Trends Biochem Sci 34: 640–647 [DOI] [PMC free article] [PubMed] [Google Scholar]
- Meyer S, Temme C, Wahle E 2004. Messenger RNA turnover in eukaryotes: Pathways and enzymes. Crit Rev Biochem Mol Biol 39: 197–216 [DOI] [PubMed] [Google Scholar]
- Nederveen AJ, Doreleijers JF, Vranken W, Miller Z, Spronk CA, Nabuurs SB, Guntert P, Livny M, Markley JL, Nilges M, et al. 2005. RECOORD: A recalculated coordinate database of 500+ proteins from the PDB using restraints from the BioMagResBank. Proteins 59: 662–672 [DOI] [PubMed] [Google Scholar]
- Neri D, Szyperski T, Otting G, Senn H, Wuthrich K 1989. Stereospecific nuclear magnetic resonance assignments of the methyl groups of valine and leucine in the DNA-binding domain of the 434 repressor by biosynthetically directed fractional 13C labeling. Biochemistry 28: 7510–7516 [DOI] [PubMed] [Google Scholar]
- Parker R, Song H 2004. The enzymes and control of eukaryotic mRNA turnover. Nat Struct Mol Biol 11: 121–127 [DOI] [PubMed] [Google Scholar]
- Prevot D, Morel AP, Voeltzel T, Rostan MC, Rimokh R, Magaud JP, Corbo L 2001. Relationships of the antiproliferative proteins BTG1 and BTG2 with CAF1, the human homolog of a component of the yeast CCR4 transcriptional complex: Involvement in estrogen receptor α signaling pathway. J Biol Chem 276: 9640–9648 [DOI] [PubMed] [Google Scholar]
- Roy G, De Crescenzo G, Khaleghpour K, Kahvejian A, O'Connor-McCourt M, Sonenberg N 2002. Paip1 interacts with poly(A) binding protein through two independent binding motifs. Mol Cell Biol 22: 3769–3782 [DOI] [PMC free article] [PubMed] [Google Scholar]
- Ruan L, Osawa M, Hosoda N, Imai S, Machiyama A, Katada T, Hoshino SI, Shimada I 2010. Quantitative characterization of Tob interactions provides the thermodynamic basis for translation termination-coupled deadenylase regulation. J Biol Chem 285: 27624–27631 [DOI] [PMC free article] [PubMed] [Google Scholar]
- Sachs AB, Deardorff JA 1992. Translation initiation requires the PAB-dependent poly(A) ribonuclease in yeast. Cell 70: 961–973 [DOI] [PubMed] [Google Scholar]
- Siddiqui N, Mangus DA, Chang TC, Palermino JM, Shyu AB, Gehring K 2007. Poly(A) nuclease interacts with the C-terminal domain of polyadenylate-binding protein domain from poly(A)-binding protein. J Biol Chem 282: 25067–25075 [DOI] [PubMed] [Google Scholar]
- Tirone F 2001. The gene PC3TIS21/BTG2, prototype member of the PC3/BTG/TOB family: Regulator in control of cell growth, differentiation, and DNA repair? J Cell Physiol 187: 155–165 [DOI] [PubMed] [Google Scholar]
- Tucker M, Valencia-Sanchez MA, Staples RR, Chen J, Denis CL, Parker R 2001. The transcription factor associated Ccr4 and Caf1 proteins are components of the major cytoplasmic mRNA deadenylase in Saccharomyces cerevisiae. Cell 104: 377–386 [DOI] [PubMed] [Google Scholar]
- Uchida N, Hoshino S, Imataka H, Sonenberg N, Katada T 2002. A novel role of the mammalian GSPT/eRF3 associating with poly(A)-binding protein in Cap/poly(A)-dependent translation. J Biol Chem 277: 50286–50292 [DOI] [PubMed] [Google Scholar]
- Uchida N, Hoshino S, Katada T 2004. Identification of a human cytoplasmic poly(A) nuclease complex stimulated by poly(A)-binding protein. J Biol Chem 279: 1383–1391 [DOI] [PubMed] [Google Scholar]
- Wiseman T, Williston S, Brandts JF, Lin LN 1989. Rapid measurement of binding constants and heats of binding using a new titration calorimeter. Anal Biochem 179: 131–137 [DOI] [PubMed] [Google Scholar]
- Yamashita A, Chang TC, Yamashita Y, Zhu W, Zhong Z, Chen CY, Shyu AB 2005. Concerted action of poly(A) nucleases and decapping enzyme in mammalian mRNA turnover. Nat Struct Mol Biol 12: 1054–1063 [DOI] [PubMed] [Google Scholar]
- Yoshida Y, Hosoda E, Nakamura T, Yamamoto T 2001. Association of ANA, a member of the antiproliferative Tob family proteins, with a Caf1 component of the CCR4 transcriptional regulatory complex. Jpn J Cancer Res 92: 592–596 [DOI] [PMC free article] [PubMed] [Google Scholar]
- Zhouravleva G, Frolova L, Le Goff X, Le Guellec R, Inge-Vechtomov S, Kisselev L, Philippe M 1995. Termination of translation in eukaryotes is governed by two interacting polypeptide chain release factors, eRF1 and eRF3. EMBO J 14: 4065–4072 [DOI] [PMC free article] [PubMed] [Google Scholar]