

Stem–loop II of U1 snRNA and Stem–loop IV of U2 snRNA typically have 10 or 11 nucleotides in their loops. The fluorescent nucleobase 2-aminopurine was used as a substitute for the adenines in each loop to probe the local and global structures and dynamics of these unusually long loops. Using steady-state and time-resolved fluorescence, the authors find that, while the bases in the loops are stacked, they are able to undergo significant local motion on the picosecond/nanosecond timescale. In addition, the loops have a global conformational change at low temperatures that occurs on the microsecond timescale, as determined using laser T-jump experiments. Nucleobase and loop motions are present at temperatures far below the melting temperature of the hairpin stem, which facilitates the conformational change required for protein binding to these RNA loops.
Keywords: 2-aminopurine fluorescence, RNA hairpin loops, snRNA stem–loops
Abstract
Stem–loop II of U1 snRNA and Stem–loop IV of U2 snRNA typically have 10 or 11 nucleotides in their loops. The fluorescent nucleobase 2-aminopurine was used as a substitute for the adenines in each loop to probe the local and global structures and dynamics of these unusually long loops. Using steady-state and time-resolved fluorescence, we find that, while the bases in the loops are stacked, they are able to undergo significant local motion on the picosecond/nanosecond timescale. In addition, the loops have a global conformational change at low temperatures that occurs on the microsecond timescale, as determined using laser T-jump experiments. Nucleobase and loop motions are present at temperatures far below the melting temperature of the hairpin stem, which may facilitate the conformational change required for specific protein binding to these RNA loops.
INTRODUCTION
Hairpins are the mainstay of RNA structures, as they provide nucleation sites for folding (the UUCG tetraloop), tertiary structure staples (tetraloop/tetraloop receptors), binding sites for Mg2+ ions, and binding sites for proteins. These local secondary structures can form during transcription, thus restricting secondary structure conformations of the overall RNA and, at the same time, providing rapid access to the RNA by ligands that bind to hairpin loops. Thermodynamically, an RNA loop is destabilizing: The presence of a loop adds an unfavorable free energy term. Measured and predicted values of free energies for initiating a hairpin loop of n nucleotides [ΔG°37iL(n)] are surprisingly similar for n = 4–9: from +4.9 to +5.5 kcal/mol (Serra et al. 1997).
However, there are several conserved biological systems that contain long RNA loops. One highly conserved example is the 15-nt sarcin-ricin loop in 23S and 28S rRNA. This loop is notable for its structured fold which includes a base-triple, noncanonical base pairs, a tetraloop, and a compressed overall structure (Correll et al. 1999, 2003). Other long loops are found in the vertebrate U1 and U2 snRNA components of the U1 and U2 snRNPs, respectively, that together have a total of nine hairpins, of which three have loops of 10 or more nucleotides (Reddy et al. 1981; Krol et al. 1990). The secondary structures of the human U1 snRNA Stem–loop II (SLII) and the U2 snRNA Stem–loop IV (SLIV) from human and Drosophila are shown in Figure 1 and are the subject of this study.
FIGURE 1.

Sequences of the three stem–loops (SL) or hairpins used here. SLIV from human and Drosophila differ in their loop-closing base pair. For all calculations, the free energies for loops include the loop-closing base pair. For hSLII, calculations are for a 6-bp stem; for hSLIV, the stem is 5 bp; and for dSLIV, the stem is 6 bp. Folding free energies were calculated using mfold (Zuker 2003).
The three longest hairpin loops in U1 and U2 snRNAs are binding sites for proteins: U1 SLI is bound by U1 70K protein (Query et al. 1989); U1 SLII by U1A or SNF (Scherly et al. 1989; Flickinger and Salz 1994; Polycarpou-Schwartz et al. 1996); and U2 SLIV by U2B″ or SNF (Scherly et al. 1990). The loop nucleotides must be available for recognition by these sequence-specific RNA binding proteins, which leads to the question of the mechanism for binding. The cocrystal structures (Oubridge et al. 1994; Price et al. 1998) of U1A:SLII and U2B″:SLIV illustrate how the protein invades the RNA loop to make specific contacts with nucleotides: Some nucleobases become stacked with tyrosine and phenylalanine sidechains, while others form hydrogen bonds to the protein backbone. The mechanism of the binding reaction could entail trapping a single loop structure that can be bound by the protein (conformational capture) (Williamson 2000) or making one RNA:protein contact that facilitates subsequent rearrangements of RNA and protein to form the final complex (induced fit) (Frankel and Smith 1998); of course, the reality is likely to be more complicated. Indeed, several possible mechanisms and schemes for U1A binding to SLII have been proposed (Katsamba et al. 2001; Pitici et al. 2002; Showalter and Hall 2002, 2004; Kormos et al. 2007; Qin et al. 2010; Anunciado et al. 2011) and may generally apply to SLIV binding by SNF and U2B″. Curiously, there are few studies that examine the properties of the hairpin loops in solution.
Intrinsic loop structure and dynamics are important parameters to define in order to understand how the RNA nucleobases come to be displayed for protein contacts (Luchansky et al. 2000; Law et al. 2006). Structural constraints of the free RNA loops appear to be minimal, since there are no apparent base pairs that form across the loop, although stacking interactions should be present (Shajani and Varani 2005). However, the extent of the flexibility has not been studied in detail, particularly with regard to the dynamics of the loops. Since it is not possible to experimentally describe all the conformational states accessible to the RNA, we ask a more focused question that addresses SLII and SLIV intrinsic flexibility in solution, using 2-aminopurine (2AP) steady-state and time-resolved fluorescence to probe loop environments and dynamics. We find that at or below room temperature, the bases are stacked, particularly those on the 3′ side of SLIV. The nucleobases at the loop apex have less stacking and more flexibility. Bases are moving on the psec/nsec timescale, and motions at the apex and side of the loop appear to be uncorrelated. The loop also undergoes μsec motions, at least below room temperature. When SLII is in a complex with U1A (Shajani et al. 2007), the 3′ UCC sequence at the side of the SLII loop is disordered (Showalter and Hall 2005). We found similar behavior for U2 SLIV bound to Drosophila SNF: The nucleotides on the 3′ side of the loop acquire rapid local motions as they are not part of the RNA:protein interface. The local motions of both loops in their free state are most apparent near the apex, while when bound to protein, the 3′ side of the loop becomes more flexible.
RESULTS AND DISCUSSION
To probe the structure and dynamics of the loops, the fluorescent base 2-aminopurine replaced the adenosines in the loops. Stem–loop II has two adenosines, one at the 5′ base of the loop adjacent to the stem and the other at the apex of the loop. Stem–loop IV contains these two adenosines and also has a third on the 3′ side of the loop. The temperature and salt dependences of RNAs with a single 2AP were compared in steady-state and time-resolved fluorescence experiments to characterize the loops.
Stem–loop IV
A comparison of 2AP fluorescence intensity and UV-absorption of the RNA as a function of temperature shows that the loop nucleobases are changing their environments before the hairpin stem denatures (melts) (Fig. 2). The loop is undergoing structural changes that alter the exposure of the 2AP to solvent and to adjacent stacked bases.
FIGURE 2.

Thermal denaturation of SLIV hairpins. (A) dSLIV. Fluorescence of 2AP at the apex (▲), 3′ side (•••), and 5′ base (○○○) in gray. Absorbance (▬) in black. 20 mM KCl. (B) Salt dependence of dSLIV melting and 3′ side 2AP loop fluorescence. Solid lines, in buffer with no added salt; dotted lines, in 100 mM KCl. Black lines are absorbance; gray lines are fluorescence. (C) hSLIV. Fluorescence of 2AP at the apex (▲), 3′ side (•••), and 5′ base (○○○). Absorbance at 260 nm (▬) in 20 mM KCl. Absorbance monitored at 260 nm, fluorescence intensity at 366 nm. [RNA] = 2 μM. Buffer: 2.5 mM sodium cacodylate pH 7.4, 250 μM EDTA. Low salt was used to eliminate dimerization of the RNA.
2AP steady-state fluorescence intensity varies dramatically with 2AP position, indicating that the physical environments of the nucleobases are not equivalent. Fluorescence of 2AP at the apex of the loop in Drosophila SLIV (dSLIV) has an approximately twofold greater intensity than 2AP on the 3′ side. Fluorescence of 2AP at the 5′ end of the loop is severely quenched; its fluorescence intensity is 10-fold less than that of the apical 2AP. Since base stacking is the most effective quenching mechanism for 2AP fluorescence, the simplest interpretation of these data is that the 5′ 2AP is stacked over the loop-closing U:G base pair. By implication, the stem structure is propagated into the loop, stacking at least the flanking bases as in an A-form duplex. In contrast, 2AP at the apex is flanked by a 5′ cytosine and 3′ guanosine in SLIV, but its fluorescence intensity is high, suggesting that it is often unstacked. 2AP on the 3′ side has about one-half the intensity of 2AP at the apex, suggesting that it spends more of its time stacked with its flanking uridine and cytidine. Since uracil has little propensity to stack (Burkard et al. 1999), it seems likely that most of the stacking would come from the 3′ cytosine. At lower temperatures, our model of SLIV includes stacking of its 5′ adenosine on the loop-closing base pair and the three 3′ side (ACC) nucleobases stacked on each other, with the 3′ cytosine stacked on the loop-closing base pair such that the A-form duplex structure is propagated into the loop.
The temperature response of the 2AP fluorescence also reveals a great deal about how the loop structure/flexibility is changing. The fluorescence intensity of the 5′ 2AP is unchanged from 5°C to 55°C, showing that its environment is constant. Its fluorescence begins to increase coincident with stem melting (measured by UV absorbance), indicating that stacking of the 2AP on the U:G base pair is one of the first interactions to be destabilized as the hairpin melts.
2AP at the apex of the loop has its maximum fluorescence intensity at ≤15°C, then rapidly loses intensity with increasing temperature. Some of the loss of fluorescence intensity is due to collisional quenching with solvent molecules, which becomes more efficient at higher temperatures (Lakowicz 2006). However, the temperature dependence of 2AP in the loop is distinct from that of 2AP nucleotide in solution (see Fig. 3B) and requires another explanation. A ready interpretation of these data is that the loop structure around the apex where the RNA strand presumably bends becomes more mobile above 20°C, so that 2AP has an increased number of encounters with flanking nucleobases. Transient stacking interactions and collisions with solvent lead to quenching of its fluorescence at temperatures that are below the stem melting temperature, indicating that this part of the loop is flexible.
FIGURE 3.

Thermal denaturation of human SLII and temperature dependence of free 2AP fluorescence. (A) SLII absorption (black) and 2AP loop fluorescence (gray). 2AP is at the loop apex. 20 mM KCl. Low-salt buffer was used to eliminate dimerization of the RNA. [RNA] = 2 μM. (B) Fluorescence intensity of 2AP nucleotide in solution as a function of temperature. 2 μM 2AP nucleotide in 2.5 mM sodium cacodylate, pH 7.4, 250 μM EDTA.
2AP at the loop apex has the highest fluorescence intensity of all the sampled positions, but its properties are not consistent with a completely unstacked extruded nucleobase. 2AP nucleotide in solution at the equivalent concentration has 10-fold greater fluorescence intensity at 5°C than does 2AP at the apex of the loop. As Figure 3 illustrates, free 2AP steady-state fluorescence intensity decreases almost linearly with temperature from 5°C to 65°C. Its temperature-dependent loss of fluorescence intensity is due to collisional quenching with solvent molecules, which also occurs with 2AP in the loop. However, 2AP in the loop does not begin to lose fluorescence until ∼20°C, indicating that the loop is becoming more flexible: Stacking is becoming transient, and the nucleobases are exposed to solvent.
The fluorescence intensity of 2AP on the 3′ side of the loop supports the idea that this part of the loop retains stacking until the whole RNA is beginning to unfold. This 2AP has a relatively constant fluorescence intensity from 5°C to 40°C (but with a measurable increase at 30°C) which is twofold lower than the apical 2AP fluorescence. Our model of these data is that the 3′ 2APCC sequence is stacked on the U:G loop closing base pair over this temperature range, effectively reducing 2AP fluorescence intensity. The subsequent loss of fluorescence intensity from 40°C to 60°C is evidence that the loop is becoming more flexible before the absorbance data show that the stem is melting.
This interpretation is supported by the salt dependence of loop and stem structures. In buffer with no added salt, the melting temperature of the stem is near 50°C, while in 100 mM KCl, it shifts to ∼75°C. As Figure 2B shows, there is a concomitant shift in the fluorescence intensity of 3′ 2AP, indicating that the structural stability of the loop is also dependent on added counterions. This shift is not accompanied by a change in the shape of the curve, indicating that the local structure is not altered by the added salt.
For these experiments, we used two SLIV sequences that differ in their loop-closing base pair: Drosophila SLIV is closed by a U:G base pair; in human SLIV (hSLIV), this becomes a U/U sequence. The presence of the U/U alters the equilibrium of hairpin/dimer, for hSLIV forms a dimer under some conditions where dSLIV remains a hairpin. The thermal denaturation profile of hSLIV is characterized by a sloping lower baseline (Fig. 2C); it is important to note that these data were acquired in buffer with 20 mM KCl at 2 μM RNA, where hSLIV is a monomer. In this denaturation curve as well as the others, we attribute the sloping lower baseline to unstacking of the loop nucleobases. The difference in the absorbance data for dSLIV and hSLIV illustrates how the U:G to U/U change affects loop stability and stem melting: The stem melts at 65°C for dSLIV and at 60°C for hSLIV, consistent with the predicted free energies of the stems (Fig. 1).
The fluorescence intensity of each 2AP in hSLIV is similar to the corresponding 2AP in dSLIV, with the notable exception of 2AP at the 5′ end of the loop. Although hSLIV 5′ 2AP fluorescence is quenched, it is brighter by twofold than in the same position in dSLIV. This difference is likely to be due to its flanking U/U sequence that does not form a stable base pair. NMR spectra of the imino protons of these two hairpins show that the dSLIV G:U wobble pair is observed until 40°C, but because hSLIV RNA forms a dimer at NMR concentrations, we cannot determine if the U/U forms a U:U base pair (data not shown). 2AP on the 3′ side of the hSLIV loop loses fluorescence intensity more rapidly above 30°C than does the analogous 2AP in dSLIV, again indicating that this loop stacking is not as robust. In general, hSLIV appears to be less structured in all salt conditions than dSLIV.
SLII
For this hairpin, we have only two positions for 2AP substitutions, and of these, 2AP at the 5′ end of the loop gives barely detectable fluorescence. This base stacks over the C:G loop-closing base pair which quenches it until the stem begins to melt. Its low fluorescence yield precludes its use in subsequent experiments.
2AP at the apex of SLII has its highest fluorescence intensity at low temperatures (5°C to 20°C in 20 mM KCl) (Fig. 3A). Its initial fluorescence intensity is lower by 1.25- to 1.44-fold than the apical 2AP in SLIVs, suggesting that it stacks with its neighboring cytosine nucleobases. The stem of this RNA melts at a higher temperature (78°C) than those of SLIV due to its C:G loop-closing base pair; as before, we attribute the sloping lower baseline of the absorbance to loop nucleobase unstacking.
Time-correlated single photon counting of 2AP fluorescence
Time-correlated single photon counting (TCSPC) provides an indication of the number of conformational states of a fluorophore, based on the number of measurable decay lifetimes and their amplitudes. 2AP alone in solution has a single decay lifetime of ∼10–11 nsec. However, 2AP in the context of a molecule can have several lifetimes as a result of its environments. Here, we can report up to three decay lifetimes given the time resolution of our instrument, but those are sufficient to compare environments of each 2AP.
When 2AP in the context of the hairpins has a lifetime component comparable to that of free 2AP, we conclude that it spends time in an environment that isolates it from the rest of the molecule. The amplitude of that long component is a measure of what proportion of the time it spends in that state. 2AP at the apex of SLIV and SLII loops has a significant proportion of a long lifetime (τ1 = 8–9 nsec) (Table 1), especially in dSLIV where its fractional amplitude is ∼0.20 of the signal. This proportion decreases with temperature, presumably because the movements of adjacent nucleobases in the loop bring them into juxtaposition with the 2AP, therefore changing its photophysics. In contrast, 2AP on the 3′ side of SLIV has a fractional amplitude (β1) on average of approximately 0.10 to 0.12 with τ1 = 7–8 nsec, consistent with this 2AP being predominantly stacked with occasional excursions to a “flipped out” environment.
TABLE 1.
2-aminopurine fluorescence decay lifetimes
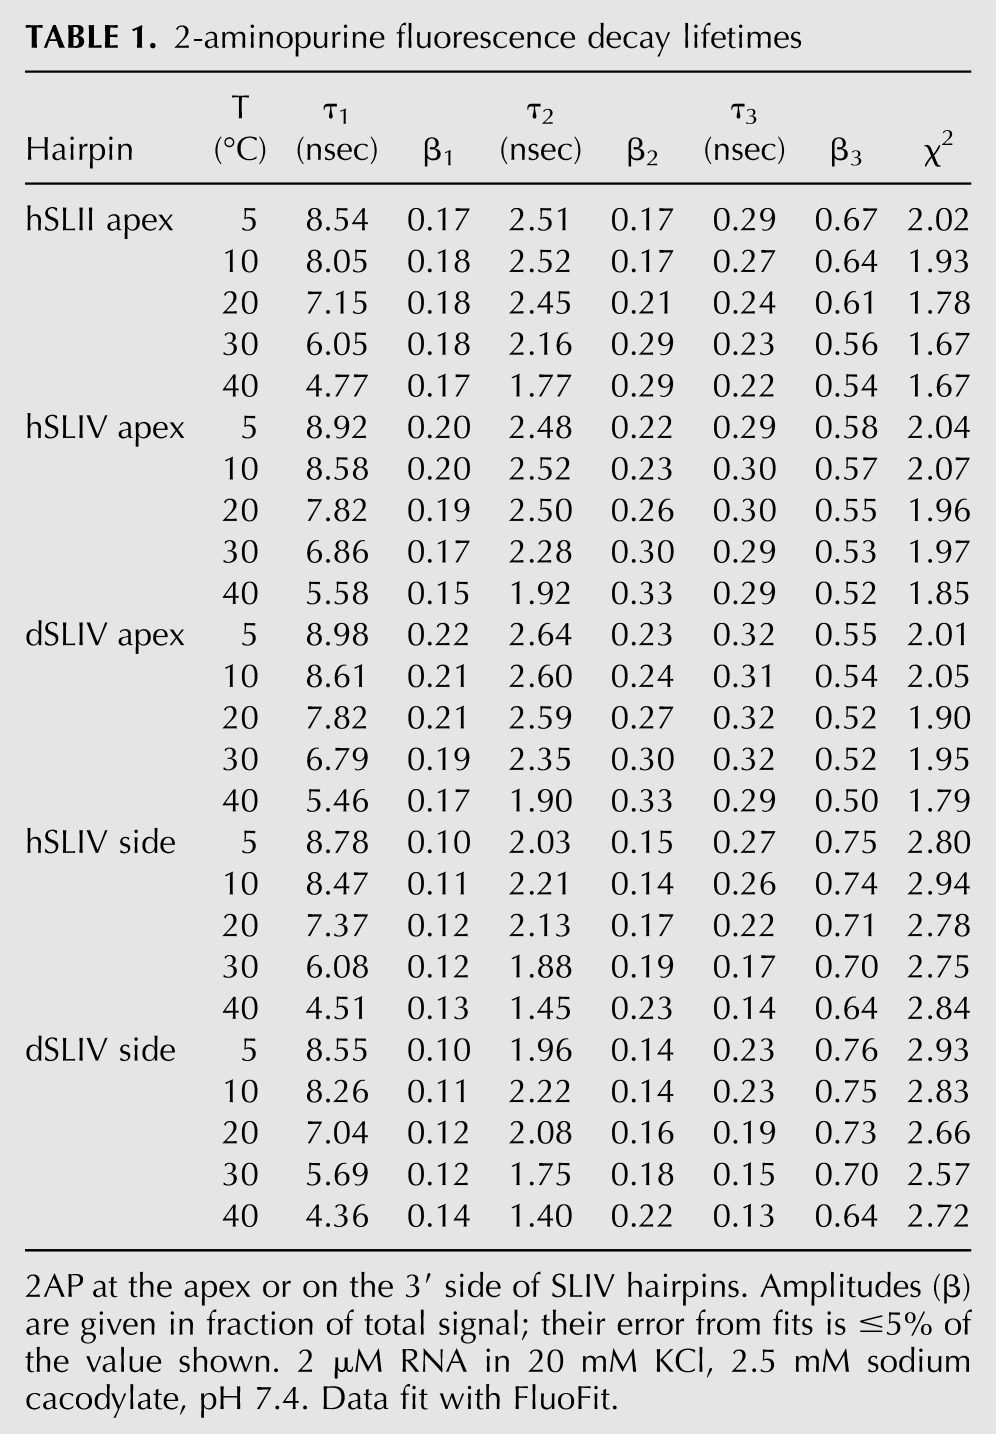
Fluorescence of 2AP at the apex of SLII and SLIV has τ2 = 2–2.6 nsec, the amplitude of which is temperature-dependent. In both SLIV RNAs, this component contributes ∼0.22–0.24 of the fluorescence decay at lower temperatures; the lifetime becomes shorter, and its amplitude becomes greater at 30°C–40°C. In SLII, the lifetime is similar, but the amplitude is notably less (β2 = 0.17). A physical interpretation of this component is that 2AP is stacked with other nucleobases, but the stacking geometry (base overlap) is not perfect. For 2AP on the 3′ side of the loop where base stacking is relatively stable, the amplitude of the τ2 ≈ 2 nsec component is reduced to 0.15–0.16 from 5°C–20°C, consistent with the physical interpretation that this intermediate lifetime is reporting on imperfectly stacked states.
The largest amplitude component for all 2AP sites has the shortest lifetime (τ3 = 200–300 psec at low temperatures). For 2AP at the SLIV and SLII loop apex, this component contributes more than half of the signal. That this contribution is virtually identical for this 2AP in both hairpins is interesting, since the nucleobases flanking 2AP in SLII and SLIV are not the same. SLII has the sequence C2APC, while SLIV has the sequence C2APG, and while stable purine–purine stacking leads to more extensive mixing of the electronic states (Jean and Hall 2001, 2002), the fluorescence data suggest that the two environments are very similar. For 2AP at the 3′ side, this short component dominates the decay, especially at low temperature where its fractional amplitude has a range of β3 = 0.70–0.76, consistent with our physical model in which this 2AP spends most of its time stacked. Given the parameters of our TCSPC instrument, it is likely that the shortest lifetimes are not accurately measured; several unresolved short components could be present. Nevertheless, the physical interpretation is that the bases are stacked with a geometry that facilitates rapid decay of the fluorescence signal (Jean and Hall 2004).
In summary, the TCSPC data show that 2AP is sampling several conformations with respect to other bases. Even at the apex of the loop, 2AP still spends a significant amount of time aligned with other bases. Conversely, 2AP on the side of the loop is extruded from the stacked conformation only some of the time. The picture is one of a dynamic loop, although the timescale of nucleobase motions is not defined by these experiments; some measure of the timescales of loop and 2AP motions come from time-resolved anisotropy measurements.
Time-resolved fluorescence anisotropy
Fluorescence depolarization of a fluorophore occurs when the molecule moves away from its orientation as it absorbs a photon to a new orientation when it emits a photon. The fluorescence depolarization (anisotropy) of 2AP alone in solution is extremely rapid (∼9 psec), reflecting the rapid tumbling (rotational correlation time) of the small molecule. In the context of a larger RNA, 2AP fluorescence depolarization can report on local (segmental) motion of the nucleobase as well as the global tumbling time of the entire molecule. Theoretically, the hairpins present several complexities that arise from their irregular shape and internal motions, so we use the most basic interpretation of the results: One component of the anisotropy is due to segmental motion of 2AP, and the other measures global rotational correlation time of the RNA. The data are fit to the standard expression r(t) = β1e−t/ϕ1 + β2e−t/ϕ2, where r(t) is the time-dependent anisotropy, βn the amplitude of n component, and ϕn the rotational correlation time of n component (n = 1,2).
These data for the three hairpins are shown in Figure 4 as a function of temperature. The longer component, which we assign to the rotational correlation time of the RNA, is independent of the position of the 2AP and decreases as expected with increasing temperature as the viscosity of the solution decreases and the molecule tumbles more rapidly. At low temperature, the rotational correlation time of the hairpins is ∼5 nsec, which is reasonable for an RNA this size and shape (a 6-bp stem and a partially floppy loop could resemble a sphere or a squat prolate ellipsoid). The reduction in the correlation time to 3 nsec at 20°C and an average of 2 nsec at 30°C–40°C could be complicated by contributions from the local motion of 2AP in the loop. In particular, the accuracy of the data at 40°C is dubious, since the values of the two depolarization times are so similar that their separability is unlikely (Supplemental Table S1).
FIGURE 4.

Time-resolved anisotropy of 2AP in SLII and SLIV as a function of loop position and temperature. Decay curves were fit to the expression r(t) = β1e−t/ϕ1 + β2e−t/φ2, and the long and short depolarization components ϕ1 and ϕ2 are plotted. (A) The long depolarization component as a function of temperature. (B) The short depolarization component as a function of temperature. (○) dSLIV side, (□) hSLIV side, (△) SLII apex, (◁) dSLIV apex, (◀) hSLIV apex.
A brief discussion of the global and local motions of the RNAs illustrates our interpretations of these fluorescence data. The rotational correlation time is the parameter we are interested in for the fluorescence anisotropy measurements. The rotational correlation time θ is related to the rotational diffusion coefficient Dr (for a spherical particle) as θ = (6 Dr)−1 where Dr = kBT/8πηr3 (kB is the Boltzmann constant, T temp in K, η the viscosity of solvent at T, and r the radius of the particle). The hairpin has a 6-bp stem, so 6*(2.8 Å/bp) = 16.8 Å stem length + 3*(2.8 Å/bp) [assuming that the first three nucleotides on either side of the loop are stacked, at least at low temperature] = 25.2 Å of A-form duplex. The 4–5 nt around the apex of the loop could be structured or floppy, so we add another 2.8 Å for good measure, giving a length of 28 Å or about one turn of an A-form duplex. The width of the duplex is ∼30 Å, so assume a sphere with a radius of 15 Å for simplicity. These parameters in a spherical model produce a rotational correlation time of 3.3 nsec at 22°C (295 K), which is very similar to the experimental values. Once the loop starts to flex, it will occupy more volume, and the shape of the hairpin will be too complicated to model accurately. However, the spherical model is also too simplistic since it won't capture any details of loop conformational changes. Also important is that our data were acquired at temperatures sufficiently below the hairpin melting temperature that any contribution from a single-stranded state will be negligible.
The short depolarization component depends on the position of 2AP in the loop, supporting the interpretation that it measures local or segmental motion. Those 2AP in SLIV at the apex of the loops have the most rapid depolarization (350 psec, on average) which is independent of temperature over this range. This fast depolarization indicates that apical SLIV 2AP must experience rapid local motions, perhaps rotation about the glycosidic bond or flexibility of the phosphodiester backbone at what could be the turn of the loop. Curiously, 2AP at the apex of SLIV exhibits rapid depolarization even though it is flanked by a 3′ guanosine which is a good stacking partner. 2AP at the 3′ side of SLIV has a rapid anisotropy component that is only five times faster (1 nsec) than the slow component (5 nsec) at low temperature. At room temperature in low salt (20 mM KCl), SLIV loops experience local motions near their apex on the 350-psec timescale and, at the side, on the 800-psec timescale.
Surprisingly, anisotropy of the SLII apical 2AP mimics the behavior of stacked 2AP at the 3′ side of SLIV, suggestive of local motions that are constrained by its context. This anisotropy component is temperature-dependent as well, with a value of 650 psec at 20°C. We conclude that the motions/dynamics of 2AP at the apex of SLII and SLIV are not the same, and therefore, the local structures of the two loops must differ.
The fractional contribution of each anisotropy component provides another indicator of loop and/or hairpin properties. In the case of 2AP on the 3′ side of SLIV, 65% of the depolarization occurs during global tumbling of the RNA at 5°C, but at 40°C, most of the signal is due to local segmental motions. In the case of apical 2AP in SLIV loops, the distribution is roughly 50:50 global:local at 5°C, but 30:70 at 40°C. Depolarization distributions of 2AP at the apex of SLII change from 60:40 to 20:80 over this temperature range. The increase in contributions from segmental motion at higher temperatures is consistent with enhanced loop flexibility that dominates fluorescence depolarization. The timescale of these motions are on the order of hundreds of picoseconds, but we note that the physical origins of the segmental motions cannot be determined from these data.
Laser T-jump probes longer timescale dynamics
These experiments required higher concentrations of RNA (50 μM) to obtain the minimal signal required, since all the 2AP nucleobases are quenched to some extent in the loops. At this concentration, the RNA had to be kept in buffer with 20 mM KCl to avoid formation of dimers. Despite signal averaging, the signal in these experiments was weak. The temperature was jumped from 4°C to 9°C, 4°C to 10°C, 5°C to 13°C, and from 13°C to 21°C, and the fluorescence recorded for 1 msec after each jump as the system re-equilibrated. The jumps that we were able to fit were described by a single exponential S(t) = Ae−t/τ + C (offset) where all three variables were allowed to float.
2AP at the apex and sides of SLII and/or SLIV were used for these experiments, but only some of the data could be fit (Fig. 5), while other data, particularly the higher temperature jumps, showed no evidence of a change (data not shown). The time resolution of the apparatus is limiting here; we expect that the RNA does undergo more rapid transitions. Using the 3′ side 2AP in SLIV RNAs as a probe, we found that each SLIV loop had a relaxation time of ∼4 μsec in jumps from 5°C to 13°C; only hSLIV data could be fit from the jump 13°C to 21°C, giving a relaxation time of 3 μsec. At the apex of the loop, 2AP in dSLIV showed a relaxation of 4 μsec (with an error of ±3.7 μsec making these data tentative; the actual relaxation time is probably faster) in a jump from 4°C to 9°C, identical to the relaxation measured at the 3′ side. Perhaps these data report on a global conformational change of the dSLIV loop. However, data from apical 2AP in hSLIV could not be fit/showed no relaxation, suggesting that the two SLIV loops differ in their slow timescale dynamics. Apical 2AP in SLII had the longest relaxation time of 6 μsec upon a 4°C to 10°C jump. The physical origin of this transition(s) shown in T-jump experiments is not clear. Menger et al. (2000) found that base stacking/unstacking occurred with a relaxation time of <1 μsec, making it an unlikely source of the observed transitions at these temperatures. The ∼4 μsec conformational change determined from the low-temperature T-jump experiments could be a global restructuring (breathing mode) of the loop, not local (segmental) motion of the 2AP. As such, this mode would represent correlated motions of nucleotides throughout the loop, perhaps a low frequency normal mode. We did not observe this relaxation at higher temperatures, possibly because the global mode had shifted to faster timescales, or because increased motion of the individual nucleotides precludes a global mode.
FIGURE 5.

Hairpin T-jump fluorescence relaxation. (A) hSLII, 4°C to 10°C jump. (B) dSLIV apex 2AP, 4°C to 9°C jump. (C) dSLIV 3′ side 2AP, 5°C to 13°C jump. (D) hSLIV 3′ side 2AP, 5°C to 13°C jump. (E) hSLIV 3′ side 2AP, 13°C to 21°C jump. χ values (■) for each bin are shown with connecting lines (see Materials and Methods). Fits to a single exponential decay are plotted on the decay data (○○○). (F) Table of relaxation times for each RNA. Error is from the fit. A is the amplitude prefactor, Y is the offset.
snRNA loops in RNA:protein complexes
The intrinsic dynamics of these loops are undoubtedly necessary for their interactions with their protein ligands. Although base stacking predominates at lower temperatures, at physiological temperature (37°C), the bases are sampling other conformations, and the loop has become flexible. The bound conformations of the loops can be seen in the cocrystal structures from which the proteins have been removed (Fig. 6). The adenosine at the apex of the loops is stacked with phenylalanine in the U1A:SLII and U2B″:SLIV complexes, but there are also sequence-specific contacts with this adenosine (Oubridge et al. 1994; Price et al. 1998; Nolan et al. 1999).
FIGURE 6.

SLII and SLIV bound to proteins. (Upper left) Human SLII structure when bound to U1A RRM1 (1urn). (Upper right) Human SLIV structure bound to rabbit U2B″ (1a9n). In these two panels, the protein was removed to display the RNA alone using VMD (Humphrey et al. 1996). Sites of 2AP replacement are indicated. (Lower left) Steady-state fluorescence of 2AP on the 3′ side of dSLIV free (■) and bound (□) to Drosophila SNF RRM1 in 20 mM KCl. (Lower right) Steady-state fluorescence of 2AP on the apex of dSLIV free (■) and bound (□) to Drosophila SNF RRM1 in 20 mM KCl.
In the SLIV:U2B″ cocrystal complex, the adenosine at the 3′ side of SLIV is not in contact with the protein and appears to be adjacent to the second protein in this complex, U2A′ (Price et al. 1998). This could be an artifact of crystal packing, however, if this side of the RNA loop is unstructured and flexible. To assess the properties of the complex in solution, we added Drosophila SNF RRM1 to dSLIV with 2AP at the 3′ side (Williams and Hall 2010). The substitution did not alter the dissociation constant (data not shown). A dramatic demonstration of the conformational change of dSLIV comes from the 1.5-fold increase in fluorescence intensity of 2AP on the 3′ side upon binding to SNF (Fig. 6).
TCSPC data for 2AP on the 3′ side of dSLIV bound to SNF are fit by three exponential decay components, and the time-resolved anisotropy is fit with two depolarization components (Table 2). A significant difference between the bound and free RNA is observed in the anisotropy components. SLIV RNA bound to SNF has a longer rotational correlation time of 6.5 nsec, a little shorter than we expect for a complex with a molecular weight of ∼20 kDa but twice as long as for the RNA alone. The shorter rotational correlation time, ascribed to local motions, is half as long as the corresponding depolarization in the free RNA, indicating more rapid local motion in the complex. This interpretation is consistent with the observed increase in the steady-state fluorescence intensity and suggests that this 2AP has been “flipped out” of its stacked state.
TABLE 2.
2AP fluorescence in dSLIV free and bound to SNF RRM1
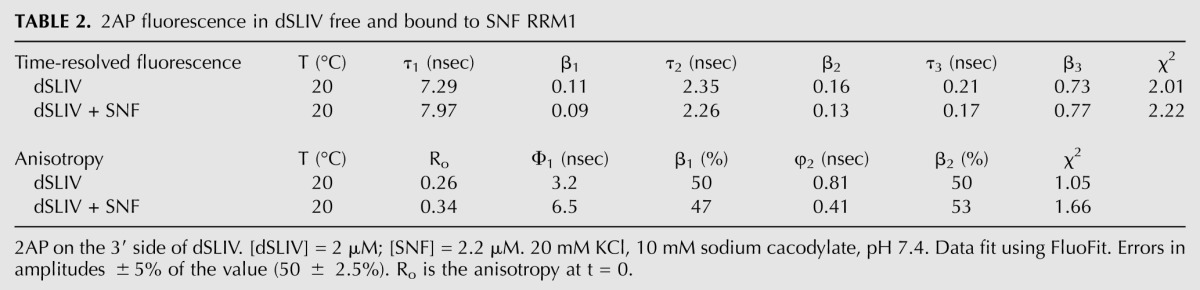
A similar experiment was carried out using the protein together with dSLIV with 2AP at its apex (Fig. 6). In the cocrystal complex, the apical adenosine is stacked over a phenylalanine sidechain (Price et al. 1998) but not stacked with another nucleobase. Binding of SNF to SLIV with apical 2AP resulted in a ∼25% increase in 2AP fluorescence. However, the binding affinity of SNF for apical 2AP SLIV RNA is greatly reduced from that of normal RNA (data not shown), indicating that critical interactions have been lost, either through loss of specific moieties on the nucleobases that make contact with protein or through steric interference by the presence of the 2-amino group on 2AP. If 2AP is not isosteric in the complex, then one explanation for its increased fluorescence intensity is that it is not constrained by the protein and is free to move. It is also possible that the environment in the complex is such that the 2AP fluorescence is enhanced, perhaps due to loss of stacking interactions with flanking nucleobases or by an induced electronic structure. Given this uncertainty in the binding mode of SLIV with this substitution, we did not continue with fluorescence experiments, since their interpretation with respect to the wild-type complex would be unclear.
CONCLUSIONS
The nucleobase motions within U1 SLII and U2 SLIV as described by 2-aminopurine fluorescence focus on the more rapid picosecond/nanosecond dynamics. Motions on this timescale come from rotations about the glycosidic bond, ribose repuckering, and backbone torsion angle changes, but here the physical origins of the motions must be inferred, since only the nucleobase is directly monitored. The level of detailed description of loop rearrangements is thus restricted, but by monitoring multiple sites within the loop, we are able to make several conclusions regarding the local and global conformational changes of these long loops. These rapid motions are on the timescales accessible to molecular dynamics simulations which could provide an integrated time-dependent description of their motions.
The timescales probed by these experiments vary from hundreds of picoseconds to microseconds and presumably represent different conformational transitions. A time line of the fluorescence measurements, together with a conceptual interpretation of the data, are shown in Figure 7. It is apparent that the nanosecond motions of the bases are not correlated; at least the apex of the loop is not coupled to the sides. This observation might be anticipated from the composition and length of the loop, but the measurements provide a quantified description. In contrast, the timescale of the transition represented in T-jump experiments is consistent for both apical and side 2AP, suggesting that this transition could be global. More data are required to establish the type of loop conformational change reported by T-jump experiments.
FIGURE 7.

A summary of the fluorescence timescales measured and a model of their physical origin. The time line is logarithmic. A model of SLIV is used: 2AP sites are shown in red, with their possible conformational transitions illustrated. 2AP at the apex and on the 3′ side are shown stacked and flipped out, corresponding to time-resolved fluorescence data. These events are not correlated. In contrast, we model the conformational transition reported by T-jump as a global reordering of the loop, or perhaps as a breathing mode (a low-frequency normal mode).
Extrapolating from the properties of 2AP, a general conclusion is that all the nucleobases in the loops experience stochastic local motions. 2AP substitutions occur within sequences that are most likely to be stacked with neighboring nucleobases, and indeed, 2AP at the 5′ end of the loop is very stably stacked on the loop-closing base pair. The other adenines experience significant local motions, spending only a fraction of their time in stacking interactions. These fluorescence data show that the most flexible (floppy) part of the loop is at the apex where, presumably, the chain turns. The 2AP at this position spends a significant amount of time free of base stacking interactions, so it would be available for stacking interactions with exposed aromatic amino acids on the surface of the protein. This is a key stacking interaction in the U1A:SLII complex (Shiels et al. 2002) that positions the adenosine for specific hydrogen bonding interactions with the protein. If the first contact between RNA and protein occurs via the nucleobases at the apex of the loop, the change in their orientations could propagate down the phosphodiester backbone on both sides to destabilize loop base stacking.
There is a gap between 10 nsec and 1 μsec in our measurements, due in part to the intrinsic photophysics of 2AP. If 2AP had a longer fluorescence lifetime, we could detect motions on longer timescales if they were present. We are left with missing information on transitions with rates of 10−8 to 10−6 sec−1, which is a biologically important window. Binding of SLII to U1A as measured by surface plasmon resonance gave on-rates on the order of 107 mol−1sec−1 (Law et al. 2006), which is slower than diffusion-controlled associations and consistent with a requisite conformation change of one or both components. We predict that there are loop motions on this timescale, which we could possibly measure using NMR methods.
Does the ensemble of RNA loop conformations in its free state contain some population of the bound conformation, as assumed by the conformational capture mechanism? Does it need to sample this state in order to make initial productive contact with the protein ligands, or are there mutually induced conformations of RNA loop and protein following an initial interaction—the induced fit binding model? Among all the possible conformations accessible to the loops, certainly some of them would be competent to bind protein whether via conformational capture or induced fit. Binding would be entropically unfavorable since it reduces the ensemble of conformational states, but stacking with aromatic amino acids and formation of protein:RNA hydrogen bonds presumably compensate. The energetics of binding to proteins for SLII and SLIV are complicated: temperature dependent with entropy/enthalpy compensation, some with a measurable heat capacity, all salt-dependent (Williams and Hall 1996, 2010, 2011), and with on- and off-rates that imply complex interaction schemes (Katsamba et al. 2001; Law et al. 2006; Anunciado et al. 2011). Certainly some of the thermodynamic and kinetic challenges to formation of the RNA:protein complexes are due to the conformational heterogeneity of the large RNA loops, but the subsequent ability of the loop to adapt to the protein binding surface is key to formation of the high affinity complexes.
MATERIALS AND METHODS
RNA stem–loops
The RNA hairpins used were derived from U1 snRNA Stem–loop II and U2 snRNA Stem–loop IV of human and Drosophila. The stem sequence was the same for each RNA across all constructs made. Unlabeled RNA stem–loops were transcribed using T7 RNA Polymerase as described in Milligan et al. (1987). DNA primers were purchased from IDT. The 2-aminopurine (2AP) label (A*) RNA stem–loops were purchased from either Dharmacon or IBA; each RNA contained only one 2AP. The buffer used for all fluorescence and UV experiments was 2.5 mM sodium cacodylate pH 7.4, and 250 μM EDTA with salt concentration of 0, 20, or 100 mM KCl. The pH of the buffer increases to 8 at 90°C, but because 2AP has a pKa = 12 (Ward et al. 1969), its protonation state should be unchanged in these experiments. RNA concentrations were 2 μM for most experiments; the concentration was 50 μM for the T-jump experiments.
hSLII 5′-GGCCGCA*UUGCA*CUCCGCGGCC-3′
hSLIV 5′-GGCCGUA*UUGCA*GUA*CCUCGGCC-3′
dSLIV 5′-GGCCGUA*UUGCA*GUA*CCGCGGCC-3′
Protein
Drosophila SNF RRM1 was purified as described in Williams and Hall (2010).
Absorbance melts
Thermal melts were carried out using a Gilford 260 spectrophotometer, which was fitted with a 2527 Gilford thermoprogrammer. All samples were heated to 95°C, then snap-cooled on ice to ensure proper folding of the RNA stem–loops. Samples were heated at a rate of 1°C/min from 5°C–90°C as the absorbance was recorded at 260 nm. All thermal melts were fit using a two-state model programmed in Origin. The concentration dependence of RNA melting was measured using 2, 10, 20, and 50 μM RNAs in the different salt conditions to look for evidence of dimer formation.
Fluorescence melts
Fluorescence melts were performed using a PTI (Photon Technology International) equipped with a Xenon compact arc lamp set at 70 W, a model 810 PMT set at 1000 V, and a water bath for temperature control. Fluorescence melts were carried out at an excitation wavelength of 300 nm and an emission wavelength of 366 nm, which was found to be the maximum for these samples. The excitation and emission slits were 2 nm for all samples. Samples were heated at a programmed temperature gradient, and temperature was monitored with a thermistor. Salt-dependent fluorescence melts were performed on SLM 8100 equipped with a Xenon arc lamp and polarizers which were set to the magic angle 55°. PMT voltages were set to achieve ∼10,000 counts. Excitation and emission wavelengths were identical to those used on the PTI, although the slits for excitation and emission were set at 8 nm. Samples were heated as on the PTI, although temperature was monitored with a thermocouple. Uncorrected emission spectra of protein (SNF)-bound and free RNA were collected at 20°C.
Time domain lifetime/anisotropy
All lifetime measurements were performed on a home built time-correlated single photon counting instrument as described (Jean and Hall 2004). A Ti:Sapphire laser was pulse picked and tripled to excite the 2AP using 300 nm. Samples were cooled and heated using a water bath, and the temperature was monitored using a thermistor. Lifetime and IRF decay curves were collected until overflow (65,536 counts) with the polarizer at 55° (an example is shown in Supplemental Fig. S1). IRF was collected with a 1/100 dilution of LUDOX (Aldrich) solution; its FWHM was measured every day and varied from 215–222 psec. Anisotropy decays were collected in separate runs where vertical polarization was collected first to overflow, then horizontal polarization was collected with the same acquisition time. Fluofit 4.4 (Picoquant) was used to fit both lifetime and anisotropy curves. Fluorescence lifetime decays were best fit with a three-component exponential model with reconvolution. Anisotropy decays were fit using a two-component exponential model. The G-factor was calculated using tail matching. Buffer scattering accounted for <5% of the counts in the peak channel; it was not subtracted from the decay curves. Goodness of fit was assessed by support plane analysis.
T-jump
All temperature jump experiments were done at the University of Illinois, Urbana-Champaign in the Gruebele Lab on their custom-built apparatus (Ballew et al. 1996; Sarkar et al. 2009). The samples were excited at 280 nm by a Ti:Sapphire laser that was tripled. Temperature perturbation pulse was generated by a Nd:YAG laser that was Raman shifted to 1900 nm, then split to be focused on the cuvette from both sides. The magnitude of the jump was calibrated by a 300-μM L-tryptophan sample in which the lifetime decay curve after the jump was matched to the lifetime decay curve obtained at that approximate temperature at steady state. Jump size varied for each experiment, ranging from 5°C to 8°C. Starting temperatures were maintained using a Peltier device. RNA samples were at 50-μM concentration in 20 mM KCl to obtain maximum signal-to-noise ratio without dimers forming. Capillary cuvettes had a path length of 200 μm. The data were processed in Matlab using χ analysis scripts supplied from the Gruebele Lab. The χ value is a model-free parameter describing the similarity of the normalized lifetime curves acquired after the jump to both an initial curve (f1) acquired before the jump and a final curve (f2) acquired after the jump when the molecule has attained thermal equilibrium. The curves during the transition are fit to a linear combination of A*f1 + B*f2, and χ is calculated from the fit results A and B as χ = A/(A + B). Lifetime curves are acquired every 12.5 nsec; to increase signal-to-noise, we normally binned 20 such curves before fitting, giving a time resolution of 250 nsec for the χ time traces. Starting 0.25 μsec after the jump, the traces were fit to a single exponential decay model.
SUPPLEMENTAL MATERIAL
Supplemental material is available for this article.
ACKNOWLEDGMENTS
We thank Professor Martin Gruebele and Hannah Gelman from the University of Illinois, Urbana-Champaign, for allowing us to use their T-jump apparatus and for help with data processing. This work was funded by NIH R01 GM096444 to K.B.H.
Footnotes
Article published online ahead of print. Article and publication date are at http://www.rnajournal.org/cgi/doi/10.1261/rna.035006.112.
REFERENCES
- Anunciado D, Dhar A, Gruebele M, Baranger AM 2011. Multistep kinetics of the U1A–SL2 RNA complex dissociation. J Mol Biol 408: 896–908 [DOI] [PubMed] [Google Scholar]
- Ballew RM, Sabelko J, Gruebele M 1996. A single-sweep, nanosecond time resolution laser temperature-jump apparatus. Rev Sci Instrum 67: 3694–3699 [Google Scholar]
- Burkard ME, Kierzek R, Turner DH 1999. Thermodynamics of unpaired terminal nucleotides on short RNA helices correlates with stacking at helix termini in larger RNAs. J Mol Biol 290: 967–982 [DOI] [PubMed] [Google Scholar]
- Correll CC, Wool IG, Munishkin A 1999. The two faces of the Escherichia coli 23 S rRNA sarcin/ricin domain: The structure at 1.11 Å resolution. J Mol Biol 292: 275–287 [DOI] [PubMed] [Google Scholar]
- Correll CC, Beneken J, Plantinga MJ, Lubbers M, Chan YL 2003. The common and the distinctive features of the bulged-G motif based on a 1.04 Å resolution RNA structure. Nucleic Acids Res 31: 6806–6818 [DOI] [PMC free article] [PubMed] [Google Scholar]
- Flickinger TW, Salz HK 1994. The Drosophila sex determination gene snf encodes a nuclear protein with sequence and functional similarity to the mammalian U1A snRNP protein. Genes Dev 8: 914–925 [DOI] [PubMed] [Google Scholar]
- Frankel AD, Smith CA 1998. Induced folding in RNA-protein recognition: More than a simple molecular handshake. Cell 92: 149–151 [DOI] [PubMed] [Google Scholar]
- Humphrey W, Dalke A, Schulten K 1996. VMD: Visual molecular dynamics. J Mol Graph 14: 33–38 [DOI] [PubMed] [Google Scholar]
- Jean JM, Hall KB 2001. 2-Aminopurine fluorescence quenching and lifetimes: Role of base stacking. Proc Natl Acad Sci 98: 37–41 [DOI] [PMC free article] [PubMed] [Google Scholar]
- Jean JM, Hall KB 2002. 2-Aminopurine electronic structure and fluorescence properties in DNA. Biochemistry 41: 13152–13161 [DOI] [PubMed] [Google Scholar]
- Jean JM, Hall KB 2004. Stacking–unstacking dynamics of oligodeoxynucleotide trimers. Biochemistry 43: 10277–10284 [DOI] [PubMed] [Google Scholar]
- Katsamba PS, Myszka DG, Laird-Offringa IA 2001. Two functionally distinct steps mediate high affinity binding of U1A protein to U1 hairpin II RNA. J Biol Chem 276: 21476–21481 [DOI] [PubMed] [Google Scholar]
- Kormos BL, Baranger AM, Beveridge DL 2007. A study of collective atomic fluctuations and cooperativity in the U1A-RNA complex based on molecular dynamics simulations. J Struct Biol 157: 500–513 [DOI] [PMC free article] [PubMed] [Google Scholar]
- Krol A, Westhof E, Bach M, Lührmann R, Ebel JP, Carbon P 1990. Solution structure of human U1 snRNA. Derivation of a possible three-dimensional model. Nucleic Acids Res 18: 3803–3811 [DOI] [PMC free article] [PubMed] [Google Scholar]
- Lakowicz JR. 2006. Principles of fluorescence spectroscopy, 3rd ed. Springer Press, New York. [Google Scholar]
- Law MJ, Rice AJ, Lin P, Laird-Offringa IA 2006. The role of RNA structure in the interaction of U1A protein with U1 hairpin II RNA. RNA 12: 1168–1178 [DOI] [PMC free article] [PubMed] [Google Scholar]
- Luchansky SJ, Nolan SJ, Baranger AM 2000. Contribution of RNA conformation to the stability of a high-affinity RNA–protein complex. J Am Chem Soc 122: 7130–7131 [Google Scholar]
- Menger M, Eckstein F, Porschke D 2000. Dynamics of the RNA hairpin GNRA tetraloop. Biochemistry 39: 4500–4507 [DOI] [PubMed] [Google Scholar]
- Milligan JF, Groebe DR, Witherell GW, Uhlenbeck OC 1987. Oligoribonucleotide synthesis using T7 RNA polymerase and synthetic DNA templates. Nucleic Acids Res 15: 8783–8798 [DOI] [PMC free article] [PubMed] [Google Scholar]
- Nolan SJ, Shiels JC, Tuite JB, Cecere KL, Baranger AM 1999. Recognition of an essential adenine at a protein–RNA interface: Comparison of the contributions of hydrogen bonds and a stacking interaction. J Am Chem Soc 121: 8951–8952 [Google Scholar]
- Oubridge C, Ito N, Evans PR, Teo CH, Nagai K 1994. Crystal structure at 1.92 Å resolution of the RNA-binding domain of the U1A spliceosomal protein complexed with an RNA hairpin. Nature 372: 432–438 [DOI] [PubMed] [Google Scholar]
- Pitici F, Beveridge DL, Baranger AM 2002. Molecular dynamics simulation studies of induced fit and conformational capture in U1A–RNA binding: Do molecular substrates code for specificity? Biopolymers 65: 424–435 [DOI] [PubMed] [Google Scholar]
- Polycarpou-Schwartz M, Gunderson SI, Kandels-Lewis S, Seraphin B, Mattaj I 1996. Drosophila SNF/D25 combines the functions of the two snRNP proteins U1A and U2B″ that are encoded separately in human, potato, and yeast. RNA 2: 11–23 [PMC free article] [PubMed] [Google Scholar]
- Price SR, Evans PR, Nagai K 1998. Crystal structure of the spliceosomal U2B″–U2A′ protein complex bound to a fragment of U2 small nuclear RNA. Nature 394: 645–650 [DOI] [PubMed] [Google Scholar]
- Qin F, Chen Y, Wu M, Li Y, Zhang J, Chen H 2010. Induced fit or conformational selection for RNA U1A folding. RNA 16: 1053–1061 [DOI] [PMC free article] [PubMed] [Google Scholar]
- Query CC, Bentley RC, Keene JD 1989. A specific 31-nucleotide domain of U1 RNA directly interacts with the 70K small nuclear ribonucleoprotein component. Mol Cell Biol 9: 4872–4881 [DOI] [PMC free article] [PubMed] [Google Scholar]
- Reddy R, Henning D, Epstein P, Busch H 1981. Primary and secondary structure of U2 snRNA. Nucleic Acids Res 9: 5645–5658 [DOI] [PMC free article] [PubMed] [Google Scholar]
- Sarkar K, Meister K, Sethi A, Gruebele M 2009. Fast folding of an RNA tetraloop on a rugged energy landscape detected by a stacking-sensitive probe. Biophys J 97: 1418–1427 [DOI] [PMC free article] [PubMed] [Google Scholar]
- Scherly D, Boelens W, van Venrooij WJ, Dathan NA, Hamm J, Mattaj IW 1989. Identification of the RNA binding segment of human U1 A protein and definition of its binding site on U1 snRNA. EMBO J 8: 4163–4170 [DOI] [PMC free article] [PubMed] [Google Scholar]
- Scherly D, Dathan NA, Boelens W, van Venrooij WJ, Mattaj IW 1990. The U2B″ RNP motif as a site of protein-protein interaction. EMBO J 9: 3675–3681 [DOI] [PMC free article] [PubMed] [Google Scholar]
- Serra MJ, Barnes TW, Betschart K, Gutierrez MJ, Sprouse KJ, Riley CK, Stewart L, Temel RE 1997. Improved parameters for the prediction of RNA hairpin stability. Biochemistry 36: 4844–4851 [DOI] [PubMed] [Google Scholar]
- Shajani Z, Varani G 2005. 13C NMR relaxation studies of RNA base and ribose nuclei reveal a complex pattern of motions in the RNA binding site for human U1A protein. J Mol Biol 349: 699–715 [DOI] [PubMed] [Google Scholar]
- Shajani Z, Drobny G, Varani G 2007. Binding of U1A protein changes RNA dynamics as observed by 13C NMR relaxation studies. Biochemistry 46: 5875–5883 [DOI] [PubMed] [Google Scholar]
- Shiels JC, Tuite JB, Nolan SJ, Baranger AM 2002. Investigation of a stacking interaction in target site recognition by the U1A protein. Nucleic Acids Res 30: 550–558 [DOI] [PMC free article] [PubMed] [Google Scholar]
- Showalter SA, Hall KB 2002. A functional role for correlated motion in the N-terminal RNA-binding domain of human U1A protein. J Mol Biol 322: 533–542 [DOI] [PubMed] [Google Scholar]
- Showalter SA, Hall KB 2004. Altering the RNA-binding mode of the U1A RBD1 protein. J Mol Biol 335: 465–480 [DOI] [PubMed] [Google Scholar]
- Showalter SA, Hall KB 2005. Correlated motions in the U1 snRNA stem/loop 2:U1A RBD1 complex. Biophys J 89: 2046–2058 [DOI] [PMC free article] [PubMed] [Google Scholar]
- Ward DC, Reich E, Stryer L 1969. Fluorescence studies of nucleotides and polynucleotides. Biol Chem 5: 1228–1237 [PubMed] [Google Scholar]
- Williams DJ, Hall KB 1996. RNA hairpins with non-nucleotide spacers bind efficiently to the human U1A protein. J Mol Biol 257: 265–275 [DOI] [PubMed] [Google Scholar]
- Williams SG, Hall KB 2010. Coevolution of Drosophila snf protein and its snRNA targets. Biochemistry 49: 4571–4582 [DOI] [PubMed] [Google Scholar]
- Williams SG, Hall KB 2011. Human U2B″ protein binding to snRNA stemloops. Biophys Chem 159: 82–89 [DOI] [PMC free article] [PubMed] [Google Scholar]
- Williamson JR 2000. Induced fit in RNA–protein recognition. Nat Struct Biol 7: 834–837 [DOI] [PubMed] [Google Scholar]
- Zuker M 2003. Mfold web server for nucleic acid folding and hybridization prediction. Nucleic Acids Res 31: 3406–3415 [DOI] [PMC free article] [PubMed] [Google Scholar]