Abstract
Background
Protein interactions play a key role in life processes. Characterization of conformational properties of protein-protein interactions is important for understanding the mechanisms of protein association. The rapidly increasing amount of experimentally determined structures of proteins and protein-protein complexes provides foundation for research on protein interactions and complex formation. The knowledge of the conformations of the surface side chains is essential for modeling of protein complexes. The purpose of this study was to analyze and compare dihedral angle distribution functions of the side chains at the interface and non-interface areas in bound and unbound proteins.
Results
To calculate the dihedral angle distribution functions, the configuration space was divided into grid cells. Statistical analysis showed that the similarity between bound and unbound interface and non-interface surface depends on the amino acid type and the grid resolution. The correlation coefficients between the distribution functions increased with the grid spacing increase for all amino acid types. The Manhattan distance showing the degree of dissimilarity between the distribution functions decreased accordingly. Short residues with one or two dihedral angles had higher correlations and smaller Manhattan distances than the longer residues. Met and Arg had the slowest growth of the correlation coefficient with the grid spacing increase. The correlations between the interface and non-interface distribution functions had a similar dependence on the grid resolution in both bound and unbound states. The interface and non-interface differences between bound and unbound distribution functions, caused by biological protein-protein interactions or crystal contacts, disappeared at the 70° grid spacing for interfaces and 30° for non-interface surface, which agrees with an average span of the side-chain rotamers.
Conclusions
The two-fold difference in the critical grid spacing indicates larger conformational changes upon binding at the interface than at the rest of the surface. At the same time, transitions between rotamers induced by interactions across the interface or the crystal packing are rare, with most side chains having local readjustments that do not change the rotameric state. The analysis is important for better understanding of protein interactions and development of flexible docking approaches.
Keywords: Protein interactions, Protein docking, Molecular recognition, Conformational analysis
Background
Protein-protein interactions play a key role in life processes. Characterization of conformational changes in proteins upon binding is important for understanding the mechanisms of protein association and for our ability to model it. Dependence of side-chain dihedral angle distribution on the conformation of the backbone has been investigated in earlier studies [1-5]. The side-chain dihedral angles are not evenly distributed, but for the most part are tightly clustered. A number of unbound rotamer libraries have been described previously [1-14] (see [15] for a review). Dunbrack and Cohen [1] used Bayesian statistics to estimate populations and dihedral angles for all amino acids rotamers at all φ and ψ values. A backbone-dependent rotamer library [15] was obtained by dividing φ and ψ dihedral space into 10°× 10° bins, χ angles into 120° bins, and calculating frequencies and average values of rotamers for each amino acid. A backbone-independent rotamer library was generated in a similar way. In a recent study [16], a new version of the backbone-dependent rotamer library was developed. It consists of rotamer frequencies, mean dihedral angles, and variances as a function of the backbone dihedral angles. In one of the latest backbone-independent rotamer libraries, the “Penultimate rotamer library” [5] by Lovell, Richardson and colleagues, the dihedral angle space was clustered and rotamer positions were defined as the distribution mode.
Comparison of the side-chain distribution in the core and on the surface [3], conducted on 19 protein structures available in 1978, revealed a small variation of the χ1 rotamers distribution. A later study [17] on a set of 50 non-homologous proteins showed that for all side chains, except Asp, Asn and Glu, the distributions of χ1 rotamers on the surface and in the core are not significantly different.
Comparison of the χ1 and χ2 distributions at the interface and non-interface surface was performed by Guharoy et al. [18]. Distributions were divided into bins as in the Dunbrack’s backbone-independent rotamer library [1]. Empirical free energies of inter-rotamer transitions were calculated and compared for the interface and non-interface areas. The rotamers free energies were different at the interface and non-interface, whereas bound and unbound free energies were essentially the same.
Conformations of surface residues in protein structures determined by crystallography are affected by the crystal packing. The area of the protein surface involved in the crystal contacts is generally smaller than in biological interfaces [19], and the interface packing is looser [20]. Studies of the crystal packing effect on the surface side chains [21-23] showed that ~ 20% of the exposed side chains change conformation, and the change increases with the increase of the side-chain solvent accessibility. Large polar or charged residues Arg, Lys, Glu, Gln, as well as Ser were found to be most flexible [21].
The purpose of this study was to analyze and compare dihedral angle distribution functions of the side chains at the interface and non-interface areas in bound and unbound proteins. Such analysis is important for better understanding of protein interactions and development of flexible docking approaches. The dihedral-angle distribution functions (DADF) were calculated on a cubic grid dividing the dihedral space into cells for each residue type, at interface and non-interface surface, in bound and unbound structures. The correlation coefficients between bound and unbound, interface and non-interface DADFs were calculated, along with the Manhattan distance, as a measure of dissimilarity between the DADFs. All the correlation coefficients depended on the amino acid type and the grid resolution. The correlation coefficients always increased with the increase of the grid spacing, whereas the Manhattan distances decreased accordingly. Short residues with one or two dihedral angles had higher correlations and smaller Manhattan distances at small grid spacing than the longer residues. The correlation between the interface and non-interface DADFs showed a similar dependence on the grid resolution in both bound and unbound states. The differences between bound and unbound DADFs induced by biological protein-protein interactions or crystal contacts disappeared at the 70° grid spacing for interfaces and 30° for non-interface surface. The two-fold difference in the critical grid spacing indicates larger changes at the interface than on the rest of the surface. While the earlier studies [18,24,25] observed this trend for the side-chain rotamers, this study validates it by a more general approach based on the DADFs.
Methods
The analysis was performed on the non-redundant Dockground Benchmark 3 set of bound and corresponding unbound protein structures [26]. The set consists of 233 complexes, with the unbound structures of both interacting proteins for 99 complexes, and the unbound structure of one interacting protein for 134 complexes. The following criteria were used for generating the set: sequence identity between bound and unbound structures > 97%; sequence identity between complexes < 30%; and homomultimers, crystal packing, and obligate complexes excluded.
The core residues change conformation upon binding less than the surface ones [24]. Thus, our study focused on the surface residues only. Surface residues were defined as those with the relative solvent-accessible surface area ≥ 25% in bound and unbound state. The change of the residue solvent-accessible surface area (SASA) upon binding was used to differentiate the interface residues from the non-interface ones. SASA was calculated using Naccess [27]. The interface residues were defined as those losing > 1 Å2 SASA upon binding. The statistics of the interface and non-interface residues in the bound and unbound structures are summarized in Table 1. The difference between the numbers of bound and unbound interface/non-interface residues reflects the difference between the number of bound and unbound protein structures in the Dockground set.
Table 1.
Number of surface residues in bound and unbound proteins
| Amino acid | InterfaceUa/Bb | Non-interface U/B |
|---|---|---|
| Ser |
333/429 |
2409/2934 |
| Val |
175/259 |
1003/1116 |
| Thr |
321/406 |
2021/2375 |
| Cys |
40/58 |
183/190 |
| Pro |
250/295 |
1727/2029 |
| Ile |
136/202 |
560/638 |
| Leu |
245/348 |
1095/1258 |
| Asn |
291/350 |
1902/2074 |
| Asp |
329/433 |
2448/2856 |
| His |
126/174 |
682/741 |
| Phe |
108/176 |
457/487 |
| Tyr |
202/296 |
636/718 |
| Trp |
63/100 |
187/220 |
| Gln |
268/357 |
1687/1888 |
| Glu |
416/545 |
2933/3303 |
| Met |
73/119 |
311/329 |
| Lys |
427/555 |
2965/3387 |
| Arg | 325/474 | 1791/2014 |
aUnbound.
bBound.
Side chain conformations were represented by dihedral angles, calculated by Dangle [28]. All dihedral angles varied from −180° to 180°, with exception of the last dihedral angle in Phe, Tyr, Asp and Glu [2], which varied from 0° to 180° due to the symmetry of the terminal aromatic and charged groups. To calculate the distribution functions, the configuration space was divided into cells by a cubic grid.
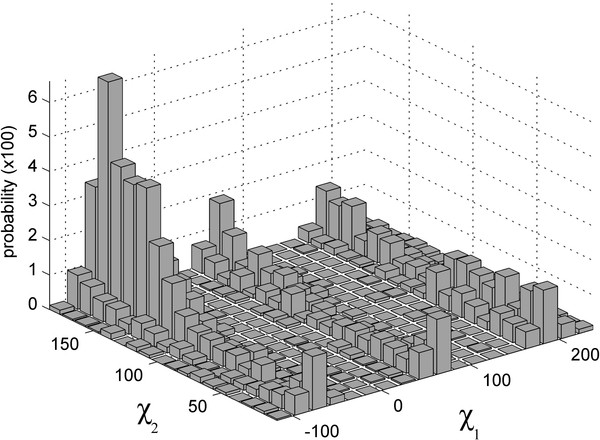
DADFs were calculated as the occupancy of the grid cells separately for each residue type for interface and non-interface, bound and unbound residues. Thus, there were four DADFs for each residue type: interface bound, interface unbound, non-interface bound, and non-interface unbound. Figure 1 shows a two-dimensional distribution function of Asp dihedral angles for the non-interface unbound residues.
Figure 1 .
Dihedral angle distribution of non-interface Asp in unbound structures.
To compare distributions X and Y, the corresponding n-dimensional space (n is the number of the dihedral angles in the side chain) was split into m cubes with a fixed side length. The occupancy in each cell was calculated (Figure 1). The correlation coefficient r [29] between unbound (X) and bound (Y) DADFs was calculated as:
| (1) |
where Xi and Yi are the probabilities of bound and unbound side-chain conformations in a grid cell i, and are the average probabilities of bound and unbound side-chain conformations. To determine the degree of similarity between two probability distributions the Manhattan distance [30] was calculated as:
| (2) |
The Manhattan distance equals 0 for two identical DADFs, and increases up to 1 with the decrease of the DADFs similarity (higher similarity between the DADFs corresponds to lower values of the Manhattan distance).
Results and discussion
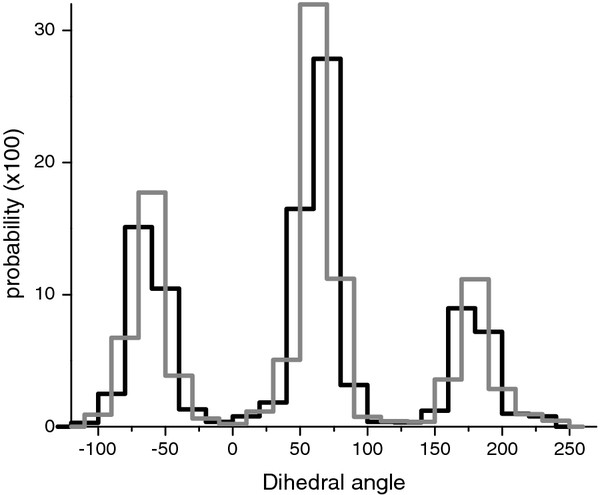
The discrete probability distribution of the amino acid side-chain χ angles depended on the starting point of splitting and the size of the grid spacing. An example of a probability function with 20° grid spacing and different starting points of splitting for non-interface unbound Ser is shown in Figure 2. The distribution was divided into cells with a predefined step size, starting with a randomly chosen point, and the probability in each cell was calculated. To remove the effect of splitting, correlation coefficients were calculated 100 and 1000 times with the same splitting step but random starting point of splitting. Then, the average correlation coefficients were calculated. We found no significant difference between the correlation coefficients averaged 100 or 1000 times. Tests of statistical significance of the correlation [31] between bound and unbound distributions, and non-interface and interface distributions showed that all correlation values were significant, with p-values far below 0.001.
Figure 2 .
Dihedral angle distribution of non-interface unbound Ser with 20° grid spacing and different splitting points.
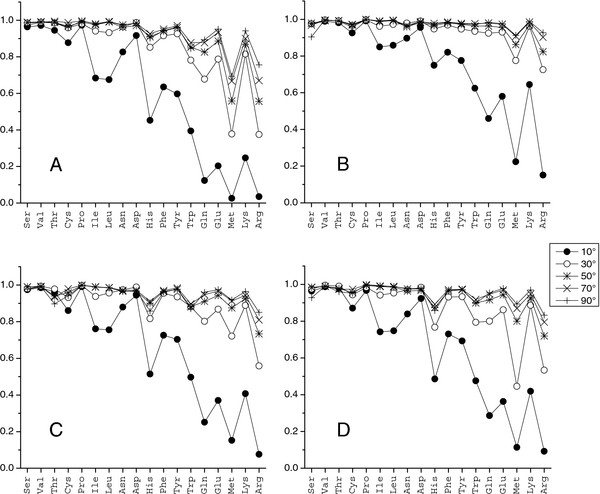
Analysis showed that the correlation coefficients depend on the grid spacing (Figure 3). Generally, larger steps corresponded to higher correlation values (larger cells yielded more smooth/similar distributions). Table 2 shows the grid spacing at which the correlation reaches a high level of 0.7. Most amino acids had high correlation between bound and unbound interface/non-interface distributions for grid spacing ≤ 20°, except Met and Arg at the interface and non-interface, and Glu and Gln at the interface. The correlation coefficient for Met and Arg increased with the grid spacing increase and reached the high level of 0.7 at the 70° grid spacing for interface, and 30° for non-interface. The two-fold difference in the critical grid spacing indicates higher flexibility of these amino acids at the interface [24]. Since the 120° distance between two adjacent side-chain rotamers is significantly larger than the critical grid spacing, the use of large clustering radii for bound and unbound rotamer libraries [24] would produce similar results.
Figure 3 .
Correlation between dihedral angle distributions. (A) Interface bound vs. unbound, (B) non-interface bound vs. unbound, (C) non-interface vs. interface unbound, and (D) non-interface vs. interface bound. For each grid spacing, 100 tests were performed with random splitting point. The plot shows the average correlation value.
Table 2.
The minimal grid spacing corresponding to correlation coefficient 0.7 between bound and unbound interface/non-interface dihedral angle distribution
| Amino acidNIa | stepNIa | Ib |
|---|---|---|
| Ser |
10 |
10 |
| Val |
|
|
| Thr |
|
|
| Cys |
|
|
| Pro |
|
|
| Ile |
|
|
| Leu |
|
|
| Asn |
|
|
| Asp |
|
|
| His |
|
20 |
| Phe |
|
|
| Tyr |
|
|
| Trp |
20 |
|
| Gln |
|
30 |
| Glu |
|
|
| Met |
30 |
70 |
| Lys |
20 |
20 |
| Arg | 30 | 70 |
aNon-interface.
bInterface.
Although the results showed high degree of similarity between the distributions, correlation values for Met and Arg were noticeably lower than for other amino acids. Analysis of the results for Met revealed that although the covariance of distributions for all amino acids with three dihedral angles were the same, the standard deviation for Met was higher (Table 3), leading to the lower correlation value for Met. In the case of Arg, although the standard deviations of Lys were twice larger than that of Arg, the covariance of Arg was ten times smaller than that of Lys, yielding the overall lower correlation for Arg.
Table 3.
Correlation between interface bound and unbound distributions for 30° grid spacing
| Amino acid | Covariance (numerator in Equation1) | Product of Standard deviations (denominator in Equation 1) | Standard deviations of the unbound DADF | Standard deviation of the bound DADF | Correlation |
|---|---|---|---|---|---|
| Ser |
0.0830 |
0.0839 |
0.2884 |
0.2910 |
0.9892 |
| Val |
0.1414 |
0.1456 |
0.3862 |
0.3769 |
0.9714 |
| Thr |
0.1217 |
0.1229 |
0.3475 |
0.3536 |
0.9906 |
| Cys |
0.1162 |
0.1259 |
0.3315 |
0.3797 |
0.9235 |
| Pro |
0.1681 |
0.1725 |
0.4148 |
0.4158 |
0.9744 |
| Ile |
0.1002 |
0.1048 |
0.3446 |
0.3042 |
0.9561 |
| Leu |
0.1343 |
0.1358 |
0.3486 |
0.3896 |
0.9891 |
| Asn |
0.0302 |
0.0329 |
0.1815 |
0.1815 |
0.9174 |
| Asp |
0.0313 |
0.0338 |
0.1727 |
0.1959 |
0.9242 |
| His |
0.0358 |
0.0394 |
0.1944 |
0.2026 |
0.9101 |
| Phe |
0.0520 |
0.0577 |
0.2201 |
0.2621 |
0.9020 |
| Tyr |
0.0449 |
0.0477 |
0.2058 |
0.2317 |
0.9415 |
| Trp |
0.0335 |
0.0419 |
0.2174 |
0.1927 |
0.8003 |
| Gln |
0.0056 |
0.0093 |
0.0901 |
0.1030 |
0.5984 |
| Glu |
0.0069 |
0.0089 |
0.0900 |
0.0986 |
0.7770 |
| Met |
0.0071 |
0.0194 |
0.1403 |
0.1383 |
0.3676 |
| Lys |
0.0096 |
0.0116 |
0.1067 |
0.1092 |
0.8286 |
| Arg | 0.0012 | 0.0033 | 0.0535 | 0.0620 | 0.3515 |
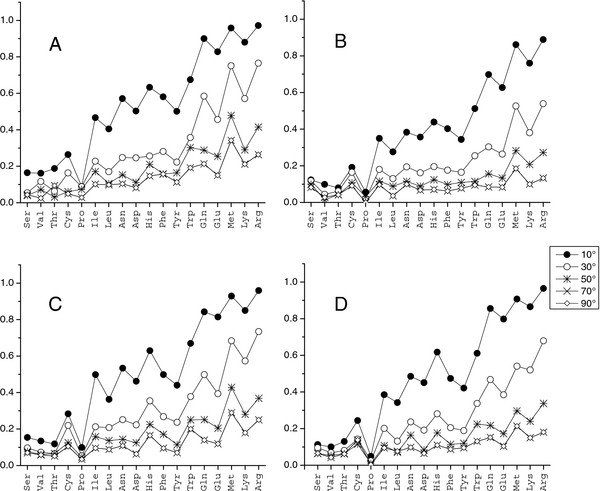
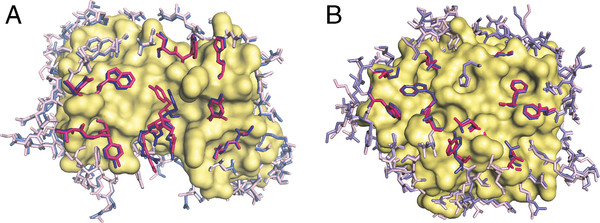
Equation 2 was used to calculate the Manhattan distance between bound and unbound interface/non-interface distributions. As in the case of correlation, the metric value depended on the grid spacing, with larger steps corresponding to more coarse-grained distributions. Thus, tests were conducted with different steps: 10°, 30°, 50°, 70°, and 90°. The distance between the distributions decreased with the step increase (Figure 4). In most cases, the Manhattan distances for the interface were greater than for the non-interface. The distances between interface unbound and bound distributions for all long amino acids with three and four dihedral angles were the largest (Figure 4A). It agrees with our previous findings that long amino acids have higher flexibility in binding [24]. The Manhattan distance between the probability functions was < 30% for most amino acids, starting with 50° grid spacing, except for Met and Arg interface bound vs. unbound and non-interface vs. interface distributions. For these distributions, the distance was < 30% at grid spacing 70°, and < 35% for Met interface bound vs. unbound and Arg bound non-interface vs. interface. The high similarity between the DADFs at the 50° grid spacing is a result of the small number of rotamer-to-rotamer transitions induced by interactions across the interface or the crystal packing. Most side chains have local readjustments (Figure 5) that do not change the rotameric state.
Figure 4.
Manhattan distance between dihedral angle distributions. (A) Interface bound vs. unbound, (B) non-interface bound vs. unbound, (C) non-interface vs. interface unbound, (D) non-interface vs. interface bound.
Figure 5 .
Examples of side-chain conformational changes upon binding. (A) Immunoglobulin and (B) alpha-chymotrypsin in the unbound (blue) and bound (magenta) states. The core residues are shown as surface. The interface residues are shown in bold colors. The bound structure of the immunoglobulin is 1a2y [32], the unbound structure is 1vfa [33]. The bound structure of the alpha-chymotrypsin is 1acb [34], and the unbound structure is 1gct [35].
Conclusions
The dihedral-angle distribution functions were calculated for each amino acid type for interface and non-interface surface residues, in bound and unbound protein structures. To generate the distribution functions, the configuration space was divided into cells by a cubic grid. Correlation coefficients between bound and unbound interface and non-interface distribution functions were calculated. The similarity between the distributions was also quantified by the Manhattan distance. The results showed that all the correlation coefficients depend on amino acid type and the grid resolution. For all amino acid types, the correlation coefficients increased with the increase of the grid spacing. The Manhattan distances between the distribution functions decreased accordingly. Short residues with one or two dihedral angles had higher correlations and smaller Manhattan distances than the longer residues. Met and Arg had the lowest correlation coefficients at any grid spacing. The correlations between the interface and non-interface distribution functions had a similar dependence on the grid resolution in both bound and unbound states. The interface and non-interface difference between bound and unbound distribution functions, induced by biological protein-protein interactions or crystal contacts, disappeared at the 70° grid spacing for interfaces and 30° for non-interface surface, in agreement with an average span of a side-chain rotamer. The two-fold difference in the critical grid spacing indicates larger conformational changes upon binding at the interface than at the rest of the surface. At the same time, transitions between rotamers induced by interactions across the interface or the crystal packing are rare, with most side chains having local readjustments that do not change the rotameric state.
Conformational sampling based on the side chain dihedral angle distributions may optimize flexible docking protocols by reflecting conformational preferences of the bound proteins. The results suggest that the site- (interface vs. non-interface) and residue-specific grid spacing smaller than the critical values should be used in the sampling. The minimal grid spacing (Table 2) reflects intra-rotamer amino acid local readjustments upon binding. Thus, using such steps in conformational sampling may accelerate the flexible docking search by reflecting the size of these readjustments.
Competing interests
The authors declare that they have no competing interests.
Authors' contributions
All authors conceived and designed the research. TK and AMR carried out the calculations, and all authors analyzed the results. The manuscript was drafted by TK and written/revised by all authors, who read and approved the final manuscript.
Authors' information
TK is a PhD student at the United Institute of Informatics Problems, National Academy of Sciences of Belarus and a Research Assistant at the Center for Bioinformatics, The University of Kansas; AMR is an Assistant Research Professor at the Center for Bioinformatics, The University of Kansas; AVT is the General Director of the United Institute of Informatics Problems, National Academy of Sciences of Belarus; and IAV is the Director of the Center for Bioinformatics and Professor of Bioinformatics and Molecular Biosciences at The University of Kansas.
Contributor Information
Tatsiana Kirys, Email: tatsiana@ku.edu.
Anatoly M Ruvinsky, Email: ruvinsky@ku.edu.
Alexander V Tuzikov, Email: tuzikov@newman.bas-net.by.
Ilya A Vakser, Email: vakser@ku.edu.
Acknowledgements
This study was supported by grant R01GM074255 from the NIH.
References
- Dunbrack RL, Cohen FE. Bayesian statistical analysis of protein side-chain rotamer preferences. Protein Sci. 1997;6:1661–1681. doi: 10.1002/pro.5560060807. [DOI] [PMC free article] [PubMed] [Google Scholar]
- Dunbrack RL, Karplus M. Backbone-dependent rotamer library for proteins: application to side-chain prediction. J Mol Biol. 1993;230:543–574. doi: 10.1006/jmbi.1993.1170. [DOI] [PubMed] [Google Scholar]
- Janin J, Wodak S. Conformation of amino acid side-chains in proteins. J Mol Biol. 1978;125:357–386. doi: 10.1016/0022-2836(78)90408-4. [DOI] [PubMed] [Google Scholar]
- Mcgregor MJ, Islam SA, Sternberg MJE. Analysis of the relationship between side-chain conformation and secondary structure in globular-proteins. J Mol Biol. 1987;198:295–310. doi: 10.1016/0022-2836(87)90314-7. [DOI] [PubMed] [Google Scholar]
- Lovell SC, Word JM, Richardson JS, Richardson DC. The penultimate rotamer library. Proteins. 2000;40:389–408. doi: 10.1002/1097-0134(20000815)40:3<389::AID-PROT50>3.0.CO;2-2. [DOI] [PubMed] [Google Scholar]
- Tuffery P, Etchebest C, Hazout S, Lavery R. A new approach to the rapid determination of protein side-chain conformations. J Biomol Struc & Dynamics. 1991;8:1267–1289. doi: 10.1080/07391102.1991.10507882. [DOI] [PubMed] [Google Scholar]
- Benedetti E, Morelli G, Nemethy G, Scheraga HA. Statistical and energetic analysis of side-chain conformations in oligopeptides. Int J Pept Prot Res. 1983;22:1–15. doi: 10.1111/j.1399-3011.1983.tb02062.x. [DOI] [PubMed] [Google Scholar]
- Chandrasekaran R, Ramachandran GN. Studies on the conformation of amino acids. XI. Analysis of the observed side group conformation in proteins. Int J Protein Res. 1970;2:223–233. [PubMed] [Google Scholar]
- Bhat TN, Sasisekharan V, Vijayan M. Analysis of side-chain conformation in proteins. Int J Pept Prot Res. 1979;13:170–184. doi: 10.1111/j.1399-3011.1979.tb01866.x. [DOI] [PubMed] [Google Scholar]
- Ponder JW, Richards FM. Tertiary templates for proteins. Use of packing criteria in the enumeration of allowed sequences for different structural classes. J Mol Biol. 1987;193:775–791. doi: 10.1016/0022-2836(87)90358-5. [DOI] [PubMed] [Google Scholar]
- Schrauber H, Eisenhaber F, Argos P. Rotamers: to be or not to be? An analysis of amino acid side-chain conformations in globular proteins. J Mol Biol. 1993;230:592–612. doi: 10.1006/jmbi.1993.1172. [DOI] [PubMed] [Google Scholar]
- Kono H, Doi J. A new method for side-chain conformation prediction using a hopfield network and reproduced rotamers. J Comput Chem. 1996;17:1667–1683. [Google Scholar]
- DeMaeyer M, Desmet J, Lasters I. All in one: a highly detailed rotamer library improves both accuracy and speed in the modelling of sidechains by dead-end elimination. Fold Des. 1997;2:53–66. doi: 10.1016/S1359-0278(97)00006-0. [DOI] [PubMed] [Google Scholar]
- Beglov D, Hall D, Brenke R, Shapovalov MV, Dunbrack RL, Kozakov D, Vajda S. Minimal ensembles of side chain conformers for modeling protein-protein interactions. Proteins. 2011;80:591–601. doi: 10.1002/prot.23222. [DOI] [PMC free article] [PubMed] [Google Scholar]
- Dunbrack RL. Rotamer libraries in the 21st century. Curr Opin Struct Biol. 2002;12:431–440. doi: 10.1016/S0959-440X(02)00344-5. [DOI] [PubMed] [Google Scholar]
- Shapovalov MS, Dunbrack RL. A smoothed backbone-dependent rotamer library for proteins derived from adaptive kernel density estimates and regressions. Structure. 2011;19:844–858. doi: 10.1016/j.str.2011.03.019. [DOI] [PMC free article] [PubMed] [Google Scholar]
- Pickett SD, Sternberg MJE. Empirical scale of side-chain conformational entropy in protein folding. J Mol Biol. 1993;231:825–839. doi: 10.1006/jmbi.1993.1329. [DOI] [PubMed] [Google Scholar]
- Guharoy M, Janin J, Robert CH. Side-chain rotamer transitions at protein–protein interfaces. Proteins. 2010;78:3219–3225. doi: 10.1002/prot.22821. [DOI] [PubMed] [Google Scholar]
- Carugo O, Argos P. Protein-protein crystal-packing contacts. Protein Sci. 1997;6:2261–2263. doi: 10.1002/pro.5560061021. [DOI] [PMC free article] [PubMed] [Google Scholar]
- Janin J, Bahadur RP, Chakrabarti P. Protein-protein interaction and quaternary structure. Quart Rev Biophys. 2008;41:133–180. doi: 10.1017/S0033583508004708. [DOI] [PubMed] [Google Scholar]
- Zhao S, Goodsell DS, Olson AJ. Analysis of a data set of paired uncomplexed protein structures: new metrics for side-chain flexibility and model evaluation. Proteins. 2001;43:271–279. doi: 10.1002/prot.1038. [DOI] [PubMed] [Google Scholar]
- Jacobson MP, Friesner RA, Xiang Z, Honig B. On the role of the crystal environment in determining protein side-chain conformations. J Mol Biol. 2002;320:597–608. doi: 10.1016/S0022-2836(02)00470-9. [DOI] [PubMed] [Google Scholar]
- Eyal E, Gerzon S, Potapov V, Edelman M, Sobolev V. The limit of accuracy of protein modeling: influence of crystal packing on protein structure. J Mol Biol. 2005;351:431–442. doi: 10.1016/j.jmb.2005.05.066. [DOI] [PubMed] [Google Scholar]
- Ruvinsky AM, Kirys T, Tuzikov AV, Vakser IA. Side-chain conformational changes upon protein-protein association. J Mol Biol. 2011;408:356–365. doi: 10.1016/j.jmb.2011.02.030. [DOI] [PMC free article] [PubMed] [Google Scholar]
- Kirys T, Ruvinsky A, Tuzikov AV, Vakser IA. Rotamer libraries and probabilities of transition between rotamers for the side chains in protein-protein binding. Proteins. 2012;80:2089–2098. doi: 10.1002/prot.24103. [DOI] [PMC free article] [PubMed] [Google Scholar]
- Gao Y, Douguet D, Tovchigrechko A, Vakser IA. DOCKGROUND system of databases for protein recognition studies: unbound structures for docking. Proteins. 2007;69:845–851. doi: 10.1002/prot.21714. [DOI] [PubMed] [Google Scholar]
- Hubbard SJ, Thornton JM. NACCESS, computer program, Department of Biochemistry and Molecular Biology. University College London; 1993. [Google Scholar]
- 'Dang', Computer Program. http://kinemage.biochem.duke.edu.
- Rodgers JL, Nicewander WA. Thirteen ways to look at the correlation coefficient. The American Statistician. 1988;42:59–66. [Google Scholar]
- Krause EF. Taxicab Geometry : an adventure in non-Euclidean geometry. New York: Dover Publications; 1987. [Google Scholar]
- Rahman NA. A course in theoretical statistics. Charles Griffin & Co; 1968. [Google Scholar]
- Dall'Acqua W, Goldman ER, Lin W, Teng C, Tsuchiya D, Li H, Ysern X, Braden BC, Li Y, Smith-Gill SJ. A mutational analysis of binding interactions in an antigen-antibody protein-protein complex. Biochemistry. 1998;37:7981–799. doi: 10.1021/bi980148j. [DOI] [PubMed] [Google Scholar]
- Bhat TN, Bentley GA, Boulot G, Greene MI, Tello D, Dall'Acqua W, Souchon H, Schwarz FP, Mariuzza RA, Poljak RJ. Bound water molecules and conformational stabilization help mediate an antigen-antibody association. Proc Natl Acad Sci USA. 1994;91:1089–1093. doi: 10.1073/pnas.91.3.1089. [DOI] [PMC free article] [PubMed] [Google Scholar]
- Frigerio F, Coda A, Pugliese L, Lionetti C, Menegatti E, Amiconi G, Schnebli HP, Ascenzi P, Bolognesi M. Crystal and molecular structure of the bovine alpha-chymotrypsin-eglin c complex at 2.0 a resolution. J Mol Biol. 1992;225:107–123. doi: 10.1016/0022-2836(92)91029-O. [DOI] [PubMed] [Google Scholar]
- Dixon MM, Matthews BW. Is gamma-chymotrypsin a tetrapeptide acyl-enzyme adduct of alpha-chymotrypsin? Biochemistry. 1989;28:7033–7038. doi: 10.1021/bi00443a038. [DOI] [PubMed] [Google Scholar]


