

Abstract
It is well-established that synapse formation involves highly selective chemospecific mechanisms, but how neuron arbors are positioned before synapse formation remains unclear. Using 3D reconstructions of 298 neocortical cells of different types (including nest basket, small basket, large basket, bitufted, pyramidal, and Martinotti cells), we constructed a structural model of a cortical microcircuit, in which cells of different types were independently and randomly placed. We compared the positions of physical appositions resulting from the incidental overlap of axonal and dendritic arbors in the model (statistical structural connectivity) with the positions of putative functional synapses (functional synaptic connectivity) in 90 synaptic connections reconstructed from cortical slice preparations. Overall, we found that statistical connectivity predicted an average of 74 ± 2.7% (mean ± SEM) synapse location distributions for nine types of cortical connections. This finding suggests that chemospecific attractive and repulsive mechanisms generally do not result in pairwise-specific connectivity. In some cases, however, the predicted distributions do not match precisely, indicating that chemospecific steering and aligning of the arbors may occur for some types of connections. This finding suggests that random alignment of axonal and dendritic arbors provides a sufficient foundation for specific functional connectivity to emerge in local neural microcircuits.
Keywords: connectome, microcircuitry, neocortex, neuronal connectivity
During development, a broad range of molecular signaling mechanisms act to form the neocortical layers (1, 2), lay down guidance tracts for neurons to position themselves and grow their axonal and dendritic arbors (3, 4), shape the morphologies of different types of neurons (5), guide input axons to specific layers (6), trigger differentiation and clustered arborizations of axonal arbors (7), prune axonal arbors in an activity-dependent manner (8), guide axonal growth along the axon initial segment (9), and selectively form synapses between specific types of neurons (10–12). Molecular mechanisms also contribute to the activity-triggered formation of synapses between specific pairs of neurons (13). The mechanisms determining this selective connectivity have been a subject of active debate for over a century (3, 14–17), with proposals ranging from the idea of “chemical relations” between connected neurons in the work by Langley (18) to the “chemoaffinity hypothesis” (the idea that precise synaptic positioning is specified by “highly specific cytochemical affinities” between neurons) in the work by Sperry (19). The result is an intriguing map of synaptic connections between all neurons and specific types of neurons, commonly called the connectome. How the connectome arises is still debated (20). A question that is at the core of the debate is to what extent do chemospecific mechanisms specifically align neuronal arbors between neurons before synaptic connections are formed.
Spines are dynamic structures that form, grow, shrink, or even disappear in response to activity and experience (21), and neocortical pyramidal neurons connect and disconnect from each other dynamically and in response to stimulation (13). Local dendritic and axonal specializations, such as the formation of a spine and synaptic bouton, are sufficient to reconfigure neural circuits without the need for axons to grow to a target cell. Therefore, all neurons that can potentially form connections must already be aligned before synapse formation to ensure cell type-specific synaptic patterning. Even the strongest proponents of statistical connectivity or neurogeometry (22, 23) believe that arbor alignment requires extracellular chemical repulsion (24) and attraction (25). However, it has been proposed that the unique alignment of thousands of individual fibers of specific pairs of neurons would require “millions and perhaps billions” of cell-specific molecular isoforms (19).
To address the question of the extent to which the alignment of arbors between specific types of neurons is caused by pairwise chemospecific signaling as opposed to the incidental overlap of independent neural morphologies, we constructed a model neocortical circuit containing a subset of the neuron types found in neocortex. By assembling the circuit from morphologies that were from the same brain area and age range but different animals and positioned randomly, any possible pairwise chemospecific alignment was excluded. This assembly allowed us to test the extent to which statistical connectivity, as measured in terms of appositions between arbors of independently positioned and grown morphologies, could predict measurements of functional synaptic connectivity found in cortical slice preparations. We found that, with only a few exceptions, statistical connectivity was a good predictor of functional synaptic connectivity. This finding suggests that the connectome of cortical microcircuitry is largely formed from the nonspecific alignment of neuron morphologies. In only a few cases are chemospecific mechanisms required to explain specific fiber alignments.
Results
Although many studies have examined the extent that geometrical overlap predicts the number of synapses between neurons (23), it has been more difficult to test whether random geometrical mechanisms can account for the distribution of synapses from one type of neuron to another (synaptic patterning). This testing requires quantitative data on the precise positioning of synapses in connections between neurons of known types (26–28). These connections must be systematically sampled and morphologies must be reconstructed for neurons of the same types and origin as those morphologies used in measurements of synaptic connections. In addition, reconstructing the 3D cortical microcircuit and identifying the full set of appositions between neuronal axons and dendrites require specialized supercomputing hardware and software. We first measured the distribution of putative synapse positions between pairs of synaptically coupled neurons in slice. We then created a structural computer model of a cortical microcircuit to predict synapse positions by identifying appositions between pre- and postsynaptic elements of reconstructed neurons. Finally, we compared the experimental and predicted distributions and found that the structural model predicted a major portion of the experimentally identified putative synapses.
Functional Synaptic Connectome.
We identified the anatomical locations of putative pre- and postsynaptic synapses for 10 types of connections between identified types of neurons in slices of rat somatosensory cortex (postnatal day 12–16). This identification entailed identifying synaptically coupled neurons with presynaptic stimulation and postsynaptic measurement of responses in paired whole-cell patch-clamp recordings, staining the coupled neurons, and reconstructing them using a Neurolucida (MicroBrightField) system with a light microscope (Materials and Methods and Fig. 1A). 3D reconstructions of pairs of neurons were used to trace presynaptic axon and postsynaptic dendrites and somata and identify cases in which boutons on axon collaterals were adjacent (within the same focal plane ∼ 0.5 μm) to the postsynaptic neuron, forming a putative synapse (n = 90) (Materials and Methods and Fig. 1 B and C). This approach does not unequivocally identify functional synapses. However, if all arbors are reconstructed, the set of putative synapses will necessarily contain all functional synapses; previous electron microscope studies have shown, furthermore, that most putative synapses between identified connected pairs are actual synapses (26, 28–32).
Fig. 1.

Patterning of putative synapses between synaptically coupled neurons. (A) Synaptically coupled L5 PCs stained and in false color. (B) Schematic of the criteria for determining whether an apposition is a putative synapse (Left) or not (Right) (Materials and Methods). (C) A reconstruction of two synaptically coupled neurons (asterisks indicate locations of putative synapses). (D) An axogram (Left) and dendrogram (Right) indicating how synaptic locations are recorded. (E) Histograms of locations of putative synapses on the axon (Left, blue) and dendrites (Right, red), where the x axis is the axonal or dendritic branch order where (Upper) the putative synapse was observed (x axis) or (Lower) the path distance to the putative synapse along the axon or dendrite from the soma.
We computed histograms of the putative synaptic locations on the axon of the presynaptic neuron (the experimental presynaptic innervation pattern) and the soma and dendrite of the postsynaptic neuron (the experimental postsynaptic innervation pattern). In each case, distributions were measured in two ways: (i) in terms of branch order of the axon and basal, apical, and apical tuft portions of the dendrite where the putative synapse occurred (Fig. 1D) and (ii) according to the path distance of the putative synapse location along the axon or dendrite from the soma. Putative synapses between pyramidal cells were differentially distributed on domains of the presynaptic axon and the postsynaptic dendrites (Fig. 1E), consistent with previous reports of domain specificity. For example, thick-tufted layer 5 (TTL5) neurons have ∼20–25% of putative synapses on third-order basal dendrites of other TTL5 neurons (26, 30, 33, 34). Domain-specific patterning of putative synapses was also observed in connections from different classes of interneurons onto pyramidal cells (Figs. S1 and S2). For example, pyramidal axons primarily formed putative synapses on basal and proximal apical trunk domains. In addition, Martinotti neurons innervate the distal dendrites of pyramidal cells, whereas small basket cells (Fig. S1F) innervate only somata and proximal dendrites (Fig. S2C). This result is consistent with the known preferences of different types of interneurons to form synapses on specific domains of nearby neurons (26, 30, 33, 34). The functional synaptic patterns, which we quantify here for various types of synaptic connections, are, therefore, consistent with known preferences of axons of different neurons to target different domains of their target neurons.
Statistical Structural Connectome.
To establish the pattern of appositions between the dendrites and axons of randomly positioned neurons (the statistical structural connectome), we recorded, stained, and anatomically reconstructed 298 neocortical neurons (pyramidal cells and interneurons). The neurons were obtained from different experiments and animals, but they were always from the same species, region of the brain, and age range (rat, somatosensory area S1, and P12–P16). The bulk of neuron reconstructions came from single-cell studies and was, therefore, independent from the dataset used to obtain the experimental innervation patterns between connected pairs. The final dataset included at least seven exemplars for each type of neuron morphology [pyramidal cells (PCs), nest basket cells (NBCs), small basket cells (SBCs), large basket cells (LBCs), bitufted cells (BTCs), and Martinotti cells (MCs)]. Additionally, we used data on the statistical distribution of arborization patterns to generate statistical variants for each type of neuron, expanding the dataset of unique morphologies for each type (Materials and Methods). The final dataset, thus, contained a large number of morphologically unique cells of each type from different layers (Ls) of the neocortex (L2/3, n = 4,300; L4, n = 2,000; L5, n = 1,500; L6, n = 2,000).
We then built a model microcircuit by selecting neurons randomly from this pool on the basis of experimentally estimated densities and proportions (Materials and Methods) and positioning their somata in a 3D volume corresponding to the size of a functional neocortical column (550-μm diameter × 1,550-μm height) (Materials and Methods and Fig. 2A). The x and y coordinates for the neurons were chosen randomly and independently of their original positions in the slice and axial rotations. The z coordinates were also selected randomly but constrained to the depth of the layer from where the neuron morphology originated (L2/3 = 356 ± 209 μm; L4 = 669.5 ± 104.5 μm; L5 = 977 ± 203 μm; L6 = 1425 ± 245 μm). Thus, all neurons were positioned in the layers and vertical orientations in which they were found. Positions and rotations of neurons within their layer in the model circuit were, therefore, independent of any specific pairwise spatial relationship or axial rotation that may have existed in the original brain tissue. The sites of close appositions between neurons were identified using a collision detection algorithm running on a supercomputer. The algorithm identified all appositions between potential pre- and postsynaptic elements, including axons, dendrites, and somata, within a threshold distance (35) comprising the statistical connectivity of the model cortical microcircuit. The histograms of the positions of these potential synapse locations for different pre- and postsynaptic neuron types (called predicted innervation patterns) characterize the statistical structural connectivity. As with the characterization of functional synaptic connectivity, two types of innervation patterns were computed: one type based on the distance of the potential synapses from the soma and one type based on the branch order at which the potential synapse occurs.
Fig. 2.

Cell type-specific domain specificity from statistical connectivity. (A) A model neocortical microcircuit illustrating some of the different pyramidal and interneuron morphologies used and arranged in five layers. Each morphological type is colored differently. (B) Incidental appositions (blue dots) formed by a population of SBCs on a single representative PC. (C) Incidental appositions (purple dots) formed by a population of MCs on the same PC as in B.
Statistical Structural Connectivity Predicts Functional Synaptic Connectivity.
We found multiple appositions between the axons of the presynaptic and dendrites of the postsynaptic neurons for individual pairs of neurons (Fig. 3A), comparable with the multisynapse connections found in the neocortex (26, 29, 30). As in the functional connectivity, the statistical connectivity exhibited domain preferences specific to the axon and the class of dendrite (basal, apical, and tuft) as well as the class of pre- and postsynaptic neurons (Fig. 2 B and C and Figs. S3 and S4). Incidental appositions of independent and randomly arranged morphologies are, therefore, largely sufficient to predict multisynapse connections with preferences for different domains of the target neurons.
Fig. 3.

Comparing experimental and predicted connectivity patterns between L5 PCs. Experimental and predicted innervation patterns were both obtained for all neurons within 50 μm of each other in the microcircuit. The axonal predicted innervation patterns are indicated in blue, the dendritic predicted innervation patterns are indicated in red, experimentally measured innervation patterns are indicated in black, and the overlap is indicated in gray. (A) A pair of coupled PCs from the model microcircuit. (B) Overlap according to path distance. (C) Overlap according to branch order. Error bars in B and C indicate SEM across 10 circuits constructed with different subsets of neurons.
The accuracy of the predicted synaptic locations was tested using histogram intersection (HI) between the experimental innervation pattern and the predicted innervation patterns. The HI is a standard measure used to compare histograms, and it measures the fraction of one distribution that overlaps with another distribution. In addition, we tested for a significant match of innervation patterns using the Kolmogorov–Smirnov (KS) test (α < 0.05), which is a nonparametric test for the equality of two distributions (Materials and Methods). The average HI for all pathways was 74 ± 2.7% (mean ± SEM; maximum = 94.8%; minimum 49.2%) (Materials and Methods and Table 1). This finding suggests that statistical connectivity predicts the majority of synapses positions distributed along the axonal and dendritic arbors. However, we also observed differences between the model and experimental innervation patterns (see below).
Table 1.
Mean error and histogram intersection for experimental and predicted innervation patterns
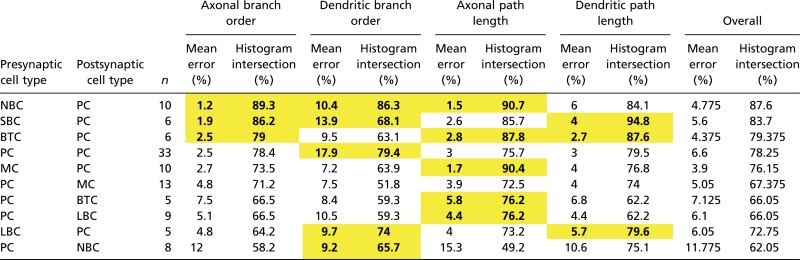 |
Predicted and biological distributions that are considered equivalent are in yellow and bold (KS test; α = 0.05).
For PC–PC connections (Fig. 3 B and C), we found that over 75% of all experimental synapse positions were predicted by the statistical structural connectivity, regardless of whether synapses locations were ordered by path distance from the soma (presynaptic HI = 75.7%; postsynaptic HI = 79.5%) or branch order (presynaptic HI = 78.4%; postsynaptic HI = 79.4%).
In general, the distribution of synapse positions on axons (presynaptic innervation patterns) was better predicted by statistical structural connectivity than the distribution on dendrites (postsynaptic innervation patterns). Overall, interneuron to pyramidal experimental innervation patterns (Fig. 4 A, C, E, and G) were some of the best predicted by the statistical structural connectivity (HI = 78.4 ± 4.5% axonal branch order; HI = 71.0 ± 4.3% dendritic branch order; HI = 85.6 ± 3.2% axonal path distance; HI = 84.6 ± 3.2% dendritic path distance; mean ± SEM). Pyramidal to interneuron experimental innervation patterns were also predicted by the statistical structural connectivity (Fig. 4 B, D, F, and H) but to a lesser extent (HI = 68.2 ± 3.3% axonal branch order; HI = 63.1 ± 4.6% dendritic branch order; HI = 70.0 ± 5.2% axonal path distance; HI = 70.6 ± 3.6% dendritic path distance; mean ± SEM). This finding indicates that statistical structural connectivity can explain a significant proportion of domain targeting as well as the general shape of the distributions. This finding is a surprising result, especially when considering that specific domain targeting by axons from different types of interneurons has been one of the main justifications for chemospecific theories of guided targeting and even led to domain-target based classifications of interneurons (26, 28, 34, 36–56).
Fig. 4.

Comparison of experimental and predicted innervation patterns for different types of connection. The color code is the same as in Fig.3. Innervation patterns (mean ± SEM; over apposition distances = 0–4 μm) according to branch order. (A) Experimental and predicted innervation patterns for NBC to PC. (B) PC to NBC. (C) SBC to PC. (D) PC to LBC. (E) MC to PC. (F) PC to MC. (G) BTC to PC. (H) PC to BTC. KS* indicates significant Kolmogorov-Smirnov equality (α < 0.05).
We observed that the relatively large difference between predicted and measured postsynaptic innervation patterns in connections between PCs was largely caused by specific differences in patterns of innervation with somata and apical dendrites (Fig. 3 B and C). It is well-established that pyramidal axons, unlike the axons of some interneurons, do not usually form synapses on pyramidal somata (26, 29, 34, 45). However, their axons inevitably pass near the somata and proximal dendrites of other pyramidal neurons, suggesting that chemospecific mechanisms do not permit the en passant axons of these cells to form synapses with somata or proximal dendrites. Selecting a subset of all fibers passing randomly by a neuron could also account for differences in the degree of geometrical overlap between neuronal arborizations and the degree of functional connectivity (57).
Statistical connectivity predicted fewer synapses on the apical dendrites between close neighbor PCs than were found experimentally. This result could be achieved by guidance of randomly growing ascending arbors of immediate neighboring neurons into vertically oriented glial tracts (12).
Statistical connectivity also predicts that the first portion of the initial segment of the presynaptic axon (0–50 μm; branch order zero) (Fig. 5) will form appositions with arbors from all types of neurons, although it is known that this portion of the axon does not produce presynaptic specializations (58). This initial portion of the axon can, however, produce postsynaptic specializations but only with Chandelier cell axons (59). Our statistical model predicts that the axons of other types of neurons would form appositions with the initial segment, although it clearly is not the case. Therefore, chemospecific signals may be necessary to repel the axon segment away from forming appositions with other axons. Although we do not have sufficient data on Chandelier cells in their synapse distributions, it seems unlikely that statistical connectivity is sufficient to ensure that the axon connects as precisely onto the initial segment of pyramidal neuron axons as found experimentally. One possibility is that the Chandelier axon grows randomly, but after it contacts a PC body, it is chemically guided down the pyramidal axon, which has been reported for Purkinje cells in the cerebellum (9).
Fig. 5.

Complementary coverage of a neuron with appositions from multiple types of presynaptic neuron. (A) A single TTL5 neuron from the model microcircuit and the appositions (colored dots) for nine types of presynaptic neuron, each color coded differently. (B) The mean ± SEM percentage of synapses that were over- or underestimated at different path distances from the soma along the postsynaptic dendrite.
Other mismatches between the predictions of the statistical structural model and observed functional connectivity may mark finer distortions in the alignment of arbors between specific types of neurons. For example, it has been reported that interneurons that form connections with pyramidal neurons exhibit correlated bends between their axons and dendrites, where such a correlation is absent if the neurons are not connected (25). The synapse locations are, nonetheless, predicted by the statistical model, suggesting that chemospecific signals need only to tweak the arbors that are already in position when the two neurons become functionally connected. Such local forces may act over variable spatial ranges or only between specific types of neuron, possibly explaining why pyramidal axons do not show this kind of correlated tortuosity when forming synaptic connections (25).
The statistical model somewhat underestimated the observed proportions of synapses on distal and tuft dendrites (Fig. 5B). This result may be an artifact of the process used to reconstruct neuronal morphologies for the model, and more specifically, it may be because of the difficulty of capturing very fine distal axonal arbors with in vitro staining and light microscope reconstructions (Materials and Methods).
Lastly, we found that the statistical model predicted head-on collisions, in which axons and dendrites pierced the somata of other neurons. Naturally, these collisions do not occur in the brain. Given that neurons are unlikely to have a priori knowledge of the location of the somata of other neurons, we suggest that the extracellular environment around somata could offer increasing physical resistance as arbors come closer to somata. Another possibility is that somata release a nonspecific chemospecific signal to subtly steer axons and dendrites around them.
Robust Statistical Structural Connectome.
The properties of statistically generated structural connectivity are likely to differ from the properties generated by the combinatorial action of chemospecific mechanisms, with a vast number of molecular isoforms aligning the axons and dendrites of individual neurons to the axons and dendrites of other neurons. We, therefore, examined the sensitivity of the structural connectome to the precise configuration of the model microcircuit. We generated multiple model circuits, randomly changing the positions of individual cells and their rotation around the axial axis in each circuit. We generated 10 circuits each with decreased (50%) and increased (150%) neuron densities. The statistical distribution of structural innervation patterns was very similar in all circuits (Fig. 6A) (n = 10; r > 0.99; P < 0.001). The cell type-specific statistical structural connectome produced by random arbor alignment is, therefore, independent of the specific positions, rotations, and densities of neurons.
Fig. 6.

Morphological diversity confers invariance to structural connectivity. The structural innervation pattern for different circuits built from 24 unique TTL5 PC morphologies (TTL5–TTL5; mean ± SEM; n = 10 circuits). Structural innervation patterns according to path distance from somata. (Left) Axon (blue). (Right) Dendrite (red). (A) Structural innervation patterns (mean ± SEM) for control circuits with different densities of neurons. (B) Structural innervation pattern (mean ± SEM) over varying touch distances (0–4 μm). Note that SEM is higher around somata. (C) Structural innervation pattern (mean ± SEM) for a model microcircuit with an increasing number of unique TTL5 morphologies used to construct each circuit (n = 1, 10, and 100). (D) Bar plot of the mean SE for the model microcircuits in C. Note the decrease in variability of the innervation pattern with an increase in unique morphologies.
The number of potential synapses identified by the statistical model is linearly related to maximal touch distance between neuronal arbors (60). The value chosen depends on the assumed radius of presynaptic boutons, the potential reach of dendritic spines, the artifactual and real tortuosity of arbors, and potential imperfections in the reconstructions. However, the spatial distribution (innervation pattern) of potential synapses is invariant across a wide range of possible apposition distances (0–4 μm) (Materials and Methods and Fig. 6B). The model, therefore, yields essentially the same structural connectome, regardless of the specific apposition threshold. It also implies that the statistically generated structural connectome is highly robust to perturbations and suggests that overall synapse distributions are invariant in animals belonging to the same species.
Invariant Statistical Structural Connectome.
The low variance of statistical connectivity may be a consequence of the large number of variant morphologies in our models. To test this hypothesis, we constructed a series of circuits, each containing 4,250 TTL5 neurons but a different number of unique morphologies in each circuit. The first circuit in the series was composed of neuron clones, with each neuron a copy of a single reconstructed neuron. The second circuit was constructed with copies of 10 different TTL5 neurons, the third circuit was constructed with copies of 20 different TTL5 neurons, and so on; the final circuit contained unique morphological variants for all 4,250 cells. Because we do not have this number of neuronal reconstructions, morphological variants were generated statistically by jittering the branching of the arbors. Morphological variants were unique in terms of their precise branching angles and segment lengths, but they maintained the statistics of the original reconstructed cell type (based on 24 original morphological exemplars for TTL5 neurons) (Materials and Methods).
As the number of unique morphologies used to construct each circuit was increased, the variability of resulting structural innervation patterns decreased (Fig. 6C). Surprisingly, as few as 10 different morphologies were sufficient for the innervation pattern to become largely invariant (Fig. 6D). The low number of morphological variants required was likely because of the fact that TTL5 neurons have a highly characteristic dendritic and axonal arborization (i.e., low intrinsic diversity), requiring only a few neurons to achieve an average with low variance.
Deriving the Statistical Structural Connectome from Morphologies.
Statistical connectivity implies that the distribution of appositions (innervation pattern) can be computed from volume density representations of individual and average dendrites and axons rather than the collision detection process. We, therefore, computed the joint axonal and dendritic fiber density (Materials and Methods) within cubic voxels (50 μm per side) at each branch order of the basal dendrites of TTL5–TTL5 connections and compared the computed innervation patterns with the patterns found by collision detection. The computed and detected innervation patterns were not significantly different (SI Materials and Methods and Fig. S5). This finding confirms that the model that we used to predict the innervation patterns is a valid statistical model. The computed innervation patterns, furthermore, reveal that the core (average) geometrical difference in the morphologies of different classes of neurons is a primary determinant of cell type-specific domain targeting (Fig. S6), and therefore, it confirms that statistical connectivity can generate cell type-specific domain targeting. In addition, because the innervation patterns are independent of cell density, statistical connectivity conveys a robustness to cell loss and invariance with respect to the precise positions, rotations, and morphologies of the neurons involved in the circuit (because it relies on the average connectivity).
Discussion
The extent to which nonpairwise statistical and pairwise chemospecific mechanisms account for the formation of the connectome has been debated for decades. We constructed a test in which we compared the incidental appositions between the axonal and dendritic arbors of independently grown, randomly positioned neurons (statistical structural connectivity) with experimental measurements of patterns of synaptic connectivity between pairs of neurons of specified types (functional synaptic connectivity). The results indicate that statistical connectivity can account for much of the specific synaptic patterning between neurons. Minor mismatches can be explained by pairwise chemospecific mechanisms that tweak the fine positioning of arbors that are already approximately in place between two types of neuron. Major mismatches can be explained by pairwise interventions during random arbor growth.
This study casts light on the relative roles of statistical and chemospecific mechanisms in the formation of the connectome. For example, differentiation of neurons and their migration to specific neocortical regions and layers are guided by specific molecular mechanisms (61), but we show that their exact positioning within their layer is not critical for achieving cell type-specific patterning of synapses. The chemical environment generated by the layering of the neocortex and neighboring cells is also essential for proper neuronal arborization and orientation of neurons to or away from the pia, but the role of these molecular processes is nonspecific and therefore, not aimed at any specific pair of neurons. Based on the statistical model predictions, we also suggest that, to avoid arbors colliding with somata during arbor growth, a nonspecific chemical or physical mechanism (e.g., resistance of the extracellular space) steers arbors gently around somata, which could explain why arbors are so remarkably straight, despite the high density of neurons in the cortex. Pairwise chemospecific signals and premade tracts for arbor growth, such as radial glial tracts, could capture and guide randomly growing arbors biasing specific arbor alignments between some neurons. When neurons do form synapses at a subset of the appositions, the synaptic formation process may also need to first tweak (attraction mechanisms) the randomly passing arbors to achieve closer apposition, thus explaining correlations in arborization and potentially, different expected connection probabilities found for some synaptically connected neurons (25). Similarly, pairwise chemospecific mechanisms could explain the absence of synapses on specific domains of some neurons, despite inevitable physical appositions (repulsion mechanisms) (57). Chemospecific mechanisms would also determine the chemical identify of synapses and where on a spine (head, neck, or shaft) synapses will form (62), but statistical connectivity would still need to provide the initial foundation for such specialized connectivity. Together, nonpairwise statistical and pairwise molecular mechanisms can, therefore, explain cell type-specific functional connectivity.
This study also suggests that the processes of arbor alignment and synapse formation are separate. Statistical connectivity ensures that arbors are prealigned before and independent of synapse formation, allowing synaptic patterning to be preserved when circuits reconfigure after experience. Statistical connectivity also ensures that all neurons of a specific type have a similar set of axons passing by from which they can select to form synapses. Assuming that all neurons of the same type select according to the same preferences, then statistical connectivity ensures that both the distribution of synapses from each type of presynaptic neurons and the set of different inputs received are similar. Any computational principles of synaptic and dendritic integration that have evolved for specific inputs could, therefore, be preserved for each neuron type within a local circuit, across individual animals belonging to the same species, and even across species to the extent that morphologies are preserved. Statistical connectivity predicts that mutations in genes regulating morphologies play a central role in driving the evolution of neuronal circuits and causing circuit malfunctions in disease. Finally, statistical connectivity reveals the importance of intrinsic morphological diversity in forming robust and invariant circuits.
One implication of this work is that, although the specific positions of synapses are random, the diverse morphologies of the different classes of pyramidal and interneurons found in neocortex serve to ensure a robust and invariant set of distributed inputs and outputs between specific pre- and postsynaptic populations of neurons (and therefore, a robust and invariant cortical circuit). Synaptic plasticity may act on top of this foundation to selectively strengthen or weaken multiple recurrent synaptic loops, thereby enabling a diverse range of transient internal states to emerge and a broad variety of cortical computations to be performed within the cortical circuit (63). The ability to generate such dynamic internal states may be a key mechanism by which cortical circuitry dynamically processes spatial and temporal information in the course of performing a multitude of complex tasks (64, 65).
We conclude that the structural connectome formed by arbor appositions of relatively independently grown morphologies can provide a robust and invariant foundation for a dynamic, cell type-specific functional synaptic connectome.
Materials and Methods
Slice Preparation.
All experimental procedures were carried out according to the Swiss federation rules for animal experiments. Wistar rats (12–16 d old) were rapidly decapitated, and neocortical slices (sagittal; 300-μm thick) were cut on a vibratome (Microslicer; DSK) filled with iced extracellular solution (composition below). Optimal slices (two to three per hemisphere), running parallel to apical dendrites of PCs, were selected for recording. Slices were incubated for 30 min at 34 °C and then room temperature (24–25 °C).
Chemicals and Solutions.
Slices were continuously superfused with artificial cerebrospinal fluid containing 125 mM NaCl, 25 mM NaHCO3, 2.5 mM KCl, 1.25 mM NaH2PO4, 2 mM CaCl2, 1 mM MgCl2, and 25 mM d-glucose and bubbled with 95% O2–5% CO2. The intracellular pipette solution contained 110 mM K-gluconate, 10 mM KCl, 4 mM ATP-Mg, 10 mM phosphocreatine, 0.3 mM GTP, 10 mM Hepes, and 13 mM biocytin adjusted to a pH 7.3–7.4 with 5 M KOH. Osmolarity was adjusted to 290–300 mosm with d-mannitol (35 mM). All chemicals were from Sigma-Aldrich or Merck.
Histological Procedures.
After recording, slices were fixed for 12–24 h in cold 100 mM phosphate-buffered solution (PB; pH 7.4) containing 1% paraformaldehyde and 1% glutaraldehyde. Thereafter, the slices were rinsed several times (10 min each) in PB. To block endogenous peroxidases, slices were transferred into phosphate-buffered 3% H2O2 for 30 min. After five to six rinses in PB (10 min each), slices were incubated overnight at 4 °C in avidin-biotinylated HRP according to the manufacturer’s protocol (2% A, 2% B, and 1% Triton-100; ABC-Elite; Vector Labs). After incubation, sections were washed several times in PB and developed under visual control using a bright-field microscope (Zeiss) until all processes of the cells appeared clearly visible (usually after 2–4 min). The reaction was stopped by transferring the sections into cold PB. After washing in the same buffer, slices were kept at 4 °C overnight in the same solution while shaking. To enhance the staining contrast, slices were postfixed for 1 h in 0–5% phosphate-buffered osmium tetroxide (Merck) and counterstained in 1% uranyl acetate. After a rinse in the same buffer, slices were mounted onto glass slides in an aqueous mounting medium.
3D Reconstruction.
3D neuron models were reconstructed from stained cells using the Neurolucida system (MicroBrightField Inc) and a bright-field light microscope (Olympus). After the staining procedure, there is ∼25% shrinkage of the slice thickness and ∼10% anisotropic shrinkage along the x and y axes. Only shrinkage of thickness is immediately accounted and corrected. Shrinkage in the x and y axes is accounted for in the morphological repair (see below).
Putative Synapse Identification.
First pairs of synaptically coupled neurons were identified electrophysiologically through whole-cell patch-clamp experiments. The pairs were then stained and reconstructed as described above. Subsequently, putative synapses were identified by apposition of a bouton [identified as an axonal swelling two times (±10%) the neighboring axonal diameter] and a dendrite in the same by using a 1.25 n.a., ×63 oil immersion lens. An electron microscopically derived error margin of 80% was established previously for L5 pyramidal neurons (26). An estimated 20–25% of the dendritic tree is cut in these slices (neurons, 60–80 μm below surface; average dendritic length, ∼150 μm).
Morphology Selection.
Morphologies were selected to eliminate reconstructions considered to be poor quality, such as those reconstructions with obvious reconstruction errors, including dangling branches (disconnected portions of the arbor), narrow starts (when the fiber starts with an impossible diameter), collinear children, z jumps (errors in specifying the z coordinate), zero diameters (where the reconstructer neglects to define the diameter), diameter jumps (impossible changes in diameter), fat endings (when the end of an arbor is excessively large), flat reconstructions (the reconstructor neglected the z dimension), poor z reconstructions (too much variation in the z dimension), and reconstructions that were unable to be definitively classified.
Morphology Repair.
The reconstructed neurons from slices usually have their somata about 50 μm beneath the slice surface. They, thus, lose part of their morphology. We have devised an algorithm that attempts to recover the original anatomy of the missing part of the neuron. The algorithm preserves the morphological statistics of neuron in the repaired branches by using the intact part of the morphologies to build a statistical model that grows the cut portions. The algorithm has been validated on in vivo-stained and reconstructed neurons by artificially cutting and repairing the cells (66).
In a preparatory corrective and unraveling step, the algorithm corrects for measurement inaccuracies and tissue shrinkage while maintaining the neuron’s morphological structure (branching frequency and angles). Dendrites and axons are then repaired separately. For the dendrites, we compute a dendritic 3D probability from the intact portion of the neuron, which describes the probabilistic behavior of a branch (continuing, terminating, and bifurcating) of a particular order and type at a given distance from the soma. Using these Bayesian spatial distributions, the cut dendrites are regrown point by point. Axon repair is based on anatomical class statistical distributions, which are computed from a pool of the same class of neurons in the database. Subtrees are pasted from the intact parts, and therefore, the regrown part matches the class statistics computed form the intact part.
Morphological Variants.
We obtained representative examples of digitized neurons for a number of neuron classes and created additional examples by varying the length of each neuron section by ±25%. In addition, the branching angles were modified by ±25% of their original values. The result was a set of unique neurons that looked like neurons of the original class. We verified that these variant neurons maintained their original Sholl and branching angle statistics. Thus, statistically, these neurons were identical to the population of digitized neurons with respect to their Sholl statistics of branching angles, segment lengths, overall path length, and general shape.
Computing Match of Innervation Patterns.
The HI was computed using Statistical Learning Toolbox by Dahua Lin (www.matlabcentral.com). A measure of the match between the binned values of two normalized innervation patterns was computed as match = 100 × [1 − mean absolute error (innervation 1, innervation 2)] using Matlab R2010b from Mathworks. To avoid overestimating the match, these statistics were computed only on bins that were nonzero for either innervation pattern. In addition to computing the histogram intersection and the overall match between histograms, a KS test was run on the touch data to test whether the distributions should be considered significantly different.
More details are in SI Materials and Methods.
Supplementary Material
Acknowledgments
The paired recordings were performed in the H.M. laboratory over the past 15 y by its various members: Anirudh Gupta, Gilad Silberberg, Jean-Vincent Le Be, and Thomas Berger. Individual neurons were additionally recorded and stained by Maria Toledo, Olivier Gschwend, Vincent Delattre, Rodrigo Perin, and Shruti Muralidhar. Reconstructions of paired neurons, identification of putative synapses, and derivation synaptic innervation patterns were performed by Y.W. and Y.W. laboratory members Hongwei Zhou and Amey Barakat. 3D anatomical reconstructions of single neurons were performed primarily by Y.W., Wu Chai Zhi, Julie Meystre, Ying Shi, Amey Barakat, and Olivia Simpson, and some individual reconstructions of the neurons that were stained in the H.M. laboratory were performed in the laboratory of Zoltan Kisvarday. The study was conceived and designed as part of the Blue Brain Project’s data-driven and data-constrained approach to modeling the neocortical column as biologically accurate as technically possible and biologically measureable. Software developed in the Blue Brain Project played a key role in the study, which was developed in various parts by a team of software engineers, postdoctorate students, PhD students, and interns. Particular thanks to the work of Konstantinos Sfyrakis on BlueBuilder and the software engineers Jim King and John Kenyon. Thanks to Srikanth Ramaswamy for his contributions to the early stages of this work. Thanks to Shadi Akiki for his contributions to the analysis code. Thanks to Thomas Tränkler for his contributions to the analysis framework. We thank Sebastien Lasserre for the computer renderings of model neurons. Thanks to Idan Segev for extensive discussions and comments on the manuscript. We also thank Richard Walker for his editing help on the final manuscript. This work was funded by a grant to the Blue Brain Project from the EPFL. Computations were, in part, performed on the CADMOS IBM BlueGene/P, and the financial support for CADMOS and the Blue Gene/P system is provided by the Canton of Geneva, Canton of Vaud, Hans Wilsdorf Foundation, Louis-Jeantet Foundation, University of Geneva, University of Lausanne, and Ecole Polytechnique Fédérale de Lausanne.
Footnotes
The authors declare no conflict of interest.
*This Direct Submission article had a prearranged editor.
See Author Summary on page 16772 (volume 109, number 42).
This article contains supporting information online at www.pnas.org/lookup/suppl/doi:10.1073/pnas.1202128109/-/DCSupplemental.
References
- 1.Ragsdale CW, Grove EA. Patterning the mammalian cerebral cortex. Curr Opin Neurobiol. 2001;11:50–58. doi: 10.1016/s0959-4388(00)00173-2. [DOI] [PubMed] [Google Scholar]
- 2.Rubenstein JL, Rakic P. Genetic control of cortical development. Cereb Cortex. 1999;9:521–523. doi: 10.1093/cercor/9.6.521. [DOI] [PubMed] [Google Scholar]
- 3.Benson DL, Colman DR, Huntley GW. Molecules, maps and synapse specificity. Nat Rev Neurosci. 2001;2:899–909. doi: 10.1038/35104078. [DOI] [PubMed] [Google Scholar]
- 4.Polleux F. Genetic mechanisms specifying cortical connectivity: Let’s make some projections together. Neuron. 2005;46:395–400. doi: 10.1016/j.neuron.2005.04.017. [DOI] [PubMed] [Google Scholar]
- 5.Cline HT. Dendritic arbor development and synaptogenesis. Curr Opin Neurobiol. 2001;11:118–126. doi: 10.1016/s0959-4388(00)00182-3. [DOI] [PubMed] [Google Scholar]
- 6.Dickson BJ. Molecular mechanisms of axon guidance. Science. 2002;298:1959–1964. doi: 10.1126/science.1072165. [DOI] [PubMed] [Google Scholar]
- 7.Ruthazer ES, Akerman CJ, Cline HT. Control of axon branch dynamics by correlated activity in vivo. Science. 2003;301:66–70. doi: 10.1126/science.1082545. [DOI] [PubMed] [Google Scholar]
- 8.Shen K, Cowan CW. Guidance molecules in synapse formation and plasticity. Cold Spring Harb Perspect Biol. 2010;2:a001842. doi: 10.1101/cshperspect.a001842. [DOI] [PMC free article] [PubMed] [Google Scholar]
- 9.Ango F, et al. Ankyrin-based subcellular gradient of neurofascin, an immunoglobulin family protein, directs GABAergic innervation at purkinje axon initial segment. Cell. 2004;119:257–272. doi: 10.1016/j.cell.2004.10.004. [DOI] [PubMed] [Google Scholar]
- 10.Betley JN, et al. Stringent specificity in the construction of a GABAergic presynaptic inhibitory circuit. Cell. 2009;139:161–174. doi: 10.1016/j.cell.2009.08.027. [DOI] [PMC free article] [PubMed] [Google Scholar]
- 11.Pecho-Vrieseling E, Sigrist M, Yoshida Y, Jessell TM, Arber S. Specificity of sensory-motor connections encoded by Sema3e-Plxnd1 recognition. Nature. 2009;459:842–846. doi: 10.1038/nature08000. [DOI] [PMC free article] [PubMed] [Google Scholar]
- 12.Yu YC, Bultje RS, Wang X, Shi SH. Specific synapses develop preferentially among sister excitatory neurons in the neocortex. Nature. 2009;458:501–504. doi: 10.1038/nature07722. [DOI] [PMC free article] [PubMed] [Google Scholar]
- 13.Le Bé JV, Markram H. Spontaneous and evoked synaptic rewiring in the neonatal neocortex. Proc Natl Acad Sci USA. 2006;103:13214–13219. doi: 10.1073/pnas.0604691103. [DOI] [PMC free article] [PubMed] [Google Scholar]
- 14.McAllister AK. Cellular and molecular mechanisms of dendrite growth. Cereb Cortex. 2000;10:963–973. doi: 10.1093/cercor/10.10.963. [DOI] [PubMed] [Google Scholar]
- 15.White EL. Specificity of cortical synaptic connectivity: Emphasis on perspectives gained from quantitative electron microscopy. J Neurocytol. 2002;31:195–202. doi: 10.1023/a:1024109606722. [DOI] [PubMed] [Google Scholar]
- 16.DeFelipe J, et al. Neocortical circuits: Evolutionary aspects and specificity versus non-specificity of synaptic connections. Remarks, main conclusions and general comments and discussion. J Neurocytol. 2002;31:387–416. doi: 10.1023/a:1024142513991. [DOI] [PubMed] [Google Scholar]
- 17.Sanes JR, Yamagata M. Many paths to synaptic specificity. Annu Rev Cell Dev Biol. 2009;25:161–195. doi: 10.1146/annurev.cellbio.24.110707.175402. [DOI] [PubMed] [Google Scholar]
- 18.Langley JN. On the origin from the spinal cord of the cervical and upper thoracic sympathetic fibres, with some observation on white and grey rami communications. Philos Trans R Soc Lond B Biol Sci. 1892;183:85–124. [Google Scholar]
- 19.Sperry RW. Chemoaffinity in the orderly growth of nerve fiber patterns and connections. Proc Natl Acad Sci USA. 1963;50:703–710. doi: 10.1073/pnas.50.4.703. [DOI] [PMC free article] [PubMed] [Google Scholar]
- 20.Zipursky SL, Sanes JR. Chemoaffinity revisited: Dscams, protocadherins, and neural circuit assembly. Cell. 2010;143:343–353. doi: 10.1016/j.cell.2010.10.009. [DOI] [PubMed] [Google Scholar]
- 21.Kasai H, Fukuda M, Watanabe S, Hayashi-Takagi A, Noguchi J. Structural dynamics of dendritic spines in memory and cognition. Trends Neurosci. 2010;33:121–129. doi: 10.1016/j.tins.2010.01.001. [DOI] [PubMed] [Google Scholar]
- 22.Braitenberg V, Schüz A. Cortex: Statistics and Geometry of Neuronal Connectivity. 2nd Ed. Berlin: Springer; 1998. [Google Scholar]
- 23.Stepanyants A, Chklovskii DB. Neurogeometry and potential synaptic connectivity. Trends Neurosci. 2005;28:387–394. doi: 10.1016/j.tins.2005.05.006. [DOI] [PubMed] [Google Scholar]
- 24.Wen Q, Stepanyants A, Elston GN, Grosberg AY, Chklovskii DB. Maximization of the connectivity repertoire as a statistical principle governing the shapes of dendritic arbors. Proc Natl Acad Sci USA. 2009;106:12536–12541. doi: 10.1073/pnas.0901530106. [DOI] [PMC free article] [PubMed] [Google Scholar]
- 25.Stepanyants A, Tamás G, Chklovskii DB. Class-specific features of neuronal wiring. Neuron. 2004;43:251–259. doi: 10.1016/j.neuron.2004.06.013. [DOI] [PubMed] [Google Scholar]
- 26.Markram H, Lübke J, Frotscher M, Roth A, Sakmann B. Physiology and anatomy of synaptic connections between thick tufted pyramidal neurones in the developing rat neocortex. J Physiol. 1997;500:409–440. doi: 10.1113/jphysiol.1997.sp022031. [DOI] [PMC free article] [PubMed] [Google Scholar]
- 27.Lübke J, Roth A, Feldmeyer D, Sakmann B. Morphometric analysis of the columnar innervation domain of neurons connecting layer 4 and layer 2/3 of juvenile rat barrel cortex. Cereb Cortex. 2003;13:1051–1063. doi: 10.1093/cercor/13.10.1051. [DOI] [PubMed] [Google Scholar]
- 28.Wang Y, Gupta A, Toledo-Rodriguez M, Wu CZ, Markram H. Anatomical, physiological, molecular and circuit properties of nest basket cells in the developing somatosensory cortex. Cereb Cortex. 2002;12:395–410. doi: 10.1093/cercor/12.4.395. [DOI] [PubMed] [Google Scholar]
- 29.Feldmeyer D, Egger V, Lübke J, Sakmann B. Reliable synaptic connections between pairs of excitatory layer 4 neurones within a single ‘barrel’ of developing rat somatosensory cortex. J Physiol. 1999;521:169–190. doi: 10.1111/j.1469-7793.1999.00169.x. [DOI] [PMC free article] [PubMed] [Google Scholar]
- 30.Feldmeyer D, Lübke J, Silver RA, Sakmann B. Synaptic connections between layer 4 spiny neurone-layer 2/3 pyramidal cell pairs in juvenile rat barrel cortex: Physiology and anatomy of interlaminar signalling within a cortical column. J Physiol. 2002;538:803–822. doi: 10.1113/jphysiol.2001.012959. [DOI] [PMC free article] [PubMed] [Google Scholar]
- 31.Feldmeyer D, Lübke J, Sakmann B. Efficacy and connectivity of intracolumnar pairs of layer 2/3 pyramidal cells in the barrel cortex of juvenile rats. J Physiol. 2006;575:583–602. doi: 10.1113/jphysiol.2006.105106. [DOI] [PMC free article] [PubMed] [Google Scholar]
- 32.Mishchenko Y, et al. Ultrastructural analysis of hippocampal neuropil from the connectomics perspective. Neuron. 2010;67:1009–1020. doi: 10.1016/j.neuron.2010.08.014. [DOI] [PMC free article] [PubMed] [Google Scholar]
- 33.Buhl EH, et al. Effect, number and location of synapses made by single pyramidal cells onto aspiny interneurones of cat visual cortex. J Physiol. 1997;500:689–713. doi: 10.1113/jphysiol.1997.sp022053. [DOI] [PMC free article] [PubMed] [Google Scholar]
- 34.Somogyi P, Tamás G, Lujan R, Buhl EH. Salient features of synaptic organisation in the cerebral cortex. Brain Res Brain Res Rev. 1998;26:113–135. doi: 10.1016/s0165-0173(97)00061-1. [DOI] [PubMed] [Google Scholar]
- 35.Kozloski J, et al. Identifying, tabulating, and analyzing contacts between branched neuron morphologies. IBM J Res Develop. 2008;52:43–55. [Google Scholar]
- 36.Cajal Ry. Sur la structure de l'écorce cérébrale de quelques mammifères. La Cellule. 1891;7:125–176. [Google Scholar]
- 37.Lorente de Nó R. Studies on the structure of the cerebral cortex. J Psychol Neurol. 1933;45:381–438. [Google Scholar]
- 38.Szentágothai J, Arbib MA. Conceptual models of neural organization. Neurosci Res Program Bull. 1974;12:305–510. [PubMed] [Google Scholar]
- 39.Somogyi P. An interneurone making synapses specifically on the axon initial segment of pyramidal cells in the cerebral cortex of the cat. J Physiol. 1979;296:18P–19P. [PubMed] [Google Scholar]
- 40.Douglas RJ, Martin KA. A functional microcircuit for cat visual cortex. J Physiol. 1991;440:735–769. doi: 10.1113/jphysiol.1991.sp018733. [DOI] [PMC free article] [PubMed] [Google Scholar]
- 41.DeFelipe J, Fariñas I. The pyramidal neuron of the cerebral cortex: Morphological and chemical characteristics of the synaptic inputs. Prog Neurobiol. 1992;39:563–607. doi: 10.1016/0301-0082(92)90015-7. [DOI] [PubMed] [Google Scholar]
- 42.Ahmed B, Anderson JC, Douglas RJ, Martin KA, Nelson JC. Polyneuronal innervation of spiny stellate neurons in cat visual cortex. J Comp Neurol. 1994;341:39–49. doi: 10.1002/cne.903410105. [DOI] [PubMed] [Google Scholar]
- 43.Tessier-Lavigne M, Goodman CS. The molecular biology of axon guidance. Science. 1996;274:1123–1133. doi: 10.1126/science.274.5290.1123. [DOI] [PubMed] [Google Scholar]
- 44.Freund TF, Buzsáki G. Interneurons of the hippocampus. Hippocampus. 1996;6:347–470. doi: 10.1002/(SICI)1098-1063(1996)6:4<347::AID-HIPO1>3.0.CO;2-I. [DOI] [PubMed] [Google Scholar]
- 45.Markram H. A network of tufted layer 5 pyramidal neurons. Cereb Cortex. 1997;7:523–533. doi: 10.1093/cercor/7.6.523. [DOI] [PubMed] [Google Scholar]
- 46.Thomson AM, Deuchars J. Synaptic interactions in neocortical local circuits: Dual intracellular recordings in vitro. Cereb Cortex. 1997;7:510–522. doi: 10.1093/cercor/7.6.510. [DOI] [PubMed] [Google Scholar]
- 47.DeFelipe J. Types of neurons, synaptic connections and chemical characteristics of cells immunoreactive for calbindin-D28K, parvalbumin and calretinin in the neocortex. J Chem Neuroanat. 1997;14:1–19. doi: 10.1016/s0891-0618(97)10013-8. [DOI] [PubMed] [Google Scholar]
- 48.Dantzker JL, Callaway EM. Laminar sources of synaptic input to cortical inhibitory interneurons and pyramidal neurons. Nat Neurosci. 2000;3:701–707. doi: 10.1038/76656. [DOI] [PubMed] [Google Scholar]
- 49.Gupta A, Wang Y, Markram H. Organizing principles for a diversity of GABAergic interneurons and synapses in the neocortex. Science. 2000;287:273–278. doi: 10.1126/science.287.5451.273. [DOI] [PubMed] [Google Scholar]
- 50.Kozloski J, Hamzei-Sichani F, Yuste R. Stereotyped position of local synaptic targets in neocortex. Science. 2001;293:868–872. doi: 10.1126/science.293.5531.868. [DOI] [PubMed] [Google Scholar]
- 51.Thomson AM, West DC, Wang Y, Bannister AP. Synaptic connections and small circuits involving excitatory and inhibitory neurons in layers 2-5 of adult rat and cat neocortex: Triple intracellular recordings and biocytin labelling in vitro. Cereb Cortex. 2002;12:936–953. doi: 10.1093/cercor/12.9.936. [DOI] [PubMed] [Google Scholar]
- 52.Nelson S. Cortical microcircuits: Diverse or canonical? Neuron. 2002;36:19–27. doi: 10.1016/s0896-6273(02)00944-3. [DOI] [PubMed] [Google Scholar]
- 53.Silberberg G, Gupta A, Markram H. Stereotypy in neocortical microcircuits. Trends Neurosci. 2002;25:227–230. doi: 10.1016/s0166-2236(02)02151-3. [DOI] [PubMed] [Google Scholar]
- 54.Markram H, et al. Interneurons of the neocortical inhibitory system. Nat Rev Neurosci. 2004;5:793–807. doi: 10.1038/nrn1519. [DOI] [PubMed] [Google Scholar]
- 55.Wang Y, et al. Anatomical, physiological and molecular properties of Martinotti cells in the somatosensory cortex of the juvenile rat. J Physiol. 2004;561:65–90. doi: 10.1113/jphysiol.2004.073353. [DOI] [PMC free article] [PubMed] [Google Scholar]
- 56.Thomson AM, Lamy C. Functional maps of neocortical local circuitry. Front Neurosci. 2007;1:19–42. doi: 10.3389/neuro.01.1.1.002.2007. [DOI] [PMC free article] [PubMed] [Google Scholar]
- 57.Shepherd GM, Stepanyants A, Bureau I, Chklovskii D, Svoboda K. Geometric and functional organization of cortical circuits. Nat Neurosci. 2005;8:782–790. doi: 10.1038/nn1447. [DOI] [PubMed] [Google Scholar]
- 58.Peters A, Palay SL, Webster HD. The Fine Structure of the Nervous System: Neurons and Their Supporting Cells. 3rd Ed. New York: Oxford Univ Press; 1991. [Google Scholar]
- 59.DeFelipe J. Cortical interneurons: From Cajal to 2001. Prog Brain Res. 2002;136:215–238. doi: 10.1016/s0079-6123(02)36019-9. [DOI] [PubMed] [Google Scholar]
- 60.Stepanyants A, Hof PR, Chklovskii DB. Geometry and structural plasticity of synaptic connectivity. Neuron. 2002;34:275–288. doi: 10.1016/s0896-6273(02)00652-9. [DOI] [PubMed] [Google Scholar]
- 61.Molyneaux BJ, Arlotta P, Menezes JR, Macklis JD. Neuronal subtype specification in the cerebral cortex. Nat Rev Neurosci. 2007;8:427–437. doi: 10.1038/nrn2151. [DOI] [PubMed] [Google Scholar]
- 62.Calabrese B, Wilson MS, Halpain S. Development and regulation of dendritic spine synapses. Physiology (Bethesda) 2006;21:38–47. doi: 10.1152/physiol.00042.2005. [DOI] [PubMed] [Google Scholar]
- 63.Maass W, Natschläger T, Markram H. Real-time computing without stable states: A new framework for neural computation based on perturbations. Neural Comput. 2002;14:2531–2560. doi: 10.1162/089976602760407955. [DOI] [PubMed] [Google Scholar]
- 64.Buonomano DV, Maass W. State-dependent computations: Spatiotemporal processing in cortical networks. Nat Rev Neurosci. 2009;10:113–125. doi: 10.1038/nrn2558. [DOI] [PubMed] [Google Scholar]
- 65.Buonomano DV, Merzenich MM. Temporal information transformed into a spatial code by a neural network with realistic properties. Science. 1995;267:1028–1030. doi: 10.1126/science.7863330. [DOI] [PubMed] [Google Scholar]
- 66.Anwar H, Riachi I, Hill S, Schürmann F, Markram H. Computational Neuroscience: Realistic Modeling for Experimentalists. 2nd Ed. Boston, MA: MIT Press; 2009. Capturing neuron morphological diversity. [Google Scholar]
