

Abstract
Simultaneous tracking of many thousands of individual particles in live cells is possible now with the advent of high-density superresolution imaging methods. We present an approach to extract local biophysical properties of cell-particle interaction from such newly acquired large collection of data. Because classical methods do not keep the spatial localization of individual trajectories, it is not possible to access localized biophysical parameters. In contrast, by combining the high-density superresolution imaging data with the present analysis, we determine the local properties of protein dynamics. We specifically focus on AMPA receptor (AMPAR) trafficking and estimate the strength of their molecular interaction at the subdiffraction level in hippocampal dendrites. These interactions correspond to attracting potential wells of large size, showing that the high density of AMPARs is generated by physical interactions with an ensemble of cooperative membrane surface binding sites, rather than molecular crowding or aggregation, which is the case for the membrane viral glycoprotein VSVG. We further show that AMPARs can either be pushed in or out of dendritic spines. Finally, we characterize the recurrent step of influenza trajectories. To conclude, the present analysis allows the identification of the molecular organization responsible for the heterogeneities of random trajectories in cells.
Keywords: stochastic analysis of trajectories, dendritic spines and synapses, single particle tracking, confined diffusion
Regulation of cellular physiological processes such as synaptic transmission, signal transduction relies on molecular interactions (binding and unbinding) at specific places and involves trafficking in confined local microdomains. The efficiency of these regulations crucially depends on the underlying molecular spatial organization, the study of which remains a daunting hurdle in cellular biology. Interestingly, superresolution light optical microscopy techniques for in vivo data (1–3) have allowed monitoring a large number of molecular trajectories at the single molecule level and at nanometer resolution, that can potentially reveal unique cellular organizational features. In the recent years, various techniques based on empirical characterization have emerged to track receptors (4), and estimating the mean square displacement (MSD) along isolated trajectories allowed to differentiate between free and confined diffusion (5, 6). In addition, although a large effort was dedicated to developing single molecule tracking algorithms (5, 7, 8), a general method for the analysis of the massive collection of data and for the extraction of quantitative local information is still lacking.
In this article, we derive from the classical stochastic description at a molecular level, a method to extract biophysical features from high throughput superresolution data, associated with AMPA receptor (AMPAR) trafficking on neuronal cells. Indeed, neurons are organized in local microdomains characterized by morphological and functional specificities. Prominent microdomains include dendritic spines and synapses, which play a major role in neuronal communication. Because AMPARs are key components in mediating transmission at excitatory glutamatergic synapses, we focus here on their local behavior. It has been demonstrated that AMPARs are not fixed on the cellular membrane, but can relocate between synaptic and extrasynaptic sites due to lateral diffusion (9) on the membrane surface (6, 10), which can drastically affect the postsynaptic current dynamics. However, the properties of receptor mobility in intact tissue still remain elusive, mainly due to the lack of specific tools. In addition, as the diffusion constant is an inherent property of diffusing objects, accounting for the shape and the viscosity of the membrane, a change in the apparent diffusion constant is in fact the consequence of local changes in the organization of the membrane and/or its molecular composition. We shall determine the local biophysical properties, such as diffusion coefficient, but also the organization of receptor-membrane interactions. We found that AMPAR interacting domains form nanometric areas generated by potential wells. In addition, we show that AMPARs are not only diffusing, but can either be directed towards or away from dendritic spines.
Finally, to illustrate the applicability of this method to other heterogenous subcellular systems, we present two additional examples: In the first one, we demonstrate that the regions of high density revealed by single particle tracking photoactivation localization microscopy (sptPALM) data from the viral glycoprotein tsO45 (VSVG-Eos) are generated by aggregation, but not interacting potential wells, contrary to the case of AMPARs. In the second example, we detect from the recurrent part of in vivo influenza trajectories the presence of live interactions. All these examples illustrate the feasibility and robustness of the present analysis to identify the heterogeneity of molecular organization at a subcellular level.
Results
Extracting Biophysical Parameters from Multiples AMPAR Trajectories.
The 30,000 AMPAR glutamate receptor subunit 1 of AMPA receptor (GluA1) trajectories moving on the neuronal dendrite surface, obtained from sptPALM images of single AMPARs labeled with monomeric Eos fluorescent protein-2 (mEos2), show areas of high density (Fig. 1A), which can either be due to confinement associated with molecular crowding (11–13) or to molecules forming local aggregates (1), or direct physical interactions within binding sites. All diffusion phenomena are governed by forces, including geometric effects and random collisions; it is one of the goals of the present study to tell them apart. In order to identify synapses, cells are cotransfected with the synaptic molecular marker Homer cerulean (Fig. 1B). As expected, we observe a close correlation between synaptic labeling and higher steady-state density (red hot spots) of receptors (Fig. 1C).
Fig. 1.

Stochastic analysis of superresolution trajectories for AMPARs. (A) 30,000 trajectories of GluA1-containing AMPARs located on the surface membrane, three regions of interest are marked. (B) The overlay of the highest receptor densities (red) with the hippocampal confocal neuronal image reveals that these regions colocalize with the synaptic marker Homer (white spots). (C) Map of diffusion coefficient (extracted from [Eq. 3]). (D) Median diffusion coefficients in dendritic spines (sampled over 3,341 points) and in the dendritic shaft (9,385 points). Davg is the average diffusion coefficient. (E) Three disjoint interacting potentials (obtained from [Eq. 2]) marked in (A)–(C). (F) Field of forces in the neuronal membrane. (G) Three potential well patterns, characterized by a converging force, (extracted from E) quantified using the index S, confirming that the wells are due to direct interactions.
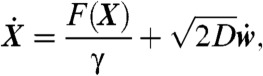
To analyze receptor dynamics, the nature of the trajectories, and the biophysical organization of the membrane responsible for the high density of receptors, we describe the diffusional motion of objects on the membrane by the overdamped Langevin (Smoluchowski) equation on the surface (14, 15)
 |
[1] |
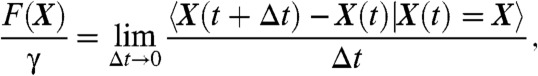
where γ is the friction coefficient, D is the diffusion coefficient in the surface, F(X) is the force applied to the particle at position X, and w(t) is Brownian motion on the surface. When the molecular interaction is generated by a steady state electrostatic potential U (which can be a sum of Coulomb and/or Lennard-Jones potentials), the force is given by the classical expression F = -Ze∇U, where e is the electronic charge and Z is the valence. By using the ensemble of recorded AMPAR trajectories, it becomes now possible to invert Eq. 1 and extract the local field of forces and the effective diffusion coefficient. Indeed, changes in the diffusion coefficient are due to the membrane heterogeneity and fluctuations in the density of obstacles. The exact reconstruction of the field of forces and the diffusion coefficient is given by the classical formulas (15)
 |
[2] |
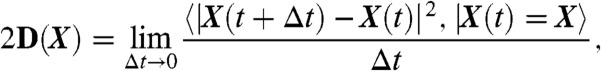
where  represents the average over the trajectories passing through point X at time t. The inversion procedure requires combining several independent trajectories passing through each point of the neuronal surface (See SI Appendix), which could not have been extracted from classical single particle tracking methods, but requires precisely the massive data generated by the sptPALM method (2) on biological samples. Similarly, from this procedure, the membrane diffusion coefficient at each point is given by
 |
[3] |
which characterizes the local diffusion properties (SI Appendix) and reveals the density of obstacles (SI Appendix). This analysis could neither be achieved by using the MSD computed along single trajectories as it provides only nonlocal properties, but not the underlying physical dynamics nor the associated neuronal molecular organization. Using the trajectories of Fig. 1, we found that the average diffusion coefficient in dendritic spines is Dspine = 0.049 ± 0.0012 μm2/s(SD.), while for the dendrite shaft it is Dshaft = 0.13 ± 0.01 μm2/s(SD.) (Fig. 1D), in agreement with previous independent estimates (16). However, we can now interpret this difference, which accounts for an increase of the membrane crowding from 50% to 70% (SI Appendix). This local density, increased in dendritic spines compared to the main neuronal shaft, can be due to microtubules, actin filaments, and local microdomains [fences and pickets (12, 13)]. Finally, we observed a large difference in the average diffusion coefficient from cell to cell (SI Appendix) from 0.03 to 0.2 μm2/s.
To further characterize the high density areas of receptors, we tested whether these areas could be due to a direct molecular interaction between the receptor and an interacting partner. The interaction is described by a field of force F(X) = -∇U(X) and a classical signature of such interaction is a potential well described by a pattern of vector field showing arrows converging to a single point, the bottom of the well. Interestingly, we could identify various local wells (Fig. 1E), confirmed by a multiscale analysis (SI Appendix). We further rated the likelihood of a potential well by a normalized index S∈[0,1] (0 characterizing a potential well, while 1 is for a pure Brownian motion) to differentiate them from undetectable reflecting objects floating randomly on the membrane and we obtain a clear distinction (SI Appendix). In addition, the recorded trajectories may be only lower-dimensional projections of a higher-dimensional stochastic system. To confirm our result, we use that the potential well signature (converging decreasing arrows) at an attractor can be detected in any two-dimensional plane of projection. As can be seen from the microscopy images, the detected potential wells were not associated with a local change in the membrane geometry, confirming that the wells are due to molecular interactions and not induced by geometrical effects. In addition, many of these wells exactly colocalize with the synaptic regions identified by the molecular marker (Homer protein), suggesting that the wells materialize the interaction of the receptor with specific synaptic molecules (Fig. 1F).
Each well can be further characterized (Fig. 1G) by its size (extension of the interaction) and its depth (15), that measures the residence time of a molecular interaction. To estimate the well depth, we used an optimal fit and an analysis at various resolutions (SI Appendix). We first approximate the potential well by a linear field and we found a mean size of 204 ± 64 nm (SD.) (for an average of five wells in SI Appendix) and a depth of 0.41 ± 0.17 μm2/s(SD.). This large potential width suggests that rather than being generated by a single molecule, these wells are due to a cooperative ensemble of binding molecules.
Robustness of the Potential Wells.
To check the robustness of the potential well across time, we use three time-lapse experiments performed at 5 min intervals. As described previously, the acquisition for each experiment took less than a minute. The density map (Fig. 2A) shows a region of high density and we confirm by following a single potential well, present initially (Fig. 2B) that it persists over time. We conclude using time-lapse imaging that the potential wells were very stable over the 10 min observation time, although the size was slightly reduced. Indeed the area of the three potential wells is 0.05 μm2, 0.03 μm2 (after 5 min), and 0.015 μm2 (after 10 min), while the local diffusion coefficients at the well are equal to 0.076 μm2/s [respectively (resp.) 0.080 μm2/s, resp. 0.070 μm2/s].
Fig. 2.

Time lapse image of potential wells. (A) Density map on a logarithmic scale (right scale bar: log N, where N is the number of points per pixel) of the number of AMPARs acquired during one min, starting at time t = 0, t = 15 min ,…, t = 60 min. (B) Velocity fields in the boxed area show that the potential well (converging arrows) is conserved through time, with small fluctuation in size and energy. (Scale bar, 500 nm).
To further characterize the potential wells that should be associated with a form of molecular/cellular regulation, we investigate AMPAR where the C terminus of stargazin was deleted (stargazin Delta C). Stargazin is a transmembrane family protein, known to be a fundamental interacting partner with the main scaffolding molecule PSD-95 (17, 18). Using our general methodology, we plotted the density of receptors in Fig. 3A, which revealed only two hotspots (Fig. 3 B and C). The analysis additionally revealed that the average diffusion coefficient is 0.64 μm2/s, much faster than in the non-perturbed case [where the average diffusion coefficient Davg = 0.14 μm2/s (n = 5)] (The diffusion map is given in Fig. 3D).
Fig. 3.

Effect of stargazin Delta C on AMPAR dynamics. (A) Density map of AMPARs on neurons expressing a stargazin Delta C construct. (B) Magnification of the only region of high density. (C) Trajectories near the high density region. (D) Map of the diffusion coefficient [in a log scale log(D/Davg)]. Davg = 0.64 μm2/s. (E) Only two potential wells are present in the dataset. (Scale bars, 500 nm).
Interestingly, we could only detect two potential wells, located outside synapses (Fig. 3 A and B), compared to dozens we found in the cases (Fig. 1) for the same analyzed area dendrite, confirming that stargazin Delta C mutant modifies strongly AMPAR dynamics, not only by increasing its diffusion properties but mostly, by removing its interaction at the postsynaptic density (PSD). In addition, although the sizes of the two potentials denoted 1 (resp. 2) are characterized by the length a = 330 nm, b = 500 nm (elliptic axis) (resp. a = 360 nm, b = 420 nm), comparable to the classical wells we previously described (see SI Appendix), their depth (which measures the interaction energy) was largely decreased: The depth for the first well is A = 1.97 μm2/s leading to an activation energy E1 = 3.1 kT and for the second well it is A = 1.5 μm2/s associated to an energy E2 = 2.3 kT (Fig. 3E). This small interacting energy suggests that this remaining interaction is mediated by a direct association between AMPAR and scaffolding protein of the MAGUK family or through another AMPAR-associated protein such as TARP.
We conclude that most of the AMPAR potential wells result from a direct interaction involving stargazin C terminus, known to mediate a fundamental interaction with PSD-95, a fundamental scaffolding molecule. The remaining wells show that AMPARs can still interact through other protein domains with molecules located outside the PSD but with small interacting energies.
Residence Time of a Single AMPAR in a Well.
Another relevant quantity is the residence time of an AMPAR in a specific neuronal region. Because single trajectory is usually much shorter than the residence time of a receptor in confined domains such as a dendritic spine, a synapse or in a potential well, it is in general not possible to measure directly this time. However, using the characteristics of reconstructed potential wells extracted with the present method, we can now encompass the restriction of short trajectories and compute directly the residence time as follows: We use a generic parabolic function to fit the depth and the width of five potential wells and solve the classical mean residence time equation (15) (SI Appendix).
We found that the residence time of a single AMPAR in a potential well varies from 0.37 s to 135 s (SI Appendix). However, the typical residence time is of the order of minutes, much longer, as reported in SI Appendix, than the time for a pure Brownian particle with the same diffusion constant to cross a region of similar area. Furthermore, by comparing potential wells, we found that although they have similar sizes with an average radius of 320 ± 100 nm (SD.), two groups clearly emerged: The first group was associated with an interaction energy less than 6 kT, while for the other one, the energy was larger than 8 kT, leading to drastically different mean residence times (see SI Appendix). These variations might indicate a heterogenous distribution and nature of binding partners at the potential wells.
To conclude, we were able to detect a direct signature of AMPAR (GluA1) interaction, generated by potential wells over long time scales (minutes). Furthermore, we identified that the areas of high receptor density are generated by molecular interactions with an ensemble of molecules and not restricted by molecular crowding or aggregation (small score). Although these potential wells cannot be due to a single AMPA-interacting molecule, they are rather probably generated by an ensemble of coordinated partners, which should be further investigated. Furthermore, these interacting microdomains coincide with the PSD, and might be due to the interaction of receptors with postsynaptic scaffolding proteins, which are essential for the tethering to specific cell domains of receptors and other transmembrane proteins associated with receptor complexes [such as TARPs and other AMPA associated proteins (9, 19)]. Using the present method, we also found that the GluA2 subunit interacts with specific potential wells, however, although they share similar size with GluA1 potentials, they were not systematically localized at synapses, suggesting that they can interact with extrasynaptic structures (see SI Appendix).
Receptor dynamics, which were previously observed to switch between confined and free epochs (6), can now be understood as the dynamics of a Brownian receptor falling into distinct potential wells forming nanodomains. These structures reflect the complex heterogeneous membrane organization.
Extraction of the Drift Reveals Two Families of Dendritic Spines.
We decided to take advantage of our analysis to explore the dynamics of AMPARs in dendritic spines. Due to their small size, spines are very difficult to study and are usually a quasibarrier for receptor trafficking with the dendritic shaft. Using the velocity map extracted from AMPAR trajectories (Fig. 4A), we observed that there were two types of spines, whether the net direction of the drift is inward (Type I) or outward (Type II). In Type I, the drift goes from the head to the dendritic shaft, while for Type II, the drift goes from the dendrite to the spine head (Fig. 4B). Interestingly, in this second type, we further found a strong attracting potential in the head. On an ensemble of 31 examined spines, we found that 19 are of Type I and 12 of Type II (Fig. 4C). However, we did not find any specific pattern in the distribution of these spines along the dendrite. We further confirm that the spine types could change over time, while remaining stable for several minutes (SI Appendix).
Fig. 4.

Classification of dendritic spines. (A) Examples of the velocity field in dendritic spines of Type I and II. Spines are indicated (red contour) with drift directions (colored arrows). (B) Schematic representation of the velocity fields in Type I and II spines. (C) Distribution of dendritic spines of Type I (arrowheads) and II (arrows)(scale bar, 5 μm). (D) Surface covered by Type I and II spines. (E) Diffusion coefficient. (F) Drift amplitude in the neck (19 spines of Type I, 12 spines of Type II).
In order to further characterize Type I from Type II spines, we quantified the area covered by AMPAR trajectories (SI Appendix). We found that in Type I, the covered area was 0.43 ± 0.22 μm2 (n = 19 spines) compared to 0.73 ± 0.31 μm2 (n = 12) in Type II (Fig. 4D). However, the local diffusion coefficient of AMPAR in all spines (Fig. 4E) and the drift intensity (Fig. 4F) are very similar: we found v = 0.47 μm/s (resp. 0.48 μm/s) and D = 0.067 ± 0.051 μm2/s (resp. D = 0.051 ± 0.038 μm2/s) for Type I (resp. Type II).
Analysis of the Heterogeneous Protein Distribution in Cell Membrane and the Recurrent Stage of Influenza Viral Trajectories.
To further test the applicability of our method, we used the collection of sptPALM data from the viral glycoprotein tsO45 (VSVG-Eos), a temperature-sensitive mutant of the vesicular stomatitis virus G protein. VSVG is trafficked to the plasma membrane, where fluorescence recovery after photobleaching indicated a population undergoing free diffusion (20). In sptPALM, spatial maps of localized molecules, as well as the single molecule trajectories, reveal an heterogeneous distribution (Fig. 5 A and B, SI Appendix (1). To unravel the possible mechanisms leading to areas of high density of trajectories (Fig. 5B), we applied our localized extraction method developed above.
Fig. 5.

Analysis of superresolution trajectories of vesicular stomatitis virus G (VSVG) proteins. (A) Four samples of sptPALM trajectories (n = 30,000) of VSVG proteins. (B) Density map of the VSVG proteins containing high density areas. (C) Diffusion coefficient maps (computed from [3]). Low diffusion regions are colocalized with high protein density (red squares). (D) Field of forces in the four squares. No potential wells can be detected (the average index S is very high Savg = 0.81), showing that proteins do not interact at potential wells. (Scale bars, 200 nm).
We extracted the diffusion coefficient using our method on regions of high and low densities (Fig. 5 B and C, SI Appendix) and found that the 5% regions of higher density corresponds to an average diffusion coefficient D = 0.04 μm2/s. Comparatively, for the 95% of regions of lower density we found D = 0.08 μm2/s. Interestingly, using the MSD on individual trajectories, we found that the diffusion coefficient in low-density (resp. high-density) regions is approximately 0.06 ± 0.04 μm2/s (resp. 0.04 ± 0.02 μm2/s). The difference between MSD and our method might be due to long trajectories relocating from regions of low-density to crowded regions.
The inhomogeneous distribution in Fig. 5 A and B could be due to random concentration fluctuations or to the topology of the membrane, unevenly sampled under total internal reflection illumination; alternatively, it could indicate the presence of unexpected interactions modifying the protein distribution. However, in agreement with the organization of this protein (1), we could not extract any potential wells responsible for the regions of high density of VSVG (Fig. 5D). This result confirms that VSVG is primarily freely diffusing and shows that the distribution of heterogeneities is not generated by any molecular long range interaction.
Finally, we present another application of our method to trajectories of influenza virus in MDCK cells. Viral trajectories present also unclassified parts, characterized by a recurrent motion in a confined microdomain. We extracted from these unclassified parts (SI Appendix) potential wells of size 200 nm.
Discussion
Cell function requires the maintenance of highly separated heterogeneous spatial molecular structures, that can exchange molecules by trafficking. To characterize the organization underlying in vivo cellular trafficking, we presented a method that can extract the local biophysical features from the high throughput data generated by single molecule based superresolution microscopy. This methodology relies on a large ensemble of single trajectories and we report here that high receptor densities of AMPARs at synapses are generated by extended interacting potentials that are stable over time, with small fluctuations in size. The origin of these wells should be further investigated. On the contrary, applied to a completely different system, the present method shows that the high density for the VSVG protein concentration is not due to any localized potential well, but presumably originates from protein-protein aggregation or density fluctuations which could arise from very short-ranged interactions, membrane fluctuations/topology or long range correlated time random noise. We conclude that a region of high density of trajectories can result from different physical sequestrations that can be deciphered from the present analysis.
Analysis of High-Density Single Particle Data Reveals Heterogeneity in AMPAR Receptor Retention on Neuronal Membrane.
The method allowed us to identify direct molecular interactions of AMPARs with specific subcompartments on the neuronal membrane. These interactions are organized in discrete potential wells of large size of about 300 nm, suggesting that these potential wells cannot be generated by a single interacting molecule such as a scaffolding molecule, but are rather generated on the surface of a neuron by an ensemble of coordinated molecules, which should be further investigated. Because the potential wells were colocalized with the distribution of the Homer proteins (Fig. 1C) enriched at the synapse, the interacting microdomains could coincide with the PSD, and might be due to a cooperative mechanism involving post synaptic scaffolding proteins, vital for anchoring of receptors and other transmembrane proteins associated with receptor complexes (CaMKII) (19). However, for the other GluA2 subunit, we found that the interacting domains were not located in dendritic spines (SI Appendix), suggesting different binding partners and molecular organization. Finally, the large size of the wells could also reflect that AMPARs interact with scaffolding molecules through their C terminus, which projects a polymer tail that can influence and restrict trafficking (21, 22).
Free Surface AMPARs in Spine are Controlled by a Deterministic Drift at the Spine Neck.
Dendritic spines are key microdomains regulating diffusion and intracellular flux of receptors (23–26). Recently using sptPALM, a pioneer study (27) revealed that the actin flow in dendritic spines shows clearly heterogeneity in its dynamics and distribution. In particular, by following the actin flow, the authors could differentiate regions of slow and fast velocity. Frost et al. (27) reported a direct actin flow in the spine neck that may have correlation with the spines of Type I and II that we have found here. In addition, it might be instructive to correlate the present study with ref. 27 to investigate whether our potential wells further occurred at high or low actin vector field.
Using fluorescence recovery after photobleaching-fluorescence loss in photobleaching experiments, nearly all fraction of mobile receptors is exchanged between spines in less than six minutes (25), consistent with recent theoretical approaches linking the diffusion time course to the spine geometry (28, 29) of the order of minutes for a typical mushroom type spine. In contrast to previous studies, we detected here a deterministic inward or outward drift in spine necks (Fig. 4). It is however unclear what is the origin of such a drift in the organization or morphology of dendritic spines. The geometrical effect of curvature should be excluded, as we do not expect a negative curvature for the inward drift. Other possibilities involve possible direct transport or an asymmetrical effective transport. Indeed, AMPAR might be recruited to dendritic spines through a dynamin-dependent membrane drift (25, 30). Interestingly, the inward drift was associated to a potential well in the spine head. This result suggests that dendritic spines can be in one of the two different states (Type I or II), but it is not clear whether a spine can switch between these states over time. Finally, we predict that the residence time in each type of spine will be very different because the presence of a stable potential well can drastically retain a receptor.
To conclude, combining single particle trajectories of high throughput data generated by superresolution microscopy allowed us to detect unique organized pattern that reflect molecular interactions or assembly involved in regulating protein trafficking. Extending the present analysis in the future could open up the identification of more collective molecular patterns involved in the regulation of physiological function at a nanometric level.
Materials and Methods
AMPAR Data: Cell Culture and Transfection.
Preparation of cultured neurons for single particle tracking has been done as previously described (31). Hippocampal neurons from 18 d old rat embryos were cultured on glass coverslips following the Banker protocol. Neurons were transfected using Effectene at DIV 9-11 with HA-mEos2-GluA1 and Homer Cerulean and experiments were carried out 7 to 12 d after transfection.
sptPALM.
Cells were imaged at 37 °C in an open chamber (Ludin Chamber, Life Imaging Services) mounted on an inverted motorized microscope (Nikon Ti) equipped with a 100x1.45NA plan-apochromat objective and a perfect focus system, allowing long acquisition in total internal reflection mode. The imaging was performed on an extracellular solution (32). For photoactivation localization microscopy, cells expressing Eos Fluorescent Protein tagged constructs were photoactivated using a 405 nm laser (Omicron) and the resulting photoconverted single molecule fluorescence was excited with a 561 nm laser (Cobolt). Both lasers illuminated the sample simultaneously. The lasers power was adjusted to keep the number of the stochastically activated molecules constant and well separated during the acquisition. The fluorescence was collected by the combination of a dichroic and emission filter (D101-R561 and F39-617 respectively, Chroma). The fluorescence was collected using a sensitive EMCCD (Evolve, Photometric). The acquisition was steered by Metamorph software (Molecular Devices) in streaming mode at 50 frames per second (20 ms exposure time) using a 256 × 256 pixels region of interest. The native fluorescence from the nonactivated EOS molecules was excited using a conventional GFP filter cube (ET470/40, T495LPXR, ET525/50, Chroma). Homer Cerulean fluorescent protein was observed using a CFP filter (ET436/20, T455LP, ET480/40, Chroma).
Single Molecule Segmentation and Tracking.
A typical single cell sptPALM experiment, acquired with the microscope setup and protocol described above, leads to a set of 20,000 images that further need to be analyzed in order to extract molecule localization and dynamics. Single molecule fluorescent spots are localized in each image frame and tracked over time using a combination of wavelet segmentation and simulated annealing algorithms (33, 34). Under the experimental conditions described above, the pointing accuracy of the whole system was quantified in the range of 25 nm, leading to an image resolution of 50 nm. The accuracy of localization, which depends on the image signal to noise ratio (35, 36), was determined experimentally using fixed samples labeled with EOS-FP. We analyzed few tens of 2D distributions of single molecule positions belonging to long trajectories (more than 30 frames) by Gaussian fitting, the resolution being determined as 2.3σxy. The software package used to derive quantitative data on protein localization and dynamics is custom software written as a plug-in running inside Metamorph platform. Trajectory consists in an average of six consecutive points. The majority of the single molecules we observed by PALM are at the surface (see SI Appendix about uPAINT) and this result was obtained by cleaving the extracellular EOS fused to GluA1 by a protease from live cells.
Supplementary Material
ACKNOWLEDGMENTS.
A.H. thanks Christopher Wolff for his technical assistance.
Footnotes
The authors declare no conflict of interest.
*This Direct Submission article had a prearranged editor.
This article contains supporting information online at www.pnas.org/lookup/suppl/doi:10.1073/pnas.1204589109/-/DCSupplemental.
References
- 1.Manley S, et al. High-density mapping of single molecule trajectories with photoactivated localization microscopy. Nat Methods. 2008;5:155–157. doi: 10.1038/nmeth.1176. [DOI] [PubMed] [Google Scholar]
- 2.Giannone G, et al. Dynamic superresolution imaging of endogenous proteins on living cells at ultra-high density. Biophys J. 2010;99:1303–1310. doi: 10.1016/j.bpj.2010.06.005. [DOI] [PMC free article] [PubMed] [Google Scholar]
- 3.Huang B, Babcock H, Zhuang X. Breaking the diffraction barrier: Super-resolution imaging of cells. Cell. 2010;143:1047–1058. doi: 10.1016/j.cell.2010.12.002. [DOI] [PMC free article] [PubMed] [Google Scholar]
- 4.Groc L, et al. Surface trafficking of neurotransmitter receptor: Comparison between single-molecule/quantum dot strategies. J Neurosci. 2007;27:12433–12437. doi: 10.1523/JNEUROSCI.3349-07.2007. [DOI] [PMC free article] [PubMed] [Google Scholar]
- 5.Sergé A, Bertaux N, Rigneault H, Marguet D. Dynamic multiple-target tracing to probe spatiotemporal cartography of cell membranes. Nat Methods. 2008;5:687–694. doi: 10.1038/nmeth.1233. [DOI] [PubMed] [Google Scholar]
- 6.Choquet D, Triller A. The role of receptor diffusion in the organization of the postsynaptic membrane. Nat Rev Neurosci. 2003;4:251–265. doi: 10.1038/nrn1077. [DOI] [PubMed] [Google Scholar]
- 7.Saxton MJ. Single-particle tracking: Connecting the dots. Nat Methods. 2008;5:671–672. doi: 10.1038/nmeth0808-671. [DOI] [PubMed] [Google Scholar]
- 8.Jaqaman K, et al. Robust single-particle tracking in live-cell time-lapse sequences. Nat Methods. 2008;5:695–702. doi: 10.1038/nmeth.1237. [DOI] [PMC free article] [PubMed] [Google Scholar]
- 9.Bredt DS, Nicoll RA. AMPA receptor trafficking at excitatory synapses. Neuron. 2003;40:361–379. doi: 10.1016/s0896-6273(03)00640-8. [DOI] [PubMed] [Google Scholar]
- 10.Borgdorff AJ, Choquet D. Regulation of AMPA receptor lateral movements. Nature. 2002;417:649–653. doi: 10.1038/nature00780. [DOI] [PubMed] [Google Scholar]
- 11.Edidin M, Kuo SC, Sheetz MP. Lateral movements of membrane glycoproteins restricted by dynamic cytoplasmic barriers. Science. 1991;254:1379–1382. doi: 10.1126/science.1835798. [DOI] [PubMed] [Google Scholar]
- 12.Saxton MJ, Jacobson K. Single-particle tracking: Applications to membrane dynamics. Annu Rev Biophys Biomol Struct. 1997;26:373–399. doi: 10.1146/annurev.biophys.26.1.373. [DOI] [PubMed] [Google Scholar]
- 13.Kusumi A, et al. Paradigm shift of the plasma membrane concept from the two-dimensional continuum fluid to the partitioned fluid: High-speed single-molecule tracking of membrane molecules. Annu Rev Biophys Biomol Struct. 2005;34:351–378. doi: 10.1146/annurev.biophys.34.040204.144637. [DOI] [PubMed] [Google Scholar]
- 14.Langevin P. Sur la théorie du mouvement brownien. C R Acad Sci Paris. 1908;146:530–532. [Google Scholar]
- 15.Schuss Z. Theory and Applications of Stochastic Processes: An Analytical Approach. 1st Ed. Vol. 102. New York: Springer; 2009. pp. 39–44. [Google Scholar]
- 16.Choquet D. Fast AMPAR trafficking for a high-frequency synaptic transmission. Eur J Neurosci. 2010;32:250–260. doi: 10.1111/j.1460-9568.2010.07350.x. [DOI] [PubMed] [Google Scholar]
- 17.Chen L, et al. Stargazin regulates synaptic targeting of AMPA receptors by two distinct mechanisms. Nature. 2000;408:936–943. doi: 10.1038/35050030. [DOI] [PubMed] [Google Scholar]
- 18.Schnell E, et al. Direct interactions between PSD-95 and stargazin control synaptic AMPA receptor number. Proc Natl Acad Sci USA. 2002;99:13902–13907. doi: 10.1073/pnas.172511199. [DOI] [PMC free article] [PubMed] [Google Scholar]
- 19.Kim E, Sheng M. PDZ domain proteins of synapses. Nat Rev Neurosci. 2004;5:771–781. doi: 10.1038/nrn1517. [DOI] [PubMed] [Google Scholar]
- 20.Kenworthy AK, et al. Dynamics of putative raft-associated proteins at the cell surface. J Cell Biol. 2004;165:735–746. doi: 10.1083/jcb.200312170. [DOI] [PMC free article] [PubMed] [Google Scholar]
- 21.Tomita S, et al. Stargazin modulates AMPA receptor gating and trafficking by distinct domains. Nature. 2005;23:1052–1058. doi: 10.1038/nature03624. [DOI] [PubMed] [Google Scholar]
- 22.Opazo P, et al. CaMKII triggers the diffusional trapping of surface AMPARs through phosphorylation of stargazin. Neuron. 2010;67:239–252. doi: 10.1016/j.neuron.2010.06.007. [DOI] [PubMed] [Google Scholar]
- 23.Newpher TM, Ehlers MD. Spine microdomains for postsynaptic signaling and plasticity. Trends Cell Biol. 2009;19:218–227. doi: 10.1016/j.tcb.2009.02.004. [DOI] [PubMed] [Google Scholar]
- 24.Holcman D, Triller A. Modeling synaptic dynamics and receptor trafficking. Biophys J. 2006;91:2405–2415. doi: 10.1529/biophysj.106.081935. [DOI] [PMC free article] [PubMed] [Google Scholar]
- 25.Jaskolski F, Mayo-Martin B, Jane D, Henley JM. Dynamin-dependent membrane drift recruits AMPA receptors to dendritic spines. J Biol Chem. 2009;284:12491–12503. doi: 10.1074/jbc.M808401200. [DOI] [PMC free article] [PubMed] [Google Scholar]
- 26.Triller A, Choquet D. Synaptic structure and diffusion dynamics of synaptic receptors. Biol Cell. 2003;95:465–476. doi: 10.1016/j.biolcel.2003.07.001. [DOI] [PubMed] [Google Scholar]
- 27.Frost NA, Shroff H, Kong H, Betzig E, Blanpied TA. Single-molecule discrimination of discrete perisynaptic and distributed sites of actin filament assembly within dendritic spines. Neuron. 2010;67:86–99. doi: 10.1016/j.neuron.2010.05.026. [DOI] [PMC free article] [PubMed] [Google Scholar]
- 28.Biess A, Korkotian E, Holcman D. Diffusion in a dendritic spine, the role of geometry. Phys Rev E. 2007;76:0219222. doi: 10.1103/PhysRevE.76.021922. [DOI] [PubMed] [Google Scholar]
- 29.Holcman D, Schuss Z. Diffusion laws in dendritic spines. J Math Neurosci. 2011;1:10. doi: 10.1186/2190-8567-1-10. [DOI] [PMC free article] [PubMed] [Google Scholar]
- 30.Ashby MC, Maier SR, Nishimune A, Henley JM. Lateral diffusion drives constitutive exchange of AMPA receptors at dendritic spines and is regulated by spine morphology. J Neurosci. 2006;26:7046–7055. doi: 10.1523/JNEUROSCI.1235-06.2006. [DOI] [PMC free article] [PubMed] [Google Scholar]
- 31.Heine M, et al. Surface mobility of postsynaptic AMPARs tunes synaptic transmission. Science. 2008;320:201–205. doi: 10.1126/science.1152089. [DOI] [PMC free article] [PubMed] [Google Scholar]
- 32.Petrini EM, et al. Endocytosis and recycling maintain a mobile pool of surface AMPA receptors at synapses required for synaptic potentiation. Neuron. 2009;63:92–105. doi: 10.1016/j.neuron.2009.05.025. [DOI] [PMC free article] [PubMed] [Google Scholar]
- 33.Racine V, et al. Visualization and quantification of vesicle trafficking on a three-dimensional cytoskeleton network in living cells. J Microsc. 2007;225:214–228. doi: 10.1111/j.1365-2818.2007.01723.x. [DOI] [PubMed] [Google Scholar]
- 34.Izeddin I, et al. Wavelet analysis for single molecule localization microscopy. Opt Express. 2012;20:2081–2095. doi: 10.1364/OE.20.002081. [DOI] [PubMed] [Google Scholar]
- 35.Kubitscheck U, Kückmann O, Kues T, Peters R. Imaging and tracking of single GFP molecules in solution. Biophys J. 2000;78:2170–2179. doi: 10.1016/S0006-3495(00)76764-6. [DOI] [PMC free article] [PubMed] [Google Scholar]
- 36.Cheezum MK, Walker WF, Guilford WH. Quantitative comparison of algorithms for tracking single fluorescent particles. Biophys J. 2001;81:2378–2388. doi: 10.1016/S0006-3495(01)75884-5. [DOI] [PMC free article] [PubMed] [Google Scholar]
Associated Data
This section collects any data citations, data availability statements, or supplementary materials included in this article.