Abstract
WT lactose permease of Escherichia coli (LacY) reconstituted into proteoliposomes loaded with a pH-sensitive fluorophore exhibits robust uphill H+ translocation coupled with downhill lactose transport. However, galactoside binding by mutants defective in lactose-induced H+ translocation is not accompanied by release of an H+ on the interior of the proteoliposomes. Because the pKa value for galactoside binding is ∼10.5, protonation of LacY likely precedes sugar binding at physiological pH. Consistently, purified WT LacY, as well as the mutants, binds substrate at pH 7.5–8.5 in detergent, but no change in ambient pH is observed, demonstrating directly that LacY already is protonated when sugar binds. However, a kinetic isotope effect (KIE) on the rate of binding is observed, indicating that deuterium substitution for protium affects an H+ transfer reaction within LacY that is associated with sugar binding. At neutral pH or pD, both the rate of sugar dissociation (koff) and the forward rate (kon) are slower in D2O than in H2O (KIE is ∼2), and, as a result, no change in affinity (Kd) is observed. Alkaline conditions enhance the effect of D2O on koff, the KIE increases to 3.6–4.0, and affinity for sugar increases compared with H2O. In contrast, LacY mutants that exhibit pH-independent high-affinity binding up to pH 11.0 (e.g., Glu325 → Gln) exhibit the same KIE (1.5–1.8) at neutral or alkaline pH (pD). Proton inventory studies exhibit a linear relationship between koff and D2O concentration at neutral and alkaline pH, indicating that internal transfer of a single H+ is involved in the KIE.
Keywords: deuterium isotope effect, membrane transporters, pH fluorophores, stopped-flow, substrate binding
The lactose permease of Escherichia coli (LacY) is arguably the most extensively studied membrane transport protein, with several available crystal structures (1–4), mutagenesis of each residue (5), and a wealth of biochemical/spectroscopic data regarding the conformational changes resulting in alternating access, as well as the symport mechanism (reviewed in refs. 6 and 7). LacY is a member of the major facilitator superfamily (8, 9) and catalyzes the coupled stoichiometric translocation of a galactoside and an H+ (galactoside/H+ symport) across the bacterial cytoplasmic membrane, thereby transducing free energy stored in an H+ electrochemical gradient (∆μ̃∼H+) into a sugar-concentration gradient. Because transport is obligatorily coupled, downhill transport of galactoside also drives uphill transport of H+ with generation of ∆μ̃∼H+, the polarity of which is dictated by the direction of the sugar-concentration gradient. The highly dynamic nature of LacY (reviewed in ref. 7) is consistent with an alternating access mechanism involving a global conformational change in which sugar- and H+-binding sites are alternatively exposed to either side of the membrane (reviewed in ref. 10).
In the kinetic model of transport proposed originally (11) and supported by subsequent findings (reviewed in refs. 7 and 12), protonation is required for sugar binding to LacY. Galactoside-binding affinity decreases as pH is increased, with pKa ∼10.5, indicating that LacY is protonated over the physiological pH range (13, 14). Pre–steady-state kinetic studies reveal that decreased affinity at alkaline pH is caused by a dramatic increase in the rate of sugar dissociation (koff), whereas the forward rate (kon) is independent of pH. Moreover, mutational analyses demonstrate that the residues located in the H+-binding site define the pKa for sugar binding and alter galactoside-binding affinity (14). The amino acyl side chains involved in H+ binding/translocation (1–3) form a tightly interconnected H-bond/salt bridge cluster (Arg302, His322, Tyr236, and Asp240) in the middle of the molecule with Glu325 and Lys319 within 5 Å on opposite sides of the cluster (Fig. S1). Mutations in the core of the H+-binding site decrease sugar affinity (14) and may cause uncoordinated opening and closing of the cavities in LacY (15). In contrast, replacing Glu325 (e.g., with an uncharged side chain) blocks H+ escape from the central core, and high-affinity galactoside binding is maintained up to pH 11.0. The findings suggest that the alkaline pKa observed for sugar binding is not related to a single amino acyl side chain but appears to be associated with a network of residues that include coordinated water molecule(s) (14, 15).
Proton-coupled transporters use different mechanisms of substrate and H+ binding/release during transport. For example, Schuldiner and coworkers (16–19) have shown elegantly that binding of either substrate or H+ to the homodimeric multidrug antiporter EmrE involves two carboxyl residues (Glu14), one from each monomer. The binding site can be occupied either by one molecule of substrate or by two H+, but not by both simultaneously. Therefore, deprotonation is required for substrate binding, and release of substrate is required for protonation. Unlike EmrE, binding of both an H+ and a galactoside as cosubstrates is required for sugar/H+ symport by LacY.
In this paper, we investigate the relationship between protonation of LacY and sugar binding with pH-sensitive fluorescence probes to define the order of galactoside and H+ binding directly. Purified WT LacY and mutants defective in H+ translocation across the membrane either solubilized in N-dodecyl-β-d-maltoside(DDM) or reconstituted into proteoliposomes were tested for H+ binding/release as a result of galactoside binding. We show here that no H+ binding is detected when sugar is added to purified LacY in detergent, indicating that protonation precedes substrate binding. However, D2O slows the rate of sugar binding, and the effect of D2O on the kinetics of sugar binding in combination with H+ inventory studies reveals that an internal H+ transfer reaction is involved in sugar binding.
Results
Sugar-Induced H+ Influx into Proteoliposomes.
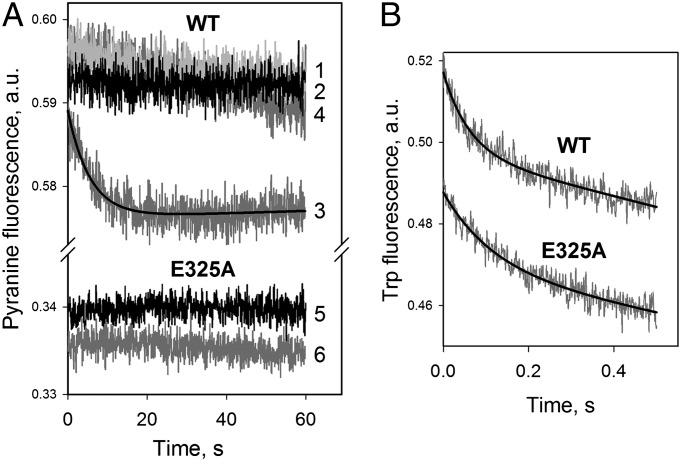
The pH-sensitive fluorophore 8-hydroxypyrene-trisulfonate (pyranine) was used to test uphill H+ translocation induced by downhill transport of lactose (Fig. S2). Proteoliposomes containing WT LacY and loaded with pyranine exhibit no change in fluorescence after mixing with sucrose or buffer alone (Fig. 1A, traces 1 and 2, respectively). However, addition of lactose generates a decrease in fluorescence (trace 3), indicating acidification of the interior of the proteoliposomes, and equilibrium is reached within 20 s (t1/2 is ∼3 s with 12 mM lactose). The same proteoliposomes pretreated with N-ethylmaleimide, which blocks sugar binding and transport by alkylating Cys148 (20), do not exhibit any change in fluorescence after mixing with substrate (trace 4). Moreover, proteoliposomes reconstituted with mutant E325A, which does not catalyze lactose/H+ symport (21–26), exhibit no acidification whatsoever after mixing with lactose (traces 5 and 6). Binding of galactoside with the same proteoliposomes, as measured by Trp151→4-nitrophenyl-α-d-galactopyranoside (NPG) FRET (27), is rapid, with similar rates for WT and E325A LacY (Fig. 1B). Therefore, substrate appears to bind to LacY that already is protonated, because no detectable H+ binding or release is observed in proteoliposomes when overall symport does not occur.
Fig. 1.
Influx of H+ into proteoliposomes by symport with lactose. Stopped-flow traces were recorded after mixing proteoliposomes with a given sugar. (A) WT LacY (four upper traces) or E325A mutant (two lower traces) was reconstituted in proteoliposomes, loaded with 0.6 mM pyranine, and mixed with sucrose (trace 1), lactose (traces 3, 4, and 6), or buffer only (traces 2 and 5). To block sugar binding, proteoliposomes with WT LacY were preincubated with 10 mM N-ethylmaleimide for 10 min before mixing with lactose (trace 4). The sugar concentration after mixing was 12 mM, and the final protein concentration was ∼0.5 μM in 5 mM KPi/100 mM KCl (pH 7.5) with 1 μM valinomycin. The excitation wavelength for pyranine was 450 nm, and emitted light was collected with a long-pass filter at 475 nm. (B) Direct detection of sugar binding to WT LacY and E325A mutant by Trp151→NPG FRET. Stopped-flow traces of the decrease in Trp fluorescence were recorded after mixing proteoliposomes with NPG (100 μM, final concentration). Buffer content and proteoliposomes (without pyranine) are the same as in A. The excitation wavelength was 295 nm, and emitted light was collected with a long-pass filter at 320 nm. Single-exponential fits are shown as black lines with estimated rates of 16.3 ± 0.6 s−1 and 8.6 ± 0.5 s−1 for WT LacY and mutant E325A, respectively.
Substrate Binds to Protonated LacY.
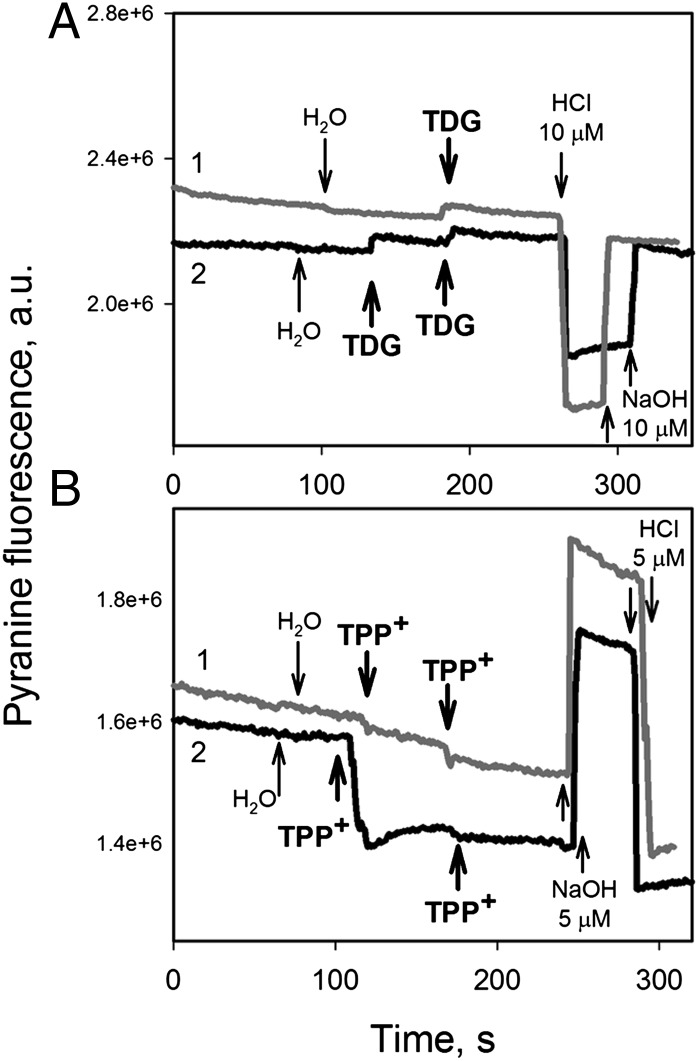
Addition of a saturating concentration of β-d-galactopyranosyl-1-thio-β-d-galactopyranoside (TDG) to purified LacY in unbuffered DDM solution containing pyranine does not elicit any change in pH, which would be expected if a stoichiometric amount of H+ were bound or released (Fig. 2A). In contrast, with the antiporter EmrE as a positive control (16, 17) under identical conditions, release of ∼0.7 mol of H+ per mol of EmrE monomer is observed upon the addition of tetraphenylphosphonium (TPP+) (Fig. 2B, black trace), as shown previously by Schuldiner and coworkers (16–19). Furthermore, shifting the pH to a more alkaline region also does not result in a change in fluorescence upon the addition of TDG to WT LacY (Fig. S3A), as monitored with 5-(and 6-) carboxynaphthofluorescein (CNF), which has higher pKa than pyranine (Fig. S2). However, under the same conditions, sugar binding is detected readily by Trp151→NPG FRET (Fig. S3B).
Fig. 2.
Changes in pH induced by substrate binding to LacY or EmrE in detergent. Fluorescence of pyranine (40 nM) was recorded continuously at excitation and emission wavelengths of 450 and 510 nm, respectively, in unbuffered solution containing a given protein (black traces, 2) or solution with no protein (gray traces, 1). Additions are indicated by arrows. (A) Changes in pyranine fluorescence after the addition of TDG (5 mM) to 100 mM NaCl/0.02% DDM without protein (gray trace) or containing 10 μM LacY (black trace). The starting point corresponds to pH 7.4. Additions of 10 μM HCl or NaOH were made to quantify the shift in fluorescence intensity caused by the change in H+ concentration. (B) Changes in pyranine fluorescence after the addition of 40 μM TPP+ to 100 mM NaCl/0.08% DDM solution without protein (gray trace), or with 4 μM EmrE (60 μg/mL) (black trace). The starting point corresponds to pH 7.2. Additions of 5 μM HCl or NaOH were made to quantify the shift in fluorescence intensity caused by the change in H+ concentration. Estimated proton release triggered by TPP+ binding is 0.7 mol/mol of EmrE monomer.
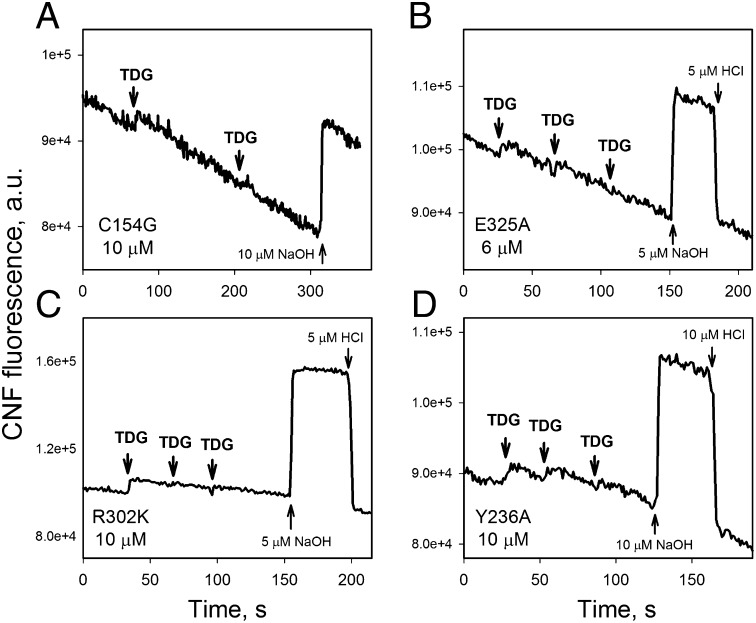
Testing different LacY mutants at pH 8.3 with CNF as the pH probe also shows no change in pH upon TDG binding (Fig. 3). Notably, each mutant binds galactosides under these conditions, although they exhibit different pKas for sugar-binding affinity (Fig. S4) (14). The C154G mutant has the same pKa (∼10.5) as WT LacY, whereas mutants R302K and Y236A display pKas of 8.0–8.4, and E325A exhibits high sugar-binding affinity that is independent of pH up to pH 11. Clearly, therefore, with neither WT LacY nor any of the mutants tested does binding of galactoside elicit any change in ambient pH.
Fig. 3.
Effect of substrate binding to LacY mutants on pH in solution detected by CNF fluorescence. Fluorescence of CNF (1 μM) was recorded continuously at excitation and emission wavelengths of 600 and 665 nm, respectively, in unbuffered solution (100 mM NaCl/0.02% DDM) containing protein. The starting pH was 8.1–8.3. Additions of TDG (5 mM), NaOH, and HCl are indicated by arrows. Protein concentrations were 10 μM C154G (A), 6 μM E325A (B), 10 μM R302K (C), and 10 μM Y236A (D). All proteins bind galactosides well, as determined by Trp151→NPG FRET (Fig. S4 E–H).
Deuterium Kinetic Isotope Effects.
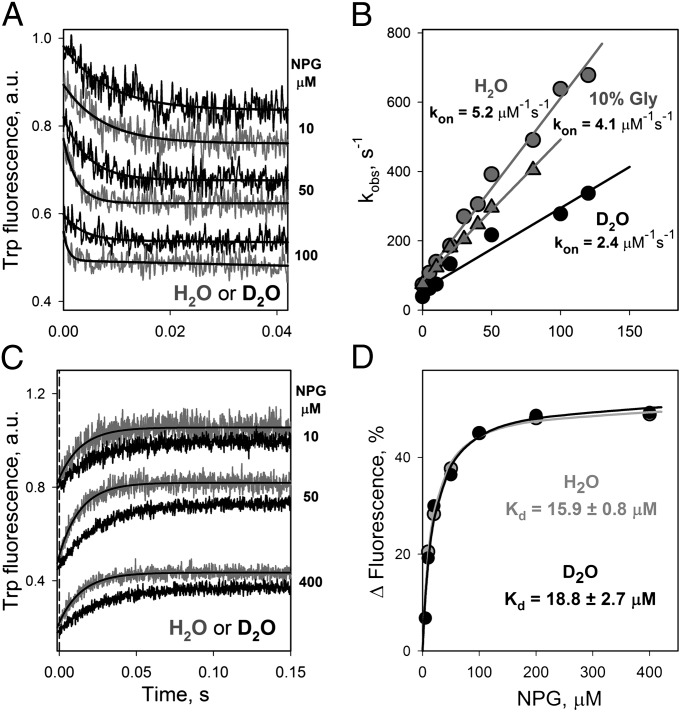
Rates of sugar binding to C154G LacY were measured in H2O or D2O at a pH (pD) of 7.0 (Fig. 4). Binding rates (kobs) measured directly by Trp151→NPG FRET depend linearly on NPG concentration and are distinctly slower when D2O is substituted for H2O (Fig. 4 A and B). The finding is not caused by an effect of viscosity on sugar binding, because 10% glycerol, which increases viscosity more than 98% D2O (28), does not change the binding rate significantly (Fig. 4B). In addition, prolonged preincubation of NPG in D2O does not change the binding kinetics (Fig. S5), thus excluding an effect of sugar deuteration on binding rates. koff measured by displacement of bound NPG with an excess of TDG also is significantly slower in D2O than in water (Fig. 4C). However, Kd values are the same in H2O and D2O (Fig. 4D). Therefore, D2O affects both kon and koff equally. Estimated from direct binding, kon values are 5.2 ± 0.1 and 2.4 ± 0.1 μM s−1 in H2O and D2O, respectively (Fig. 4B). The koff values calculated from displacement experiments (Fig. 4C) are 70.3 ± 1.4 and 39.7 ± 1.2 s−1 in H2O and D2O, respectively. Thus, the deuterium kinetic isotope effects (KIE) calculated from these data are ∼2 at neutral pH (pD) for C154G LacY.
Fig. 4.
Effect of D2O on sugar binding to LacY. Pre–steady-state kinetics of NPG binding to C154G LacY was measured by stopped flow as Trp151→NPG FRET with excitation at 295 nm using an emission long-pass filter at 320 nm. The final protein concentration was 0.5 μM. The buffer (25 mM NaPi/100 mM NaCl/0.02% DDM) was prepared in H2O, 10% glycerol, or D2O with pH (pD) adjusted to 7.0 (pD = pH + 0.4). (A) Stopped-flow traces recorded after mixing of protein with NPG at the given final concentrations in H2O (gray traces) or D2O (black traces). Single-exponential fits are shown as solid black lines. (B) Dependence of rates measured as shown in A in H2O (gray circles), 10% glycerol (gray triangles), or D2O (black circles) on NPG concentration. The kon values estimated from linear fits are 5.2 ± 0.1, 4.1 ± 0.1, and 2.4 ± 0.1 μM s−1 in H2O, 10% glycerol, and D2O, respectively. (C) Stopped-flow traces recorded after mixing 15 mM TDG (final concentration) and LacY preincubated with NPG at given concentrations in H2O (gray traces) or D2O (black traces). Single-exponential fits are shown as solid black lines. The estimated koff values are 70.3 ± 1.4 and 39.7 ± 1.2 s−1 in H2O and D2O, respectively. The vertical dashed line indicates dead-time of the instrument (1.5 ms). (D) NPG-binding affinity in H2O or D2O determined from the concentration dependence of the fluorescence change estimated from single-exponential fits as shown in C. The relative change in fluorescence at each NPG concentration is calculated as the percentage of the final fluorescence level after displacement of NPG by an excess of TDG. Data obtained in H2O and D2O are presented as gray and back symbols, respectively. Kd values estimated from hyperbolic fits are 15.9 ± 0.8 and 18.8 ± 2.7 μM in H2O and D2O, respectively.
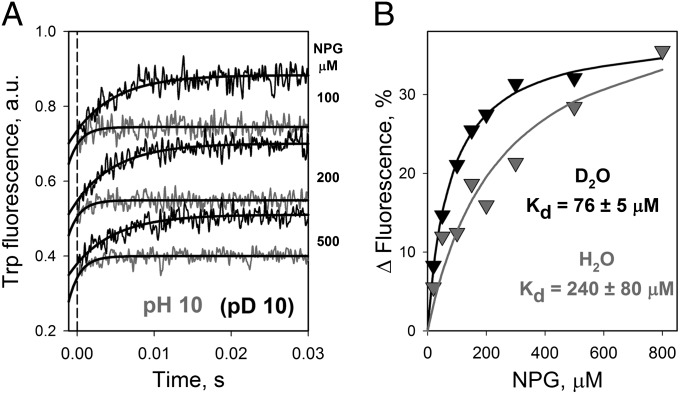
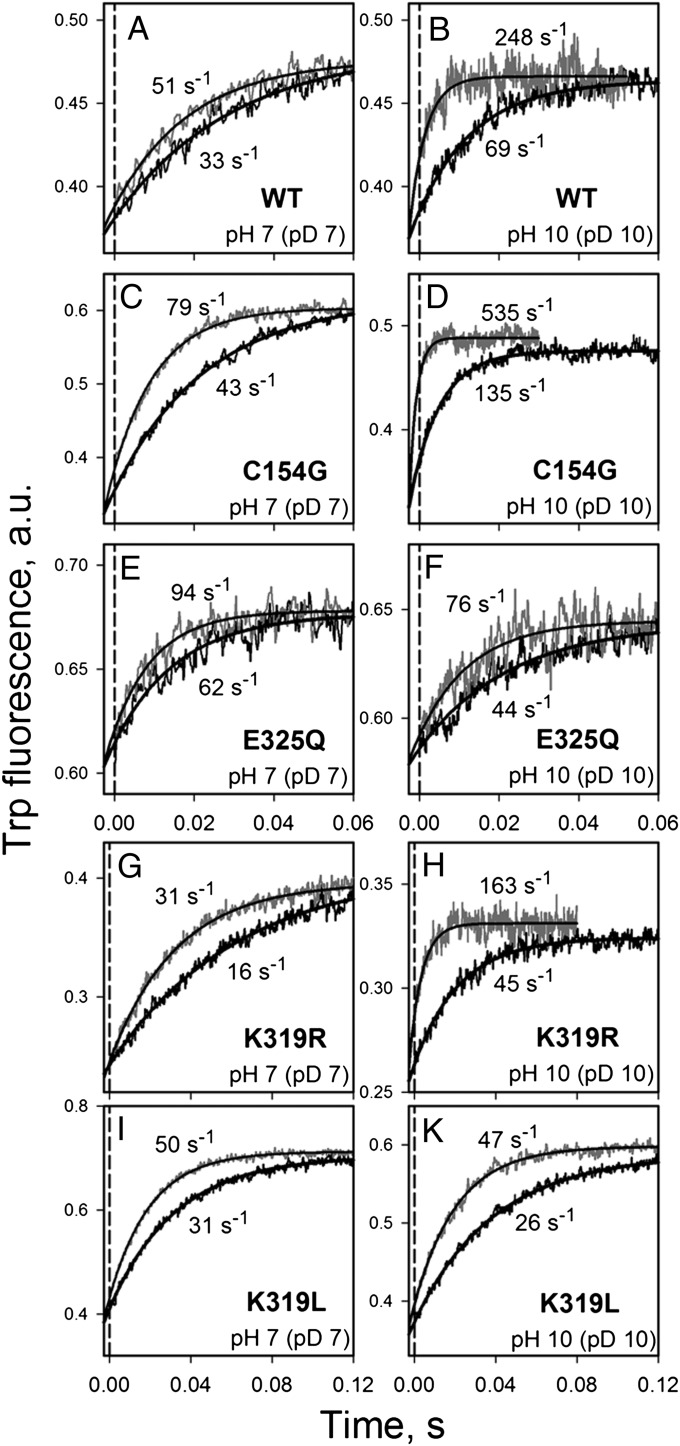
The pKa of ∼10.5 for sugar-binding affinity measured for LacY results from a dramatic increase of koff at alkaline pH, whereas kon is independent of pH (13, 14). Therefore, displacement rates and NPG-binding affinities were measured in H2O and D2O at a pH (pD) of 10 (Fig. 5). Stopped-flow rates of NPG displacement by TDG (koff) measured in H2O are significantly faster at pH 10 than at neutral pH (compare gray traces in Figs. 4C and 5A). An effect of D2O on koff is observed at both pH values but is much more pronounced in alkaline conditions, where koff decreases by a factor of 3.6–4.0 (Figs. 4C, 5A, and 6 C and D and Table 1). The Kd for NPG is determined from the amplitude of the stopped-flow traces at different NPG concentrations (Fig. 5B). Sugar-binding affinity decreases greatly in aqueous solution at pH 10, (the Kd increases from 16 μM at pH 7 to 240 μM at pH 10). Remarkably, the decrease in affinity (i.e., increase in Kd) is significantly smaller when measured in D2O at pD 10 (Kd = 76 μM). The effect of D2O on the pH dependence of koff described for C154G LacY also is observed for WT LacY (Fig. 6 A and B). The KIE calculated from rates of NPG displacement (koff) increases from 1.5 at pH (pD) 7.0 to 3.6 at pH (pD) 10.0 (Table 1).
Fig. 5.
Effect of D2O on sugar binding to LacY at pH 10.0. Pre–steady-state kinetics of NPG displacement was determined for C154G LacY by stopped-flow measurements of Trp151→NPG FRET at an excitation wavelength of 295 nm with an emission long-pass filter of 320 nm. The final protein concentration was 0.5 μM in 25 mM CAPS/100 mM NaCl/0.02% DDM at a pH (pD) of 10.0 (pD = pH + 0.4). (A) Stopped-flow traces recorded after mixing of 15 mM TDG (final concentration) and protein preincubated with NPG at given concentrations in H2O (gray traces) or D2O (black traces). Single-exponential fits are shown as solid black lines. The estimated koff values are 680 ± 101 and 188 ± 28 s−1 in H2O or D2O, respectively. The dashed broken line indicates dead time of the instrument (1.2 ms). (B) NPG-binding affinity in H2O or D2O is determined from the dependence of the fluorescence changes on NPG concentration as described in Fig. 4D. The relative change in fluorescence at each NPG concentration was calculated as a percentage of the final fluorescence level after displacement of NPG by an excess of TDG. Data obtained in H2O and D2O are presented as gray and black triangles, respectively. Kd values estimated from hyperbolic fits are 240 ± 80 and 76 ± 5 μM in H2O and D2O, respectively.
Fig. 6.
Effect of D2O on the NPG dissociation rate (koff) at neutral or alkaline pH (pD). Rates of displacement of bound NPG by an excess of TDG were determined by measuring Trp151→NPG FRET at excitation and emission wavelengths of 295 and 330 nm, respectively. Stopped-flow rates were measured in H2O (gray traces) and D2O (black traces). Final concentrations were 1 μM protein, 100 μM NPG, and 6 mM TDG. The buffers (25 mM NaPi or CAPS with 100 mM NaCl/0.02% DDM) were prepared in H2O or D2O with pH (pD) adjusted to 7.0 or 10.0 (pD = pH + 0.4). The vertical dashed line indicates dead-time of the instrument (2.7 ms). The rates estimated from single-exponential fits are given. Data are shown for WT LacY (A and B) and mutants C154G (C and D), E325Q (E and F), K319R (G and H), and K319L (I and K). Panels on the left show traces recorded at pH (pD) 7.0, and panels on the right show traces for pH (pD) 10. The estimated KIE for each protein is shown in Table 1.
Table 1.
Effect of pH on KIEs for WT LacY and mutants
| LacY (pKa) | pH or pD | koff H2O/koff D2O (s−1) | KIE koff ratio H2O/ D2O |
| WT (10.5) | 7 | 51/33 | 1.5 |
| 10 | 248/69 | 3.6 | |
| C154G (10.5) | 7 | 79/43 | 1.8 |
| 10 | 535/135 | 4.0 | |
| K319R (10.5) | 7 | 31/16 | 1.9 |
| 10 | 163/45 | 3.6 | |
| K319L (no) | 7 | 50/31 | 1.6 |
| 10 | 47/26 | 1.8 | |
| E325Q (no) | 7 | 94/62 | 1.5 |
| 10 | 76/44 | 1.7 |
A KIE also is observed with three LacY mutants that have significantly different pKas for sugar-binding affinity. Mutants E325Q and K319L bind sugar with high affinity up to pH 11.0, whereas K319R binds sugar in a manner similar to WT LacY with pKa ∼10.5 (14). All the mutants exhibit KIEs at neutral pH similar to WT LacY, with values ranging from 1.5–2.0 (Fig. 6, Left and Table 1). Notably, at pH 10.0 the KIE for mutants E325Q and K319L remains independent of pH (pD) (Fig. 6, Right and Table 1), whereas the KIE for mutant C154G and K319R (4.0 and 3.6, respectively) is very similar to that obtained for WT LacY.
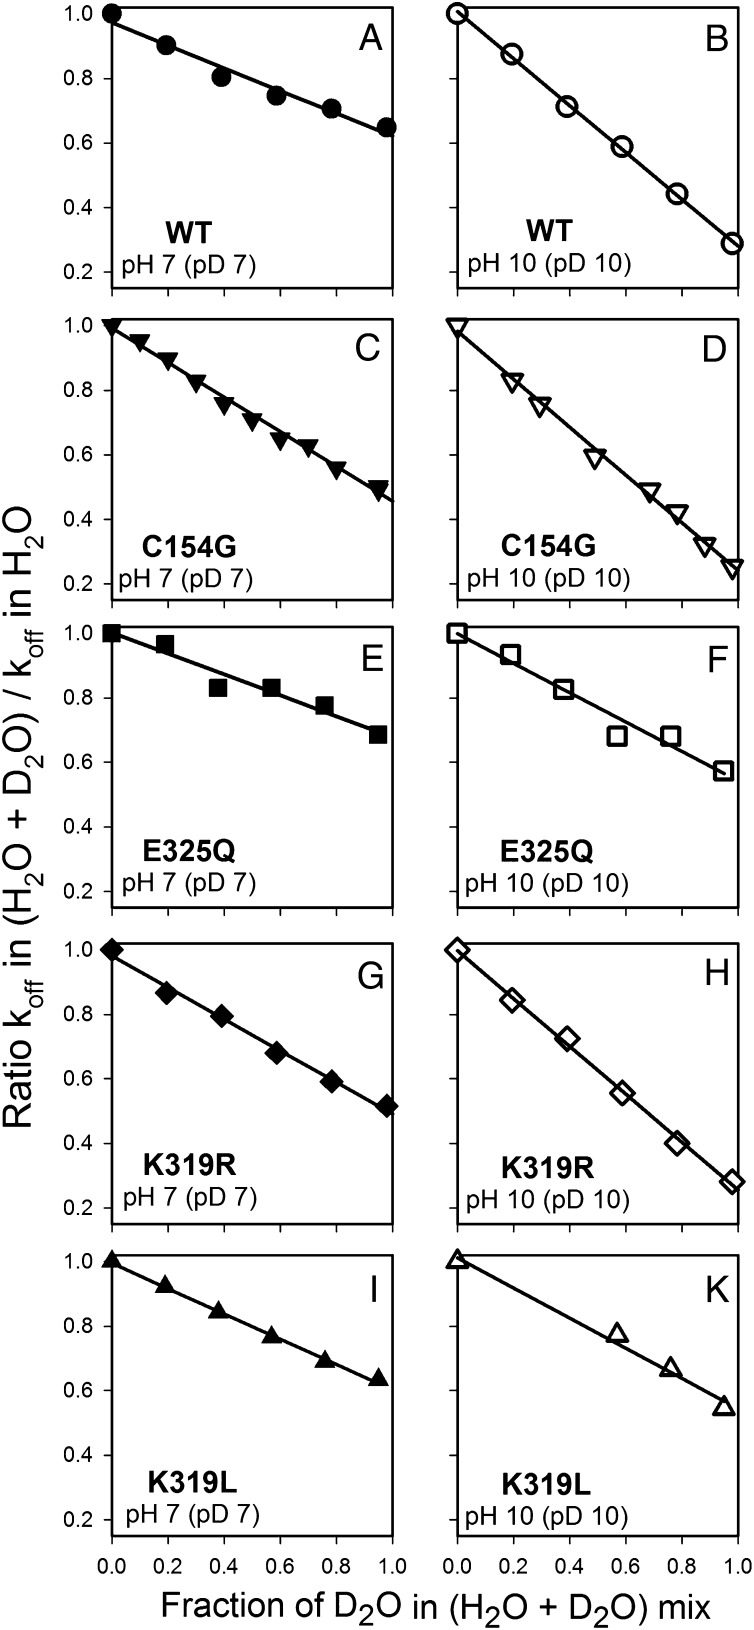
Because the H+ concentration in the surrounding medium does not change with galactoside binding to LacY (Figs. 2 and 3 and Fig. S3), and a D2O effect is observed at neutral pH (KIE 1.5–2.0) and at alkaline pH (KIE 3.6–4.0), the possibility arises that more than one H+ is involved with the binding reaction. Therefore, the proton inventory technique was used (29–32), and NPG displacement rates (koff) were determined at neutral and alkaline conditions at increasing concentrations of D2O (Fig. 7). As shown, WT LacY and the four mutants described above exhibit a linear relationship between koff and D2O concentration at pH (pD) 7.0 or 10.0. The data suggest that a single H+ is involved in the KIE. The slope of the line is greater at pH (pD) 10.0 than at pH (pD) 7.0 for WT LacY, C154G, and K319R, corresponding to higher KIEs for these proteins under alkaline conditions (Table 1) and reflecting pH-dependent sugar binding (14). In contrast, mutants E325Q and K319L display similar KIEs at both pH values, in agreement with pH-independent sugar binding, and similar D2O effects on koff at pH (pD) 7.0 or 10.0 (Fig. 7 E, F, I, and K).
Fig. 7.
Proton inventory at neutral and alkaline pH (pD). Stopped-flow rates were measured as described in Fig. 6 at given concentrations of D2O. The ratio of displacement rate measured in the mixture of H2O + D2O to the displacement rate measured in H2O is plotted versus the D2O concentration. Data are presented for WT LacY (A and B) and mutants C154G (C and D), E325Q (E and F), K319R (G and H), and K319L (I and K). Panels on the left (filled symbols) show data for pH (pD) 7.0; panels on the right (open symbols) show data for pH (pD) 10.0.
Discussion
As expected, downhill transport of sugar by LacY is obligatorily coupled to H+ translocation and thereby causes acidification of the interior milieu of proteoliposomes. Alkylation of Cys148 in the vicinity of a sugar-binding site prevents sugar binding and completely blocks lactose/H+ symport. Also, no acidification is observed with mutant E325A, which binds galactoside normally but is defective in reactions that involve net H+ translocation (21–26). Therefore, binding of sugar alone is not followed by binding or release of a stoichiometric H+ on the cytoplasmic side of LacY inside the proteoliposomes. Thus, protonation or deprotonation as the direct result of galactoside binding was investigated with purified proteins solubilized in DDM at high protein concentrations.
No change in ambient pH is observed upon sugar binding to WT LacY or mutants C154G, E325A, R302K, and Y236A under conditions in which ligand binding to EmrE results in dissociation of close to a single H+/mol of EmrE monomer, as shown by Schuldiner and colleagues (16, 17). Notably, mutants Y236A or R302K in the core of the H+-binding site exhibit markedly decreased affinity (i.e., increased Kd) and shifted pH dependence of sugar-binding affinity (pKa = 8.0–8.4) compared with WT LacY (pKa = ∼10.5) (14). No pH change is detected at pH 8.3 upon sugar binding with these mutants, thereby suggesting that LacY must already be protonated before sugar binds. Similarly, no change in ambient pH is observed upon sugar binding by E325A LacY, where high-affinity NPG binding is independent of pH up to pH 11.0.
Protonation is required for sugar binding under physiological conditions (13), and the results presented here support and extend this interpretation. Mutational analysis reveals that interaction of H+ with several amino acid residues, which form a tightly interconnected H-bond/salt bridge cluster (Fig. S1B), is essential for high-affinity sugar binding (14). Substitution of deuterium for protium should affect proton transfer within the H+-binding site and therefore may alter reaction rates that depend on protonation/deprotonation. Hence, the effect of D2O on the kinetics of sugar binding to WT LacY and mutants was investigated. Previously it was shown that D2O decreases the rate of downhill lactose transport with no effect on the rate of ∆μ̃∼H+-driven uphill transport or equilibrium exchange (33). These and other findings (11, 25, 26, 34) support the conclusion that the rate-limiting step for downhill lactose/H+ symport is deprotonation and that this step no longer is rate-limiting when there is a driving force on the H+ in the form of ∆μ̃∼H+ or when sugar transfer across the membrane does not involve H+ translocation (i.e., equilibrium exchange or counterflow). Here we investigated the effect of D2O on the sugar-binding step under pre–steady-state conditions using Trp→NPG FRET. Stopped-flow rates of sugar binding (kon) and displacement (koff) were measured at pH (pD) 7.0 and 10.0. At neutral pH, the effect of D2O on NPG binding and displacement rates is comparable (KIE 1.5–1.9). Notably, sugar-binding affinity at neutral pH is the same in either H2O or D2O (Kd = 16–19 μM) as a result of concomitant changes in both koff and kon. It is debatable whether noncovalent interactions such as ligand binding result in a true KIE (32, 35, 36). Thus, it should be emphasized that our observations likely represent an effect of deuterium on H+ transfer within the H+-binding site of LacY that alters sugar-binding rates and not a direct effect of sugar binding itself. Moreover, this H+ transfer within LacY may correspond to the weak electrogenic reaction triggered by sugar binding to the protein, one of two electrogenic steps in the overall transport cycle of LacY revealed by solid-supported membrane-based electrophysiology (25, 26).
The enhanced affinity for NPG observed in D2O at pD 10 results specifically from an increased KIE on koff. The measured KIE is 3.6–4.0 for WT LacY and the mutants that exhibit a pKa of ∼10.5 (Table 1). The much slower koff observed in D2O compared with H2O could be explained either by an increase in the true KIE at alkaline pH or by a general pKa shift toward the alkaline region (Fig. S6). Modeling pH dependencies in D2O demonstrates that it is not possible to discriminate between the alternatives experimentally (Fig. S6; compare curves 2 and 3 at pH 10–11).
The requirement for protonation preceding sugar binding by LacY and a significant KIE in D2O motivated an attempt to assess the number of H+ involved by using the proton inventory technique (29–32). When the dependence of koff on D2O concentration is measured with purified WT LacY and four mutants at pH (pD) 7.0 or 10.0, no significant deviation from linearity is observed (Fig. 7). Thus, it is likely that a single proton is responsible for deuterium isotope effect on sugar-binding rates.
Materials and Methods
Materials.
Oligonucleotides were synthesized by Integrated DNA Technologies, Inc. Restriction enzymes were purchased from New England Biolabs. The QuikChange II kit was purchased from Stratagene. TDG was obtained from Carbosynth Limited. NPG, 3-(cyclohexylamino)-1-propanesulfonic acid (CAPS), and pyranine were obtained from Sigma-Aldrich. Talon Superflow Resin was purchased from BD Clontech. CNF was from Life Technologies. DDM and octyl-β-d-glucoside (OG) were obtained from Affymetrix. Synthetic 1-palmitoyl-2-oleyl-sn-glycero-3-phosphoethanolamine (POPE) and 1-palmitoyl-2-oleyl-sn-glycero-3-phospho-(1′-rac-glycerol) (POPG) were from Avanti Polar Lipids, Inc. D2O (>99% vol/vol) was obtained from Spectra Stable Isotopes. All other materials were of reagent grade and were obtained from commercial sources. Purified EmrE was a generous gift from Shimon Schuldiner (Hebrew University of Jerusalem, Jerusalem, Israel).
Construction of Mutants, Purification of LacY, and Reconstitution into Proteoliposomes.
Construction of mutants, expression in E. coli, and purification of LacY were performed as described (37). All mutants contained a C-terminal 6-His tag that was used for affinity purification by cobalt affinity chromatography on Talon resin. Purified proteins (10–15 mg/mL) in 50 mM NaPi/0.02% DDM (pH 7.5) were frozen in liquid nitrogen and stored at −80 °C until use. Reconstitution of LacY into proteoliposomes was carried out with synthetic phospholipids (POPE/POPG ratio 3:1) by using the dilution method (38). Briefly, purified LacY in 0.02% DDM was mixed with phospholipids (40 mg/mL) dissolved in 1.2% OG maintaining a lipid-to-protein ratio of 5 (wt/wt). The mixture was kept on ice for 20 min and then was diluted quickly in 50 mM NaPi (pH 7.5) so that final concentration of OG decreased to ∼0.01% (critical micelle concentration = 0.53%). After 5 min stirring at room temperature, the proteoliposomes were collected by centrifugation for 1 h at 100,000 × g and were subjected to two cycles of freeze-thaw/sonication before use. Loading of proteoliposomes with pyranine was performed by sonication (39). Proteoliposomes (0.25 mL with protein concentration 2 mg/mL) were mixed with 2.25 mL (111 mM) KCl containing 0.6 mM pyranine, were sonicated in the water bath, and were subjected to two cycles of freeze-thaw/sonication. Excess pyranine was removed by gel filtration on a G-25 Sephadex column (1.5 × 12.0 cm) equilibrated with 5 mM KPi/100 mM KCl (pH 7.5). Pyranine-loaded proteoliposomes completely separated from the free fluorophore were collected in 3.5–4 mL.
Fluorescence Measurements.
For experiments in which pH was monitored, proteins were equilibrated with unbuffered solutions using Amicon Ultra concentrators with a cutoff of 50 kDa for LacY and 10 kDa for EmrE. The starting pH level of solutions containing an indicated pH-sensitive fluorescent probe and 4–10 μM protein was measured with a pH-meter and adjusted by the addition of small aliquots of diluted NaOH or HCl. Binding/release of H+ was quantified by measuring fluorescence intensity in a pH range around the pKa of the fluorophore. Steady-state fluorescence was monitored at room temperature on a SPEX Fluorolog 3 spectrofluorometer (Horiba) in a 2.5-mL cuvettete with constant stirring. Typically additions of 1–5 μL were made during the time course of fluorescence monitoring.
Stopped-flow measurements were performed at 25 °C on a stopped-flow device (dead-time 2.7 ms) using an SLM-Aminco 8100 spectrofluorimeter (SLM Instruments) modified by OLIS, Inc. as described (27). Alternatively, an SFM-300 rapid kinetic system equipped with TC-50/10 cuvettete (dead-time 1.2–1.5 ms) with an MOS-450 spectrofluorimeter (Bio-Logic USA, LLC) was used as described (40). Typically, 10–15 stopped-flow traces were recorded for each data point, averaged, and fitted with an exponential equation using the built-in Bio-Kine32 software package or by using Sigmaplot 10 (Systat Software Inc). All concentrations given are final concentrations after mixing.
D2O/H2O Mixtures.
Stock solutions for the experiments were made either in pure water or D2O (98% final concentration). The pH was adjusted by the addition of small aliquots of either HCl or NaOH with a pH meter (pD = pH + 0.4). Given ratios of D2O/H2O-based solutions were prepared for the proton inventory experiments by mixing appropriate volumes of stock solutions. Small aliquots of concentrated proteins or sugars were diluted in the same buffers and used immediately for stopped-flow measurements.
Supplementary Material
Acknowledgments
We thank Shimon Schuldiner for providing samples of purified EmrE and Klaus Fendler for critically reading the manuscript and for stimulating discussions. M. Gregor Madej was instrumental in suggesting the proton inventory studies. This work was supported by National Institutes of Health Grants DK051131, DK069463, and GM073210 and by National Science Foundation Grant MCB-1129551 (to H.R.K.).
Footnotes
The authors declare no conflict of interest.
This article contains supporting information online at www.pnas.org/lookup/suppl/doi:10.1073/pnas.1214890109/-/DCSupplemental.
References
- 1.Abramson J, et al. Structure and mechanism of the lactose permease of Escherichia coli. Science. 2003;301:610–615. doi: 10.1126/science.1088196. [DOI] [PubMed] [Google Scholar]
- 2.Mirza O, Guan L, Verner G, Iwata S, Kaback HR. Structural evidence for induced fit and a mechanism for sugar/H+ symport in LacY. EMBO J. 2006;25:1177–1183. doi: 10.1038/sj.emboj.7601028. [DOI] [PMC free article] [PubMed] [Google Scholar]
- 3.Guan L, Mirza O, Verner G, Iwata S, Kaback HR. Structural determination of wild-type lactose permease. Proc Natl Acad Sci USA. 2007;104:15294–15298. doi: 10.1073/pnas.0707688104. [DOI] [PMC free article] [PubMed] [Google Scholar]
- 4.Chaptal V, et al. Crystal structure of lactose permease in complex with an affinity inactivator yields unique insight into sugar recognition. Proc Natl Acad Sci USA. 2011;108:9361–9366. doi: 10.1073/pnas.1105687108. [DOI] [PMC free article] [PubMed] [Google Scholar]
- 5.Frillingos S, Sahin-Tóth M, Wu J, Kaback HR. Cys-scanning mutagenesis: A novel approach to structure function relationships in polytopic membrane proteins. FASEB J. 1998;12:1281–1299. doi: 10.1096/fasebj.12.13.1281. [DOI] [PubMed] [Google Scholar]
- 6.Kaback HR. Structure and mechanism of the lactose permease. C R Biol. 2005;328:557–567. doi: 10.1016/j.crvi.2005.03.008. [DOI] [PubMed] [Google Scholar]
- 7.Guan L, Kaback HR. Lessons from lactose permease. Annu Rev Biophys Biomol Struct. 2006;35:67–91. doi: 10.1146/annurev.biophys.35.040405.102005. [DOI] [PMC free article] [PubMed] [Google Scholar]
- 8.Saier MH, Jr, et al. The major facilitator superfamily. J Mol Microbiol Biotechnol. 1999;1:257–279. [PubMed] [Google Scholar]
- 9.Saier MH., Jr Families of transmembrane sugar transport proteins. Mol Microbiol. 2000;35:699–710. doi: 10.1046/j.1365-2958.2000.01759.x. [DOI] [PubMed] [Google Scholar]
- 10.Smirnova I, Kasho V, Kaback HR. Lactose permease and the alternating access mechanism. Biochemistry. 2011;50:9684–9693. doi: 10.1021/bi2014294. [DOI] [PMC free article] [PubMed] [Google Scholar]
- 11.Kaczorowski GJ, Kaback HR. Mechanism of lactose translocation in membrane vesicles from Escherichia coli. 1. Effect of pH on efflux, exchange, and counterflow. Biochemistry. 1979;18:3691–3697. doi: 10.1021/bi00584a009. [DOI] [PubMed] [Google Scholar]
- 12.Kaback HR, Sahin-Tóth M, Weinglass AB. The kamikaze approach to membrane transport. Nat Rev Mol Cell Biol. 2001;2:610–620. doi: 10.1038/35085077. [DOI] [PubMed] [Google Scholar]
- 13.Smirnova IN, Kasho V, Kaback HR. Protonation and sugar binding to LacY. Proc Natl Acad Sci USA. 2008;105:8896–8901. doi: 10.1073/pnas.0803577105. [DOI] [PMC free article] [PubMed] [Google Scholar]
- 14.Smirnova IN, Kasho VN, Sugihara J, Choe JY, Kaback HR. Residues in the H+ translocation site define the pKa for sugar binding to LacY. Biochemistry. 2009;48:8852–8860. doi: 10.1021/bi9011918. [DOI] [PMC free article] [PubMed] [Google Scholar]
- 15.Zhou Y, Jiang X, Kaback HR. Role of the irreplaceable residues in the LacY alternating access mechanism. Proc Natl Acad Sci USA. 2012;109:12438–12442. doi: 10.1073/pnas.1210684109. [DOI] [PMC free article] [PubMed] [Google Scholar]
- 16.Soskine M, Adam Y, Schuldiner S. Direct evidence for substrate-induced proton release in detergent-solubilized EmrE, a multidrug transporter. J Biol Chem. 2004;279:9951–9955. doi: 10.1074/jbc.M312853200. [DOI] [PubMed] [Google Scholar]
- 17.Adam Y, Tayer N, Rotem D, Schreiber G, Schuldiner S. The fast release of sticky protons: Kinetics of substrate binding and proton release in a multidrug transporter. Proc Natl Acad Sci USA. 2007;104:17989–17994. doi: 10.1073/pnas.0704425104. [DOI] [PMC free article] [PubMed] [Google Scholar]
- 18.Schuldiner S. EmrE, a model for studying evolution and mechanism of ion-coupled transporters. Biochim Biophys Acta. 2009;1794:748–762. doi: 10.1016/j.bbapap.2008.12.018. [DOI] [PubMed] [Google Scholar]
- 19.Schuldiner S. Undecided membrane proteins insert in random topologies. Up, down and sideways: It does not really matter. Trends Biochem Sci. 2012;37:215–219. doi: 10.1016/j.tibs.2012.02.006. [DOI] [PMC free article] [PubMed] [Google Scholar]
- 20.Trumble WR, Viitanen PV, Sarkar HK, Poonian MS, Kaback HR. Site-directed mutagenesis of cys148 in the lac carrier protein of Escherichia coli. Biochem Biophys Res Commun. 1984;119:860–867. doi: 10.1016/0006-291x(84)90853-2. [DOI] [PubMed] [Google Scholar]
- 21.Carrasco N, Antes LM, Poonian MS, Kaback HR. lac permease of Escherichia coli: Histidine-322 and glutamic acid-325 may be components of a charge-relay system. Biochemistry. 1986;25:4486–4488. doi: 10.1021/bi00364a004. [DOI] [PubMed] [Google Scholar]
- 22.Carrasco N, et al. Characterization of site-directed mutants in the lac permease of Escherichia coli. 2. Glutamate-325 replacements. Biochemistry. 1989;28:2533–2539. doi: 10.1021/bi00432a028. [DOI] [PubMed] [Google Scholar]
- 23.Sahin-Tóth M, Karlin A, Kaback HR. Unraveling the mechanism of the lactose permease of Escherichia coli. Proc Natl Acad Sci USA. 2000;97:10729–10732. doi: 10.1073/pnas.200351797. [DOI] [PMC free article] [PubMed] [Google Scholar]
- 24.Sahin-Toth M, Kaback HR. Arg-302 facilitates deprotonation of Glu-325 in the transport mechanism of the lactose permease from Escherichiacoli. Proc Natl Acad Sci USA. 2001;98:6068–6073. doi: 10.1073/pnas.111139698. [DOI] [PMC free article] [PubMed] [Google Scholar]
- 25.Garcia-Celma JJ, Smirnova IN, Kaback HR, Fendler K. Electrophysiological characterization of LacY. Proc Natl Acad Sci USA. 2009;106:7373–7378. doi: 10.1073/pnas.0902471106. [DOI] [PMC free article] [PubMed] [Google Scholar]
- 26.Garcia-Celma JJ, Ploch J, Smirnova I, Kaback HR, Fendler K. Delineating electrogenic reactions during lactose/H+ symport. Biochemistry. 2010;49:6115–6121. doi: 10.1021/bi100492p. [DOI] [PMC free article] [PubMed] [Google Scholar]
- 27.Smirnova IN, Kasho VN, Kaback HR. Direct sugar binding to LacY measured by resonance energy transfer. Biochemistry. 2006;45:15279–15287. doi: 10.1021/bi061632m. [DOI] [PMC free article] [PubMed] [Google Scholar]
- 28.Yuan H, Xin Y, Hamelberg D, Gadda G. Insights on the mechanism of amine oxidation catalyzed by D-arginine dehydrogenase through pH and kinetic isotope effects. J Am Chem Soc. 2011;133:18957–18965. doi: 10.1021/ja2082729. [DOI] [PubMed] [Google Scholar]
- 29.Schowen KB, Schowen RL. Solvent isotope effects of enzyme systems. Methods Enzymol. 1982;87:551–606. [PubMed] [Google Scholar]
- 30.Venkatasubban KS, Schowen RL. The proton inventory technique. CRC Crit Rev Biochem. 1984;17:1–44. doi: 10.3109/10409238409110268. [DOI] [PubMed] [Google Scholar]
- 31.Cook PF. Enzyme Mechanism from Isotope Effects. Boca Raton, FL: CRC; 1991. [Google Scholar]
- 32.Northrop DB. Uses of isotope effects in the study of enzymes. Methods. 2001;24:117–124. doi: 10.1006/meth.2001.1173. [DOI] [PubMed] [Google Scholar]
- 33.Viitanen P, Garcia ML, Foster DL, Kaczorowski GJ, Kaback HR. Mechanism of lactose translocation in proteoliposomes reconstituted with lac carrier protein purified from Escherichia coli. 2. Deuterium solvent isotope effects. Biochemistry. 1983;22:2531–2536. doi: 10.1021/bi00279a034. [DOI] [PubMed] [Google Scholar]
- 34.Garcia ML, Viitanen P, Foster DL, Kaback HR. Mechanism of lactose translocation in proteoliposomes reconstituted with lac carrier protein purified from Escherichia coli. 1. Effect of pH and imposed membrane potential on efflux, exchange, and counterflow. Biochemistry. 1983;22:2524–2531. doi: 10.1021/bi00279a033. [DOI] [PubMed] [Google Scholar]
- 35.LaReau RD, Wan W, Anderson VE. Isotope effects on binding of NAD+ to lactate dehydrogenase. Biochemistry. 1989;28:3619–3624. doi: 10.1021/bi00434a070. [DOI] [PubMed] [Google Scholar]
- 36.Gawlita E, Caldwell WS, O’Leary MH, Paneth P, Anderson VE. Kinetic isotope effects on substrate association: Reactions of phosphoenolpyruvate with phosphoenolpyruvate carboxylase and pyruvate kinase. Biochemistry. 1995;34:2577–2583. doi: 10.1021/bi00008a023. [DOI] [PubMed] [Google Scholar]
- 37.Smirnova I, et al. Sugar binding induces an outward facing conformation of LacY. Proc Natl Acad Sci USA. 2007;104:16504–16509. doi: 10.1073/pnas.0708258104. [DOI] [PMC free article] [PubMed] [Google Scholar]
- 38.Viitanen P, Newman MJ, Foster DL, Wilson TH, Kaback HR. Purification, reconstitution, and characterization of the lac permease of Escherichia coli. Methods Enzymol. 1986;125:429–452. doi: 10.1016/s0076-6879(86)25034-x. [DOI] [PubMed] [Google Scholar]
- 39.Matsushita K, Patel L, Kaback HR. Cytochrome o type oxidase from Escherichia coli. Characterization of the enzyme and mechanism of electrochemical proton gradient generation. Biochemistry. 1984;23:4703–4714. doi: 10.1021/bi00315a028. [DOI] [PubMed] [Google Scholar]
- 40.Smirnova I, Kasho V, Sugihara J, Kaback HR. Opening the periplasmic cavity in lactose permease is the limiting step for sugar binding. Proc Natl Acad Sci USA. 2011;108:15147–15151. doi: 10.1073/pnas.1112157108. [DOI] [PMC free article] [PubMed] [Google Scholar]
Associated Data
This section collects any data citations, data availability statements, or supplementary materials included in this article.


