Abstract
DNA sequence context has long been known to modulate detection and repair of DNA damage. Recent studies using experimental and computational approaches have sought to provide a basis for this observation. We have previously shown that an α-anomeric adenosine (αA) flanked by cytosines (5′CαAC-3′) resulted in a kinked DNA duplex with an enlarged minor groove. Comparison of different flanking sequences revealed that a DNA duplex containing a 5′CαAG-3′ motif exhibits unique substrate properties. However, this substrate was not distinguished by unusual thermodynamic properties. To understand the structural basis of the altered recognition, we have determined the solution structure of a DNA duplex with a 5′CαAG-3′ core, using an extensive set of restraints including dipolar couplings and backbone torsion angles. The NMR structure exhibits an excellent agreement with the data (total RX <5.3%). The αA base is intrahelical, in a reverse Watson–Crick orientation, and forms a weak base pair with a thymine of the opposite strand. In comparison to the DNA duplex with a 5′CαAC-3′ core, we observe a significant reduction of the local perturbation (backbone, stacking, tilt, roll, and twist), resulting in a straighter DNA with narrower minor groove. Overall, these features result in a less perturbed DNA helix and obscure the presence of the lesion compared to the 5′CαAC-3′ sequence. The improved stacking of the 5′CαAG-3′ core also affects the energetics of the DNA deformation that is required to form a catalytically competent complex. These traits provide a rationale for the modulation of the recognition by endonuclease IV.
Keywords: DNA damage recognition, α-anomeric adenosine, endonuclease IV, NMR, flanking sequence effects
Introduction
DNA is constantly under attack from external and internal agents. In order to preserve normal cellular function, damaged DNA must be repaired. Nature has devised numerous strategies and repair systems to deal with a large range of different DNA lesions. For example, bulky adducts or double-strand breaks grossly deform a DNA duplex, which in turn provides a noticeable signal for detection and subsequent repair of the lesion. Other types of damage, for example, those that are processed by the base excision repair pathway, are less disruptive and perturb the DNA duplex to a smaller extent.1–4 This makes their recognition much more challenging because it requires the repair enzyme to be sensitive to relatively subtle changes in DNA structure and properties.
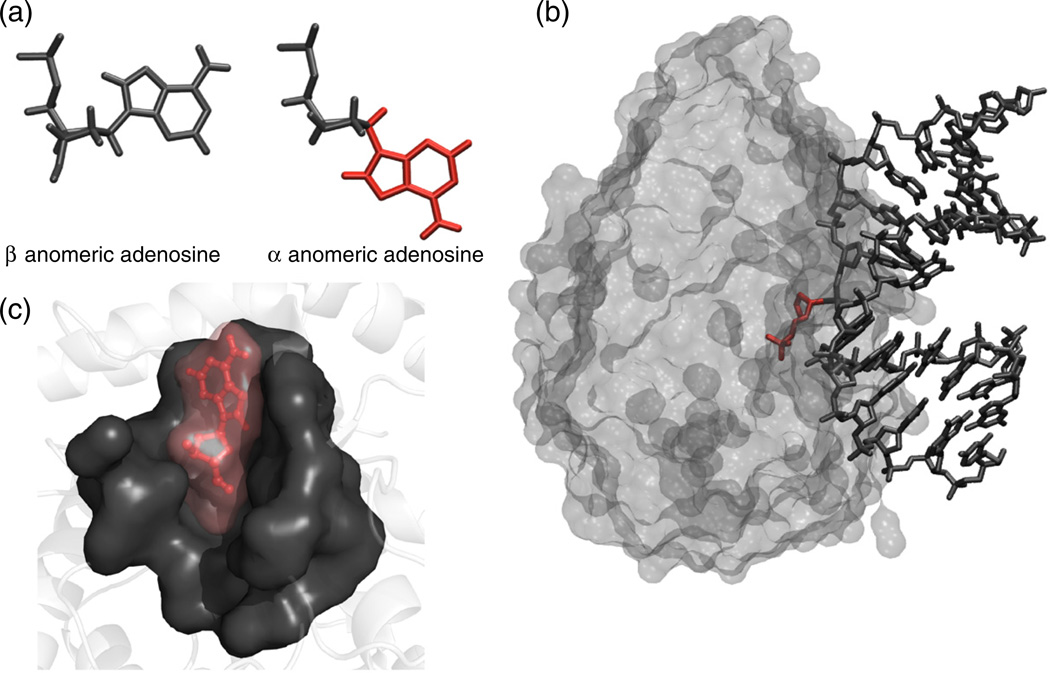
α-Anomeric deoxyribose lesions are one such form of damage.5,6 This type of lesion is generated by the abstraction of the anomeric hydrogen by a hydroxyl radical under anaerobic conditions, which can result in the inversion of the stereochemistry at the C1′ position (Fig. 1a).7,8 When present in a DNA duplex, α-anomeric adenosine (αA) is mutagenic and directs the incorporation of dC, dA, or dT during replication in vitro.7–9 Under in vivo conditions, the same lesion results in single-nucleotide deletions; intriguingly, there is also evidence that sequences flanking the αA influence the bypass property of polymerase I.7 Specifically, a 3′ flanking G resulted in a higher degree of bypass as compared to a T on the −3′ side of the αA lesion.7
Fig. 1.
(a) β versus α-anomeric nucleotide; the α-anomeric damage is highlighted in red. (b) Manual docking of αA into the binding pocket of endonuclease IV. The structure of the enzyme was taken from the abasic DNA–endonuclease IV coordinates (PDB code 1QUM).13 (c) Endonuclease IV in complex with DNA substrate containing an abasic site (1QUM).13 The abasic residue is highlighted in red.
In bacteria, endonuclease IV is a damage-general enzyme that processes abasic sites; in addition, it also recognizes and processes α-anomeric lesions.7,8 These attributes have been preserved in the mammalian enzyme APE-1.9,10 To date, α-anomeric lesions have not been reported in mammals. However, tumor cells thrive in hypoxic environments, and with radiation treatments, the conditions to promote such damage are present.11 Combined with the observation that the repair machinery for α-anomeric damage is conserved in mammalian cells, this may suggest a biological significance.9
The crystal structure of endonuclease IV with an abasic substrate provides insight into how the enzyme processes abasic damage. A loop containing a conserved Arg is inserted into the enlarged DNA minor groove, and a 90° kink is induced in the DNA at the point of the lesion (Fig. 1c).12
As stated earlier, endonuclease IV has the ability to process α-anomeric damage; this was rationalized by modeling, which showed that an α-anomeric nucleotide fits into the enzyme-binding pocket but a normal β anomeric nucleotide does not (Fig. 1b).13 The solution structure of a DNA duplex containing a single αA flanked by cytosines shows αA stacked inside the helix. However, this is achieved at the expense of enlarging the minor groove and by creating an 18° kink into the major groove at the lesion.5 Both the kink and the opening of the minor groove in the substrate are likely to facilitate access and initial recognition by endonuclease IV, aiding in the formation of the catalytically competent complex.
The sequence of the DNA substrate is known to modulate damage recognition and processing for many systems. For example, mismatch detection by MSH2–MSH6 is altered by the nearest-neighbor sequence context.14 Flanking sequence effects have also been observed for NER (nucleotide excision repair) incision of a benzo[a]pyrene lesion.15 The structural and dynamic effects of sequence context on biological events have gained more prominence as evidenced by recent molecular dynamics (MD) simulations.16
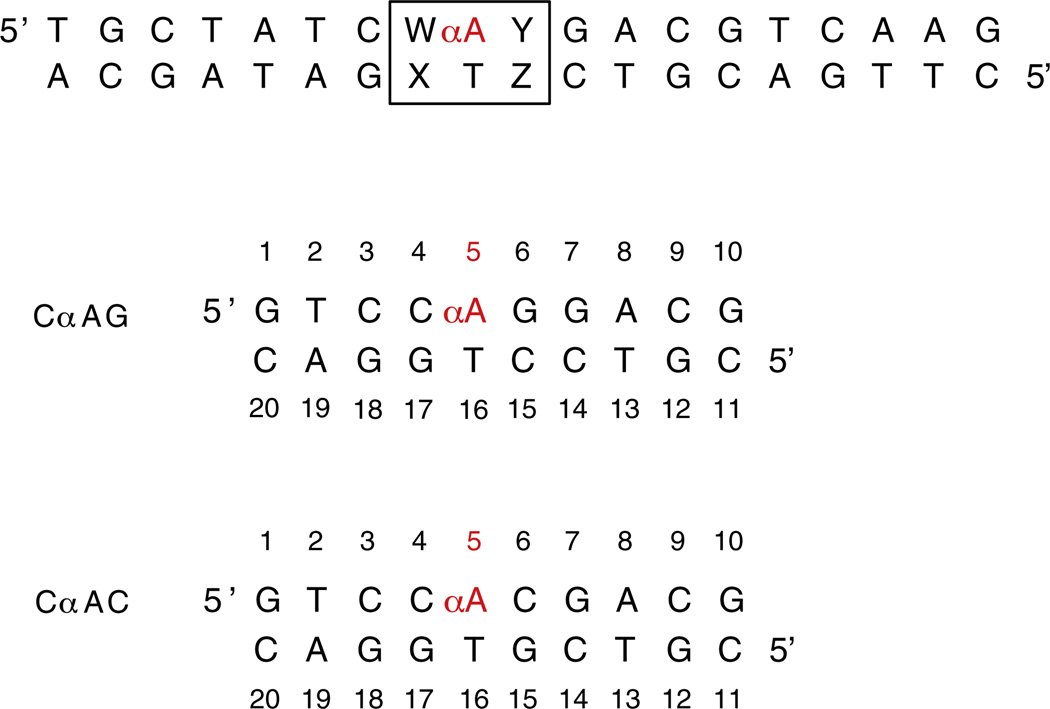
Here, we present a high-resolution NMR structure of a DNA decamer duplex containing a single αA contained in a CαAG motif to investigate flanking sequence effects on structural features that modulate endonuclease IV activity (Fig. 2). Examination of the structural details of DNA duplexes with a single αA lesion shows that the minor groove topology and kink are dependent on the surrounding sequence; this is expected to alter recognition. An in-depth comparison of substrate topology and structure, between our previously published CαAC structure, the current CαAG structure, and an ideal B helical DNA model, provides an explanation for the observed modulation of endonuclease IV activity.
Fig. 2.
Sequences of DNA duplexes containing αA lesions for enzymatic and structural studies. For enzyme cleavage assays, 19-mer DNA duplexes were used (top), where W:X and Y:Z represent different flanking sequences. The impact of the same flanking sequences on structure and stability was determined from 10 base pair duplexes (bottom). In the CαAG duplex, the focus of the current study, αA is flanked by 5′ cytosine and 3′ guanosine. CαAC is a previously studied sequence context containing αA flanked by 5′ and 3′ cytosines.5
Results
Enzyme activity and processing
Flanking sequence effects on recognition and processing of an αA lesion by endonuclease IV were investigated by measuring the hydrolysis of the DNA backbone on the 5′ side of the lesion.13 The DNA substrates contained a central αA lesion but varied in the flanking sequences (Table 1). All duplexes containing an αA lesion were substrates for endonuclease IV; however, the CαAG sequence context showed unique properties. Specifically, an approximately fourfold increase in KM was observed, which suggests a lower affinity for the CαAG duplex compared to that for the other substrates (GαAC, GαAG, CαAC) that had comparable values (Table 1).
Table 1.
Stability and processing of αA substrates by endonuclease IV
| Core sequence, 5′-XαAY-3′ |
ΔH ° (kJ/mol) |
TM at 10 µM (K) |
Km (nM) |
kcat (min−1) |
|---|---|---|---|---|
| GαAC | 234 | 326.6 | 527±99 | 0.24±0.03 |
| GαAG | 264 | 325.6 | 404±96 | 0.14±0.02 |
| CαAG | 279 | 323.8 | 2195±693 | 0.84±0.21 |
| CαAC | 272 | 322.2 | 435±76 | 0.27±0.03 |
| CAC | 304 | 328.9 | n/a | n/a |
The sequence constructs are shown in Fig. 2. For the melting studies 10-mer duplexes that only differed in the core sequence were used.
n/a: not applicable.
Thermodynamic stability
UV melting curves of DNA (10-mer) duplexes that correspond to the core of the enzyme substrates were recorded to assess the effects of the different flanking sequences on the thermodynamic stability (Fig. 2). Using the same core sequence for enzymatic and physical characterization will facilitate a comparison of the effect of the sequence context. The melting temperature (TM) values for the αA-containing substrates vary from 322 to 327 K, with the CαAG duplex being unremarkable and similar to the CαAC duplex both in TM and enthalpy. This is in contrast to the enzyme data where the CαAG duplex exhibits a markedly different behavior (Table 1).
Base pairing
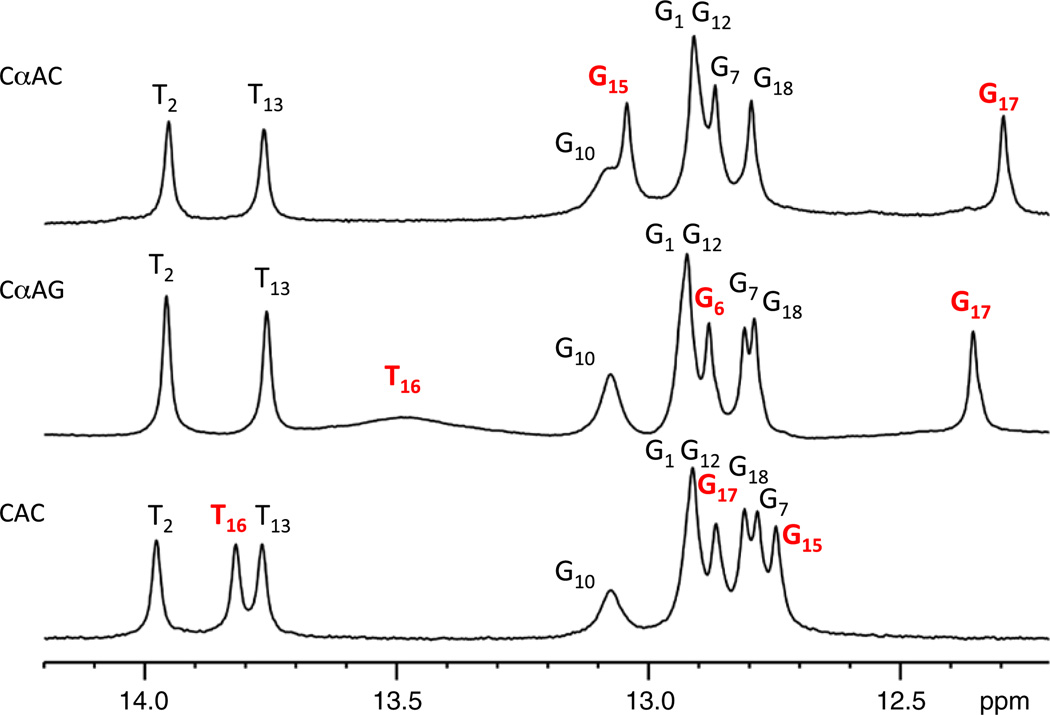
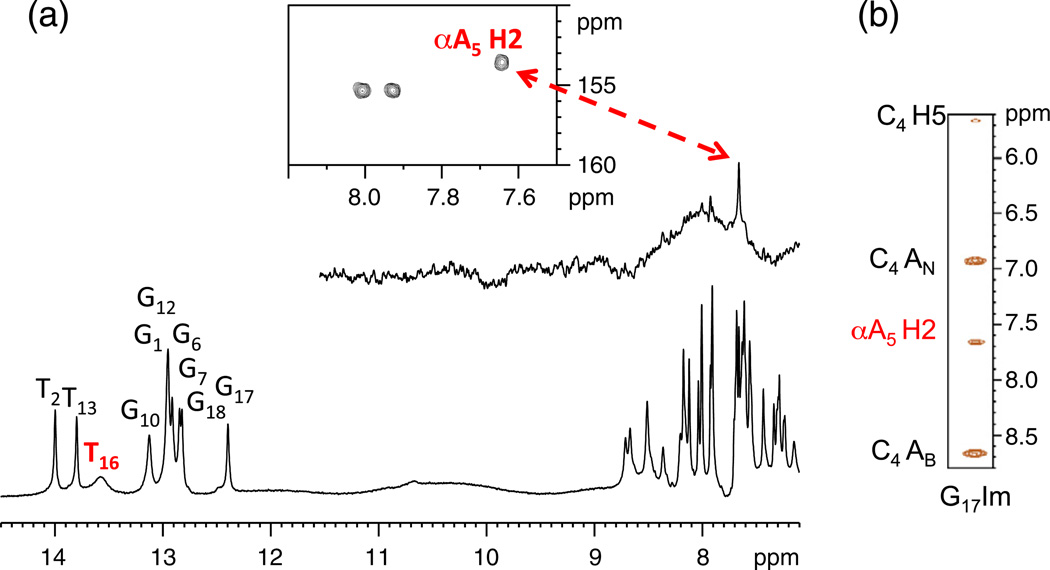
The presence of an imino proton peak generally results from the formation of a stable base pair.17 At low temperature (278 K), a broad peak at 13.5 ppm is observed for the CαAG duplex in addition to the nine imino proton peaks of the expected Watson–Crick base pairs (Fig. 3). This peak is in the same region as imino protons of AT base pairs and was therefore tentatively assigned as T16. This assignment was confirmed from one-dimensional (1D) nuclear Overhauser enhancement (NOE) experiments where irradiating the broad peak produced a NOE to a resonance at 7.66 ppm. In turn, the sharp peak at 7.66 ppm was identified as A5 H2 from its relaxation properties, NOE spectroscopy (NOESY) connectivity, and 1H–13C heteronuclear single-quantum coherence (HSQC) spectra. Together, this identifies the resonance at 13.5 ppm as the imino proton of T16 (Fig. 4a). The broad appearance of the resonance suggests rapid exchange with the solvent, signifying a weaker base pair compared to the regular Watson–Crick base pairs.
Fig. 3.
Imino proton spectra of DNA duplexes containing CαAG and CαAC, and a control duplex (all ~0.1 mM), at 276 K in 10 mM sodium phosphate, 50 mM NaCl, 0.3 mM EDTA, and 10% D2O (pH 6.6). Resonances of interest are shown in red. The imino proton peak of T16 is not observed for the CαAC duplex.
Fig. 4.
(a) 1D NOE and HSQC experiment used to confirm the identity of the imino proton at 13.5 ppm. (b) 1-1 NOESY cross-peaks from G17 imino proton to base and amino protons of αA5 and C4. AB and AN denote bound and nonbound amino protons. Sample conditions were as follows: 0.75 mM duplex, 10 mM sodium phosphate, 50 mM NaCl, 0.3 mM EDTA, and 10% D2O at 276 K (pH 6.6) except for the 1D NOE where a 0.1 mM sample was used.
The intrahelical orientation of the αA5–T16 base pair is supported by NOESY cross-peaks from G17 imino and C4 amino protons to αA5 H2 (Fig. 4b). These contacts are also present for the CαAC structure determined previously.5 However, base pairing between αA5–T16 could not be detected in the CαAC duplex as evidenced by the lack of the T16 imino proton peak.5 Additionally, in the CαAG duplex the imino protons of the base pairs flanking the lesion more closely resemble the control (CAG). This is again indicative of smaller perturbations at the lesion site (Fig. 3).
Backbone
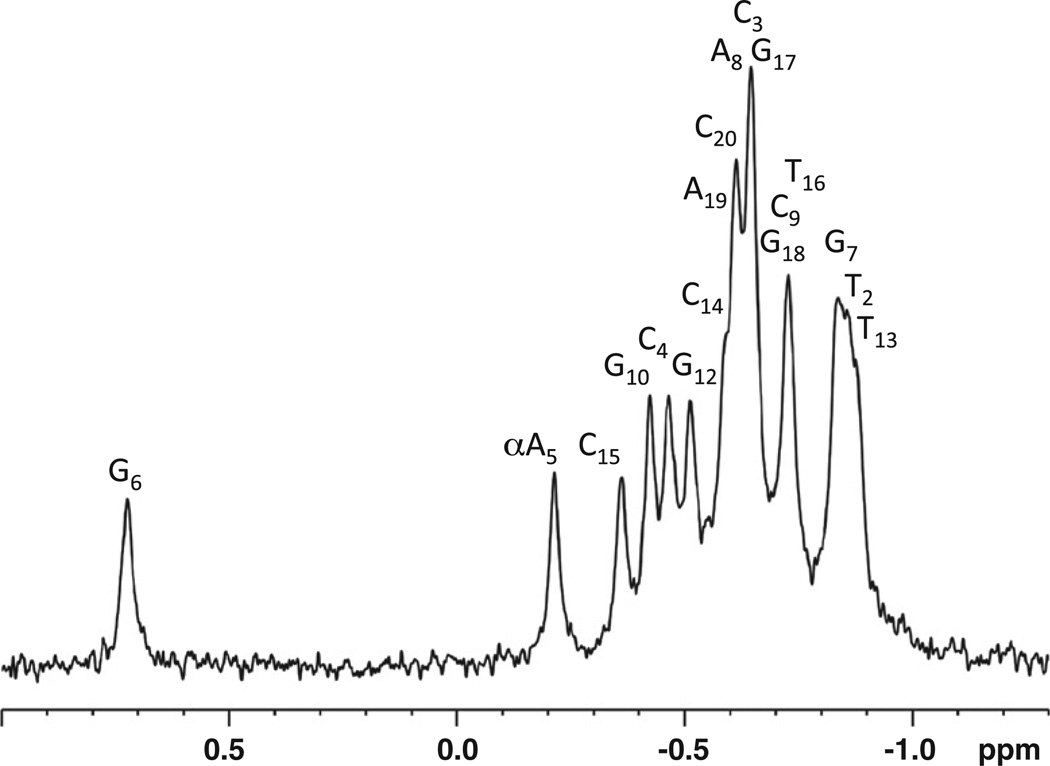
31P chemical shifts are a convenient monitor for the DNA backbone conformation; they are heavily influenced by the torsion angles α and ζ. The phosphodiester backbone at αA5-P-G6 is perturbed in a manner similar to that of the previously studied CαAC duplex, but to a lesser extent (0.75 ppm versus 1.0 ppm). All other chemical shifts are between 0 and −1.0 ppm and are typical of a B helical-type conformation (Fig. 5).
Fig. 5.
31P spectra of the CαAG duplex (1.5 mM CT) at 298 K in 10 mM sodium phosphate, 50 mM NaCl, and 0.3 mM EDTA (pH* 7.05). An abnormal shift is observed for αA5-P-G6 at 0.75 ppm.
In addition to phosphorus chemical shift analysis, the DNA backbone torsion angle ε was also investigated. These torsion angles, derived from experimental data, indicate that ε of αA5 is slightly perturbed (−155°) and is similar to the CαAC structure. All other torsion values are in a B-type helical range (SI 1).
Deoxyribose conformation
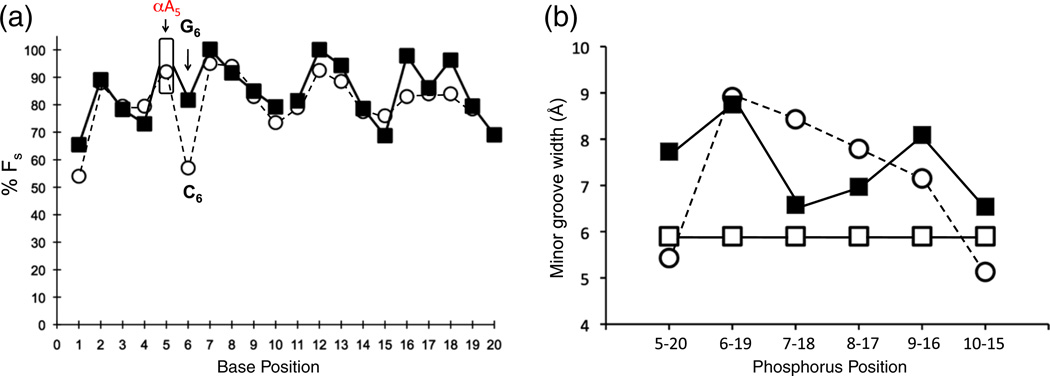
The DNA sugar conformation (expressed as fraction south, FS) was determined from individual coupling constants JH1′–H2′1, JH1′–H2′2 and the sum of couplings ΣJH1′, ΣJH3′, ΣJH2′1ΣJH2′2. This analysis showed that all nonterminal deoxyribose sugars strongly favor the S conformation for the CαAG duplex. While the conformation of αA5 could not be directly determined from individual coupling constants due to overlap, the estimation of the ΣJH3′ together with the appearance of the cross-peaks places this residue in the high S sugar conformational range (Fig. 6a). This is in agreement with previous results of α-anomeric residues embedded in DNA duplexes.5,19 Comparing the deoxyribose conformations for the CαAG and CαAC duplexes, we find that the only substantial difference is found at position 6 where the presence of a G residue following the lesion results in a dominant, >80% S conformation. In the case of the previously studied CαAC duplexes that contain a C at position 6, the equilibrium is at 50% FS (Fig. 6a).
Fig. 6.
(a) DNA sugar ring conformations. Fraction south (FS) determined from individual and summation of coupling constants. The CαAG duplex is shown in black squares and the CαAC duplex in open circles. αA5 was estimated for the CαAG duplex and is shown in an open box. A significant difference in FS is observed between the two duplexes at the 3′ side of the αA lesion. (b) Minor groove width for the CαAC structure (black square), CαAG structure (open circle), and a model B-type DNA duplex (open square). The width was measured from the phosphorus distance P(i) to P(i−4)′ on the opposite strand (i.e., from G10 to C15, Fig. 2) minus 5.8 Å.18
NOE connectivity
The 1D 1H NMR spectra of CαAG displays sharp lines for all resolved peaks; this, coupled with the absence of exchange cross-peaks in 2D NOESY spectra, indicates that the α-anomeric lesion does not induce multiple conformations. All NOE base–sugar H1′ pathways are intact with the exception of a missing cross-peak between C4H1′–αA5H8 protons and a slight reduction in the intensity of the αA5H1′–G6H8 cross-peak (SI 2). This is a consequence of the configuration at C1′ of the αA residue in CαAG; the same observation was also made for the CαAC duplex. There is, however, one obvious difference. In the CαAC duplex, a unique cross-peak was observed for αA5H1′–C4H6, which is a consequence of the helical kink at the site of the αA lesion. An analogous cross-peak could not be detected for the CαAG duplex, which again indicates a smaller perturbation in the present duplex.
Structure calculation
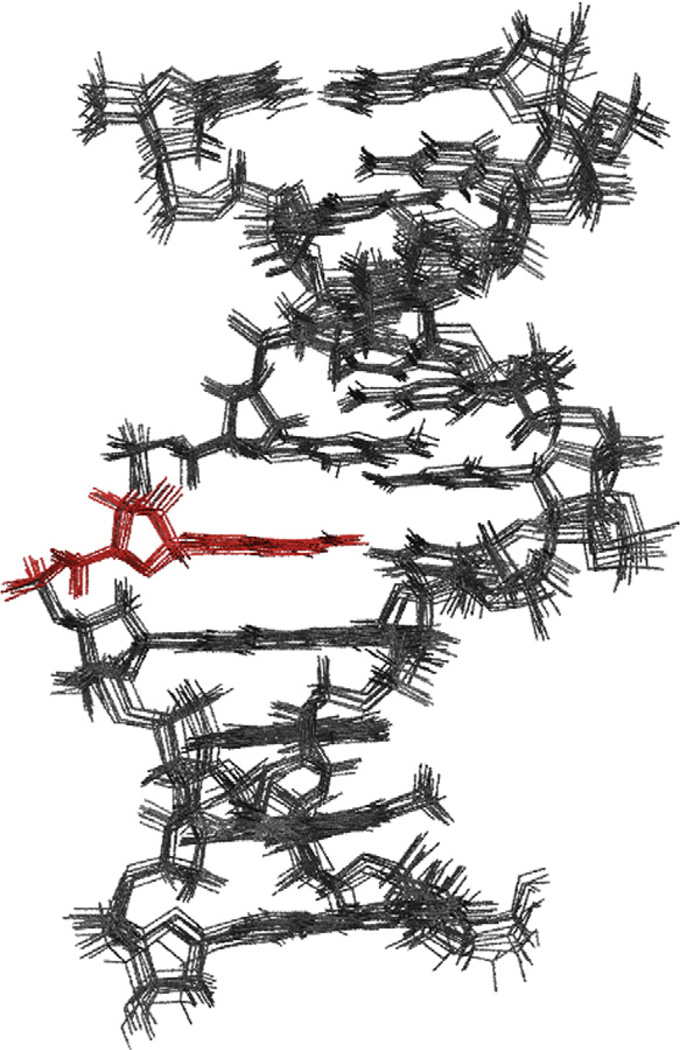
Using multiple MARDIGRAS/AMBER cycles, we developed a total of 246 quantitative distance restraints with narrow well widths of ~0.7 Å. In combination with extensive use of natural-abundance residual dipolar coupling (RDC) (JCH1′, JCH3′, JCH2, JCH5, JCH6, and JCH8), sugar puckering, backbone torsion, and base-pairing restrains, a total of 550 restraints were obtained (27.5 restraints per nucleotide) (Table 2). This allowed the determination of well-restrained, high-resolution structures that are in excellent agreement with the collected NMR data as evidenced by the total CORMA RX values of <5.3% (Table 2). The final ensemble of 10 structures sampled at the end of a 10 -ns restrained molecular dynamics simulation yields a tight bundle with a heavy-atom R.M.S.D. of 0.63 Å (Fig. 7 and SI 4). For analysis, a single representative structure was selected on the basis of its lowest AMBER violations. All restraints are well accommodated; no individual violation exceeds 3.0 kcal/mol. The RDC alignment penalties are also minimal with a total of just 4.9 kcal/mol for all 46 restraints (Table 2). To confirm that RDC restraints have been satisfied, we calculated values for the final structure and compared them to the experimental data (SI 3). Further analysis on RX and Q values and longer sampling of R.M.S.D. data implementing different restraint sets are provided in the supplementary material (SI 4 and 6).
Table 2.
Summary of NMR restraints for the CαAG duplex structure determination
| Parameter | CαAG | Force constant, k [kcal/(mol × unit of violation)] | ||
|---|---|---|---|---|
| Quantitative distance restraints (RANDMARDI) | ||||
| Non-exchangeable (total) | 246 | 30 | ||
| Intraresidue | 154 | 30 | ||
| Interresidue (sequential) | 92 | 30 | ||
| Interresidue (cross strand) | 1 | 30 | ||
| Average well width (Å) | 0.70 (SD 0.46) | |||
| Exchangeable (total) | 27 | 30 | ||
| Average well width (Å) | 3.0 | |||
| Endocyclic torsion angle restraints | ||||
| Deoxyribose (pseudorotation analysis) | 95 | 50 | ||
| Average well width |r2 - r3|/N | 30 | |||
| Watson–Crick restraints | ||||
| Distance | 25 | 25 | ||
| Flat angle | 25 | 10 | ||
| Backbone torsion angle restraints | ||||
| DNA duplex broad restraints | 68 | 50 | ||
| Well width α, β, γ, ζ (deg) | 60, 80, 60, 65 | |||
| ε (CT NOESY) (deg) | 18 | 50 | ||
| Average well width | Varies from 20 to 50 depending on number of data points available |
|||
| Residual dipolar coupling | ||||
| Total RDC restraints | 46 | |||
| Base (C6, C8, C2, C5) | 24 | 1.0 (dipolar weight) | ||
| Sugar (C1′) | 12 | 1.0 (dipolar weight) | ||
| Sugar (C3′) | 10 | 1.0 (dipolar weight) | ||
| Total restraints | 550 | |||
| Total restraints/residue | 27.5 | |||
| CORMA RX values | ||||
| TM (ms) | RX (number of unique cross-peaks) | |||
| Intra | Inter | Total | ||
| 75 | 4.73 (93) | 6.55 (44) | 5.25 (134) | |
| 125 | 4.13 (143) | 5.61 (77) | 4.62 (220) | |
| 250 | 3.81 (136) | 5.19 (83) | 4.29 (291) | |
| Final AMBER parameters | ||||
| Total distance penalty (kcal/mol) | 55.4 | |||
| Total angle penalty (kcal/mol) | 0.24 | |||
| Total torsion angle penalty (kcal/mol) | 4.6 | |||
| RDC alignment constraint | 4.9 | |||
| Bundle of 10 final structures | ||||
| Heavy-atom R.M.S.D. | 0.63 | |||
Fig. 7.
Bundle of final 10 NMR structures for the CαAG duplex without RDC restraints. The heavy-atom R.M.S.D. is 0.63 Å.
Structural analysis
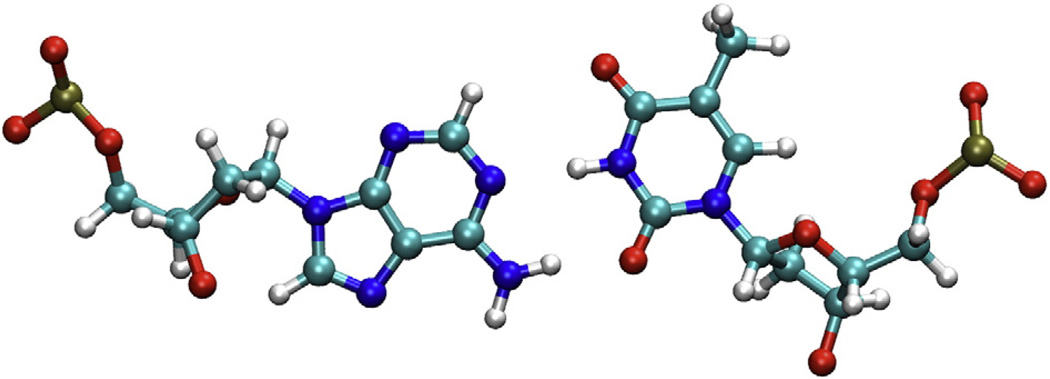
The CαAG duplex structure is clearly B helical as expected. The αA5 base is stacked inside the helix, forming a reverse Watson–Crick base pair with T16 (Fig. 8). The intrahelical orientation of αA5 is confirmed by the observed T16 imino proton and the NOE cross-peaks from imino and amino protons to base protons on adjacent residues. One consequence of the embedded αA5 is the change of torsion angle ζ from the standard B value of −108° to −129°. The values for the α (O3′-P-O5′-C5′) torsion angles are consistent with B helical values (−68° ± 4°); thus, the change in torsion angle ζ appears to be the cause of the observed shift of the αA5-P-G6 phosphorus resonance. In the case of the CαAC structure, a more extensive perturbation of the 31P chemical shift of αA5-P-C6 is observed, which correlates to a more unusual ζ value of −158°.
Fig. 8.
Reverse Watson–Crick style αA–T base pair taken from the final structure.
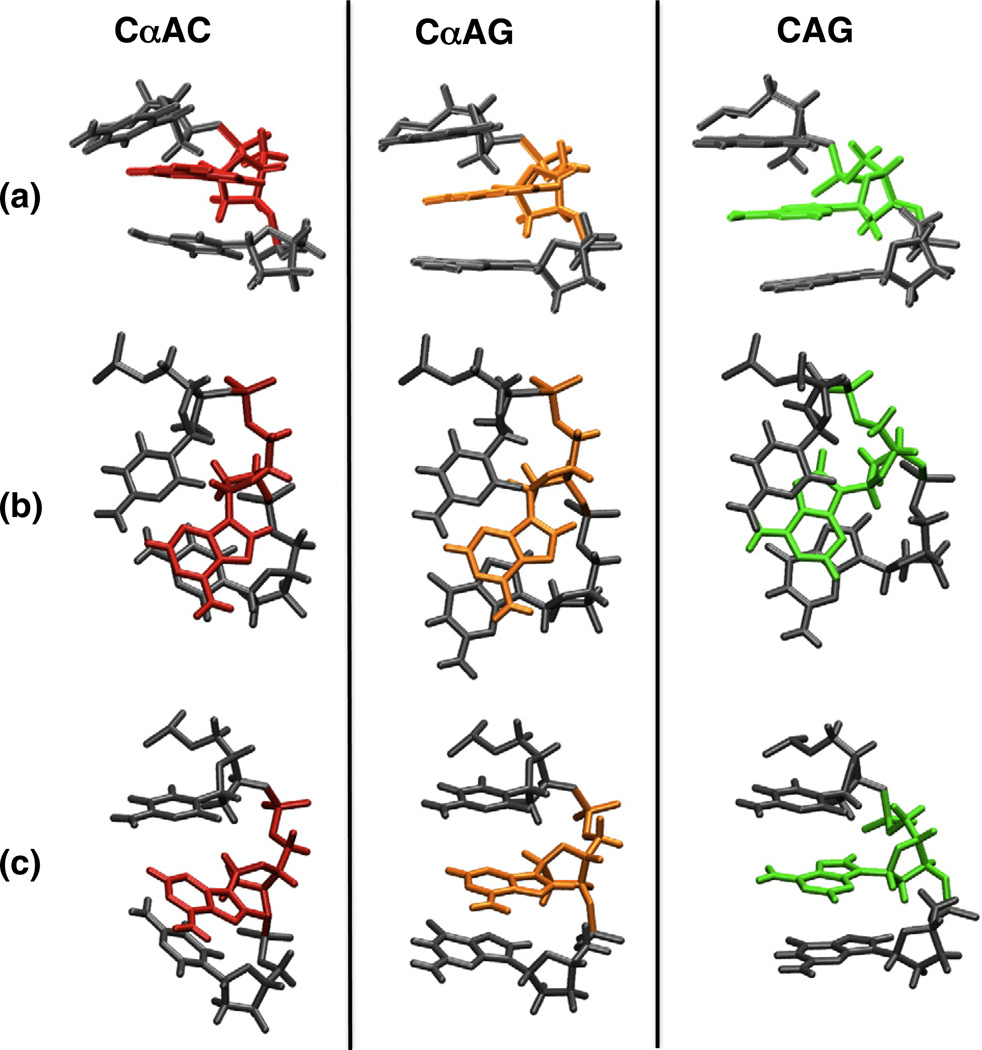
Comparison of the local structure of both αA duplexes to a standard B helical duplex reveals important differences. For both damaged structures, the inversion of the stereochemistry at αA5 disrupts base stacking C4. However, in the case of the CαAG duplex this feature is less pronounced, as shown in Fig. 9a and c. The CαAG duplex displays a positive base slide between C4/αA5 (1.7 Å); this disturbance is, however, offset by a larger negative slide for αA5/G6 (−2.3 Å). The next base steps, G6/G7, display a normal B helical value (0.2 Å) (Fig. 9b). Roll and twist changes are only observed for αA5/G6 with 15° and 31° for roll and twist, respectively. In the case of the CαAC structure, these distortions are more pronounced and do not partially compensate (Fig. 9c). Considering the same base steps, the base slide values are all positive for the core of the duplex (C4/αA5, 1.0 Å; αA5/C6, 0.6 Å; C6/G7, 0.6 Å). The CαAC structure also displays an elevated tilt for the C4/αA5 and αA5/C6 bases, while CαAG structure does not (Fig. 9a). While αA5/C6 in CαAC displays a normal B-type helical roll, a significant increase was reported for C4/αA5 (24°). This, together with the greater variation in twist for αA5/C6 (23°), contributes to the larger kink for the CαAC duplex.
Fig. 9.
Core of the NMR structures for the CαAC (αA5 shown in red) and CαAG (αA5 shown in orange) duplexes. A model of a CAG duplex (A5 shown in green) is shown for comparison (PDB entries: CαAC, 1S75; CαAG, 2LIB). Row a highlights differences in the roll for bases flanking αA. Row b shows the observed variations in stacking interactions. In row c, the base C4 is fixed for all sequences to highlight the structural changes (e.g., kink) imparted by changing the base at position 6. In each case, CαAG (orange) exhibits a more subtle perturbation compared to CαAC (red).
For both duplexes, the unusual helical parameters result in an enlargement of the minor groove at the site of the lesion (~9 Å), although for the CαAG duplex the effect is more confined to αA (Fig. 6b). Collectively, in the CαAC duplex, the perturbations create an 18° kink in the helical axis. In contrast, the CαAG duplex helical parameters are more regular and a “kink” of only 4–5° is estimated.
MD simulations
We have explored whether unrestrained MD simulations could accurately predict or conserve the traits observed in the structures. Using either parm99 or parmBSC0 force fields in 30 -ns solvated dynamic simulation preserved the intrahelical orientation of αA and overall base pairing; however, the key features (enlargement of the minor groove and kink in the helical axis) were not maintained. This underscores the importance of using experimental data to determine subtle structural effects with commonly used AMBER force fields. Interestingly, variation in the R.M.S.D. of the heavy atoms of αA5 and T16 suggests a higher degree of mobility for the CαAC duplex compared to that of the CαAG duplex (Table 3). This would correlate with the observed trends in base pairing of αA5–T16 and nearby sugar puckering dynamics.
Table 3.
Variation of heavy atom R.M.S.D. for αA5 and T16 nucleosides during MD simulations
| Force field | CαAC | CαAG |
|---|---|---|
| parmbsc0 | 0.183 | 0.127 |
| parm99 | 0.128 | 0.088 |
The parmbsc0 force field simulations were 30 ns in length with backbone and Watson–Crick restraints on the two terminal base pairs. Simulations utilizing the parm99 force field were 5 ns in length and unrestrained.
Discussion
αA is mutagenic and directs the incorporation of dC, dA, or dT in vitro,8 while in vivo, single-nucleotide deletions are observed.7 We have previously shown that the incorporation of a single αA into a DNA decamer duplex within a CαAC motif alters the structure by introducing an 18° kink into the major groove and also enlarging the minor groove by ~3 Å at the site of the lesion.5 These features are thought to facilitate recognition and aid in the formation of the enzyme complex. Unique kinetic data for endonuclease IV is observed for the CαAG motif compared to the other flanking sequences. This firmly establishes the importance of the sequence context in αA damage detection and processing by endonuclease IV (Table 1).
For the CαAG substrate, an elevated KM is observed compared to other sequences, even though this substrate was not distinguished by unique thermodynamic stability (Table 1). With kcat being relatively slow, KM is primarily determined by the KD and thus reflects the binding affinity. The differences in the affinity for the substrates may be in part due to the difference in the energetic cost of bending the substrate by endonuclease IV.
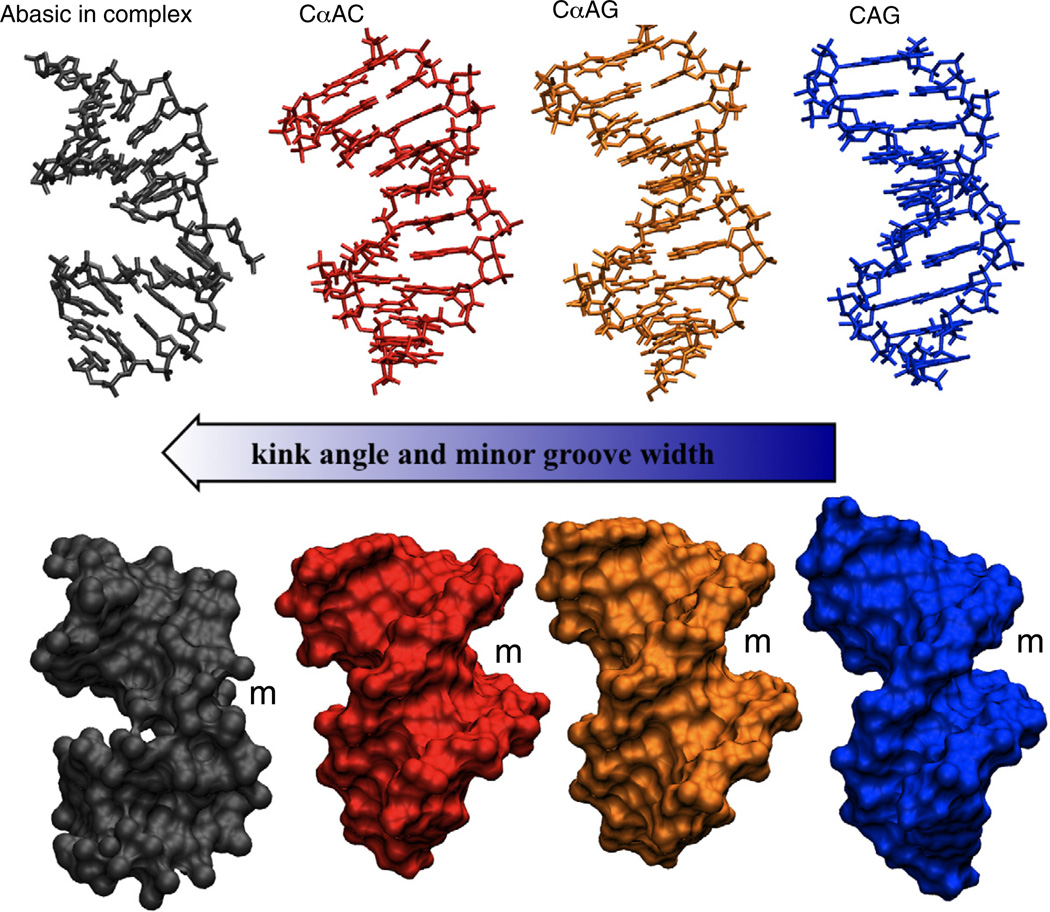
In this study, we have sought to correlate known flanking sequence effects with structural parameters that alter the substrate quality for endonuclease IV. Comparing the structures of the CαAG and previously determined CαAC duplexes, we have found relevant differences between the two substrates. While both substrates exhibit altered helical parameters and an enlarged minor groove, the less well recognized CαAG duplex is overall more subtly perturbed (Figs. 9 and 10). The differences are illustrated for the CαAG structure by the observed essentially straight helical axis, base pairing of αA5-T16, and more limited disturbance to the DNA minor groove. Analysis of the local structural reveals that these features are due to differences in the base slide, tilt, roll, and twist. Together, this results in a more B-type helical duplex compared to the previous CαAC structure (Fig. 10).
Fig. 10.
Comparison of structures: abasic substrate from the crystal complex structure 1QUM (gray),7 CαAC (red), and CαAG (orange) structures, and a model of a CAG (blue) duplex. The structures are arranged in order on the basis of the severity of the distortion of the helix. The location of the minor grooves are indicated by an m.
The reduced perturbation due to αA in the CαAG motif can be rationalized by the stacking of the guanosine at the 3′ side of the lesion. This stacking interaction promotes the formation of a reverse Watson–Crick base pair between αA5 and T16 and minimizes the displacement of C4 (Figs. 8 and 9). The free substrate structure does not directly provide a measurement of the energetic cost for driving the DNA to enzyme-bound conformation. However, it appears reasonable that different stacking interactions at the site of the lesion will at least in part determine the energetics of DNA bending and base flipping. Consequently, a better base-stacked duplex will require more energy for deformation, which provides a rationale for the observed modulation of endonuclease IV activity (Fig. 10). Additionally, a more B-like helical topology may hamper detection in vivo.
Materials and Methods
DNA synthesis and purification
Standard DNA phosphoramidites were purchased from Glen Research, and DMT α-deoxy adenosine (n-bz) CED phosphoramidite was obtained from ChemGenes Corp. Oligonucleotides were synthesized on an Applied Biosystems 391 DNA Synthesizer and processed as described previously.20 Following deprotection, oligonucleotides were lyophilized and purified by ion exchange using a PRP-1 column and 10 mM NaOH gradient followed by size-exclusion chromatography.21 Duplexes were prepared using extinction coefficients derived from the sum of mononucleotides (absorbance at 260 nm, 80 °C, in 10 mM sodium phosphate) as described in previous work.5 For all NMR experiments, samples were prepared in 10 mM sodium phosphate, 50 mM NaCl, and 0.3 mM ethylenediaminetetraacetic acid (EDTA). Water samples (90% H2O/10% D2O) were ~0.75 mM DNA duplex at pH 6.6. Samples in D2O were ~0.75 mM DNA duplex at pH* 7.05. For RDC experiments, pf1 bacterial phage was purchased from Asla and prepared as previously described.5 The 0.75 mM sample was divided into two aliquots and prepared pf1 (~38 mg/ml) was added to one of the samples (~0.4 mM DNA duplex). The deuterium splitting at 298 K was 18.3 Hz.
Enzyme activity and processing
Escherichia coli endonuclease IV was expressed and purified as described previously.22 The oligonucleotides containing the α dA lesion were 5′ end-labeled with [32P] ATP (New England Nuclear) and T4 polynucleotide kinase (New England Biolabs) using standard conditions and subsequently purified by means of a Pharmacia G-25 spin column. The labeled oligonucleotides were then annealed with a 1.2-fold excess of its complementary strand. Unlabeled substrates were made by annealing equal concentrations of strands. Cleavage reactions were run for 100, 250, 400, 800, and 1200 nM substrate, respectively. Wild-type E. coli endonuclease IV was diluted to a concentration of 40 nM in 2× reaction buffer consisting of 100 mM Hepes–KOH (pH 7.6), 100 mM KCl, 2 mM dithiothreitol, and 20% glycerol and preequilibrated at 28 °C. Five microliters of the prepared enzyme was added to each of the substrate tubes resulting in 10 µL reaction volumes. Reactions proceeded for 30 min at 28°C, were terminated by addition of 10 µL of 2× stop buffer (98% formamide, 10 mM EDTA, and 0.25% each of bromophenol blue and xylene cyanol), and immediately transferred into a dry ice–EtOH bath. Prior to loading onto a 20% denaturing polyacrylamide gel, samples were boiled for 15 min. The proportions of uncleaved substrate and cleaved product was determined with a Molecular Dynamics Phosphorimager. Band intensities were determined and quantified with ImageQuant (5.0). Kinetic parameters KM and Vmax were obtained by nonlinear regression analysis using the Enzyme Kinetics Module (1.1) of SigmaPlot (7.0).
Melting temperature studies
TM values were derived from a six-parameter fit of UV melting curves, recorded on a Cary 100, for a total strand concentration (CT) ranging from 7 to 102 µM, in 10 mM sodium phosphate, 500 mM NaCl, and 0.1 mM EDTA at pH 7.0. The enthalpy was obtained from the concentration dependence of the TM values and entropy. ΔS and TM (at 10 µM CT) were calculated using an equation for the biomolecular association of non-self-complementary strands as previously described.6
NMR spectroscopy
NMR experiments were performed on a Bruker Avance 500 spectrometer equipped with a TXI 1H{13C, 15N}20 cryoprobe and a Bruker Avance 600 spectrometer and a 5 -mm QXI 1H{31P,13C,15N} probe (Bruker). Acquisition and processing parameters are similar to those described in earlier studies5 with the following variables. For experiments in D2O, NOESY spectra were collected with mixing times of 75 , 125 , and 250 ms with an 8 s delay to ensure relaxation of aromatic protons; 1H–31P correlation (HPCOR)23 spectra were strip-transformed and processed with a shifted sine bell multiplication in both dimensions (SSB=2). For water experiments, a 1-1 jump and return and a 1-1 jump and return NOESY with a 150 ms mixing time were used with a 0.3 -s delay at 298 and 280 K. Assignment and integration of 2D spectra were done using SPARKY 3.33 (UCSF).24 1H and 31P were referenced to internal 2,2-dimethyl-2-silapentane-5-sulfonate (DSS) and external 85% H3PO4 (capillary in D2O), respectively. Constant-time NOESY (CT NOESY)25 experiments were collected using a 12 ms REBURP pulse to select the sugar (H3′) region. Heteronuclear f2 coupled 13C–1H (HSQC) spectra were recorded for sugars (13C range, 65–105 ppm) and bases (13C range, 125–175 ppm) in the presence and absence of pf1 phage.
Starting structure
The standard B helical DNA duplex was constructed in NUCGEN (AMBER 9.0).26 Xleap was used to modify A5 to αA (inversion of the base and H1′ at the C1′ position). Sodium ions were added to neutralize the phosphodiester backbone, and the system was solvated in a box with at least 8.0 Å from the edge of the solute to the edge of a box with ~3200 TIP3P water molecules. No modifications were made to the parm99 force field.
Structure determination
1H resonances were assigned via 2D 1H NOESY pathways with the assistance of total correlated spectroscopy (TOCSY) spectra. 31P resonances were assigned on the basis of HPCOR experiments. NOESY cross-peak volumes were integrated in SPARKY24 using a Gaussian or sum over box method. A percentage error was manually assigned on the basis of visual inspection of a projected cross-slice overlaid with the integral trace. For unresolved peaks, a sum over box integration method was used and a higher percentage error was assigned. Quantitative distance restraints were derived with an iterative RANDMARDI procedure using CORMA,27 MARDIGRAS,27 and AMBER cycles, as described previously.20 RX values were calculated in CORMA using correlation times (τC) of 2.5, 3.2, 3.5 and 4.0 ns for base and sugar protons. The overall lowest values were obtained for τC=3.2 ns. DNA sugar pucker and pseudorotation angles were assessed with a graphical method.28 3JH1′–H2′1, 3JH1′–H2′2, 3JH1′–H3′, ΣH1′, and ΣJH3′ were measured from 31P decoupled low flip angle COSY and double-quantum filtered COSY experiments. Pseudorotation angles were derived for the dominant form of each deoxyribose and converted to torsion angle NMR restraints with the PUCKER script in AMBER 9.0.
Backbone ε torsion restraints for all residues were calculated on the basis of the ratio of peak heights from constant-time NOESY experiments.25 For backbone torsion angles α, β, γ, and ζ, broad torsion restraints were generated for nucleotides with standard 31P chemical shifts using standard values for a B-type DNA helix and left unrestrained for the αA5-P-G6 backbone.29
RDC restraints were derived from 1J13C–1H values measured in the f2 dimension in the presence and absence of pf1 (Δ 1J13C–1H values ranged from −2.7 to +14.1 Hz). RDC restraints were implemented as previously described.20 Fully restrained (including RDC) solvated MD simulations were run for 10 ns with a parm99 force field. Final ensembles were generated by sampling one structure per picosecond at the end of the simulation followed by individual fully restrained minimization (rEM). The final structure was selected on the basis of overall lowest-restraint violations, and structural parameters were measured with CURVES 5.1.30
MD simulations
MD simulations were calculated for the CαAG and CαAC 10-mer DNA duplexes using both the parmbsc031 and the parm99 force field. Simulations were started using the final structure of the CαAG DNA duplex and the previously published structure of CαAC.5 R.M.S.D. values were measured for the heavy atoms of sugars and bases for the A5 and T16 base pair with ptraj from the AMBER 9.0 suite.
Atomic coordinates
Structural coordinates have been deposited in the Protein Data Bank with ID 2LIB. NMR restraints and parameters were deposited in the Biological Magnetic Resonance Bank with accession number 17887.
Supplementary Material
Acknowledgements
C.N.J. and A.M.S. were supported by the Brain and Behavior and Molecular Basis of Disease program at Georgia State University, respectively. M.W.G. was supported by the Georgia Cancer Coalition. The research at the University at Albany was supported by NIH grants GM46312 and CRR1 C06RR0154464 to R.P.C.
Abbreviations used
- αA
α-anomeric adenosine
- NOE
nuclear Overhauser enhancement
- NOESY
NOE spectroscopy
- HSQC
heteronuclear single-quantum coherence
- RDC
residual dipolar coupling
- MD
molecular dynamics
- EDTA
ethylenediaminetetraacetic acid
- COSY
correlated spectroscopy
Footnotes
Supplementary Data
Supplementary data to this article can be found online at doi:10.1016/j.jmb.2011.12.051
References
- 1.Sancar A. DNA excision repair. Annu. Rev. Biochem. 1996;65:43–81. doi: 10.1146/annurev.bi.65.070196.000355. [DOI] [PubMed] [Google Scholar]
- 2.Selby CP, Sancar A. Structure and function of the (A)BC excinuclease of Escherichia coli. Mutat. Res. 1990;236:203–211. doi: 10.1016/0921-8777(90)90005-p. [DOI] [PubMed] [Google Scholar]
- 3.Hegde ML, Hazra TK, Mitra S. Early steps in the DNA base excision/single-strand interruption repair pathway in mammalian cells. Cell Res. 2008;18:27–47. doi: 10.1038/cr.2008.8. [DOI] [PMC free article] [PubMed] [Google Scholar]
- 4.Aramini JM, Van de Sande J, Germann M. Structure and stability of DNA containing inverted anomeric centers and polarity reversals. A.C.S. Symp. Ser. 1998;682:92–105. [Google Scholar]
- 5.Aramini JM, Cleaver S, Pon R, Cunningham R, Germann M. Solution structure of a DNA duplex containing an α-anomeric adenosine: insights into substrate recognition by endonuclease IV. J. Mol. Biol. 2004;338:77–91. doi: 10.1016/j.jmb.2004.02.035. [DOI] [PubMed] [Google Scholar]
- 6.Aramini JM, Germann M. Solution structure of a DNA·RNA hybrid containing an α-anomeric thymidine and polarity reversals: d(ATGG-3′-3′-αT-5′- 5′-GCTC) r (gagcaccau) Biochemistry. 1999;38:15448–15458. doi: 10.1021/bi9915418. [DOI] [PubMed] [Google Scholar]
- 7.Shimizu H, Yagi R, Kimura Y, Makino K, Terato H, Ohyama Y, Ide H. Replication bypass and mutagenic effect of α-deoxyadenosine site-specifically incorporated into single-stranded vectors. Nucleic Acids Res. 1997;25:597. doi: 10.1093/nar/25.3.597. [DOI] [PMC free article] [PubMed] [Google Scholar]
- 8.Ide H, Tedzuka K, Shimizu H, Kimura Y, Purmal A, Wallace S, Kow Y. α-Deoxyadenosine, a major anoxic radiolysis product of adenine in DNA, is a substrate for Escherichia coli endonuclease IV. Biochemistry. 1994;33:7842–7847. doi: 10.1021/bi00191a011. [DOI] [PubMed] [Google Scholar]
- 9.Germann M, Johnson C, Spring A. Recognition of damaged DNA: structure and dynamic markers. Med. Res. Rev. 2010 doi: 10.1002/med.20226. [DOI] [PubMed] [Google Scholar]
- 10.Tell G, Quadrifoglio F, Tiribelli C, Kelley MR. The many functions of APE1/Ref-1: not only a DNA repair enzyme. Antioxid. Redox Signal. 2009;11:601–619. doi: 10.1089/ars.2008.2194. [DOI] [PMC free article] [PubMed] [Google Scholar]
- 11.Ishchenko A, Ide H, Ramotar D, Nevinsky G, Saparbaev M. α-Anomeric deoxynucleotides, anoxic products of ionizing radiation, are substrates for the endonuclease IV-type AP endonucleases. Biochemistry. 2004;43:15210–15216. doi: 10.1021/bi049214+. [DOI] [PubMed] [Google Scholar]
- 12.Garcin E, Hosfield D, Desai S, Haas B, Björas M, Cunningham R, Tainer J. DNA apurinic–apyrimidinic site binding and excision by endonuclease IV. Nat. Struct. Mol. Biol. 2008;15:515–522. doi: 10.1038/nsmb.1414. [DOI] [PubMed] [Google Scholar]
- 13.Hosfield D, Guan Y, Haas B, Cunningham R, Tainer J. Structure of the DNA repair enzyme endonuclease IV and its DNA complex: doublenucleotide flipping at abasic sites and three-metalion catalysis. Cell. 1999;98:397–408. doi: 10.1016/s0092-8674(00)81968-6. [DOI] [PubMed] [Google Scholar]
- 14.Mazurek A, Johnson C, Germann M, Fishel R. Sequence context effect for hMSH2–hMSH6 mismatch-dependent activation. Proc. Natl Acad. Sci. USA. 2009;106:4177. doi: 10.1073/pnas.0808572106. [DOI] [PMC free article] [PubMed] [Google Scholar]
- 15.Cai Y, Kropachev K, Xu R, Tang Y, Kolbanovskii M, Kolbanovskii A, et al. Distant neighbor base sequence context effects in human nucleotide excision repair of a benzo[a]pyrene-derived DNA lesion. J. Mol. Biol. 2010;399:397–409. doi: 10.1016/j.jmb.2010.04.004. [DOI] [PMC free article] [PubMed] [Google Scholar]
- 16.Lavery R, Zakrzewska K, Beveridge D, Bishop TC, Case DA, Cheatham T, et al. A systematic molecular dynamics study of nearest-neighbor effects on base pair and base pair step conformations and fluctuations in B-DNA. Nucleic acids Res. 2010;38:299. doi: 10.1093/nar/gkp834. [DOI] [PMC free article] [PubMed] [Google Scholar]
- 17.Wuthrich K. NMR of Proteins and Nucleic Acids. New York: Wiley Interscience; 1986. [Google Scholar]
- 18.Bhattacharyya D, Bansal N. Groove width and depth of D-DNA structures depend on local variation in slide. J. Biomol. Struct. Dyn. 1992;10:213–236. doi: 10.1080/07391102.1992.10508639. [DOI] [PubMed] [Google Scholar]
- 19.Aramini JM, Kalisch BW, Pon RT, van de Sande JH, Germann MW. Structure of a DNA duplex that contains α-anomeric nucleotides and 3′-3′ and 5′-5′ phosphodiester linkages: coexistence of parallel and antiparallel DNA. Biochemistry. 1996;35:9355–9365. doi: 10.1021/bi960612p. [DOI] [PubMed] [Google Scholar]
- 20.Johnson C, Spring A, Shaw BR. Structural basis of the RNase H1 activity on stereo regular borano phosphonate DNA/RNA hybrids. Biochemistry. 2011;50:3903–3912. doi: 10.1021/bi200083d. [DOI] [PMC free article] [PubMed] [Google Scholar]
- 21.van de Sande J, Ramsing N, Germann M, Elhorst W, Kalisch B, von Kitzing E, et al. Parallel stranded DNA. Science. 1988;241:551–557. doi: 10.1126/science.3399890. [DOI] [PubMed] [Google Scholar]
- 22.Haas BJ, Sandigursky M, Tainer JA, Franklin WA, Cunningham RP. Purification and characterization of Thermotoga maritima endonuclease IV, a thermostable apurinic/apyrimidinic endonuclease and 3′-repair diesterase. J. Bacteriol. 1999;181:2834. doi: 10.1128/jb.181.9.2834-2839.1999. [DOI] [PMC free article] [PubMed] [Google Scholar]
- 23.Sklenar V, Miyashiro H, Zon G, Todd Miles H, Bax A. Assignment of the 31P and 1H resonances in oligonucleotides by two-dimensional NMR spectroscopy. FEBS Lett. 1986;208:94–98. doi: 10.1016/0014-5793(86)81539-3. [DOI] [PubMed] [Google Scholar]
- 24.Goddard T, Kneller D. SPARKY 3. San Francisco, CA: University of California; 2008. [Google Scholar]
- 25.Wu Z, Tjandra N, Bax A. Measurement of 1H3′-31P dipolar couplings in a DNA oligonucleotide by constant-time NOESY difference spectroscopy. J. Biomol. NMR. 2001;19:367–370. doi: 10.1023/a:1011292803363. [DOI] [PubMed] [Google Scholar]
- 26.Case D, Darden T, Cheatham T, III, Simmerling C, Wang J, Duke R, et al. AMBER 9.0. San Francisco, CA: University of California; 2006. [Google Scholar]
- 27.Borgias BA, James TL. COMATOSE, a method for constrained refinement of macromolecular structure based on two-dimensional nuclear Overhauser effect spectra. J. Magn. Reson. 1988;79:493–512. 1969. [Google Scholar]
- 28.Rinkel LJ, Altona C. Conformational analysis of the deoxyribose furanose ring in DNA by means of sums of proton–proton coupling constants: a graphical method. J. Biomol. Struct. Dyn. 1987;4:621–649. doi: 10.1080/07391102.1987.10507665. [DOI] [PubMed] [Google Scholar]
- 29.Blackburn GM, Gait MJ, Loakes D, Williams DM. Nucleic Acids in Chemistry and Biology. 3rd edit. Cambridge, UK: The Royal Society of Chemistry; 2006. [Google Scholar]
- 30.Ravishanker G, Swaminathan S, Beveridge DL, Lavery R, Sklenar H. Conformational and helicoidal analysis of 30ps of molecular dynamics on the d(CGCGAATTCGCG) double helix:“curves”, dials and windows. J. Biomol. Struct. Dynam. 1989;6:669–699. doi: 10.1080/07391102.1989.10507729. [DOI] [PubMed] [Google Scholar]
- 31.Alberto P. Refinement of the AMBER force field for nucleic acids: improving the description of α/γ conformers. Biophys. J. 2007;92:3817–3829. doi: 10.1529/biophysj.106.097782. [DOI] [PMC free article] [PubMed] [Google Scholar]
Associated Data
This section collects any data citations, data availability statements, or supplementary materials included in this article.


