

SUMMARY
Rhabdomyosarcoma (RMS) is an aggressive skeletal muscle-lineage tumor composed of malignant myoblasts that fail to exit the cell cycle and are blocked from fusing into syncytial muscle. Rhabdomyosarcoma includes two histolopathologic subtypes: alveolar rhabdomyosarcoma, driven by the fusion protein PAX3-FOXO1 or PAX7-FOXO1, and embryonal rhabdomyosarcoma (ERMS), which is genetically heterogeneous. Here, we show that adipocyte-restricted activation of Sonic Hedgehog signaling through expression of a constitutively active Smoothened allele in mice gives rise to aggressive skeletal muscle tumors that display the histologic and molecular characteristics of human ERMS with high penetrance. Our findings suggest that adipocyte progenitors can be a cell of origin for Sonic Hedgehog-driven ERMS, showing that RMS can originate from non-skeletal muscle precursors.
INTRODUCTION
Rhabdomyosarcoma (RMS) is an aggressive skeletal muscle-lineage malignancy and the most common soft tissue sarcoma in children (Barr and Womer, 2009). RMS is comprised of skeletal muscle precursors that fail to exit the cell cycle and are irreversibly blocked from differentiating into syncytial muscle. RMS is typically divided into two histopathologic subgroups, each with distinct clinical features: Embryonal RMS (ERMS), which is the more common subtype, and Alveolar RMS (ARMS), which is notoriously more aggressive. The genetic lesions that initiate ARMS are well known with three-quarters of ARMS tumors having chromosomal translocations that result in expressing fusion proteins combining the DNA binding domain of either PAX3 or PAX7 transcription factors with the transcriptional activation domain of FOXO1A (Barr, 2001). Since, PAX3 and PAX7 have critical roles in normal muscle development, the fusion proteins presumably use the DNA binding domains of the PAX proteins to drive malignant myogensis-related developmental programs (Galindo et al., 2006; Keller and Capecchi, 2005; Wang et al., 2008). ERMS accounts for 75% of RMS cases and is associated with younger age of onset (typically under 10 years) and demonstrates a predilection for tissues of the head and neck. The molecular underpinnings and cellular origins of ERMS remain poorly understood. Although most cases of ERMS occur as sporadic, non-heritable tumors, ERMS also associates with familial syndromes caused by mutations in prominent oncogenesis-related signaling pathways such as p53, Ras, and Sonic Hedgehog (Shh)(Estep et al., 2006; Johnson et al., 1996; Li and Fraumeni, 1969).
The Shh pathway is an evolutionarily conserved signaling pathway with noted roles in development and in tumorigenesis. Normally, in the absence of extracellular Shh ligand, the Shh signaling pathway is inhibited by the Patched (Ptch) transmembrane receptor, which dominantly represses the Smoothened (Smo) G-protein coupled receptor. Upon binding of Shh to Ptch, Smo is freed from Ptch-mediated inhibition and activates the Gli family of transcription factors (Gli1, Gli2, and Gli3) that then drive patterns of gene expression critical for various aspects of development (Lum and Beachy, 2004). Shh-associated diseases include nevoid basal cell carcinoma syndrome (Gorlin syndrome), an autosomal dominant condition caused by heterozygous germ-line mutations in PTCH1 which drives basal cell carcinoma, medulloblastoma and ERMS. Activation of the Shh pathway is also found in spontaneous ERMS tumors, associating with either loss of Shh pathway negative regulators, such as PTCH1 or PTCH2 or Suppressor of Fused (SUFU), or by the activation of the downstream transcriptional effector of Shh signaling, Gli (Paulson et al., 2011; Tostar et al., 2006).
Consistent with human ERMS, introducing Shh pathway activating mutations in mouse models induces tumorigenesis. Transgenic mice with heterozygous deletion of Ptch1 develop tumors histologically consistent with ERMS, but with a low level of penetrance (10%) (Corcoran and Scott, 2001; Hahn et al., 2000). Mice with heterozygous loss of Sufu in combination with p53 loss develop ERMS with 9% penetrance (Lee et al., 2007). The most robust mouse model of ERMS utilizes a conditional, constitutively activate Smo allele (SmoM2) initiated by a ubiquitously expressed, inducible Cre transgene, CAGGS-CreER (Mao et al., 2006). While these models point to the involvement of the Shh pathway in the pathogenesis of ERMS, the varied anatomic location, relatively low penetrance of tumorigenesis and occurrence of other tumor types in these models limit their usefulness as a pre-clinical platform. We have generated a transgenic mouse model in which overexpression of the oncogenic SmoM2 allele in the adipocyte-restricted aP2 lineage induces tumors that closely resemble human ERMS.
RESULTS
SmoM2 Expression in the aP2 Lineage Causes ERMS
We initially sought to explore the role of Shh signaling in adipocyte development and metabolism, using an adipose protein 2 (aP2)-Cre transgenic driver (Tang et al., 2008) to conditionally express constitutively activated Smoothened, SmoM2 (Mao et al., 2006) in an adipocytic-specific pattern (Figure 1A). Surprisingly, 80% of mice with the genotype aP2-Cre;SmoM2/+ developed large, aggressive tumors in the head and ventral neck by 2 months of age (Figure 1B, C). The tumors ranged in greatest diameter from 1 to 2 cm, were tan/pink/white and solid upon sectioning, and well demarcated from the surrounding non-neoplastic tissue. Histologic examination revealed ERMS-type morphology: the tumors displayed dense cellularity, comprised of a spectrum of cells that were small and round to cells that were elongated and spindled, with brightly eosinophilic cytoplasm, pleomorphic nuclei and visible cross-striations (Figure 1D, E). Immunohistochemistry (IHC) for Ki67 showed that the tumor cells were briskly mitotic (Figure 1F). IHC also revealed strong expression of the muscle-specific intermediate filament Desmin and nuclear staining for the muscle-specific transcription factors Myogenin and MyoD1 (Figure 1G–I). These findings are diagnostic for RMS.
Figure 1. ERMS caused by activation of the Sonic Hedgehog pathway in the aP2 lineage.

(A) Schematic of the conditional SmoM2 allele and aP2-Cre mediated recombination.
(B) Gross view of tumors in aP2-Cre;SmoM2 mice.
(C) Kaplan-Meier survival curves illustrated tumor-free survival of aP2-Cre;SmoM2/+ mice (blue line, n = 47) compared to SmoM2/+ littermate controls (red line, n = 19) (p = <0.0001).
(D) Cross-sectional histology of tumors with H&E staining. Arrow points to rhabdomyoblast and arrowhead points to strap cell. (E) Masson’s trichrome. (F-I) Sections of tumors immunostained with Ki67, a marker of proliferating cells (F), and Desmin (G), MyoD1 (H), and Myogenin (I), diagnostic of ERMS. Scale bar = 50 μm (D,E,G-I) and 200 μm (F). See also Figure S1.
Extensive analyses of the activity of this promoter in transgenic mice have documented its specificity for the adipocyte lineage and its exclusion from the skeletal muscle lineage (He et al., 2003; Ross et al., 1990; Tang et al., 2008; Urs et al., 2006). Thus, it was surprising to observe RMS tumorigenesis in aP2-Cre;SmoM2 mice. To test whether aP2-Cre activation of the SmoM2 allele altered or interfered with normal skeletal muscle and/or adipose development, we performed histologic analysis of the sternocleidomastoid (SCM), quadriceps femoris, intrascapular brown fat and inguinal white fat from 4- to 8-week old aP2-Cre;SmoM2/+ and SmoM2/+ control mice. We observed no gross abnormalities in muscle or adipose tissue in either cohort (Figure S1). Therefore, activation of the hedgehog pathway by aP2-Cre mediated expression of the SmoM2 allele did not evoke general defects in myogenesis or adipogenesis.
Activation of Hedgehog signaling in aP2-Cre;SmoM2/+ tumors
We analyzed in vivo the expression of the Cre-responsive R26-LacZ reporter to confirm that the RMS tumors originate from cell autonomous activation of the SmoM2 allele. Intense, homogenous β-galactosidase staining of the tumors revealed that they formed as a consequence of cell autonomous activation by aP2-Cre (Figure 2A). Next, to confirm that the Shh pathway was activated in tumors of aP2-Cre;SmoM2+ mice, we compared the expression of Shh target genes in control muscle and tumor tissue from both aP2-Cre;SmoM2/+ and SmoM2/+ littermates. The tumors exhibited increased expression of Smo and Shh responsive genes, including Gli1, Gli3, and Ptch1 (Figure 2B) while gene expression in SCM muscle was unchanged. These findings indicate that the Shh pathway is robustly activated in the ERMS tumors but not in the non-neoplastic skeletal muscle of the aP2-Cre;SmoM2/+ mice, suggesting an origin of tumorigenesis distinct from skeletal muscle lineage precursors.
Figure 2. Sonic-Hedgehog activation in aP2-Cre;SmoM2 tumors.

(A) β-Galactosidase enzymatic staining of cross sections of aP2-Cre;SmoM2;R26-LacZ reporter mouse tumors and aP2-Cre;SmoM2 tumors illustrating broad homogeneous staining. Scale bar = 5 mm.
(B) Increased expression on Sonic hedgehog pathway target genes in the aP2-Cre;SmoM2/+ tumors compared to mature SCM of aP2-Cre;SmoM2/+ and S M2/+ mo animals by real time PCR. Data are shown as fold change of gene expression normalized to 18S and expressed relative to SCM of SmoM2/+. Results are mean ± SEM (n = 4). p values by two-tailed, unpaired Student’s t-test are as follows: Smo (p = 0.0015), Gli1 (p < 0.0001), Gli3 (p < 0.0001), and Ptch1 (p < 0.0001).
(C, D) Expression of embryonic muscle development genes (C) and markers of terminally differentiated skeletal muscle (D) in aP2-Cre;SmoM2/+ tumors compared to mature SCM as detected by real time PCR. Data are shown as fold change of gene expression normalized to 18S and expressed relative to SCM of SmoM2/+. Results are mean ± SEM (n = 3). p values by two-tailed, unpaired Student’s t-test are as follows: MyoD1 (p = 0.0011), Myogenin (p = 0.0007), Pax7 (p = 0.0009), Myf5 (p = 0.0039), Myh3 (p = 0.0165), Myh8 (p = 0.0007), Myh1 (p < 0.0001), Myh4 (p < 0.0001), and Ckm (p < 0.0001).
aP2-Cre;SmoM2/+ Tumors Display an Embryonal Muscle Gene Signature
To further determine the extent to which the aP2-Cre;SmoM2/+ tumors resembled ERMS, we isolated RNA from tumor tissue and compared the gene expression profile to that of SCM skeletal muscle of SmoM2/+ littermates. Skeletal muscle regulatory genes (MyoD1, Myogenin, Pax7, and Myf5) and embryonic and perinatal myosins (Myh3 and Myh8) displayed markedly increased expression in the aP2-Cre;SmoM2/+ tumors when compared to the SCM (Figure 2C). In contrast, markers of mature, differentiated skeletal muscle (Myh1, Myh4 and Ckm) were dramatically diminished in aP2-Cre;SmoM2/+ tumors when compared to SCM (Figure 2D). This embryonal muscle gene expression pattern is consistent with mouse and human ERMS and is indicative of an arrested skeletal myoblastic tissue.
Gene Expression Profiling of aP2-Cre;SmoM2 Tumors
To further characterize the tumors of the aP2-Cre;SmoM2+ mice, we used mRNA expression profiling to compare the gene expression profiles of aP2-Cre;SmoM2/+ tumors and SCM. The transcriptome of the aP2-Cre;SmoM2/+ tumors was distinct from that of SCM using principle component analysis to group samples based on gene expression (Figure 3A). Focusing on changes of gene expression with a log2 ratio greater than 2.5 and a p value less that 0.0001 by Bonferroni, we identified 100 genes that were differentially expressed between aP2-Cre;SmoM2/+ tumors and normal SCM of SmoM2/+ littermates (Figure 3B, C). Consistent with the developing muscle gene pattern, we noted that perinatal myosin heavy chain Myh8 was among the genes expressed at high levels in the tumors compared to normal SCM and mature myosin heavy chain Myh4 was among the genes that exhibited low expression in the tumors compared to SCM (Figure 3B and Figure 2). These analyses also identified several other genes previously shown to play a role in RMS pathogenesis, including Igf2, Dlk1, Ankrd1, Chrng, and Ncam1 (El-Badry et al., 1990; Gattenloehner et al., 1998; Gluer et al., 1998; Ishiguro et al., 2008; Rezvani et al., 2012). Real Time PCR validation of the array is shown in Figure S2A.
Figure 3. Comparative Transcriptome Analysis of Mouse ERMS and Skeletal Muscle.

(A) Principle component analysis (PCA). Three PCA coordinates describe 64.6% of the total data variation (PC1, 52.9%; PC2, 5.99%; PC3, 5.71%). Red, aP2-Cre;SmoM2/+ tumors (n = 12). Green, SmoM2/+ SCM (n = 3).
(B) Volcano plot of the Log10 of the p value versus the Log2 of the fold-difference in expression in the aP2-Cre;SmoM2/+ tumors compared to the normal skeletal muscle.
(C) Unsupervised hierarchical clustering analysis. Each column represents a distinct sample and each row represents a distinct gene.
(D) Comparison of aP2-Cre;SmoM2 tumors to published mouse ERMS models. 19,878 genes expressed in both the published mouse ERMS models and the aP2-Cre;SmoM2/+ tumors plotted on the graph. 67% of gene pairs show agreement in genes up-regulated (red) or down-regulated (green) between the previously published mouse ERMS models and the aP2-Cre;SmoM2 tumors. Spearman correlation = 0.59 and AGDEX = 0.71.
(E) Comparision of aP2-Cre;SmoM2/+ tumors to human ERMS. 13,282 genes expressed in both the published human ERMS and the aP2-Cre;SmoM2/+ tumors plotted on graph. 58% of orthologous gene pairs show agreement in genes up-regulated (red) or down-regulated (green) between the human ERMS and the aP2-Cre;SmoM2 tumors. Spearman correlation = 0.29 and AGDEX = 0.3. See also Figure S2.
During muscle development, a subset of myogenic progenitors foregoes terminal differentiation and instead become mononuclear satellite cells associated with the myofiber basal lamina. Muscle satellite cells are responsible for the postnatal growth, repair and maintenance of skeletal muscle (Seale and Rudnicki, 2000). Satellite cells remain quiescent until activated by muscle injury when they serve as muscle-specific stem cells that generate myogenic precursors and repair injured muscle (Shadrach and Wagers, 2011). Mice with loss-of-function of p53 and gain-of-function of the Shh pathway through the loss of Ptch1 in myoblasts and satellite cell lineages develop tumors that resemble human ERMS and display a gene expression signature consistent with satellite cell activation (Rubin et al., 2011). Interestingly, the tumors arising from the adipocyte-specific aP2-Cre driver expressed numerous genes associated with satellite cell activation (Fukada et al., 2007), including Rho GDP dissociation inhibitor gamma (Arhgdig), ankyrin repeat domain 1 (Ankrd1), (fetal) nicotinic cholinergic receptor gamma polypeptide (Chrng), distal-less homeobox 2 (Dlx2), hairy and enhancer of split (Hes6), low density lipoprotein receptor-related protein 4 (Lrp4), Otogelin (Otog), Secretin (Sct), troponin C (Tnnc1), troponin T1 (Tnnt1), cardiac troponin T2 (Tnnt2), and unc-5 homolog B (Unc5b) (Figure S2B). Twenty percent of all the genes with increased expression of 5-fold or greater in the aP2-Cre;SmoM2/+ tumors display increased expression in activated satellite cells compared to quiescent satellite cells. Thus, despite arising from the aP2 adipocyte lineage, the aP2-Cre;SmoM2/+ tumors displayed a gene expression profile similar to other murine ERMS models and activated satellite cells. These findings suggest that the satellite cell gene expression signature is likely reflective of the ERMS tumor pathology rather than the cell type of origin of the tumor.
To further test how the aP2-Cre;SmoM2/+ tumors resemble previously reported mouse ERMS models, we compared the gene expression pattern of our model to that of previously published mouse ERMS. The comparison group contained mouse tumors that developed from the conditional deletion of Ptch1flox/+ and Trp53flox/flox alleles with Myf5-Cre, Pax3-Cre, and Pax7-CreERp respectively (Rubin et al., 2011). Overall, 67% of the 19,878 probe pairs showed agreement in gene expression between our model and the previously published models (Figure 3D). Next, we used cross-species comparison of the mouse and human ERMS transcriptomes to determine how closely the aP2-Cre;SmoM2/+ tumors resemble the human ERMS. We observed a statistically significant match between the mouse aP2-Cre;SmoM2/+ tumors and the human ERMS (Figure 3E). 58% of the 13,282 ortholog gene pairs showed agreement in gene expression between the mouse and human tumors. Together these data confirm that the aP2-Cre;SmoM2/+ mouse tumors accurately model the transcriptome of both previously published mouse models and human ERMS.
Cooperativity between SmoM2 activation and Cdkn2a loss
The tumor suppressor CDKN2A is one of the most commonly mutated alleles in human cancer (Beroukhim et al., 2010; Bignell et al., 2010). Homozygous deletions of CDKN2A have been reported in ERMS (Chen et al., 2007; Iolascon et al., 1996; Paulson et al., 2011; Williamson et al., 2010). To test for potential cooperativity between Cdkn2a and Hedgehog-driven ERMS, we intercrossed a conditional Cdkn2aFlox allele into our model (Aguirre et al., 2003). aP2-Cre;Cdkn2aFlox/Flox mice did not develop ERMS, whereas deletion of Cdkn2a in aP2-Cre;SmoM2/+;Cdkn2aFlox/Flox mice triggered decreased latency and increased penetrance of tumorigenesis with all mice having tumors by 55 days (Figure 4). These results demonstrate that the Shh pathway and Cdkn2a can actively drive ERMS oncogenicity in vivo.
Figure 4. Cdkn2a loss cooperates in aP2-Cre;SmoM2 mouse tumors.

Kaplan-Meier survival curves illustrate tumor-free survival of aP2-Cre;SmoM2/+;Cdkn2aFlox mice (green line, n = 27) compared to data from figure 1C aP2-Cre;SmoM2/+ (blue line, n = 47) and SmoM2/+ littermate controls (red line, n = 19). p = 0.0337.
Sonic Hedgehog activation in the embryonic muscle lineage and post-natal satellite cells
We next crossed the SmoM2 allele to mice bearing several muscle lineage-restricted Cre-drivers to determine whether activation of the Shh pathway by expression of the SmoM2 oncogene in the muscle lineage would phenocopy the tumors of the aP2-Cre;SmoM2/+ mice. Activation of the SmoM2 allele early in muscle development with Myf5-Cre, Pax3-Cre, or MyoD1-Cre resulted in embryonic lethality without tumor formation, while mice with activation of SmoM2 in terminally differentiated skeletal muscle with MCK-Cre were viable with no evidence of tumorigenesis (Figure S3).
In contrast, activation of SmoM2 with Myogenin-Cre, which is specific for early muscle differentiation, resulted in tongue tumors in 100% of the mice (Figure 5A), but no tumors in the anterior neck, as seen in aP2-Cre;SmoM2/+ mice. Specifically, the Myogenin-Cre;SmoM2/+ mice were runted compared to littermates and were sacrificed between 19 and 39 days for lack of weight gain and ill appearance. None of the Myogenin-Cre;SmoM2/+ mice had visible tumors prior to sacrifice; however, all Myogenin-Cre;SmoM2/+ mice had tumors visible upon necropsy throughout the tongue (Figure 5B). The Myogenin-Cre;SmoM2/+ tumors appeared histologically similar to the aP2-Cre;SmoM2/+ tumors and stained positive both MyoD1 and Myogenin. We detected no significant difference in the gene expression profile of the Myogenin-Cre;SmoM2/+ tumors and the aP2-Cre;SmoM2/+ (Figure 5C&D). The embryonic lethality of SmoM2 expression early in muscle development with Myf5-Cre, Pax3-Cre, and MyoD1-Cre and the more aggressive phenotype with the Myogenin-Cre suggests that aP2-Cre does not globally activate SmoM2 expression in the muscle lineage.
Figure 5. Tongue ERMS in Myogenin-Cre;SmoM2 mice.

(A) Kaplan-Meier survival curves illustrated tumor-free survival of Myogenin-Cre;SmoM2/+ mice (green line, n = 12) and of MCK-Cre;SmoM2/+ (red line, n = 18) compared to tumor-free survival of aP2-Cre;SmoM2/+ from Figure 1C (blue line).
(B) Tumor histology. (a) Gross cross section of tongue with tumor outlined by white, dashed line. (b) H&E section illustrating cross striations. (c, d) Immunochemistry illustrating nuclear MyoD1 and Myogenin. Scale bars = 2 mm (a) and 50 μm (b, c, d).
(C) Principle component analysis for mouse Myogenin-Cre;SmoM2/+ tumors (green, n = 3) and aP2-Cre;SmoM2/+ tumors (red, n = 12).
(D) Volcano plot of the Log10 of the p value versus the Log2 of the fold-difference in expression in the aP2-Cre;SmoM2/+ tumors compared to the Myogenin-Cre;SmoM2/+ tumors. See also Figure S3.
Previous studies illustrate that satellite cells are a potential origin for ERMS (Hettmer et al., 2011; Rubin et al., 2011; Tiffin et al., 2003). Given the activated satellite cell signature of the aP2-Cre;SmoM2/+ tumors, we sought to formally test whether satellite cells are an origin of the aP2-Cre;Smo M2/+ tumors. The Pax7-CreERT2 allele allows for specific SmoM2 postnatal induction in both quiescent and activated satellite cells (Lepper et al., 2009). We crossed the SmoM2 mouse with the satellite cell Cre-driver, Pax7-CreERT2 and administered tamoxifen at day-of-life 1 or day-of-life 14 (Figure S3G). Gene expression from the SCM containing only a small fraction of satellite cells from the Pax7-CreERT2;SmoM2/+ and SmoM2/+ Cre-negative littermates revealed that the SmoM2 (that has a carboxy terminal YFP fusion) was activated following tamoxifen administration (Figure S3H). None of the Pax7-CreERT2;SmoM2/+ animals injected with tamoxifen at either day 1 (N = 8) or day 14 (N = 9) developed tumors by 150 days arguing against the satellite cell population as the origin of the ERMS in the aP2-Cre;SmoM2/+ model.
aP2-Cre is active in adipose tissue but not skeletal muscle
The development of tumors that resemble human ERMS from activation of the oncogenic SmoM2 allele in the aP2 adipocyte lineage was surprising. However, despite arising from the aP2 lineage, the aP2-Cre;SmoM2/+ tumors did not express aP2 or other genes of the adipocyte lineage (Figure S4A). Consistent with previous reports, we determined that aP2 is expressed in the progenitors from the stromal vascular fraction of brown adipose tissue (BAT) and white adipose tissue (WAT), as well as mature adipocytes. However, aP2 was not expressed from satellite cells or the SCM, gastrocnemius, or quadriceps femoris skeletal muscles (Figure S4B). The aP2-Cre transgenic used in this study was previously characterized and reported not to be expressed in the muscle lineage (Tang et al., 2008). Moreover, the identical 5.4 kb aP2 promoter element was previously shown to be adipose-specific and to result in hibernoma formation, not ERMS, when fused to simian virus 40 Large T antigen (He et al., 2003; Ross et al., 1992; Ross et al., 1990). Another aP2-Cre transgene containing the same 5.4 kb aP2 promoter has also been shown to be inactive in the muscle lineage but to be active primarily in BAT and WAT and in the developing cartilage, vertebra, and dorsal root ganglia (He et al., 2003; Urs et al., 2006).
To confirm the pattern of expression of aP2-Cre and to further define the origins of tumors in the aP2-Cre;SmoM2/+ mice, we again turned to aP2-Cre;R26-LacZ reporter mice. The aP2-Cre was activated in both BAT and WAT, but showed no detectable expression in skeletal muscle (Figure 6A), suggesting that RMS in these mice arises from a non-skeletal muscle origin. We compared the gene expression in isolated intrascapular BAT, inguinal WAT, SCM and gastrocnemius skeletal muscle, and tumor from the aP2-Cre;SmoM2/+ and SmoM2/+ Cre-negative littermates. Although the oncogenic SmoM2 allele was activated in the fat lineage, the tumors did not express adipocyte lineage genes such as aP2, Pparγ, and Ucp1 (Figure S4C–E). Also, the normal skeletal muscle from the aP2-Cre;SmoM2/+ mice did not display increased Smo and Shh target genes, suggesting that SmoM2 was not activated in the muscle lineage.
Figure 6. aP2-Cre expression in fat lineages and aP2-Cre;SmoM2 tumors in adipose tissue adjacent to muscle.
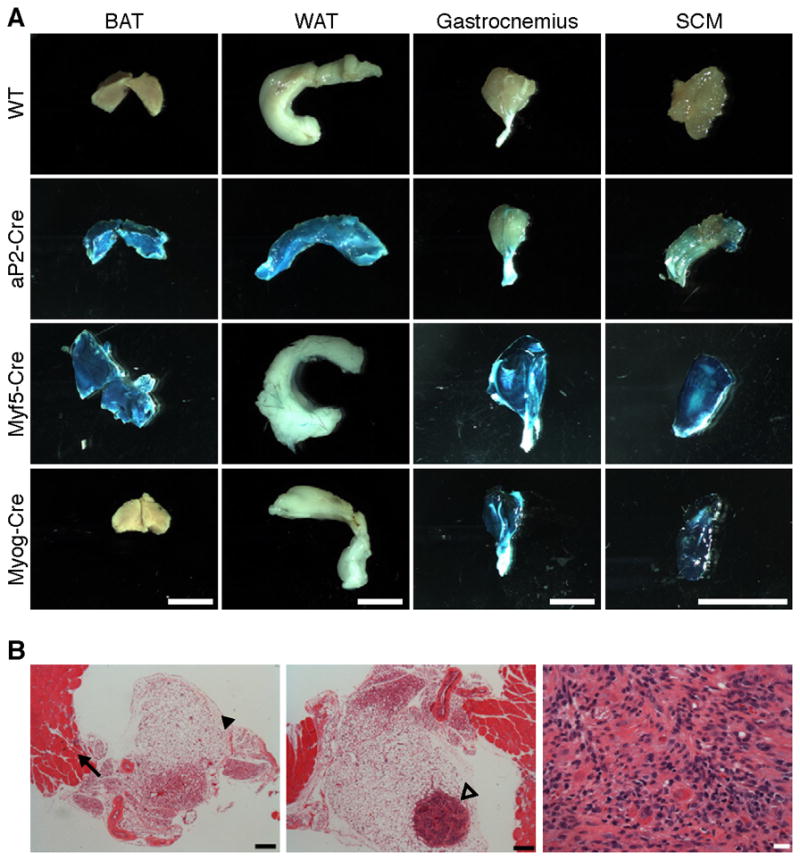
(A) Mice bearing Cre-drivers aP2-Cre, Myf5-Cre, and Myogenin-Cre were bred to R26-LacZ reporter mice. The BAT, WAT, gastrocnemius and SCM were isolated from P28 mice and stained with X-gal to determine β-galactosidase activity. Scale bars = 5 mm.
(B) Serial sections through neck tissue with a visible node at P14 on necropsy and stained with H&E. (left) Level below nodule illustrating normal SCM and adjacent adipose tissue. Arrow and arrowhead point to SCM and adipose tissue, respectively. Scale bar = 200 μm (middle) Section illustrating the tumor isolated within the adipose tissue. Arrow points to tumor. Scale bar = 200 μm. (right) High power view of tumor. Scale bar = 20 μm. See also Figure S4.
To further test whether the aP2-Cre transgene is inactive in skeletal muscle, we bred aP2-Cre mice to an additional reporter allele, R26-YFP. A western blot for YFP of whole tissue lysates of isolated intrascapular BAT, inguinal WAT, and SCM from aP2-Cre;R26-YFP and R26-YFP littermates at P28 demonstrated no evidence of YFP expression in skeletal muscle (Figure S4F&G). Together, these data illustrate that the aP2-Cre transgene is not expressed in skeletal muscle, consistent with the notion that the aP2-Cre;SmoM2/+ ERMS tumors originate outside the skeletal muscle lineage.
ERMS in adipose tissue
To better delineate the tissue compartment giving rise to the aP2-Cre;SmoM2 ERMS tumors, we sacrificed animals at P14, before tumor masses were grossly visible, with the notion of capturing microscopic foci of RMS arising in situ. The dissected SCM of a representative animal contained a small nodule clearly distinct from adjacent normal brown and white adipose tissues and SCM skeletal muscle (Figure 6B). The developing tumor was completely surrounded by non-neoplastic adipose tissue adjacent to and clearly separated from the SCM. The tumor displays the same appearance and histological characteristics as the previously described aP2-Cre;SmoM2/+ tumors. These findings further support the notion that the ERMS in the aP2-Cre;SmoM2/+ mice develop outside of the muscle lineage.
DISCUSSION
Through adipocyte-restricted activation of the Hedgehog pathway, we have developed a highly efficient mouse model of ERMS. Our findings demonstrate that constitutive activation of the Hedgehog pathway by an oncogenic Smoothened allele in the aP2 adipocyte lineage of mice results in the formation of aggressive head and neck tumors that mimic human ERMS histologically and molecularly. Though we cannot completely exclude the unlikely possibility that aP2-Cre is expressed in a rare population of myogenic cells, together these findings strongly argue that ERMS driven by the Shh pathway can originate from tissue histologically distinct from muscle.
While activation of the Shh pathway inhibits fat formation in invertebrates and mammalian cellular models acting upstream of PPARγ (Suh et al., 2006), the Shh pathway has well documented roles in skeletal muscle development and in the pathogenesis of ERMS (Barlow et al., 1997; Fan and Tessier-Lavigne, 1994; Johnson et al., 1994; Munsterberg et al., 1995; Zibat et al., 2010). The role of the Shh pathway in the development of ERMS is also supported by human cancer predisposition syndromes that result in Shh pathway activation and recent genomic interrogation of human ERMS samples. Gorlin syndrome, or nevoid basal cell carcinoma syndrome, is a human genetic disorder resulting from germline inactivating mutations of PTCH1, which encodes a negative regulator of the Shh pathway and displays an increased incidence of ERMS. Increased expression of GLI1 and PTCH1 in ERMS compared to ARMS has been reported (Paulson et al., 2011; Pressey et al., 2011). Zibat et al. found that high levels of expression of Shh target genes, PTCH1, GLI1, GLI3, and MYF5 is a common feature of ERMS and fusion gene-negative ARMS and not of fusion gene-positive ARMS. High expression of PTCH1 also correlated with poor survival (Zibat et al., 2010). These findings illustrate that the hedgehog pathway influences RMS pathogenesis.
The tumor-free survival curve of the aP2-Cre;SmoM2/+ mice displays a biphasic appearance with some mice never developing tumors. The early development of tumors with approximately 50% of mice exhibiting tumors by 28 days of life shows that activation of SmoM2 is sufficient to initiate ERMS tumorigenesis. However, the incomplete penetrance of the model suggests that other genetic “hits” are likely necessary for complete neoplastic transformation and/or tumor progression. For example, the tumor suppressor CDKN2A encoding p16INK4A and p14ARF (p19Arf in mice) is commonly deleted in human ERMS, which causes concomitant deregulation of the Rb and p53 pathways (Chen et al., 2007; Iolascon et al., 1996; Paulson et al., 2011). Deletion of Cdkn2a was previously shown to cooperate with a c-Met driven ERMS mouse model (Sharp et al., 2002). The deletion of Cdkn2a in the aP2-Cre;SmoM2/+ model resulted in complete penetrance, illustrating cooperativity between the Shh pathway and Ink4a/Arf in RMS.
Through mouse crosses deleting Ptch1 and p53 with multiple muscle-specific Cre drivers, Rubin et al. recently demonstrated that ERMS developed upon inactivating these loci in muscle stem cells (satellite cells), as well as proliferating and maturing myoblasts (Rubin et al., 2011). All ERMS tumors exhibited the same gene signature despite the cell of origin of the tumors, suggesting that the gene expression profile was more reflective of the final state of the tumor rather than the lineage from which it arose (Rubin et al., 2011). Though the aP2-Cre transgene is not active in the muscle lineage, the gene expression profile of the ERMS from aP2-Cre;SmoM2/+ mice is remarkably similar to previous murine ERMS models and to that of human ERMS. Thus, in multiple and seemingly unrelated settings, activated satellite gene signatures are seen in both mouse and human ERMS.
To address whether satellite cells were the origin of the aP2-Cre;SmoM2/+ tumors, we utilized the Pax7-CreERT2 allele. Pax7 along with Pax3 play a critical role in the developing skeletal muscle, where both Pax7- and Pax3-positive cells in the dermomyotome give rise to the embryonic and fetal myoblasts that form the primary and secondary muscle fibers. Consistent with these observations, we show that using Pax3-Cre to activate the SmoM2 allele during development causes embryonic lethality. Also, using Cre-drivers (Myf5-Cre and MyoD1-Cre) that act downstream of Pax7 during myogenesis also caused embryonic lethality. Thus, in lieu of using the Pax7-CreERT2 allele to induce SmoM2 expression embryonically, which would globally disrupt muscle patterning and cause potent embryonic lethality, we focused on tamoxifen-induced activation of the Pax7-CreERT2;Smo M2/+ alleles in newly born pups, a time point where Pax7 becomes restricted to the satellite cell lineage. Indeed, lethality was circumvented by this approach, which allowed for viable animals to be profiled for tumorigenesis. This dedicated restricted activation of the oncogenic SmoM2 allele in the Pax7+ satellite cells did not result in tumor formation. If aP2-Cre was expressed at a level that was completely undetectable in either of the lineage tracing experiments with the R26-LacZ or R26-YFP mice in the satellite cells, and the satellite cells were the origin of these tumors, one would expect that oncogene activation in the satellite cell lineage would phenocopy the aP2-Cre;Smo M2/+ tumors, which was not observed.
The cell of origin of ERMS has been and continues to be ambiguous (Hettmer and Wagers, 2010). It is generally thought that ERMS develops from cells of the muscle lineage, given that ERMS express skeletal muscle markers, such as MyoD, Myogenin, and Desmin. However, an origin restricted to muscle progenitors does not explain how ERMS occurs in locations that lack striated muscle such as the prostate, urinary bladder, and the biliary tree (Heyn et al., 1997; Spunt et al., 2000). Transdifferentiation of mesenchymal progenitor cells, including progenitors of the adipose lineage into ERMS, could account for ERMS that arise in tissues that normally lack skeletal muscle, such as the biliary and genitourinary tract. Transdifferentiation of lineages not fated to become skeletal muscle could also explain the appearance of arrested skeletal muscle development, as lineages that transdifferentiate after their fate has been initially established could lack the developmental priming necessary to terminally differentiate into striated skeletal muscle.
Recent reports suggest that skeletal muscle and brown fat share a developmental ancestry (Atit et al., 2006; Kajimura et al., 2009; Seale et al., 2008). In humans, brown fat has traditionally been thought to be restricted to newborns. However, recent reports have shown that brown adipose tissue, located primarily in the supraclavicular neck, is readily activated upon cold exposure in adult humans (Cypess et al., 2009; van Marken Lichtenbelt et al., 2009; Virtanen et al., 2009). We speculate that constitutive activation of the Shh pathway by SmoM2 derails brown adipocyte progenitors into the muscle lineage, such that the resulting cells lack the previous developmental priming and necessary modifications to develop normally into mature skeletal muscle and thus display an arrested state of skeletal muscle development or ERMS.
The rhabdomyosarcoma tumors in aP2-Cre;SmoM2/+ mutant mice closely resemble human rhabdomyosarcoma with respect to location, histology, and gene expression. We postulate that the relatively short latency and high penetrance of ERMS in this model now provides an efficient genetic system and tool for the analysis of RMS modifiers and provides a unique platform for pre-clinical studies.
EXPERIMENTAL PROCEDURES
Mouse Strains
All mice used in this study have been previously reported: aP2-Cre (Tang et al., 2008), SmoM2 (Jackson Laboratories, #5130)(Mao et al., 2006), Cdkn2aFlox (Aguirre et al., 2003), Pax3-Cre (Jackson Laboratories, #5549)(Engleka et al., 2005), Myf5-Cre (Jackson Laboratories, #7893)(Tallquist et al., 2000), MyoD1-Cre (Jackson Laboratories, #14140)(Yamamoto et al., 2009), Myogenin-Cre (Li et al., 2005), MCK-Cre (Jackson Laboratories, #6475)(Bruning et al., 1998), Pax7-CreERT2 (Jackson Laboratories, #12476)(Lepper et al., 2009) R26-LacZ (Jackson Laboratories, #3474)(Soriano, 1999), and R26-YFP (Jackson Laboratories, #6148)(Srinivas et al., 2001). aP2-Cre;SmoM2/+ mice were generated by breeding aP2-Cre male animals to SmoM2/M2 females. aP2-Cre;SmoM2/+;Cdkn2aFl/Fl mice were generated by breeding aP2-Cre;Cdkn2aFl/Fl males with SmoM2/M2;Cdkn2aFl/Fl females. All mice used in these studies were of mixed genetic backgrounds and all comparisons were performed on littermate controls. The end point for the Kaplan-Meier tumor-free survival analysis was the first visible sign of tumor. All experimental procedures involving animals in this study were reviewed and approved by the Institutional Animal Care and Research Advisory Committee at the University of Texas Southwestern Medical Center.
Histology and Immunohistochemistry
Dissected tumors were fixed in 10% neutral-buffered formalin, placed in fixative overnight, embedded in paraffin and sectioned at 5 μm intervals. H&E and Trichrome stains were performed using standard procedures. All paraffin-embedded sections for immunohistochemistry were deparaffinized, heated in a microwave in 0.01 M sodium citrate buffer for antigen retrieval, treated with 3% H2O2 for 10 minutes, rinsed in H2O and PBS. For Ki-67 immunohistochemistry, sections were blocked in 5% goat serum in PBS followed by incubation with anti-Ki67 antibody (Abcam, ab15580) at a concentration of 1:100. Signals were detected with a Vectastain ABC kit (Vector Laboratories) and 3,3′-diaminobenzidine (DAB) substrate (Vector Laboratories). Sections were counter-stained with hematoxylin and mounted. For MyoD, Myogenin, and Desmin immunohistochemistry, the M.O.M. Immunodetection Kit (Vector Laboratories), Vectastain Elite kit (Vector Laboratories), and 3,3′-diaminobenzidine (DAB) substrate were used. The MyoD1 primary antibody (Dako, 5.8A, M3512) was used at a concentration of 1:50, the Myogenin primary antibody (Dako, 5FD, M3559) was used at a concentration of 1:25, and the Desmin primary antibody (Developmental Hybridoma Bank, D3 supernatants) was used at a concentration of 1:100.
LacZ staining
β-galactosidase expression was detected in isolated tissue fixed for one hour in 4% paraformaldehyde, 0.1M phosphate buffer pH 7.4, 0.01% sodium deoxycholate, 0.02% Nonidet P-40) then washed twice with buffer (0.1M phosphate buffer pH 7.4, 0.01% sodium deoxycholate, 0.02% Nonidet P-40). β-galactosidase was detected by overnight incubation at room temperature in 1 mg/mL X-gal (5-bromo-4-chloro-3-indoyl-β-D-galactoside), 5 mM potassium ferricyanide and 5 mM potassium ferrocyanide, 2 mM MgCl2, 0.01% sodium deoxycholate, and 0.02% Nonidet P-40. Tissues were rinsed twice in buffer and post-fixed overnight in 4% paraformaldehyde and 0.2% glutaraldehyde.
RNA Purification, RT-PCR, and Real-time PCR
Total RNA was isolated from normal SCM or tumors with Trizol reagent (Invitrogen) according to the manufacturer’s protocol. Reverse transcription was performed using random hexamer primers and SuperScript III First-Strand Synthesis (Invitrogen). Real-time PCR was performed using SYBR Green assay on an ABI-PE Prism 7900HT sequence detection system according to manufacturer’s protocol. The relative quantities of the gene of interest were determined using the ΔΔCT method and were normalized to 18S and expressed relative to the value for the normal SCM or to brown adipose tissue. In all real-time PCR assays, each group contained four independent samples assayed in duplicate.
Microarray Analysis
RNA from aP2-Cre;SmoM2/+ tumors or SCM with quality verified with nanodrop and bioanalyzer was hybridized to the Illumina MouseWG-6 v2.0 BeadChip. Normalized signal data from Illumina Whole-Genome Gene Expression BeadChips were collated and log base 2 transformed in STATA/SE 11.2 (College Station, TX USA). Next, the data was imported into Partek Genomic Suite 6.6 (St. Louis, MO USA) visualized by principal components analysis (PCA) to check for consistency of samples and class variance. The log2 transformed aP2-Cre;SmoM2/+ tumor and SCM data were batch corrected and then compared. Using Partek, each probeset was compared by an unequal variance t-test. The Bonferroni correction was then applied. This same process was repeated for aP2-Cre;SmoM2/+ and Myogenin-Cre;SmoM2/+ data.
Probesets that passed the Bonferroni cut of at 0.0001 in the aP2-Cre;SmoM2/+ tumor, SCM comparison and had at an absolute (log2ratio) > 2.5 were selected for the Heat Map. Using Spotfire Decision Site 9.1.2, the data were z transformed and hierarchically clustered using Euclidean distance, data was then recolored to the fixed -2 to 2 scale. The volcano plot was produced in STATA/SE 11.2 by first −log10 transforming the p-value from the unequal variance t test. The transformed score was then plotted against the log2ratio of expression from the two classes. The horizontal line represents the 0.05 Bonferroni cut off and the colors represent select significantly differential genes that are either elevated (red) in aP2-Cre;SmoM2/+ tumor relative to SCM or down regulated (green). The volcano plot for the aP2-Cre;SmoM2/+/Myogenini-Cre;SmoM2/+ t test results was created in the same manner. Although in this case, no genes were had statistically significantly differences. Gene expression was confirmed by real-time PCR.
Cross species and mouse model expression comparisons
The human data comes from two distinct studies the 36 ERMS samples from the Curie Institute (Williamson et al., 2010) and Vastus Lateralis muscle of 10 young trained subjects from the Mayo clinic (GSE9103). Both human studies used the Affymetrix Human Genome U133 Plus 2.0 Arrays. Data was rma summarized for each group independently (Partek Genomics Suite 6.6). Next, ERMS/wt-muscle log ratios were calculated and median normalized to center at zero to correct for source effects. The 15 mouse tumors and 3 normal SCM samples from this study were assayed by Illumina MouseWG-6 v2.0 BeadChip. Log2ratios were calculated and the cross species cross platform data matched by unigene id based on an Affymetrix cross species unigene file derived from NCBI homologene data. Whenever multiple probes were designated for a given unigene in either species, the probe with the maximum average expression was retained yielding 13282 logratio pairs. The Spearman Correlation, AGDEX (Johnson et al., 2010) and linear fit were calculated and graphically depicted using STATA/SE 11.
The mouse model comparison was within species but the cross two version comparison above was used. The San Antonio model was performed on the Illumina mouseRef-8 v1.1 expression beadchip. For the with intra-species comparison, 4 normal skeletal muscle samples and 7 ERMS samples from San Antonio were compared to our model data. Probe matching was direct by Illumina ID yielding 19,878 pairs. AGDEX, Spearman correlation and linear fit were calculated and graphed as in the cross species example.
Statistical Analysis
Results are expressed as the mean ± SEM. We utilized a two-tailed, unpaired Student’s t-test for all pair-wise comparisons (GraphPad Prism version 5). P values less than 0.05 were considered significant.
Accession Number
Illumina data for the mouse ERMS and SCM can be found in the Gene Expression Omnibus database number GSE40359.
Supplementary Material
HIGHLIGHTS.
Hedgehog pathway activation in the adipose lineage induces embryonal rhabdomyosarcoma
Adipose lineage derived ERMS display genetic signature of activated satellite cells
Gene expression patterns of human and aP2-Cre;SmoM2 mouse ERMS are similar
SIGNIFICANCE.
Rhabdomyosarcoma is the most common soft tissue malignancy in children. Despite aggressive chemotherapy, radiotherapy and surgery, clinical outcomes for RMS have not improved for three decades, emphasizing the need to uncover the molecular underpinnings of the disease. Here, we describe a Sonic Hedgehog-driven mouse model of ERMS that mimics the histopathological and molecular characteristics of human ERMS, and with notably decreased latency, high penetrance, and a restricted anatomic location when compared to previous models. In addition to yielding mechanistic insights into ERMS, this mouse model also now provides a robust preclinical platform to explore therapeutic strategies to improve RMS treatment.
Acknowledgments
We are grateful to Jose Cabrera for figure preparation and John Shelton for experimental assistance. We thank Nabeel Bardeesy for the Cdkn2aFlox mice. Work in Eric Olson’s laboratory was supported by grants from the National Institutes of Health, the Leducq Foundation, the Robert A. Welch Foundation, and the American Heart Association: Jon Holden DeHaan Foundation. Mark E. Hatley is supported by Alex’s Lemonade Stand Foundation, Pediatric Scientist Development Program sponsored by the Eunice Kennedy Shriver National Institute of Child Health and Human Development (NICHD Grant Award K12-HD000850), and the American Lebanese Syrian Associated Charities (ALSAC). Funding to RLG for this work was provided by the Burroughs Wellcome Fund Career Award for Medical Scientists, the American Cancer Society/Simmons Cancer Center Institutional Research Grant (ACS-IRG-02-196) the UTSWMC Simmon’s Cancer Center American Cancer Society Training Grant, The CureSearch for Children’s Cancer Young Investigator Program, and an Alex’s Lemonade Stand Foundation “A” Award. Work in Jonathan Graff’s lab was supported by NIDDK grants R01-DK066566, R01-DK064261 and R01-DK088220.
Footnotes
Publisher's Disclaimer: This is a PDF file of an unedited manuscript that has been accepted for publication. As a service to our customers we are providing this early version of the manuscript. The manuscript will undergo copyediting, typesetting, and review of the resulting proof before it is published in its final citable form. Please note that during the production process errors may be discovered which could affect the content, and all legal disclaimers that apply to the journal pertain.
References
- Aguirre AJ, Bardeesy N, Sinha M, Lopez L, Tuveson DA, Horner J, Redston MS, DePinho RA. Activated Kras and Ink4a/Arf deficiency cooperate to produce metastatic pancreatic ductal adenocarcinoma. Genes Dev. 2003;17:3112–3126. doi: 10.1101/gad.1158703. [DOI] [PMC free article] [PubMed] [Google Scholar]
- Atit R, Sgaier SK, Mohamed OA, Taketo MM, Dufort D, Joyner AL, Niswander L, Conlon RA. Beta-catenin activation is necessary and sufficient to specify the dorsal dermal fate in the mouse. Dev Biol. 2006;296:164–176. doi: 10.1016/j.ydbio.2006.04.449. [DOI] [PubMed] [Google Scholar]
- Barlow C, Schroeder M, Lekstrom-Himes J, Kylefjord H, Deng CX, Wynshaw-Boris A, Spiegelman BM, Xanthopoulos KG. Targeted expression of Cre recombinase to adipose tissue of transgenic mice directs adipose-specific excision of loxP-flanked gene segments. Nucleic Acids Res. 1997;25:2543–2545. doi: 10.1093/nar/25.12.2543. [DOI] [PMC free article] [PubMed] [Google Scholar]
- Barr FG. Gene fusions involving PAX and FOX family members in alveolar rhabdomyosarcoma. Oncogene. 2001;20:5736–5746. doi: 10.1038/sj.onc.1204599. [DOI] [PubMed] [Google Scholar]
- Barr FG, Womer RB. Rhabdomyosarcoma. In: Orkin SH, Fisher DE, Look AT, Lux SE, Ginsburg D, Nathan DG, editors. Oncology of Infancy and Childhood. Philadelphia: Saunders; 2009. pp. 743–781. [Google Scholar]
- Beroukhim R, Mermel CH, Porter D, Wei G, Raychaudhuri S, Donovan J, Barretina J, Boehm JS, Dobson J, Urashima M, et al. The landscape of somatic copy-number alteration across human cancers. Nature. 2010;463:899–905. doi: 10.1038/nature08822. [DOI] [PMC free article] [PubMed] [Google Scholar]
- Bignell GR, Greenman CD, Davies H, Butler AP, Edkins S, Andrews JM, Buck G, Chen L, Beare D, Latimer C, et al. Signatures of mutation and selection in the cancer genome. Nature. 2010;463:893–898. doi: 10.1038/nature08768. [DOI] [PMC free article] [PubMed] [Google Scholar]
- Bruning JC, Michael MD, Winnay JN, Hayashi T, Horsch D, Accili D, Goodyear LJ, Kahn CR. A muscle-specific insulin receptor knockout exhibits features of the metabolic syndrome of NIDDM without altering glucose tolerance. Mol Cell. 1998;2:559–569. doi: 10.1016/s1097-2765(00)80155-0. [DOI] [PubMed] [Google Scholar]
- Chen Y, Takita J, Mizuguchi M, Tanaka K, Ida K, Koh K, Igarashi T, Hanada R, Tanaka Y, Park MJ, Hayashi Y. Mutation and expression analyses of the MET and CDKN2A genes in rhabdomyosarcoma with emphasis on MET overexpression. Genes Chromosomes Cancer. 2007;46:348–358. doi: 10.1002/gcc.20416. [DOI] [PubMed] [Google Scholar]
- Corcoran RB, Scott MP. A mouse model for medulloblastoma and basal cell nevus syndrome. J Neurooncol. 2001;53:307–318. doi: 10.1023/a:1012260318979. [DOI] [PubMed] [Google Scholar]
- Cypess AM, Lehman S, Williams G, Tal I, Rodman D, Goldfine AB, Kuo FC, Palmer EL, Tseng YH, Doria A, et al. Identification and importance of brown adipose tissue in adult humans. N Engl J Med. 2009;360:1509–1517. doi: 10.1056/NEJMoa0810780. [DOI] [PMC free article] [PubMed] [Google Scholar]
- El-Badry OM, Minniti C, Kohn EC, Houghton PJ, Daughaday WH, Helman LJ. Insulin-like growth factor II acts as an autocrine growth and motility factor in human rhabdomyosarcoma tumors. Cell Growth Differ. 1990;1:325–331. [PubMed] [Google Scholar]
- Engleka KA, Gitler AD, Zhang M, Zhou DD, High FA, Epstein JA. Insertion of Cre into the Pax3 locus creates a new allele of Splotch and identifies unexpected Pax3 derivatives. Dev Biol. 2005;280:396–406. doi: 10.1016/j.ydbio.2005.02.002. [DOI] [PubMed] [Google Scholar]
- Estep AL, Tidyman WE, Teitell MA, Cotter PD, Rauen KA. HRAS mutations in Costello syndrome: detection of constitutional activating mutations in codon 12 and 13 and loss of wild-type allele in malignancy. Am J Med Genet A. 2006;140:8–16. doi: 10.1002/ajmg.a.31078. [DOI] [PubMed] [Google Scholar]
- Fan CM, Tessier-Lavigne M. Patterning of mammalian somites by surface ectoderm and notochord: evidence for sclerotome induction by a hedgehog homolog. Cell. 1994;79:1175–1186. doi: 10.1016/0092-8674(94)90009-4. [DOI] [PubMed] [Google Scholar]
- Fukada S, Uezumi A, Ikemoto M, Masuda S, Segawa M, Tanimura N, Yamamoto H, Miyagoe-Suzuki Y, Takeda S. Molecular signature of quiescent satellite cells in adult skeletal muscle. Stem Cells. 2007;25:2448–2459. doi: 10.1634/stemcells.2007-0019. [DOI] [PubMed] [Google Scholar]
- Galindo RL, Allport JA, Olson EN. A Drosophila model of the rhabdomyosarcoma initiator PAX7-FKHR. Proc Natl Acad Sci U S A. 2006;103:13439–13444. doi: 10.1073/pnas.0605926103. [DOI] [PMC free article] [PubMed] [Google Scholar]
- Gattenloehner S, Vincent A, Leuschner I, Tzartos S, Muller-Hermelink HK, Kirchner T, Marx A. The fetal form of the acetylcholine receptor distinguishes rhabdomyosarcomas from other childhood tumors. Am J Pathol. 1998;152:437–444. [PMC free article] [PubMed] [Google Scholar]
- Gluer S, Schelp C, von Schweinitz D, Gerardy-Schahn R. Polysialylated neural cell adhesion molecule in childhood rhabdomyosarcoma. Pediatr Res. 1998;43:145–147. doi: 10.1203/00006450-199801000-00022. [DOI] [PubMed] [Google Scholar]
- Hahn H, Wojnowski L, Specht K, Kappler R, Calzada-Wack J, Potter D, Zimmer A, Muller U, Samson E, Quintanilla-Martinez L. Patched target Igf2 is indispensable for the formation of medulloblastoma and rhabdomyosarcoma. J Biol Chem. 2000;275:28341–28344. doi: 10.1074/jbc.C000352200. [DOI] [PubMed] [Google Scholar]
- He W, Barak Y, Hevener A, Olson P, Liao D, Le J, Nelson M, Ong E, Olefsky JM, Evans RM. Adipose-specific peroxisome proliferator-activated receptor gamma knockout causes insulin resistance in fat and liver but not in muscle. Proc Natl Acad Sci U S A. 2003;100:15712–15717. doi: 10.1073/pnas.2536828100. [DOI] [PMC free article] [PubMed] [Google Scholar]
- Hettmer S, Liu J, Miller CM, Lindsay MC, Sparks CA, Guertin DA, Bronson RT, Langenau DM, Wagers AJ. Sarcomas induced in discrete subsets of prospectively isolated skeletal muscle cells. Proc Natl Acad Sci U S A. 2011;108:20002–20007. doi: 10.1073/pnas.1111733108. [DOI] [PMC free article] [PubMed] [Google Scholar]
- Hettmer S, Wagers AJ. Muscling in: Uncovering the origins of rhabdomyosarcoma. Nat Med. 2010;16:171–173. doi: 10.1038/nm0210-171. [DOI] [PubMed] [Google Scholar]
- Heyn R, Newton WA, Raney RB, Hamoudi A, Bagwell C, Vietti T, Wharam M, Gehan E, Maurer HM. Preservation of the bladder in patients with rhabdomyosarcoma. J Clin Oncol. 1997;15:69–75. doi: 10.1200/JCO.1997.15.1.69. [DOI] [PubMed] [Google Scholar]
- Iolascon A, Faienza MF, Coppola B, Rosolen A, Basso G, Della Ragione F, Schettini F. Analysis of cyclin-dependent kinase inhibitor genes (CDKN2A, CDKN2B, and CDKN2C) in childhood rhabdomyosarcoma. Genes Chromosomes Cancer. 1996;15:217–222. doi: 10.1002/(SICI)1098-2264(199604)15:4<217::AID-GCC3>3.0.CO;2-4. [DOI] [PubMed] [Google Scholar]
- Ishiguro N, Motoi T, Araki N, Ito H, Moriyama M, Yoshida H. Expression of cardiac ankyrin repeat protein, CARP, in malignant tumors: diagnostic use of CARP protein immunostaining in rhabdomyosarcoma. Hum Pathol. 2008;39:1673–1679. doi: 10.1016/j.humpath.2008.04.009. [DOI] [PubMed] [Google Scholar]
- Johnson RA, Wright KD, Poppleton H, Mohankumar KM, Finkelstein D, Pounds SB, Rand V, Leary SE, White E, Eden C, et al. Cross-species genomics matches driver mutations and cell compartments to model ependymoma. Nature. 2010;466:632–636. doi: 10.1038/nature09173. [DOI] [PMC free article] [PubMed] [Google Scholar]
- Johnson RL, Laufer E, Riddle RD, Tabin C. Ectopic expression of Sonic hedgehog alters dorsal-ventral patterning of somites. Cell. 1994;79:1165–1173. doi: 10.1016/0092-8674(94)90008-6. [DOI] [PubMed] [Google Scholar]
- Johnson RL, Rothman AL, Xie J, Goodrich LV, Bare JW, Bonifas JM, Quinn AG, Myers RM, Cox DR, Epstein EH, Jr, Scott MP. Human homolog of patched, a candidate gene for the basal cell nevus syndrome. Science. 1996;272:1668–1671. doi: 10.1126/science.272.5268.1668. [DOI] [PubMed] [Google Scholar]
- Kajimura S, Seale P, Kubota K, Lunsford E, Frangioni JV, Gygi SP, Spiegelman BM. Initiation of myoblast to brown fat switch by a PRDM16-C/EBP-beta transcriptional complex. Nature. 2009;460:1154–1158. doi: 10.1038/nature08262. [DOI] [PMC free article] [PubMed] [Google Scholar]
- Keller C, Capecchi MR. New genetic tactics to model alveolar rhabdomyosarcoma in the mouse. Cancer Res. 2005;65:7530–7532. doi: 10.1158/0008-5472.CAN-05-0477. [DOI] [PubMed] [Google Scholar]
- Lee Y, Kawagoe R, Sasai K, Li Y, Russell HR, Curran T, McKinnon PJ. Loss of suppressor-of-fused function promotes tumorigenesis. Oncogene. 2007;26:6442–6447. doi: 10.1038/sj.onc.1210467. [DOI] [PubMed] [Google Scholar]
- Lepper C, Conway SJ, Fan CM. Adult satellite cells and embryonic muscle progenitors have distinct genetic requirements. Nature. 2009;460:627–631. doi: 10.1038/nature08209. [DOI] [PMC free article] [PubMed] [Google Scholar]
- Li FP, Fraumeni JF., Jr Rhabdomyosarcoma in children: epidemiologic study and identification of a familial cancer syndrome. J Natl Cancer Inst. 1969;43:1365–1373. [PubMed] [Google Scholar]
- Li S, Czubryt MP, McAnally J, Bassel-Duby R, Richardson JA, Wiebel FF, Nordheim A, Olson EN. Requirement for serum response factor for skeletal muscle growth and maturation revealed by tissue-specific gene deletion in mice. Proc Natl Acad Sci U S A. 2005;102:1082–1087. doi: 10.1073/pnas.0409103102. [DOI] [PMC free article] [PubMed] [Google Scholar]
- Lum L, Beachy PA. The Hedgehog response network: sensors, switches, and routers. Science. 2004;304:1755–1759. doi: 10.1126/science.1098020. [DOI] [PubMed] [Google Scholar]
- Mao J, Ligon KL, Rakhlin EY, Thayer SP, Bronson RT, Rowitch D, McMahon AP. A novel somatic mouse model to survey tumorigenic potential applied to the Hedgehog pathway. Cancer Res. 2006;66:10171–10178. doi: 10.1158/0008-5472.CAN-06-0657. [DOI] [PMC free article] [PubMed] [Google Scholar]
- Munsterberg AE, Kitajewski J, Bumcrot DA, McMahon AP, Lassar AB. Combinatorial signaling by Sonic hedgehog and Wnt family members induces myogenic bHLH gene expression in the somite. Genes Dev. 1995;9:2911–2922. doi: 10.1101/gad.9.23.2911. [DOI] [PubMed] [Google Scholar]
- Paulson V, Chandler G, Rakheja D, Galindo RL, Wilson K, Amatruda JF, Cameron S. High-resolution array CGH identifies common mechanisms that drive embryonal rhabdomyosarcoma pathogenesis. Genes Chromosomes Cancer. 2011;50:397–408. doi: 10.1002/gcc.20864. [DOI] [PubMed] [Google Scholar]
- Pressey JG, Anderson JR, Crossman DK, Lynch JC, Barr FG. Hedgehog pathway activity in pediatric embryonal rhabdomyosarcoma and undifferentiated sarcoma: a report from the Children’s Oncology Group. Pediatr Blood Cancer. 2011;57:930–938. doi: 10.1002/pbc.23174. [DOI] [PMC free article] [PubMed] [Google Scholar]
- Rezvani G, Lui JC, Barnes KM, Baron J. A set of imprinted genes required for normal body growth also promotes growth of rhabdomyosarcoma cells. Pediatr Res. 2012;71:32–38. doi: 10.1038/pr.2011.6. [DOI] [PMC free article] [PubMed] [Google Scholar]
- Ross SR, Choy L, Graves RA, Fox N, Solevjeva V, Klaus S, Ricquier D, Spiegelman BM. Hibernoma formation in transgenic mice and isolation of a brown adipocyte cell line expressing the uncoupling protein gene. Proc Natl Acad Sci U S A. 1992;89:7561–7565. doi: 10.1073/pnas.89.16.7561. [DOI] [PMC free article] [PubMed] [Google Scholar]
- Ross SR, Graves RA, Greenstein A, Platt KA, Shyu HL, Mellovitz B, Spiegelman BM. A fat-specific enhancer is the primary determinant of gene expression for adipocyte P2 in vivo. Proc Natl Acad Sci U S A. 1990;87:9590–9594. doi: 10.1073/pnas.87.24.9590. [DOI] [PMC free article] [PubMed] [Google Scholar]
- Rubin BP, Nishijo K, Chen HI, Yi X, Schuetze DP, Pal R, Prajapati SI, Abraham J, Arenkiel BR, Chen QR, et al. Evidence for an unanticipated relationship between undifferentiated pleomorphic sarcoma and embryonal rhabdomyosarcoma. Cancer Cell. 2011;19:177–191. doi: 10.1016/j.ccr.2010.12.023. [DOI] [PMC free article] [PubMed] [Google Scholar]
- Seale P, Bjork B, Yang W, Kajimura S, Chin S, Kuang S, Scime A, Devarakonda S, Conroe HM, Erdjument-Bromage H, et al. PRDM16 controls a brown fat/skeletal muscle switch. Nature. 2008;454:961–967. doi: 10.1038/nature07182. [DOI] [PMC free article] [PubMed] [Google Scholar]
- Seale P, Rudnicki MA. A new look at the origin, function, and “stem-cell” status of muscle satellite cells. Dev Biol. 2000;218:115–124. doi: 10.1006/dbio.1999.9565. [DOI] [PubMed] [Google Scholar]
- Shadrach JL, Wagers AJ. Stem cells for skeletal muscle repair. Philos Trans R Soc Lond B Biol Sci. 2011;366:2297–2306. doi: 10.1098/rstb.2011.0027. [DOI] [PMC free article] [PubMed] [Google Scholar]
- Sharp R, Recio JA, Jhappan C, Otsuka T, Liu S, Yu Y, Liu W, Anver M, Navid F, Helman LJ, et al. Synergism between INK4a/ARF inactivation and aberrant HGF/SF signaling in rhabdomyosarcomagenesis. Nat Med. 2002;8:1276–1280. doi: 10.1038/nm787. [DOI] [PubMed] [Google Scholar]
- Soriano P. Generalized lacZ expression with the ROSA26 Cre reporter strain. Nat Genet. 1999;21:70–71. doi: 10.1038/5007. [DOI] [PubMed] [Google Scholar]
- Spunt SL, Lobe TE, Pappo AS, Parham DM, Wharam MD, Jr, Arndt C, Anderson JR, Crist WM, Paidas C, Wiener E, et al. Aggressive surgery is unwarranted for biliary tract rhabdomyosarcoma. J Pediatr Surg. 2000;35:309–316. doi: 10.1016/s0022-3468(00)90030-7. [DOI] [PubMed] [Google Scholar]
- Srinivas S, Watanabe T, Lin CS, William CM, Tanabe Y, Jessell TM, Costantini F. Cre reporter strains produced by targeted insertion of EYFP and ECFP into the ROSA26 locus. BMC Dev Biol. 2001;1:4. doi: 10.1186/1471-213X-1-4. [DOI] [PMC free article] [PubMed] [Google Scholar]
- Suh JM, Gao X, McKay J, McKay R, Salo Z, Graff JM. Hedgehog signaling plays a conserved role in inhibiting fat formation. Cell Metab. 2006;3:25–34. doi: 10.1016/j.cmet.2005.11.012. [DOI] [PubMed] [Google Scholar]
- Tallquist MD, Weismann KE, Hellstrom M, Soriano P. Early myotome specification regulates PDGFA expression and axial skeleton development. Development. 2000;127:5059–5070. doi: 10.1242/dev.127.23.5059. [DOI] [PubMed] [Google Scholar]
- Tang W, Zeve D, Suh JM, Bosnakovski D, Kyba M, Hammer RE, Tallquist MD, Graff JM. White fat progenitor cells reside in the adipose vasculature. Science. 2008;322:583–586. doi: 10.1126/science.1156232. [DOI] [PMC free article] [PubMed] [Google Scholar]
- Tiffin N, Williams RD, Shipley J, Pritchard-Jones K. PAX7 expression in embryonal rhabdomyosarcoma suggests an origin in muscle satellite cells. Br J Cancer. 2003;89:327–332. doi: 10.1038/sj.bjc.6601040. [DOI] [PMC free article] [PubMed] [Google Scholar]
- Tostar U, Malm CJ, Meis-Kindblom JM, Kindblom LG, Toftgard R, Unden AB. Deregulation of the hedgehog signalling pathway: a possible role for the PTCH and SUFU genes in human rhabdomyoma and rhabdomyosarcoma development. J Pathol. 2006;208:17–25. doi: 10.1002/path.1882. [DOI] [PubMed] [Google Scholar]
- Urs S, Harrington A, Liaw L, Small D. Selective expression of an aP2/Fatty Acid Binding Protein 4-Cre transgene in non-adipogenic tissues during embryonic development. Transgenic Res. 2006;15:647–653. doi: 10.1007/s11248-006-9000-z. [DOI] [PubMed] [Google Scholar]
- van Marken Lichtenbelt WD, Vanhommerig JW, Smulders NM, Drossaerts JM, Kemerink GJ, Bouvy ND, Schrauwen P, Teule GJ. Cold-activated brown adipose tissue in healthy men. N Engl J Med. 2009;360:1500–1508. doi: 10.1056/NEJMoa0808718. [DOI] [PubMed] [Google Scholar]
- Virtanen KA, Lidell ME, Orava J, Heglind M, Westergren R, Niemi T, Taittonen M, Laine J, Savisto NJ, Enerback S, Nuutila P. Functional brown adipose tissue in healthy adults. N Engl J Med. 2009;360:1518–1525. doi: 10.1056/NEJMoa0808949. [DOI] [PubMed] [Google Scholar]
- Wang Q, Fang WH, Krupinski J, Kumar S, Slevin M, Kumar P. Pax genes in embryogenesis and oncogenesis. J Cell Mol Med. 2008;12:2281–2294. doi: 10.1111/j.1582-4934.2008.00427.x. [DOI] [PMC free article] [PubMed] [Google Scholar]
- Williamson D, Missiaglia E, de Reynies A, Pierron G, Thuille B, Palenzuela G, Thway K, Orbach D, Lae M, Freneaux P, et al. Fusion gene-negative alveolar rhabdomyosarcoma is clinically and molecularly indistinguishable from embryonal rhabdomyosarcoma. J Clin Oncol. 2010;28:2151–2158. doi: 10.1200/JCO.2009.26.3814. [DOI] [PubMed] [Google Scholar]
- Yamamoto M, Shook NA, Kanisicak O, Yamamoto S, Wosczyna MN, Camp JR, Goldhamer DJ. A multifunctional reporter mouse line for Cre- and FLP-dependent lineage analysis. Genesis. 2009;47:107–114. doi: 10.1002/dvg.20474. [DOI] [PMC free article] [PubMed] [Google Scholar]
- Zibat A, Missiaglia E, Rosenberger A, Pritchard-Jones K, Shipley J, Hahn H, Fulda S. Activation of the hedgehog pathway confers a poor prognosis in embryonal and fusion gene-negative alveolar rhabdomyosarcoma. Oncogene. 2010;29:6323–6330. doi: 10.1038/onc.2010.368. [DOI] [PubMed] [Google Scholar]
Associated Data
This section collects any data citations, data availability statements, or supplementary materials included in this article.