

Abstract
Previous studies have suggested that the presence of sea ice is an important factor in facilitating migration and determining the degree of genetic isolation among contemporary arctic fox populations. Because the extent of sea ice is dependent upon global temperatures, periods of significant cooling would have had a major impact on fox population connectivity and genetic variation. We tested this hypothesis by extracting and sequencing mitochondrial control region sequences from 17 arctic foxes excavated from two late-ninth-century to twelfth-century AD archaeological sites in northeast Iceland, both of which predate the Little Ice Age (approx. sixteenth to nineteenth century). Despite the fact that five haplotypes have been observed in modern Icelandic foxes, a single haplotype was shared among all of the ancient individuals. Results from simulations within an approximate Bayesian computation framework suggest that the rapid increase in Icelandic arctic fox haplotype diversity can only be explained by sea-ice-mediated fox immigration facilitated by the Little Ice Age.
Keywords: island biogeography, phylogeography, ancient DNA, approximate Bayesian computation
1. Introduction
The last millennium witnessed dramatic environmental and ecological change in Iceland. The effects of human settlement in the ninth century AD were exacerbated by hemispheric climate change, both of which led to widespread environmental degradation at an unprecedented rate [1]. Although a great deal of research has focused on the human impacts on soil and vegetation systems [2,3], less is known about the effects of settlement or climate change on the wild animal populations of the island. The arctic fox (Vulpes lagopus) is particularly interesting since it is the island's only indigenous mammal. Foxes arrived in Iceland by crossing arctic sea ice well before human settlement [4] and have a long-standing antagonistic relationship with people. The population history of the arctic fox in Iceland prior to the twentieth century, however, is poorly understood. The use of ancient DNA in a population genetics framework presents an effective means of addressing this issue. Generating empirical evidence of population genetic diversity through time can elucidate past patterns and processes that may be difficult or impossible to ascertain using contemporary data alone [5].
Genetic diversity within small or isolated wild populations can be strongly affected by human interaction. During the early twentieth century, overhunting reduced the size of the Fennoscandian arctic fox population to 100–200 individuals, from which it has failed to recover [6]. Comparisons of museum specimens and modern samples indicate a loss of both mitochondrial and microsatellite diversity during this period [7]. More recently, sustained low population levels have promoted further spatial fragmentation and subdivision, in spite of putative gene flow from northern Russia [8].
In Iceland, the arctic fox has been considered vermin because of its ostensible role in killing sheep and the disruption of eider (Somateria mollissima) colonies. Fox hunting has been encouraged and legislated for since the thirteenth century, and is still coordinated and subsidized by the Wildlife Management Institute [9]. The most effective law targeted at the extermination of the arctic fox was passed in 1957 and by the 1970s the population had declined to approximately 1300 individuals [10]. Since this bottleneck, foxes have rebounded substantially and contemporary estimates suggest there are now approximately 10 000 individuals [11]. No significant signature of the 1970s bottleneck has been found in the population using microsatellite data, though the genetic diversity of Iceland foxes remains comparable to that of the threatened population in Fennoscandia [12].
Though humans can significantly affect arctic fox population size at a local level, the effects of hunting and trapping on global population dynamics are limited. A more influential factor in determining regional fox population structure is the propensity for long-distance migration during periods of nutritional stress [10,13]. Adult foxes of both sexes are known to habitually travel thousands of kilometres in a single year while spending substantial periods on arctic pack ice [14,15].
High mobility across both land and sea ice is believed to have had an important influence on the distribution and maintenance of genetic diversity of the arctic fox across its range (figure 1). Previous studies using both mitochondrial and microsatellite markers have demonstrated that the presence of sea ice is the most important factor in explaining arctic fox global population structure [17–19]. Genetic differentiation between North America, north Greenland and Svalbard is low, implying extensive movement across the sea ice between these areas [17,20]. In fact, the genetic proximity of these areas to Siberia has prompted suggestions that Svalbard may act as a central junction for gene flow across the entire Arctic, mediated by sea ice [17,18].
Figure 1.

A map depicting the approximate current distribution of the Arctic fox in blue [10]. The dashed black line indicates the median sea ice maximum for the period 1979–2000 [16].
Islands surrounded by open water year round, such as the Commander Islands, Pribilof Islands and Iceland, show a distinct pattern of genetic isolation [19]. Unlike the small islands of the Bering Sea, however, Iceland may have been connected to the rest of the Arctic more frequently during the last millennium than at present, a possibility reflected in the presence of both indigenous mitochondrial haplotypes (I1 and I2) and Holarctic haplotypes (H2, H5 and H8) that have been observed in specimens from regions across the circumpolar distribution of the arctic fox [21].
Records dating from the Little Ice Age cooling event (approx. sixteenth to nineteenth century [22,23]) suggest that grounding of Arctic sea ice on Iceland's northern shore may have been a relatively common occurrence, thus connecting Iceland and Greenland for several months per year [23]. Such a sea ice bridge, though transient, may have persisted for sufficient time to enable gene flow into Iceland, resulting in an influx of genetic diversity during the last millennium [19].
In order to test this hypothesis, we generated mitochondrial DNA sequences from archaeological specimens dated to the ninth to twelfth century AD and compared them with contemporary Icelandic foxes. We then employed an approximate Bayesian computation approach to assess whether the shift in haplotype frequencies through time was larger than would be expected from genetic drift alone, or whether it was necessary to invoke sea-ice-mediated gene flow to explain the genetic variation in modern Icelandic foxes.
2. Material and methods
We analysed 25 adult arctic fox specimens obtained from different areas of 12 stratigraphic units from six archaeological sites. The deposits span the chronological sequences of the sites and comprise extensive sheet middens accumulated over generations of human occupation. Even those specimens from the same stratigraphic units (see the electronic supplementary material, table S1) were derived from individual, non-articulated bones representing the discard of single bones from single kills into the midden. As a result, the bones are unlikely to be derived from related individuals and do not represent a group kill of a family unit. Nineteen of the specimens were derived from six extensive stratigraphic units at Sveigakot, an abandoned farm dwelling containing numerous zooarchaeologically rich midden deposits. Specimens were also acquired from other sites in the Lake Mývatn region in northeast Iceland, including two from Hofstaðir and single bones from Hrísheimar and Skútustaðir (figure 2). Collectively, these sites possess multiple phases of occupation which together have been dated using radiocarbon and tephrochronology to between the late ninth to twelfth centuries AD [24].
Figure 2.
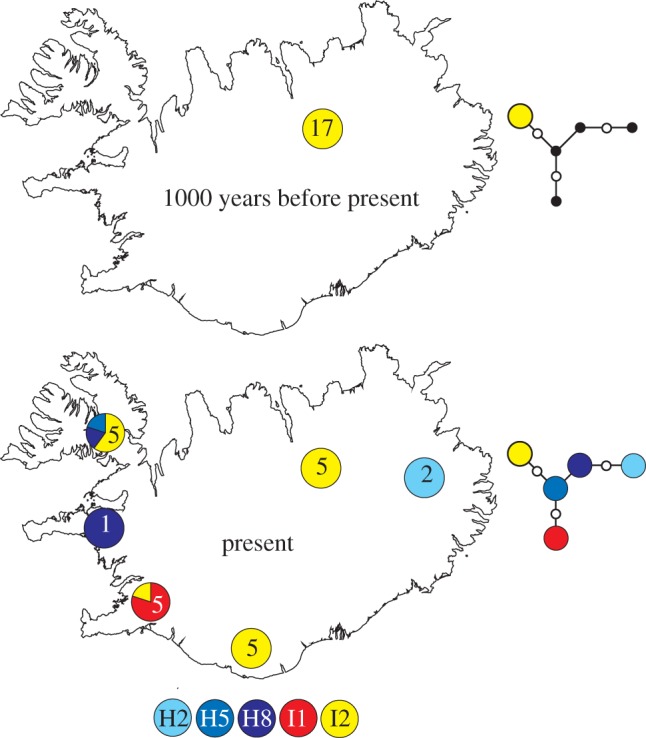
A map of Iceland showing the sample locations and sizes for both the modern and ancient datasets. Pie charts show the proportion of individuals at each locality assigned to each haplotype shown at the bottom of the figure. Median-joining networks to the right of the maps depict the relationships between the ancient and modern haplotypes present on Iceland. Black circles indicate the absence of modern haplotypes in the ancient population. White circles represent inferred haplotypes.
We successfully extracted and amplified an approximately 330 bp fragment of the mitochondrial control region [7] from 17 bones excavated at Sveigakot and Hofstaðir in the Mývatn region of northeast Iceland (see the electronic supplementary material, table S1). Sequences were assigned haplotypes based on comparison with data encompassing the modern and Late Pleistocene mitochondrial variation (GenBank accession numbers AY321123–AY321148; DQ500881–DQ630747; EF95220–EF95229). The data were compared against a previously published set of 23 mitochondrial sequences obtained from modern Icelandic fox specimens [21] (see the electronic supplementary material, figure S1). Further details regarding sample preparation, DNA extraction, PCR amplification and sequencing are presented in the electronic supplementary material.
The most parsimonious explanation for temporal change in observed haplotype frequencies is probably genetic drift and/or sampling error. To statistically test if the observed changes in haplotype frequency could be the result of genetic drift, sampling error or unobserved variation, we employed a simulation approach described by Sandoval-Castellanos [25]. Since the amount of genetic drift is dependent on the (in this case unknown) effective female population size (Nef), we executed the test for a range of plausible Nef values (100–100 000).
The results from this simulation demonstrated that the observed change in haplotype frequency was unlikely to be the result of genetic drift alone. We therefore employed an approximate Bayesian computation approach to account for the possibility of sea-ice-facilitated immigration to Iceland during the Little Ice Age. This approach makes use of extensive simulations using prior distributions for key unknown parameters such as Nef, migration rate and initial haplotype frequencies. Following the simulations, a rejection approach was employed in order to select a subset of the simulations that have summary statistics that are similar to those of the empirical dataset. Finally, posterior probability distributions of the unknown parameters (see above) were approximated from the subset of non-rejected simulations [26,27]. Additional details of the approximate Bayesian computation analysis are given in the electronic supplementary material.
Our model assumed a lack of mitochondrial phylogeographic structuring of modern haplotypes in Iceland. In order to test this assumption, we performed a simulation of one million generations, assuming either two or three genetically differentiated populations within Iceland. These two putative population structures were Northeast versus West (with sample sizes of 7 and 16) and Northeast versus Northwest versus Southwest (sizes 5, 5 and 10, respectively), which correspond with the most obvious pattern following the distribution of the modern haplotypes in Iceland [21] (figure 2). This simulation is equivalent to a randomization test, but haplotype frequencies are simulated from a Dirichlet prior distribution conditioned on the contemporary haplotype frequencies in Iceland. The Euclidean distances among haplotype frequencies across the simulations were compared with the Euclidean distances calculated from the empirical dataset, with the modern samples grouped according to the hypothesized population structures outlined above. The proportion of simulated distances equal to or higher than the observed among the modern samples is equivalent to the p-value in a statistical test.
3. Results
All 17 samples for which sequence data could be obtained possessed the identical, previously reported I2 haplotype (figure 2). This sequence is an Iceland-specific lineage that makes up 61 per cent of the modern population. The four remaining haplotypes present in modern Iceland were not detected, suggesting that each of their frequencies rose from 0 per cent in the ancient sample to 4 per cent (H5), 9 per cent (H2 and H8) and 17 per cent (I1). Although I1, like I2, is an Iceland-specific haplotype, H2, H5 and H8 are Holarctic haplotypes that have been observed in specimens from regions across the circumpolar distribution of the arctic fox [21].
The test for modern-day geographical structure in Iceland with contemporary haplotypes yielded non-significant p-values (p = 0.22 for the North–East–South structure and p = 0.18 for the East–West structure), suggesting that the contemporary population is not phylogeographically structured.
The simulation test for temporal changes in haplotype frequencies, however, demonstrated that the observed change in haplotype frequencies was unlikely to be due to genetic drift alone (p ≤ 0.009 for all simulated population sizes). Assuming some female immigration during the Little Ice Age, the ABC analysis suggested that the observed change in haplotype frequencies was consistent with a long-term effective female population size of approximately 7000–8000 individuals (figure 3), with a 95 per cent credible interval (CI) ranging from 610 to 18 600 effective females (table 1). The estimate for immigration was approximately 4.0 with a 95 per cent CI of 0.5–9.5 (figure 3). The estimated approximately 4.0 Bayes factor suggested that the Little Ice Age-mediated immigration hypothesis was more strongly supported than the drift hypothesis.
Figure 3.

(a) A joint density graph showing high (yellow) and low (blue) probability regions for the combination of two parameters: a logarithmic scale of effective female population size (Nef; horizontal axis) and effective number of female immigrants per generation (NMf; vertical axis). The square and diamond represent median and expected values and the black dashed line shows the borders of the 95% highest density region (HDR). (b) A depiction of the posterior probability distribution of the effective female population size (Nef) on a logarithmic scale. (c) A depiction of the posterior probability distribution of the effective number of female immigrants per generation (NMf). In (b,c), vertical lines correspond to the median (left) and expected (right) values, and the lighter blue bars encompass the 95% HDR.
Table 1.
Estimates of the posterior for female effective population size (Nef) between the first sample and the 1970s bottleneck, and for the effective number of immigrating females per generation (NMf).
| Nef | NMf | |
|---|---|---|
| expectation | 8201.8 | 4.53 |
| median | 7186.5 | 4.14 |
| upper limit (95% CI) | 18621.0 | 9.60 |
| lower limit (95% CI) | 610.0 | 0.51 |
4. Discussion
The genetic composition of the ancient samples indicates that the Icelandic fox population approximately 1000–1100 years ago was genetically homogeneous relative to the modern population (figure 2). There are three possible explanations for the presence of just a single haplotype in the ancient population, but five haplotypes, including three found across the Holarctic, in the modern population.
First, because all of the successfully amplified ancient samples were excavated from two sites in close proximity to each other in the Lake Mývatn region of northeast Iceland, it is possible that the lack of haplotype variation in the ancient samples is the result of our regionally restricted sample set. If foxes on Iceland possessed a strong phylogeographic signal, it is possible that other haplotypes existed in regions outside the Lake Mývatn region. The fact that all five modern fox sequences obtained from this location also possess the I2 haplotype (figure 2) provides superficial support for this argument.
A recent study of microsatellite data from Icelandic foxes, however, concluded that nuclear gene flow occurs extensively over the majority of the island [12]. Since arctic fox dispersal is not sex biased [28], it is unlikely that any mtDNA phylogeographic structure exists. In addition, our simulation analysis found no significant signature (p = 0.18–0.22) of geographic structuring of mitochondrial haplotypes in the modern population. As a result, it is unlikely that phylogeographic structuring could be responsible for the observed homogeneity in the ancient samples.
Second, it is possible that the elevated number of haplotypes in the modern population is the result of recent hybridization with farmed arctic foxes. Imported blue foxes have been farmed on Iceland since the 1930s, and escaped farmed foxes have been observed breeding with wild individuals in southwest Iceland [9]. In addition, hybridization between farmed arctic foxes and their wild counterparts, with ensuing shifts in haplotype frequencies, has been observed in other regions of the arctic fox's distribution [29]. However, because all farmed foxes in Iceland are fixed for a haplotype (H9) [30] that has not been observed in the contemporary wild population, introgression from farm foxes cannot account for the observed difference between the ancient and modern populations.
The most probable explanation for the observed increase in diversity is therefore sea-ice-mediated gene flow from adjacent areas of the Arctic during the Little Ice Age. The results of our simulation test strongly suggest that the novel variation observed in the modern sample was introduced into Iceland during the second half of the last millennium as Arctic foxes migrated across a transient sea ice bridge (figure 1).
Sea ice proliferation around Iceland was once highly variable, and many severe sea ice years were recorded during the late eighteenth and nineteenth centuries [16]. The last recorded grounding event of sea ice on the shores of Iceland occurred in 1877, after which sea ice abundance in the North Atlantic declined significantly [23]. Such grounding events are likely to have been more common during the Little Ice Age, owing to the increased frequency and severity of cold years. An intermittent sea ice bridge between Greenland and Iceland would have facilitated migration between these regions, a scenario consistent with the dispersal characteristics of the arctic fox [15].
The most extensive annual movements are generally made by ‘lemming’ foxes that are reliant upon microtine rodents as their primary resource base. Unstable ‘boom and bust’ rodent population cycles create discordance between fox numbers and resource availability, promoting dispersal during periods of prey scarcity [10,13,15,17–19]. ‘Coastal’ foxes are found in areas where rodents are absent, including Iceland, Svalbard and parts of Greenland [31], and they do not disperse to the same degree since their resource base is more stable [13].
In Svalbard, the genetic composition of the arctic fox population, which belongs to the ‘coastal’ ecotype, is influenced by pulses of ‘lemming’ foxes immigrating from neighbouring Siberia and North America, stimulated by crashes in the rodent population [18]. A similar process involving the nearby eastern Greenland population may have been responsible for the introduction of novel haplotypes into the coastal fox population of Iceland during the Little Ice Age. This would also explain why the I2 haplotype is found only in Iceland and did not spread to Greenland during the Little Ice Age, since the Icelandic stable resource base would not have provided an ecological basis for long-distance dispersal pulses even in the presence of a sea ice bridge [18].
The non-native haplotypes introduced during the Little Ice Age increased in frequency to eventually account for nearly 40 per cent of the modern variation in less than 500 years. The approximate Bayesian computation analyses suggest that this rate of change is consistent with an effective female population size of approximately 7000–8000 (figure 3) individuals during the time period between the Little Ice Age and the bottleneck in the 1970s. Assuming an equal sex ratio and that approximately 33 per cent of all adult females do not breed [11], this corresponds to a census population size of approximately 1800–46 000. This figure matches well the 10 500 ± 3000 foxes estimated in the most recent Iceland census [11]. These data also suggest that no additional bottlenecks (pre-dating the 1970s) are required to explain the observed change in haplotype frequencies.
5. Conclusion
Our collective results suggest that a single indigenous mitochondrial haplotype was present in Iceland prior to the Little Ice Age. The advent of cooler temperatures led to more frequent sea ice grounding events that facilitated arctic fox migration from Greenland (and possibly the rest of the Arctic) into Iceland. These immigrants possessed four additional haplotypes that, once established, increased in frequency until they reached their modern proportions.
Our analyses contribute to an accumulating body of evidence indicating the importance of sea ice in creating and maintaining the genetic population structure of the arctic fox across its distribution. The incidence of sea ice around Iceland, and hence the potential for immigration, has decreased significantly during the twentieth century, a trend that global warming has accelerated [32]. Increasing isolation from the rest of the Arctic will promote genetic divergence, further differentiating the Icelandic population from their mainland relatives.
Acknowledgements
G.L. was supported by a Research Council UK Academic Fellowship. Sample acquisition was supported by the National Science Foundation (grant no. 0732327). L.D. and E.S.-C. acknowledge support from Formas via the ERA-NET Biodiversa project Climigrate and the Strategic Research Programme EkoKlim at Stockholm University. We dedicate this publication to Prof. Pall Hersteinsson, who passed away in October 2011. Prof. Hersteinsson provided invaluable advice on the biology of the arctic fox, and the history of Iceland. Novel genetic sequences possess GenBank accession nos JX495788–JX495804.
References
- 1.Dugmore A. J., et al. 2005. The Norse landnám on the North Atlantic islands: an environmental impact assessment. Polar Record 41, 21–37 10.1017/S0032247404003985 (doi:10.1017/S0032247404003985) [DOI] [Google Scholar]
- 2.Dugmore A. J., Gisladóttir G., Simpson I. A., Newton A. 2009. Conceptual models of 1200 years of Icelandic soil erosion reconstructed using tephrochronology. J. North Atlantic 2, 1–18 10.3721/037.002.0103 (doi:10.3721/037.002.0103) [DOI] [Google Scholar]
- 3.Vickers K., Erlendsson E., Church M. J., Edwards K. J., Bending J. 2011. 1000 years of environmental change and human impact at Stóra-Mörk, southern Iceland: a multiproxy study of a dynamic and vulnerable landscape. The Holocene 21, 979–995 10.1177/0959683611400201 (doi:10.1177/0959683611400201) [DOI] [Google Scholar]
- 4.Hersteinsson P., Nyström V., Jóhannsson J. H., Guðjónsdóttir B., Hallsdóttir M. 2007. Elstu Þekktu Leifar Melrakka á íslandi. Náttúrufræðingurinn 76, 13–21 [Google Scholar]
- 5.Ramakrishnan U., Hadly E. A. 2009. Using phylochronology to reveal cryptic population histories: review and synthesis of 29 ancient DNA studies. Mol. Ecol. 18, 1310–1330 10.1111/j.1365-294X.2009.04092.x (doi:10.1111/j.1365-294X.2009.04092.x) [DOI] [PubMed] [Google Scholar]
- 6.Dalén L., Götherström A., Tannerfeldt M., Angerbjörn A. 2002. Is the endangered Fennoscandian arctic fox (Alopex lagopus) population genetically isolated? Biol. Conserv. 105, 171–178 10.1016/S0006-3207(01)00180-X (doi:10.1016/S0006-3207(01)00180-X) [DOI] [Google Scholar]
- 7.Nyström V., Angerbjörn A., Dalén L. 2006. Genetic consequences of a demographic bottleneck in the Scandinavian arctic fox. Oikos 114, 84–94 10.1111/j.2006.0030-1299.14701.x (doi:10.1111/j.2006.0030-1299.14701.x) [DOI] [Google Scholar]
- 8.Dalén L., et al. 2006. Population structure in a critically endangered arctic fox population: does genetics matter? Mol. Ecol. 15, 2809–2819 10.1111/j.1365-294X.2006.02983.x (doi:10.1111/j.1365-294X.2006.02983.x) [DOI] [PubMed] [Google Scholar]
- 9.Hersteinsson P., Angerbjörn A., Frafjord K., Kaikusalo A. 1989. The arctic fox in Fennoscandia and Iceland: management problems. Biol. Conserv. 49, 67–81 10.1016/0006-3207(89)90113-4 (doi:10.1016/0006-3207(89)90113-4) [DOI] [Google Scholar]
- 10.Angerbjörn A., Hersteinsson P., Tannerfeldt M. 2004. Arctic Fox. In Canids: foxes, wolves, jackals and dogs—status survey and conservation action plan (eds Sillero-Zubiri C., Hoffman M., MacDonald D. W.). Gland, Switzerland: IUCN [Google Scholar]
- 11.Hersteinsson P. 2010. Íslenska tófan. Veididagbok 2010. Reykjavik, Iceland: Environmental Agency of Iceland [Google Scholar]
- 12.Norén K., Angerbjörn A., Hersteinsson P. 2009. Population structure in an isolated arctic fox, Vulpes lagopus, population: the impact of geographical barriers. Biol. J. Linn. Soc. 97, 18–26 10.1111/j.1095-8312.2009.01172.x (doi:10.1111/j.1095-8312.2009.01172.x) [DOI] [Google Scholar]
- 13.Angerbjörn A., Hersteinsson P., Tannerfeldt M. 2004. Consequences of resource predictability in the arctic fox—two life history strategies. In The biology and conservation of wild canids (eds Macdonald D. W., Sillero-Zubiri C.), pp. 163–172 Oxford, UK: Oxford University Press [Google Scholar]
- 14.Pamperin N. J., Follmann E. H., Person B. T. 2008. Sea ice use by arctic foxes in northern Alaska. Polar Biol. 31, 1421–1426 10.1007/s00300-008-0481-5 (doi:10.1007/s00300-008-0481-5) [DOI] [Google Scholar]
- 15.Tarroux A., Berteaux D., Bêty J. 2010. Northern nomads: ability for extensive movements in adult arctic foxes. Polar Biol. 33, 1021–1026 10.1007/s00300-010-0780-5 (doi:10.1007/s00300-010-0780-5) [DOI] [Google Scholar]
- 16.Ogilvie A. E. J. 1991. Climatic changes in Iceland AD c. 865 to 1598, in the Norse of the North Atlantic. Acta Archaeol. 61, 233–251 [Google Scholar]
- 17.Norén K., et al. 2010. Arctic fox Vulpes lagopus population structure: circumpolar patterns and processes. Oikos 120, 873–885 10.1111/j.1600-0706.2010.18766.x (doi:10.1111/j.1600-0706.2010.18766.x) [DOI] [Google Scholar]
- 18.Norén K., Carmichael L., Fuglei E., Eide N. E., Hersteinsson P., Angerbjörn A. 2011. Pulses of movement across the sea ice: population connectivity and temporal genetic structure in the arctic fox. Oecologia 166, 973–984 10.1007/s00442-011-1939-7 (doi:10.1007/s00442-011-1939-7) [DOI] [PubMed] [Google Scholar]
- 19.Geffen E., et al. 2007. Sea ice occurrence predicts genetic isolation in the Arctic fox. Mol. Ecol. 16, 4241–4255 10.1111/j.1365-294X.2007.03507.x (doi:10.1111/j.1365-294X.2007.03507.x) [DOI] [PubMed] [Google Scholar]
- 20.Carmichael L. E., Krizan J., Nagy A., Fuglei E., Dumond M., Johnson D., Veitch A., Berteaux D., Strobeck C. 2007. Historical and ecological determinants of genetic structure in arctic canids. Mol. Ecol. 16, 3466–3483 10.1111/j.1365-294X.2007.03381.x (doi:10.1111/j.1365-294X.2007.03381.x) [DOI] [PubMed] [Google Scholar]
- 21.Dalén L., Fuglei E., Hersteinsson P., Kapel C. M. O., Roth J. D., Samelius G., Tannerfeldt M., Angerbjörn A. 2005. Population history and genetic structure of a circumpolar species: the arctic fox. Biol. J. Linn. Soc. 84, 79–89 10.1111/j.1095-8312.2005.00415.x (doi:10.1111/j.1095-8312.2005.00415.x) [DOI] [Google Scholar]
- 22.Mann M. E. 2002. Little Ice Age. In Encyclopedia of global environmental change (eds MacCracken M. C., Perry J. S.), pp. 504–509 Chichester, UK: Wiley [Google Scholar]
- 23.Grove J. M. 2003. Little Ice Ages: ancient and modern. London, UK: Routledge [Google Scholar]
- 24.McGovern T. H., et al. 2007. Landscapes of settlement in northern Iceland: historical ecology of human impact and climate fluctuation on the millennial scale. Am. Anthropol. 109, 27–51 10.1525/aa.2007.109.1.27 (doi:10.1525/aa.2007.109.1.27) [DOI] [Google Scholar]
- 25.Sandoval-Castellanos E. 2010. Testing temporal changes in allele frequencies: a simulation approach. Genet. Res. 92, 309–320 10.1017/S0016672310000339 (doi:10.1017/S0016672310000339) [DOI] [PubMed] [Google Scholar]
- 26.Beaumont M. A., Zhang W. Y., Balding D. J. 2002. Approximate Bayesian computation in population genetics. Genetics 162, 2025–2035 [DOI] [PMC free article] [PubMed] [Google Scholar]
- 27.Bertorelle G., Benazzo A., Mona S. 2010. ABC as a flexible framework to estimate demography over space and time: some cons, many pros. Mol. Ecol. 19, 2609–2625 10.1111/j.1365-294X.2010.04690.x (doi:10.1111/j.1365-294X.2010.04690.x) [DOI] [PubMed] [Google Scholar]
- 28.Tannerfeldt M., Angerbjorn A. 1996. Life history strategies in a fluctuating environment: establishment and reproductive success in the arctic fox. Ecography 19, 209–220 [Google Scholar]
- 29.Norén K., Kvaløy K., Nyström V., Landa A., Dalén L., Eide N. E., Ostbye E., Henttonen H., Angerbjörn A. 2009. Farmed Arctic foxes on the Fennoscandian mountain tundra: implications for conservation. Anim. Conserv. 12, 434–444 10.1111/j.1469-1795.2009.00269.x (doi:10.1111/j.1469-1795.2009.00269.x) [DOI] [Google Scholar]
- 30.Norén K., Dalén L., Kvaløy K., Angerbjörn A. 2005. Detection of farm fox and hybrid genotypes among wild arctic foxes in Scandinavia. Conserv. Genet. 6, 885–894 10.1007/s10592-005-9075-8 (doi:10.1007/s10592-005-9075-8) [DOI] [Google Scholar]
- 31.Braestrup F. W. 1941. A study on the arctic fox in Greenland. Immigration, fluctuations in numbers mainly based on trading statistics. Medd. Grønland 131, 1–101 [Google Scholar]
- 32.Vinnikov K. Y., Robock A., Stouffer R. J., Walsh J. E., Parkinson C. L., Cavalieri D. J., Mitchell J. F. B., Garrett D., Zakharov V. F. 1999. Global warming and Northern Hemisphere sea ice extent. Science 286, 1934–1937 10.1126/science.286.5446.1934 (doi:10.1126/science.286.5446.1934) [DOI] [PubMed] [Google Scholar]