

Abstract
The effects of global and local environmental changes are transmitted through networks of interacting organisms to shape the structure of communities and the dynamics of ecosystems. We tested the impact of elevated temperature on the top-down and bottom-up forces structuring experimental freshwater pond food webs in western Canada over 16 months. Experimental warming was crossed with treatments manipulating the presence of planktivorous fish and eutrophication through enhanced nutrient supply. We found that higher temperatures produced top-heavy food webs with lower biomass of benthic and pelagic producers, equivalent biomass of zooplankton, zoobenthos and pelagic bacteria, and more pelagic viruses. Eutrophication increased the biomass of all organisms studied, while fish had cascading positive effects on periphyton, phytoplankton and bacteria, and reduced biomass of invertebrates. Surprisingly, virus biomass was reduced in the presence of fish, suggesting the possibility for complex mechanisms of top-down control of the lytic cycle. Warming reduced the effects of eutrophication on periphyton, and magnified the already strong effects of fish on phytoplankton and bacteria. Warming, fish and nutrients all increased whole-system rates of net production despite their distinct impacts on the distribution of biomass between producers and consumers, plankton and benthos, and microbes and macrobes. Our results indicate that warming exerts a host of indirect effects on aquatic food webs mediated through shifts in the magnitudes of top-down and bottom-up forcing.
Keywords: climate warming, eutrophication, food web structure, microbial loop, predator–prey size ratio, trophic cascade
1. Introduction
Anticipating and understanding the response of ecosystems to ongoing and accelerating global change represents one of the most pressing challenges facing ecology. Our current ability to forecast the future state of communities and ecosystems under environmental change is rudimentary. Several major impediments stand in the way of developing robust models of ecological systems under long-term environmental change. One is that evolutionary responses in organismal physiology or life history may affect population dynamics and therefore ecological interactions, food web dynamics and ecosystem processes [1]. Another is that changes to global geochemical cycles affect multiple aspects of the environment simultaneously, and may interact with local environmental conditions [2,3]. Finally, indirect responses mediated through chains of food web interactions may overwhelm the direct effects on the physiology and demographics of organisms [4,5]. Here, we examine the last two issues by testing the effects of elevated temperatures on the strength of top-down and bottom-up control in replicated experimental ponds.
Freshwater ecosystems are heavily impacted by global changes as well as a range of local- and regional-scale sources of environmental stress [6]. Rising temperatures have reduced the duration of ice cover [7], changed patterns of phenology [8] and reduced nutrient regeneration from the hypolimnion owing to greater stability of stratification [9]. Regional changes such as reduced wind speed [9], increased atmospheric N deposition [10,11] and associated acidification have also altered conditions in many lentic habitats. Eutrophication due to nutrient runoff from point- and non-point sources has also produced a host of changes from cyanobacterial blooms to deep water anoxia [12]. Finally, top predators such as piscivorous fishes have been locally over-exploited to the point of extirpation in some habitats and introduced outside of their native ranges in others [13–15]. The extent to which environmental changes occurring at local, regional and global scales interact in ways that amplify or diminish their effects are poorly understood but critical to understanding the changes taking place in ecosystems generally.
A variety of evidence suggests that elevated temperatures may affect the sensitivity of food webs to top-down and bottom-up forcing. First, harmful algal blooms in both coastal marine systems and lakes become more pronounced in warmer conditions [16]. Second, organisms at different positions within aquatic food webs vary in sensitivity to temperature, leading to imbalanced responses to temperature change among trophic levels [17,18]. More active primary consumers may exert stronger top-down effects on producers [19,20]; however, their greater metabolic demands may intensify resource limitation and reduce their abundances, leading to weaker effects at the long-term population level [21]. Finally, warming often shifts community size structure by favouring dominance by smaller-body-sized organisms at several different positions within aquatic food webs [22–24]. These responses to rising temperatures all suggest that the impact of top-down and bottom-up forces in lentic ecosystems may be altered in a warmer world.
Another aspect of aquatic structure and function likely to be influenced by environmental changes is the coupling between benthic and pelagic food webs, two habitats that are linked by movement of materials and organisms in ways that influence the community dynamics, structure and functioning [25]. Benthic production sustains high biomass of mobile top consumers such as fish predators [26] which may intensify top-down control in the pelagic zone [27]. Eutrophication has been shown to shift primary production in lakes from benthic to pelagic organisms as a result of light competition and shading from surface blooms of phytoplankton [28]. Predator–prey size ratios are also greater in the plankton than the benthos of lentic systems [26], which may lead to stronger top-down effects in the pelagic zone [29]. Warming may exert different effects on benthic and pelagic organisms, and therefore alter the interactions between them, as a result of its effects on primary production, consumption or physical processes in freshwaters. However, little is known about the potential importance of such interactions.
The effects of temperature on microbes and their role in controlling primary production, sinking and nutrient cycling are also largely unknown. A number of studies have found indirect food web effects of warming on microbial abundances. For instance, Vidussi et al. [30] showed that experimental warming reduced the abundance of heterotrophic bacteria in the coastal Mediterranean as a result of enhanced top-down grazing effects. Similarly, Weitere et al. [31] found that warming reduced the effects of benthic mussels on heterotrophic flagellates and thereby indirectly reduced bacterial abundance in river plankton. These examples suggest that the indirect effects of temperature on microbial communities can be substantial. However, it remains unknown how microbial responses to temperature compare to shifts in other groups of aquatic organisms, or depend on the size structure of food webs.
Here, we describe the results of a replicated field mesocosm experiment using representative communities of benthic and pelagic invertebrates and micro-organisms found in small freshwater habitats. We used a factorial design to test the effects of elevated temperatures (+3°C above ambient, with natural patterns of seasonal and diurnal variation), the presence of planktivorous fishes (three-spined sticklebacks) and fertilization with N and P that greatly enhanced ecosystem production. We tested the effects of the three perturbations on food web structure in terms of the biomass of pelagic phytoplankton, zooplankton, bacteria and viruses, as well as benthic periphyton and macroinvertebrate consumers, sampled at various intervals over a 16-month period encompassing two summers and one winter. We also examined changes in net ecosystem production (NEP), measured as the amplitude of daily fluctuations in dissolved O2 concentrations [24]. We previously described the responses of the mean and temporal variability of phytoplankton biomass [32], showing that warming dampened the response of phytoplankton to fertilization but magnified the effects of trophic cascades. We also examined the effects on exchange of biomass between terrestrial and aquatic environments in terms of incorporation of terrestrial plant detritus into aquatic food webs, and the emergence of insect and amphibian biomass from the ponds [33]. The goal of the present study is to compare the direct and indirect effects of predators, temperature and eutrophication on the structure and function of aquatic food webs and to test for interactive or non-additive responses to the three manipulated factors.
2. Methods
Experimental communities of freshwater plankton and benthos were established in 40 1136 l Rubbermaid plastic stock tanks at the University of British Columbia's experimental pond facility (Vancouver, Canada) in May 2009. Sediments and plankton from long-standing nearby experimental ponds were used to inoculate the tanks with a diverse community of organisms. All tanks were left open to allow oviposition by insects and emergence of aquatic organisms to the surrounding terrestrial ecosystem. Treatments of warming, fish and nutrients were applied in a 2 × 2 × 2 factorial design with five replicates per treatment combination. Warming was maintained by the use of 300 W electrical aquarium heaters (Hagen, Canada) left on at all times that maintained a 3.04 ± 0.05°C increase over ambient temperature. We added 264 μg of nitrogen l−1 (as NaNO3) and 27 μg of phosphorus l−1 (as KH2PO4) monthly to nutrient addition tanks, resulting in an N : P molar ratio of 22. We introduced five three-spined sticklebacks (Gasterosteus aculeatus) of mean standard body length 52.4 ± 0.05 (s.e.) mm per tank on 9 June 2009 to initiate predation treatments. Detailed methods for mesocosm inoculation, sampling and taxonomic identification of pelagic organisms are described in detail in Kratina et al. [32]. Benthic macroinvertebrates were sampled in three microhabitats: (i) on bottom of mesocosms with standard sweeps within a 0.02 m2 cylinder placed in two different areas, (ii) on tank walls with two sweeps of a 12 cm wide, 0.5 mm mesh net from the tank bottom to the water's surface and (iii) in the water column with three sweeps of a 25 cm net across the mesocosm. Invertebrates were identified and biomass calculated from length–mass regressions following Greig et al. [33]. The measurements were aggregated into a single biomass estimate after adjusting for the relative area of each habitat type. Periphyton biomass was determined fluorometrically from algae growth on 25 cm2 unglazed tiles in the same manner as Thompson & Shurin [34].
Viruses and bacteria were enumerated by flow cytometry following [35]. One millilitre samples were collected from the surface, fixed with glutaraldehyde (1% final concentration) and frozen at −80°C. To determine viral abundance, samples were thawed, diluted (1 : 100) with Tris–EDTA buffer (pH 8.0) and stained with SYBR Green I (Invitrogen) for 10 min at 80°C. After cooling at room temperature for 5 min, samples were analysed on a Becton–Dickinson FACSCalibur flow cytometer equipped with a 15 mW, 488 nm air-cooled argon ion laser. Stained samples were run under green fluorescence for 1 min with a flow rate of approximately 37 µl min−1 at an event rate of 100–1000 events s−1. Bacterial abundance was determined as above except the stained samples were incubated at room temperature for 15 min and then run for 1 min with a flow rate of approximately 66 µl min−1. In both cases, a known concentration of yellow-green 0.92 µm beads (Fluoresbrite Microparticles) was added to the samples as internal standards. Abundance was calculated from listmode files using the freeware cytowin (available at http://www.sb-roscoff.fr/Phyto). Briefly, counts within a defined box on a green fluorescence verse side scatter cytogram were calculated in order to exclude the internal standards and background noise. These counts, along with duration, flow rate and dilution were used to calculate viruses ml−1 and/or bacteria ml−1.
We measured dissolved oxygen (DO) and temperature approximately 15 cm below the water surface using an in situ DO meter. NEP was calculated 11 times over the course of the study as the difference in DO concentration between dawn and dusk (see the electronic supplementary material, figure S1). The daily change in DO depends on both in situ biological processes and physical factors affecting the gas flux between the dissolved state and the atmosphere. These include barometric pressure, wind speed, alkalinity, salinity and temperature [17]. The first four factors were consistent among all of the replicates in our experiment, and therefore should not affect our measure of the treatment effects on NEP. The effect of our temperature treatment (a difference of 3°C) on oxygen flux was also likely to be minimal in comparison with biological fluxes. For instance, Vogelaar et al. [36] found no effect of temperature on the oxygen transfer rate between tap water and the air between 20°C and 55°C. Similarly, Yvon-Durocher et al. [17] estimated the effect of average warming of 4°C on gas flux in experimental ponds to be negligible. We therefore treat daily change in DO in the tanks as a reliable comparative measure of NEP, reflecting effects of the treatments on biological processes rather than differences in physical conditions.
The organisms and NEP were sampled at varying intervals throughout the experiment (see the electronic supplementary material, figure S1). Biomass was converted to units of g C m−2 for benthic organisms (periphyton and zoobenthos) and g C m−3 for pelagic organisms (all other groups) by assuming a carbon biomass to chlorophyll biomass ratio of 1 : 40 for phytoplankton [37,38] and 1 : 50 for periphyton [39], carbon content per cell of 0.2 fg for viruses [40] and 20 fg for bacteria [41], an average carbon content of 48 per cent of dry mass for zooplankton [42] and 51.8 per cent of ash free dry mass for benthic invertebrates [43].
(a). Statistical analyses
We tested the effects of the treatments on the multivariate dispersion of the biomass of the six functional groups using redundancy analysis (RDA [44]) for the two time periods when all measurements were taken within the same four-week period (May and October 2010). Significance of the explanatory power of the treatment axes was tested by a permutation test of three-way model with 999 randomizations. RDA was used as an ‘omnibus’ test of the significance of the treatment combinations on the overall variation among the dependent variables to support our comparisons of biomass distribution throughout the food web [45].
To illustrate the univariate effects of the treatments, we used linear mixed effects (LMEs) models with the individual mesocosm treated as a random effect and analysed the time series across the entire experiment [46]. This analysis allowed us to interpret the independent and interactive effects of the perturbations on biomass that were apparent across all sampling dates, but not the time dependence of the effects. This choice was made for simplicity of interpretation; owing to the seven dependent variables and many sampling periods, we focus only on those effects that were apparent across time rather than those that emerged at particular points during the experiment. We presented the results of different time-series analyses using time as a fixed variable and demonstrating the seasonally varying effects of treatments and their interactions elsewhere [32,33]. All data were loge-transformed prior the analyses to achieve normality of residuals and to improve homoscedasticity of variances. The statistical analyses were performed in R v. 2.11.1 [47], using packages nlme [48] and Vegan [49].
Finally, to compare the strength of the cascading effects of fish on primary producers between the benthos and the plankton, we calculated the log ratio of biomass with versus without fish for each of the four dates when periphyton was measured and the four phytoplankton chlorophyll samples collected on the nearest dates. We used a paired sample t-test with these four temporal replicates to ask whether the fish effect differed between the two habitats.
3. Results
Analysis of data across the entire experiment with LME showed that treatments had independent and interactive effects on the biomass of the six trophic groups as well as on NEP (figure 1). Bacteria biomass increased with both fertilization and fish addition. The effects of fish on bacteria were amplified in the warmed tanks (the positive fish × warming interaction; figure 1), although the main effect of warming was not significant. Both warming and nutrients enhanced biomass of viruses, while fish had negative main effects on viruses and a negative interaction with nutrients.
Figure 1.

Effects of the treatments on the six functional groups sampled. Each point indicates the parameter estimate (±1 s.e.) for the treatment or interaction term in the linear mixed effects model. A positive value indicates that biomass of that group increased in a particular treatment and a negative value indicates the opposite. Each model is based on the loge-transformed biomass (in g C m−3 for pelagic organisms and g C m−2 for benthos), with individual mesocosm treated as a random effect. The treatments are: W, warming; N, nutrients; F, fish predation. The symbols show the significance of the parameter estimates as follows: *p < 0.05, **p < 0.01 and ***p < 0.001.
In the pelagic food chain, phytoplankton biomass declined with warming and increased with both nutrients and fish (figure 1). The effect of fish was magnified by both warming and fertilization. Fish reduced zooplankton biomass while nutrients had positive effects, and the top-down effects of fish on zooplankton were dampened by fertilization (the fish × nutrient interaction).
The three main treatment effects on periphyton were similar to those for phytoplankton, with negative effects of warming and positive effects of fish and nutrients (figure 1). There was a negative interaction between warming and nutrients, indicating that the effects of eutrophication were reduced at high temperatures. Biomass of benthic invertebrates was greatly increased by nutrients and reduced by fish, but no other effects were significant. The three-way treatment interaction was not significant for any group of organisms.
In order to compare the effects of the treatments among trophic levels and habitats, we examined the distribution of biomass among different food web compartments for the two time periods where all organisms were sampled within four weeks of one another. A multivariate RDA found that all the treatments and their interactions explained a significant portion of the dispersion of biomass among functional groups in October 2010 (p ≤ 0.01), while all except warming × fish (p = 0.16) and the three-way interaction (p = 0.08) were significant in May 2010 (see the electronic supplementary material, table S1). Plots of biomass differences revealed shifts in food web structure in all three main treatment comparisons (figure 2). Fish produced bottom-heavy food webs with greater biomass of phytoplankton, periphyton and bacteria, and reduced biomass of zooplankton, benthic invertebrates and viruses. Nutrients increased the biomass of every group sampled, and also appeared to concentrate biomass among autotrophs more than consumers (compare the fertilized and unfertilized biomass distribution in figure 2; see also electronic supplementary material, table S2). Warming, by contrast, led to greater proportion of biomass among consumers by reducing producer biomass without associated changes in consumers (except for viruses, figure 1; electronic supplementary material, table S2). Some of the effects shown in figure 1 that were significant across the entire experiment are not apparent on the dates shown in figure 2 because of temporal variability in treatment effects.
Figure 2.

The biomass of the six food web components studied in our experiment under (a) fish predation, (b) warming and (c) nutrient treatments. Each of the four pelagic groups is measured in loge g C m−3 and the benthic invertebrates and periphyton in loge g C m−2. We plotted the average biomass for two time periods when all groups of organisms were sampled within the same four-week period. Solid black lines are the average biomass for each of the two treatment levels representing the main effects and the coloured bars are±1 s.e.
To show how the effects of fish predators are altered by warming in the benthos versus pelagic, we present the direct and indirect interaction strengths of fish with all six functional groups, as well as litter decomposition rates (from Greig et al. [33]) from two time periods when all dependent variables were sampled (figure 3). Interaction strength is measured as the loge of the ratio of biomass of each group in the presence versus the absence of fish. Warming strengthened the cascading indirect effects of fish on phytoplankton but not on periphyton (figures 1 and 3) or detritus breakdown [33]. In addition, the top-down effects of fish on pelagic producers were stronger than those on periphyton (t-test comparing loge ratios of periphyton biomass in the tanks with versus without fish on the four sampling dates with the four closest phytoplankton samples, t = −5.2, d.f. = 3, p = 0.01; figure 3). Thus, although fish had significant cascading effects in both benthic and pelagic environments, the effects were substantially stronger in the plankton.
Figure 3.

Food web diagrams showing the interaction between the fish and warming treatments, and the stronger effects of fish in pelagic than benthic habitats. The solid arrows represent direct effects of fish on zooplankton and benthic invertebrates, the dashed arrows indirect effects on primary producers and micro-organisms. The black arrows show measured direct or indirect effects, whereas the grey arrows represent unmeasured interactions. ‘Detritus’ is the decomposition of leaf litter in the tanks as reported in Greig et al. [33]. Arrow thickness is proportional to the magnitude of biomass change. The values shown indicate the loge of the ratio of biomass in the tanks with and without fish, averaged across sampling dates (with 1 s.e. in parentheses), and asterisks indicate values that were significantly affected by warming (the interactions shown in figure 1). Phytoplankton responded more strongly to fish than periphyton or leaf litter decomposition, even though the direct effect of fish on zooplankton was similar to that on benthic invertebrates. (a) Unwarmed and (b) warmed food webs.
Warming, nutrients and fish all enhanced NEP (p < 0.0001, table 1 and figure 4). However, there were no significant statistical interactions among treatments over the course of the experiment (table 1). The effects of warming and fish tended to be stronger during the second summer when productivity was higher (figure 4), while the warming effect was more consistent throughout the experiment.
Table 1.
ANOVA summary for effects of the treatments on net ecosystem production (NEP), measured 11 times over the experiment with time treated as a random effect in the model. Significant values are in bold.
| source | estimate | s.e. | p-value |
|---|---|---|---|
| intercept | 0.913 | 0.124 | <0.0001 |
| warming | 0.089 | 0.020 | <0.0001 |
| nutrients | 0.293 | 0.020 | <0.0001 |
| fish | 0.121 | 0.020 | <0.0001 |
| warming × nutrients | −0.022 | 0.020 | 0.271 |
| warming × fish | −0.020 | 0.020 | 0.320 |
| nutrients × fish | 0.037 | 0.020 | 0.066 |
| warming × nutrients × fish | −0.033 | 0.020 | 0.101 |
Figure 4.
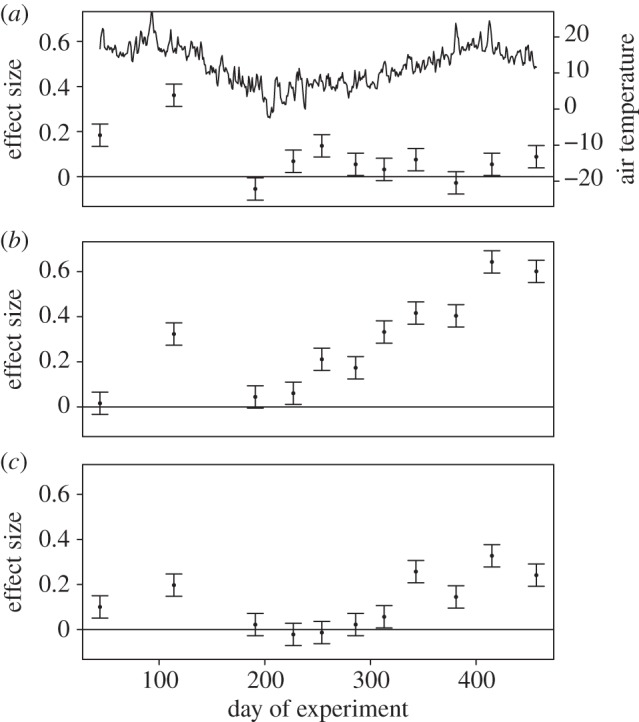
Effects of the main treatments on net ecosystem production (NEP). The y-axis shows the parameter estimates (±1 s.e.) from a linear mixed effects model with time as a random effect nested within tank. The summary ANOVA table is shown in table 1. (a) Also shows the mean daily air temperature throughout the experiment. (a) Warming, (b) nutrients and (c) fish.
4. Discussion
This study revealed a number of surprising independent and interactive effects of elevated temperature, predators and eutrophication on the structure and function of shallow freshwater ecosystems. Although the three perturbations all independently enhanced NEP, their effects on the distribution of biomass among different food web components were distinct and sometimes interactive. For instance, fish and nutrients both increased producer biomass and NEP, whereas warming enhanced production while reducing standing biomass of the dominant primary producers (phytoplankton and periphyton). Warming reduced the biomass of autotrophs without affecting consumer biomass, resulting in top-heavy biomass pyramids. Fish had the opposite effect (reducing biomass of invertebrates and increasing that of autotrophs and bacteria), while eutrophication increased biomass across all trophic levels. Indirect responses to all three treatments had major effects on the biomass of both bacteria and viruses, indicating that microbial responses to rising temperatures are governed by local food web interactions.
Our results support a body of evidence showing a positive effect of temperature on aquatic NEP despite negative effects on both benthic and pelagic primary producer biomass [17,24,50]. We did not measure DO in the tanks with sufficient frequency to estimate the magnitudes of ecosystem respiration or gross primary production, therefore we are unable to test the expectation that respiration responds more strongly to warming than production [17,50]. Greater NEP owing to warming may therefore represent higher rates of photosynthesis or respiration, or some combination of the two. Although all three treatments increased NEP, the overall magnitude of the warming effect was smaller than either fertilization or fish (see parameter estimates in table 1). This suggests that local top-down and bottom-up forces may exert larger effects on NEP than elevated temperature. In addition, none of the statistical interactions were significant for NEP, indicating that warming effects were largely independent of top-down and bottom-up control.
Warming induced a shift towards top-heavy food webs with greater biomass of consumers relative to producers, mainly due to declines in periphyton and phytoplankton biomass without associated changes in consumer biomass. While the parameter estimates for the warming effects were positive for both invertebrates and microbes (figure 1), only viruses showed a significant increase in biomass in the warmed treatment. Although standing stocks of autotrophs declined, rates of total system NEP were consistently higher in the warmed treatments. This indicates that warming increased the rate of turnover of both benthic and pelagic autotrophs, in agreement with Yvon-Durocher et al. [23], who found that warming reduced the density of phytoplankton and shifted dominance towards small cells without affecting zooplankton density. Warming therefore has a direct negative effect on autotrophs that may be further magnified by reduced nutrient supply owing to greater stability of stratification in large water bodies, leading to concurrent declines in both zooplankton and phytoplankton [51].
The top-down effects of fish and bottom-up effects of nutrients we observed agree with other studies of eutrophication and trophic cascades in freshwater ecosystems. Fish shifted the biomass distribution of the food web towards benthic and pelagic producers, as well as bacteria, and lower biomass of invertebrates. Strong top-down effects of fish predators are frequently observed in both the benthic and pelagic zones of lakes and ponds [52,53]. Eutrophication led to increases in biomass across all trophic levels, including microbes. This agrees with observational studies showing increasing biomass of organisms at all positions in aquatic food webs with higher levels of nutrient loading [54,55]. The accumulation of biomass with eutrophication appeared to be in agreement with Del Giorgio & Gasol [56], in that fertilization favoured bottom-heavy food webs with greater increases in producer biomass relative to consumers (although we have no statistical test of this pattern). Similarly, Cole et al. [57] found that bacterial production and abundance increased with primary production, but that eutrophication favoured greater phytoplankton biomass relative to bacteria. Our results suggest that, while eutrophication increased biomass among all groups, phytoplankton responded more strongly than zooplankton, pelagic bacteria or viruses (figure 2).
The direct and indirect effects of fish predators were stronger in pelagic habitats than in the benthos (figure 3). While fish exerted similar impacts on zooplankton and benthic invertebrates, the indirect cascading effects were substantially stronger for phytoplankton than on periphyton. A meta-analysis of trophic cascade experiments [53] found that predators in lentic systems reduced benthic herbivore biomass to a greater degree than zooplankton, but that the response by primary producers was similar between the two habitats. This result, and the experiment presented here, suggests that the interaction between producers and herbivores is stronger in pelagic than benthic habitats. Differences in consumer size structure may be behind this contrast. Benthic food webs are considerably less size structured than pelagic, with greater variance in body size within producers, herbivores and predators and smaller differences between trophic levels [26,58]. Large predator–prey size ratios often lead to stronger interactions [29]. Our results also support a general pattern that larger organisms exert disproportionately strong impacts on ecosystem structure and function relative to their lower numerical abundances [59,60]. The presence of fish predators induced shifts in NEP and biomass distribution throughout our experimental food webs that were comparable in magnitude to 3°C of warming and massive nutrient loading (figure 1). Thus, the size structure of food webs, which is sensitive to exploitation and warming among other stresses [22,61], should be considered on par with the physical and chemical environment as a driver of ecosystem functioning.
Warming interacted with shifts in top-down and bottom-up control to affect food web structure, two examples of ‘thermal cascades’ [62] or chains of indirect effects unleashed by higher temperatures. First, warming dampened the effects of eutrophication on periphyton (figure 1). While the warming × nutrient interactive effect was not significant for phytoplankton, the magnitude of the parameter value was similar to that for periphyton. In addition, Kratina et al. [32] present an analysis of the same chlorophyll data with time treated as a fixed factor and show a strong seasonal shift in the importance of warming for dampening the effects of nutrients on phytoplankton biomass. The cause of the reduced nutrient effects at higher temperatures is unknown, but may be related to the shift towards smaller cells or stronger nutrient limitation in the phytoplankton community [22,23]. Our results support the conclusions of Binzer et al. [63] who use an allometrically scaled food chain model to show interactive effects of warming and fertilization on food chain dynamics. Warming also amplified the effects on top-down control via trophic cascades from planktivorous fishes on both phytoplankton and bacteria, but not on periphyton (figures 1 and 3). The stronger top-down control at high temperatures likely resulted from changes in the structure or metabolism of the zooplankton community [32]. Our results agree with those from grassland systems where warming strengthened the top-down effects of spider predators over grasshoppers and plants [64]. Stronger top-down control by predators may therefore be a pervasive feature of future, warmer ecosystems.
We also found independent and interactive effects of temperature with top-down and bottom-up processes in microbial communities. Warming significantly increased the biomass of viruses but not bacteria. One of the most surprising results of our study was that viruses responded negatively to the presence of fish. Viral abundance is positively correlated with trophic status across freshwater and marine ecosystems [65], a result that may indicate that virus abundance tracks that of bacteria or phytoplankton [66]. However, the response of viral biomass to our treatments closely reflected that of the zooplankton (figure 1). Fish reduced biomass of both zooplankton and viruses, and their effect was dampened under eutrophication (the negative nutrient × fish interaction). This result may reflect either that zooplankton serve as important hosts for many pelagic viruses, or that zooplankton have important indirect effects on the life cycle of viruses via their impacts on the structure of the phytoplankton community. The impact of upper trophic levels such as fish on the biomass and role of viruses in aquatic systems remains poorly studied, and our results indicate that predators may indirectly interact with both viruses and bacteria in surprising ways.
The generality of our findings depends on how well the tanks serve as an analogy for natural aquatic systems. The diversity and biomass of benthic and pelagic organisms in the tanks were comparable to those in the source ponds from which they were inoculated. Physical processes such as mixing and thermal stratification will clearly be different in larger water bodies than in our experimental venue. Nevertheless, our study, along with others of similar design [17], points to substantial structural and functional changes in the intensity of trophic interactions that accompany warming.
5. Conclusions
Our experiment indicates substantial indirect effects of warmer temperatures on the top-down and bottom-up processes that control the distribution of biomass throughout aquatic food webs. All three perturbations resulted in greater NEP, but had very different effects on food web components. Higher temperature caused declines in benthic and pelagic autotrophs without significantly affecting any of the four groups of heterotrophs examined. Fish predators had the opposite effect from temperature, reducing invertebrate biomass while enhancing producers and bacteria, and enrichment increased biomass across all trophic levels. These effects are almost certain to vary among diverse ecosystems with differences in physical structure that are likely to determine the responses to warming in natural systems. However, our results provide strong evidence that the effects of rising temperatures are likely to vary with local conditions and to alter the processes shaping freshwater food webs in future climates.
Acknowledgments
We thank the Natural Sciences and Engineering Research Council of Canada (NSERC), and the New Zealand Foundation for Research, Science & Technology (UBX0901) for financial support. We thank Trisha Atwood, Annalise Barber, Ticiana Carvalho-Pereira, Amanda Klemmer, Melia Legace, Andrew O'Farrell, Wendy Palen, Sacha O'Regan, Dylan Rawlyk, John Richardson, Matt Robinson, Anne Rutherford, Dolph Schluter, Gerald Singh and Curtis Suttle for assistance and useful discussions. Rick Ketler and Andy Black generously provided air temperature data. We thank the organizers of SIZEMIC and the funding agencies (the German Research Foundation award no. JA 1726/3-1, the Cluster of Excellence award CLiSAP (EXC177) and the University of Hamburg) for organizing the conference and special issue.
References
- 1.Coulson T., MacNulty D. R., Stahler D. R., vonHoldt B., Wayne R. K., Smith D. W. 2011. Modeling effects of environmental change on wolf population dynamics, trait evolution, and life history. Science 334, 1275–1278 10.1126/science.1209441 (doi:10.1126/science.1209441) [DOI] [PubMed] [Google Scholar]
- 2.Vinebrooke R. D., Cottingham K. L., Norberg J., Scheffer M., Dodson S. I., Maberly S. C., Sommer U. 2004. Impacts of multiple stressors on biodiversity and ecosystem functioning: the role of species co-tolerance. Oikos 104, 451–457 10.1111/j.0030-1299.2004.13255.x (doi:10.1111/j.0030-1299.2004.13255.x) [DOI] [Google Scholar]
- 3.Christensen M. R., Graham M. D., Vinebrooke R. D., Findlay D. L., Paterson M. J., Turner M. A. 2006. Multiple anthropogenic stressors cause ecological surprises in boreal lakes. Glob. Change Biol. 12, 2316–2322 10.1111/j.1365-2486.2006.01257.x (doi:10.1111/j.1365-2486.2006.01257.x) [DOI] [Google Scholar]
- 4.Suttle K. B., Thomsen M. A., Power M. E. 2007. Species interactions reverse grassland responses to changing climate. Science 315, 640–642 10.1126/science.1136401 (doi:10.1126/science.1136401) [DOI] [PubMed] [Google Scholar]
- 5.Bothwell M. L., Sherbot D. M. J., Pollock C. M. 1994. Ecosystem response to solar ultraviolet-B radiation: influence of trophic-level interactions. Science 265, 97–100 10.1126/science.265.5168.97 (doi:10.1126/science.265.5168.97) [DOI] [PubMed] [Google Scholar]
- 6.Adrian R., et al. 2009. Lakes as sentinels of climate change. Limnol. Oceanogr. 54, 2283–2297 10.4319/lo.2009.54.6_part_2.2283 (doi:10.4319/lo.2009.54.6_part_2.2283) [DOI] [PMC free article] [PubMed] [Google Scholar]
- 7.Magnuson J. J., et al. 2000. Historical trends in lake and river ice cover in the Northern Hemisphere. Science 289, 1743–1746 10.1126/science.289.5485.1743 (doi:10.1126/science.289.5485.1743) [DOI] [PubMed] [Google Scholar]
- 8.Winder M., Schindler D. E. 2004. Climatic effects on the phenology of lake processes. Glob. Change Biol. 10, 1844–1856 10.1111/j.1365-2486.2004.00849.x (doi:10.1111/j.1365-2486.2004.00849.x) [DOI] [Google Scholar]
- 9.O'Reilly C. M., Alin S. R., Plisnier P. D., Cohen A. S., McKee B. A. 2003. Climate change decreases aquatic ecosystem productivity of Lake Tanganyika, Africa. Nature 424, 766–768 10.1038/nature01833 (doi:10.1038/nature01833) [DOI] [PubMed] [Google Scholar]
- 10.Elser J. J., Andersen T., Baron J. S., Bergstrom A. K., Jansson M., Kyle M., Nydick K. R., Steger L., Hessen D. O. 2009. Shifts in lake N:P stoichiometry and nutrient limitation driven by atmospheric nitrogen deposition. Science 326, 835–837 10.1126/science.1176199 (doi:10.1126/science.1176199) [DOI] [PubMed] [Google Scholar]
- 11.Holtgrieve G. W., et al. 2011. A coherent signature of anthropogenic nitrogen deposition to remote watersheds of the northern hemisphere. Science 334, 1545–1548 10.1126/science.1212267 (doi:10.1126/science.1212267) [DOI] [PubMed] [Google Scholar]
- 12.Carpenter S. R., Caraco N. F., Correll D. L., Howarth R. W., Sharpley A. N., Smith V. H. 1998. Nonpoint pollution of surface waters with phosphorus and nitrogen. Ecol. Appl. 8, 559–568 10.1890/1051-0761(1998)008[0559:NPOSWW]2.0.CO;2 (doi:10.1890/1051-0761(1998)008[0559:NPOSWW]2.0.CO;2) [DOI] [Google Scholar]
- 13.Kitchell J. F., Schindler D. E., OgutuOhwayo R., Reinthal P. N. 1997. The Nile perch in Lake Victoria: interactions between predation and fisheries. Ecol. Appl. 7, 653–664 10.1890/1051-0761(1997)007[0653:TNPILV]2.0.CO;2 (doi:10.1890/1051-0761(1997)007[0653:TNPILV]2.0.CO;2) [DOI] [Google Scholar]
- 14.Rahel F. J. 1992. Homogenization of fish faunas across the United States. Science 288, 854–856 10.1126/science.288.5467.854 (doi:10.1126/science.288.5467.854) [DOI] [PubMed] [Google Scholar]
- 15.Knapp R. A., Matthews K. R., Sarnelle O. 2001. Resistance and resilience of alpine lake fauna to fish introductions. Ecol. Monogr. 71, 401–421 10.1890/0012-9615(2001)071[0401:RAROAL]2.0.CO;2 (doi:10.1890/0012-9615(2001)071[0401:RAROAL]2.0.CO;2) [DOI] [Google Scholar]
- 16.Johnk K. D., Huisman J., Sharples J., Sommeijer B., Visser P. M., Stroom J. M. 2008. Summer heatwaves promote blooms of harmful cyanobacteria. Glob. Change Biol. 14, 495–512 10.1111/j.1365-2486.2007.01510.x (doi:10.1111/j.1365-2486.2007.01510.x) [DOI] [Google Scholar]
- 17.Yvon-Durocher G., Jones J. I., Trimmer M., Woodward G., Montoya J. M. 2010. Warming alters the metabolic balance of ecosystems. Phil. Trans. R. Soc. B 365, 2117–2126 10.1098/rstb.2010.0038 (doi:10.1098/rstb.2010.0038) [DOI] [PMC free article] [PubMed] [Google Scholar]
- 18.O'Connor M. I., Piehler M. F., Leech D. M., Anton A., Bruno J. F. 2009. Warming and resource availability shift food web structure and metabolism. PLoS Biol. 7, e1000178. 10.1371/journal.pbio.1000178 (doi:10.1371/journal.pbio.1000178) [DOI] [PMC free article] [PubMed] [Google Scholar]
- 19.Rall B. C., Brose U., Hartvig M., Kalinkat G., Schwarzmüller F., Vucic-Pestic O., Petchey O. L. 2012. Universal temperature and body-mass scaling of feeding rates. Phil. Trans. R. Soc. B 367, 2923–2934 10.1098/rstb.2012.0242 (doi:10.1098/rstb.2012.0242) [DOI] [PMC free article] [PubMed] [Google Scholar]
- 20.Twomey M., Brodte E., Jacob U., Brose U., Crowe T. P., Emmerson M. C. 2012. Idiosyncratic species effects confound size-based predictions of responses to climate change. Phil. Trans. R. Soc. B 367, 2971–2978 10.1098/rstb.2012.0244 (doi:10.1098/rstb.2012.0244) [DOI] [PMC free article] [PubMed] [Google Scholar]
- 21.O'Connor M. I., Gilbert B., Brown C. J. 2011. Theoretical predictions for how temperature affects the dynamics of interacting herbivores and plants. Am. Nat. 178, 626–638 10.1086/662171 (doi:10.1086/662171) [DOI] [PubMed] [Google Scholar]
- 22.Daufresne M., Lengfellner K., Sommer U. 2009. Global warming benefits the small in aquatic ecosystems. Proc. Natl Acad. Sci. USA 106, 12 788–12 793 10.1073/pnas.0902080106 (doi:10.1073/pnas.0902080106) [DOI] [PMC free article] [PubMed] [Google Scholar]
- 23.Yvon-Durocher G., Montoya J. M., Trimmer M., Woodward G. 2011. Warming alters the size spectrum and shifts the distribution of biomass in freshwater ecosystems. Glob. Change Biol. 17, 1681–1694 10.1111/j.1365-2486.2010.02321.x (doi:10.1111/j.1365-2486.2010.02321.x) [DOI] [Google Scholar]
- 24.Yvon-Durocher G., Allen A. P. 2012. Linking community size structure and ecosystem functioning using metabolic theory. Phil. Trans. R. Soc. B 367, 2998–3007 10.1098/rstb.2012.0246 (doi:10.1098/rstb.2012.0246) [DOI] [PMC free article] [PubMed] [Google Scholar]
- 25.Schindler D. E., Scheuerell M. D. 2002. Habitat coupling in lake ecosystems. Oikos 98, 177–189 10.1034/j.1600-0706.2002.980201.x (doi:10.1034/j.1600-0706.2002.980201.x) [DOI] [Google Scholar]
- 26.Rooney N., McCann K. S., Moore J. C. 2008. A landscape theory for food web architecture. Ecol. Lett. 11, 867–881 10.1111/j.1461-0248.2008.01193.x (doi:10.1111/j.1461-0248.2008.01193.x) [DOI] [PubMed] [Google Scholar]
- 27.Vander Zanden M. J., Essington T. E., Vadeboncoeur Y. 2005. Is pelagic top-down control in lakes augmented by benthic energy pathways? Can. J. Fish. Aquatic Sci. 62, 1422–1431 10.1139/f05-042 (doi:10.1139/f05-042) [DOI] [Google Scholar]
- 28.Vadeboncoeur Y., Jeppesen E., Vander Zanden M. J., Schierup H. H., Christoffersen K., Lodge D. M. 2003. From Greenland to green lakes: cultural eutrophication and the loss of benthic pathways in lakes. Limnol. Oceanogr. 48, 1408–1418 10.4319/lo.2003.48.4.1408 (doi:10.4319/lo.2003.48.4.1408) [DOI] [Google Scholar]
- 29.Emmerson M. C., Raffaelli D. 2004. Predator–prey body size, interaction strength and the stability of a real food web. J. Anim. Ecol. 73, 399–409 10.1111/j.0021-8790.2004.00818.x (doi:10.1111/j.0021-8790.2004.00818.x) [DOI] [Google Scholar]
- 30.Vidussi F., et al. 2011. Effects of experimental warming and increased ultraviolet B radiation on the Mediterranean plankton food web. Limnol. Oceanogr. 56, 206–218 10.4319/lo.2011.56.1.0206 (doi:10.4319/lo.2011.56.1.0206) [DOI] [Google Scholar]
- 31.Weitere M., Dahlmann J., Viergutz C., Arndt H. 2008. Differential grazer-mediated effects of high summer temperatures on pico- and nanoplankton communities. Limnol. Oceanogr. 53, 477–486 10.4319/lo.2008.53.2.0477 (doi:10.4319/lo.2008.53.2.0477) [DOI] [Google Scholar]
- 32.Kratina P., Greig H. S., Thompson P. L., Carvalho-Pereira T. S. A., Shurin J. B. 2012. Warming modifies trophic cascades and eutrophication in experimental freshwater communities. Ecology 93, 1421–1430 10.1890/11-1595.1 (doi:10.1890/11-1595.1) [DOI] [PubMed] [Google Scholar]
- 33.Greig H. S., Kratina P., Thompson P. L., Palen W. J., Richardson J. S., Shurin J. B. 2012. Warming, eutrophication, and predator loss amplify subsidies between aquatic and terrestrial ecosystems. Glob. Change Biol. 18, 504–514 10.1111/j.1365-2486.2011.02540.x (doi:10.1111/j.1365-2486.2011.02540.x) [DOI] [Google Scholar]
- 34.Thompson P. L., Shurin J. B. 2011. Regional zooplankton biodiversity provides limited buffering of pond ecosystems against climate change. J. Anim. Ecol. 81, 251–259 10.1111/j.1365-2656.2011.01908.x (doi:10.1111/j.1365-2656.2011.01908.x) [DOI] [PubMed] [Google Scholar]
- 35.Brussaard C. P. D. 2004. Optimization of procedures for counting viruses by flow cytometry. Appl. Environ. Microbiol. 70, 1506–1513 10.1128/AEM.70.3.1506-1513.2004 (doi:10.1128/AEM.70.3.1506-1513.2004) [DOI] [PMC free article] [PubMed] [Google Scholar]
- 36.Vogelaar J. C. T., Klapwijk A., Van Lier J. B., Rulkens W. H. 2000. Temperature effects on the oxygen transfer rate between 20 and 55°C. Water Res. 34, 1037–1041 10.1016/S0043-1354(99)00217-1 (doi:10.1016/S0043-1354(99)00217-1) [DOI] [Google Scholar]
- 37.Cole J. J., Carpenter S. R., Kitchell J. F., Pace M. L. 2002. Pathways of organic carbon utilization in small lakes: results from a whole-lake C-13 addition and coupled model. Limnol. Oceanogr. 47, 1664–1675 10.4319/lo.2002.47.6.1664 (doi:10.4319/lo.2002.47.6.1664) [DOI] [Google Scholar]
- 38.Kritzberg E. S., Cole J. J., Pace M. L., Graneli W., Bade D. L. 2004. Autochthonous versus allochthonous carbon sources of bacteria: results from whole-lake C-13 addition experiments. Limnol. Oceanogr. 49, 588–596 10.4319/lo.2004.49.2.0588 (doi:10.4319/lo.2004.49.2.0588) [DOI] [Google Scholar]
- 39.Azim M. E. 2010. Photonsynthetic periphyton and surfaces. In Plankton of inland waters (ed. Likens G. E.), pp. 175–182 San Diego, CA: Academic Press [Google Scholar]
- 40.Suttle C. A. 2000. Ecological, evolutionary, and geochemical consequences of viral infection of cyanobacteria and eukaryotic algae. In Viral ecology (ed. Hurst C. J.), pp. 247–296 Boston, MA: Kluwer Academic [Google Scholar]
- 41.Lee S., Fuhrman J. A. 1987. Relationships between biovolume and biomass of naturally derived marine bacterioplankton. Appl. Environ. Microbiol. 53, 1298–1303 [DOI] [PMC free article] [PubMed] [Google Scholar]
- 42.Andersen T., Hessen D. O. 1991. Carbon, nitrogen, and phosphorus-content of fresh-water zooplankton. Limnol. Oceanogr. 36, 807–814 10.4319/lo.1991.36.4.0807 (doi:10.4319/lo.1991.36.4.0807) [DOI] [Google Scholar]
- 43.Salonen K., Sarvala J., Hakala I., Viljanen M. L. 1876. Relation of energy and organic-carbon in aquatic invertebrates. Limnol. Oceanogr. 21, 724–730 10.4319/lo.1976.21.5.0724 (doi:10.4319/lo.1976.21.5.0724) [DOI] [Google Scholar]
- 44.Legendre P., Legendre L. 1998. Numerical ecology, 2nd edn Amsterdam, The Netherlands: Elsevier [Google Scholar]
- 45.Garcia L. V. 2004. Escaping the Bonferroni iron claw in ecological studies. Oikos 105, 657–663 10.1111/j.0030-1299.2004.13046.x (doi:10.1111/j.0030-1299.2004.13046.x) [DOI] [Google Scholar]
- 46.Pinheiro J. C., Bates D. M. 2000. Mixed-effects models in S and S-Plus. New York, NY: Springer [Google Scholar]
- 47.R Development Core Team 2010. R: A language and environment for statistical computing, R package version 2.11.1. Vienna, Austria: R Foundation for Statistical Computing [Google Scholar]
- 48.Pinheiro J. C., Bates D. M., DebRoy S., Sarkar D. 2012. nlme: Linear and nonlinear mixed effects models. R Statistical Software version 3.1-103. [Google Scholar]
- 49.Oksanen J., Guillaume Blanchet F., Kindt R., Legendre P., O'Hara R. B., Simpson G. L., Solymos P., Stevens M. M. H., Wagner H. 2010. Vegan: community ecology package, R Statistical Software version 1.17-4 [Google Scholar]
- 50.Lopez-Urrutia A., San Martin E., Harris R. P., Irigoien X. 2006. Scaling the metabolic balance of the oceans. Proc. Natl Acad. Sci. USA 103, 8739–8744 10.1073/pnas.0601137103 (doi:10.1073/pnas.0601137103) [DOI] [PMC free article] [PubMed] [Google Scholar]
- 51.Roemmich D., McGowan J. 1995. Climatic warming and the decline of zooplankton in the California Current. Science 267, 1324–1326 10.1126/science.267.5202.1324 (doi:10.1126/science.267.5202.1324) [DOI] [PubMed] [Google Scholar]
- 52.Carpenter S. R., et al. 2001. Trophic cascades, nutrients, and lake productivity: whole-lake experiments. Ecol. Monogr. 71, 163–186 10.1890/0012-9615(2001)071[0163:TCNALP]2.0.CO;2 (doi:10.1890/0012-9615(2001)071[0163:TCNALP]2.0.CO;2) [DOI] [Google Scholar]
- 53.Shurin J. B., Borer E. T., Seabloom E. W., Anderson K., Blanchette C. A., Broitman B., Cooper S. D., Halpern B. S. 2002. A cross-ecosystem comparison of the strength of trophic cascades. Ecol. Lett. 5, 785–791 10.1046/j.1461-0248.2002.00381.x (doi:10.1046/j.1461-0248.2002.00381.x) [DOI] [Google Scholar]
- 54.Ware D. M., Thomson R. E. 2005. Bottom-up ecosystem trophic dynamics determine fish production in the Northeast Pacific. Science 308, 1280–1284 10.1126/science.1109049 (doi:10.1126/science.1109049) [DOI] [PubMed] [Google Scholar]
- 55.Persson L., Diehl S., Johansson L., Andersson G., Hamrin S. F. 1992. Trophic interactions in temperate lake ecosystems: a test of food-chain theory. Am. Nat. 140, 59–84 10.1086/285403 (doi:10.1086/285403) [DOI] [Google Scholar]
- 56.Del Giorgio P. A., Gasol J. M. 1995. Biomass distribution in fresh-water plankton communities. Am. Nat. 146, 135–152 10.1086/285790 (doi:10.1086/285790) [DOI] [Google Scholar]
- 57.Cole J. J., Findlay S., Pace M. L. 1988. Bacterial production in fresh and saltwater ecosystems: a cross-system overview. Mar. Ecol. Prog. Ser. 43, 1–10 10.3354/meps043001 (doi:10.3354/meps043001) [DOI] [Google Scholar]
- 58.Shurin J. B., Gruner D. S., Hillebrand H. 2006. All wet or dried up? Real differences between aquatic and terrestrial food webs. Proc. R. Soc. B 273, 1–9 10.1098/rspb.2005.3377 (doi:10.1098/rspb.2005.3377) [DOI] [PMC free article] [PubMed] [Google Scholar]
- 59.Duffy J. E. 2003. Biodiversity loss, trophic skew and ecosystem functioning. Ecol. Lett. 6, 680–687 10.1046/j.1461-0248.2003.00494.x (doi:10.1046/j.1461-0248.2003.00494.x) [DOI] [Google Scholar]
- 60.Wood S. A., Lilley S. A., Schiel D. R., Shurin J. B. 2010. Organismal traits are more important than environment for species interactions in the intertidal zone. Ecol. Lett. 13, 1160–1171 10.1111/j.1461-0248.2010.01508.x (doi:10.1111/j.1461-0248.2010.01508.x) [DOI] [PubMed] [Google Scholar]
- 61.Blanchard J. L., Dulvy N. K., Jennings S., Ellis J. R., Pinnegar J. K., Tidd A., Kell L. T. 2005. Do climate and fishing influence size-based indicators of Celtic Sea fish community structure? ICES J. Mar. Sci. 62, 405–411 10.1016/j.icesjms.2005.01.006 (doi:10.1016/j.icesjms.2005.01.006) [DOI] [Google Scholar]
- 62.Brose U., Dunne J. A., Montoya J. M., Petchey O. L., Schneider F. D., Jacob U. 2012. Climate change in size-structured ecosystems. Phil. Trans. R. Soc. B 367, 2903–2912 10.1098/rstb.2012.0232 (doi:10.1098/rstb.2012.0232) [DOI] [PMC free article] [PubMed] [Google Scholar]
- 63.Binzer A., Guill C., Brose U., Rall B. C. 2012. The dynamics of food chains under climate change and nutrient enrichment. Phil. Trans. R. Soc. B 367, 2935–2944 10.1098/rstb.2012.0230 (doi:10.1098/rstb.2012.0230). [DOI] [PMC free article] [PubMed] [Google Scholar]
- 64.Barton B. T., Beckerman A. P., Schmitz O. J. 2009. Climate warming strengthens indirect interactions in an old-field food web. Ecology 90, 2346–2351 10.1890/08-2254.1 (doi:10.1890/08-2254.1) [DOI] [PubMed] [Google Scholar]
- 65.Clasen J. L., Brigden S. M., Payet J. P., Suttle C. A. 2008. Evidence that viral abundance across oceans and lakes is driven by different biological factors. Freshw. Biol. 53, 1090–1100 10.1111/j.1365-2427.2008.01992.x (doi:10.1111/j.1365-2427.2008.01992.x) [DOI] [Google Scholar]
- 66.Bouvy M., et al. 2011. Trophic interactions between viruses, bacteria and nanoflagellates under various nutrient conditions and simulated climate change. Environ. Microbiol. 13, 1842–1857 10.1111/j.1462-2920.2011.02498.x (doi:10.1111/j.1462-2920.2011.02498.x) [DOI] [PubMed] [Google Scholar]