

Abstract
Experimental data from intergenerational field manipulations of entire food webs are scarce, yet such approaches are essential for gauging impacts of environmental change in natural systems. We imposed 2 years of intermittent drought on stream channels in a replicated field trial, to measure food web responses to simulated climate change. Drought triggered widespread losses of species and links, with larger taxa and those that were rare for their size, many of which were predatory, being especially vulnerable. Many network properties, including size–scaling relationships within food chains, changed in response to drought. Other properties, such as connectance, were unaffected. These findings highlight the need for detailed experimental data from different organizational levels, from pairwise links to the entire food web. The loss of not only large species, but also those that were rare for their size, provides a newly refined way to gauge likely impacts that may be applied more generally to other systems and/or impacts.
Keywords: allometric scaling, ecological networks, experimental mesocosms, stream ecosystems, tritrophic food chains, trivariate food webs
1. Introduction
Most empirical studies of climate change in multispecies systems have focused on community structure or ecosystem processes in space-for-time or temporal surveys [1,2], or laboratory experiments [3]. Unfortunately, surveys, which are correlative, are often confounded (e.g. by long-term change in other stressors or biogeographic effects in space-for-time surveys) and unable to discern causal relationships, whereas laboratory experiments can identify mechanisms but suffer from limited realism [4]. A compromise between realism and control may be reached in larger-scale field experiments, several of which have recently demonstrated ecological responses to simulated climate change [5–10].
There is a growing body of empirical evidence and theory that larger organisms suffer disproportionately from climate change [4,7,11–14]. Their reduced abundance or extinction has particularly important implications for aquatic food webs, which are often strongly size-structured [15–21]. For instance, changes in the mass and abundance of consumers and resources can trigger dramatic changes, including trophic cascades and secondary extinctions [4,10,17]. Quantifying allometric relationships between the abundance and body mass of interacting species therefore offers a potentially powerful means of gauging responses to perturbations and assessing how structural change might be linked to dynamical properties [20]. One way to quantify the size structure of trophic networks is via the construction of ‘trivariate food webs’, in which species populations are plotted on log–log body mass-abundance (MN) axes as nodes that are connected via feeding links [15,17,18,20–22]. Within this log-scale MN space allometric scaling relationships can be quantified at different organizational levels, from feeding links between species populations, to food chains and coarser-grained attributes of the whole food web [20,21].
Two fundamental measures are used here, with others derived from them, to quantify trophic size structure [20,21,23]. First, the length of a trophic link between a consumer (C) and its resource (R) is the number of orders of magnitude of difference in body mass plus the number of orders of magnitude of difference in population density between R and C. Second, the link angle relates to the ‘rate of change’ in biomass, population productivity, and population consumption from R to C. See §2 for precise definitions and interpretation. Tritrophic chains, which have been the focus of considerable research on indirect effects of consumer–resource interactions in food webs (e.g. trophic cascades), contain an intermediate species (I) between R and C. Derived measures include the between-angle in a tritrophic chain, which describes the change of angle in the upper link (I, C) relative to the lower link (R, I) [20]. At the whole-network level, the web's allometric slope is the scaling coefficient of log(N) regressed on log(M) for all the trophically connected species: a steepening of this slope may imply a weakening of top-down effects, as consumers become smaller and/or rarer relative to their resources. Data on links and angles at different levels of organization within and across the food web can therefore be used to make inferences about the impacts of perturbations, especially where the size spectrum is not affected evenly.
Climate change effects on freshwater ecosystems include predictions that droughts will increase in frequency and intensity in the near future [22,24,25]. Even partial or temporary drying can threaten the local survival of many species, especially those that are large, rare, and/or high in the food web [1,26–28]. It is also plausible, though not previously demonstrated, that species that are rare for their size could be especially vulnerable to local extinction, even if they are not rare absolutely. Rarity-for-size should be evident from residuals from the food web's general log(N)-versus-log(M) regression, which typically describes the average or expected abundance of a species (given its size) within a web [29]. Taxa could be rare for their size because the ambient environmental conditions are already sub-optimal for them: hence, they may be particularly vulnerable to the imposition of additional pressures. Currently, almost nothing is known about food web responses to drought, as the few studies conducted to date have been either correlational surveys or have not measured species-level interactions explicitly in a trophic network context. There is great potential for drought to alter size structure at multiple levels of food web organization: we carried out the first long-term (i.e. intergenerational) replicated field experiment to assess this.
Eight artificial stream channels were exposed to either intermittent drought (6 days of dewatering per month) or left as permanently flowing controls, to mimic the patchy drying of natural river beds during extreme low flows [26,27]. The experiment ran for 2 years, allowing intergenerational responses and indirect food web effects to be manifested. At the end, eight replicate food webs were constructed (four per treatment). Earlier work in this system revealed that the control channels contained food webs of realistic complexity [30], and that biomass production of large, long-lived consumers was strongly reduced by drought, with some local extinctions, whereas some smaller short-lived consumers flourished [27,28]. Given that large consumers can impose strong top-down control on their prey in aquatic systems [9,10,28], we anticipated significant drought impacts on food web size structure. We tested the following hypotheses: (i) drought causes losses of not only large taxa, but also those that were rare for their body mass; (ii) drought steepens the allometric slope of the web, and reduces the area occupied by the community in log–log MN space (the ‘constraint space’ sensu [31]) due, respectively, to relative increases in the abundances of smaller taxa and loss of rare-for-size species that deviated from the general MN scaling relationship; (iii) drought causes the collapse of many tritrophic food chains into pairwise feeding links, owing to loss of larger predators, with maximum trophic level and mean food chain link count declining accordingly; (iv) loss of rare-for-size species homogenizes link angles and between-angles within the web, as these will have links that deviate most strongly from the angle of the general community log(N)-versus-log(M) regression slope; (v) indirect effects (i.e. those beyond the direct effects of species loss per se) will be manifested and detectable via changes in the core community common to both treatments.
2. Methods
The experiment ran for 2 years (March 2000–February 2002) in four blocks of outdoor stream channel mesocosms at the Freshwater Biological Association River Laboratory, UK (50°40′48′′ N, 2°11′06′′ W) [31], which received water and suspended particles (including algae, detritus and invertebrates) through a feeder pipe from an adjacent stream. Each channel (width 0.33 m, length 12 m, depth 0.30 m) was controlled by upstream input valves and drained under gravity via an outlet 10 cm above a downstream channel. Channels were filled to 20 cm depth with stony substrate, providing physical refugia for suitably adapted species during drought [26,27]. Physicochemistry and biotic assemblages were similar among channels and to the source stream prior to drought [26,27,32–34].
Stream water was diverted into all channels in the initial two months. A drought treatment (intermittent flow; 6 day flow cessation per month) was subsequently applied to one channel per block, with the second channel in each block acting as a control. The drought treatment mimicked the repeated, patchy dewatering that occurs during severe supra-seasonal droughts [26]. Under drought, surface flows ceased and drying of exposed substrata occurred in patches over the 6 days, whereas wetted subsurface interstices and small pools persisted [26,27]. Flows were continuous in the control channels throughout the experiment.
At the end of the experiment, we collected the entire invertebrate assemblage in each mesocosm and constructed food webs by direct observation of feeding links via analysis of dissected gut contents (of 4305 individuals in total; five fields of view per individual at 200× magnification). Gut contents were identified to genus or species where possible. Food webs were constructed independently for each replicate channel (after Brown et al. [30]). The body mass (mg) of each processed animal was calculated from body length (mm), measured to the nearest 0.1 mm, using length–mass regressions (see Ledger et al. [26] and references therein), macroinvertebrate abundances, N, were determined from Surber samples (0.025 m−2) collected from each replicate mesocosm at the end of the experiment. Animals from these samples (n = 3049) were identified to the lowest practicable taxonomic unit (usually species or genus), counted and measured. Abundance and individual body mass were similarly derived for algal resources [30].
Logistic regressions were used to ascertain whether absolute rarity and rarity-for-size were important determinants of extinction risk of species from the food webs. Here, two predictors were computed per species in the control replicate of each block: (i) log(M) itself, accounting for larger species having higher extinction risk; (ii) the residual from the log(N)-versus-log(M) regression of the replicate. Base-10 logarithms were used throughout. The first predictor represents rarity, because size and rarity are very strongly correlated in our webs (and many others). The second predictor is rarity-for-size: species which are rare for their size will have substantially negative residuals. This gave two numbers for each species in each replicate per block. If the same species was present in the control replicates of two blocks, separate numbers were derived. The response variable was whether or not a species went extinct (true, false) in the paired drought treatment replicates. Logistic regression was performed using two models: one with predictor log(M) only, and one with both log(M) and residuals as predictors, to see whether rarity-for-size provided any additional explanatory power for loss from the food web. Logistic regression is a standard technique whereby the transformed risk of an event occurring is written as a linear function of predictor variables. Because absolute rarity is often highly correlated with size and rarity-for-size is independent of size for webs with homoskedastic log(N)-versus-log(M) regressions (i.e. most webs [29], including ours), the latter measure is a new possible determinant of extinction risk.
MN trivariate webs were produced for each replicate channel by overlaying links between consumers and resources on the log(N)-versus-log(M) scatterplot of taxa: several community metrics were defined from this plot (after Cohen et al. [20]). The community-wide allometric slope is the slope of the log(N)-versus-log(M) ordinary linear regression through all taxa connected to the web by a trophic link. When expressed as an angle between −90° and 90°, measured anticlockwise from the positive horizontal axis, this is the allometric angle; for instance, slope −1 corresponds to angle −45°. The community span is the range of log(M), from the smallest to the largest taxa, plus the range of log(N), from the rarest to the most abundant taxa, over all connected taxa. We also derived the area of the minimum convex hull (a polygon) in MN space that bounded all the connected species within each web (after Leaper & Raffaelli [31]).
The link length between a consumer (C) and its resource (R) was defined as |log(MC) − log(MR)| + |log(NC) − log(NR)| [20], i.e. the l1 distance or Manhattan distance from mathematics. The first term summand is the absolute log body mass ratio, i.e. the number of orders of magnitude of difference in body mass between R and C. The second summand is the absolute log density ratio, i.e. the number of orders of magnitude of difference in population density. When plotting a link as a vector from R to C, its length is the distance from R to C (l1 distance). Its angle is the anticlockwise turn to the link from a horizontal arrow parallel to the horizontal (log(M)) axis, starting from R and pointing right (between −180° and 180°, where −180° is allowed but 180° is not). If the link angle equals −45°, then its slope equals −1 and, resource biomass BR = MRNR equals consumer biomass BC = MCNC [20].
We also calculated several higher-level measures of network size structure. A 2-chain is a tritrophic interaction consisting of three taxa (R, intermediate taxon I and C) and two links [20]. On MN plots, the upper link lies below and to the right of the lower link if body mass increases and abundance declines moving up the chain, as in many chains. The 2-span is the l1 distance from R to C (see the electronic supplementary material, figure S1). Within each chain, Llower and Alower describe the length and angle of the lower link (from R to I); Lupper and Aupper describe the length and angle of the upper link (from I to C). The between-angle of a 2-chain is the angle, between −180° and 180° (including −180° but not 180°), from the vector of the lower link (R, I) to that of the upper link (I, C). Positive angles are anticlockwise rotations (e.g. if the lower link is −50° and the upper link −35°, then the between-angle is +15°). A positive between-angle means that biomass, population productivity and population consumption increase faster in the upper link (from I to C) than in the lower link (from R to I): this may imply increased transfer efficiency moving up the chain, as might arise when comparing a carnivorous upper link with a herbivorous lower link, for instance. It could also imply greater potential for top-down cascades, as the top consumer is larger and/or more abundant than would be expected from simple extrapolation from the lower link. The distribution of between-angles thus describes how log body mass ratios and log population density ratios vary among the tritrophic chains within a food web.
Maximal food chains (‘chains’ henceforth) from a basal to a top taxon were counted as any chain passing from resource to consumer at each link, but not including the same taxon twice (cannibalistic links were excluded and cycles were not traversed completely). The chain span is the l1 distance between a chain's top and basal taxa. Food chain link count is the average number of links contained within all the chains in the web. Several more familiar whole-network parameters were also calculated, namely: web size (S, the number of nodes), number of feeding links (L) and directed connectance (C = L/S2).
Two additional scenarios were also considered: (i) extinct species in the drought treatment were excluded from controls; and (ii) the ‘core community’ alone was considered, i.e. only species that were common to each pair of drought and control webs were considered. This was to gauge potential emergent or indirect effects beyond those due directly to species loss or gain. Between-treatment differences in food web parameters were tested using paired t-tests, with blocks providing the pairings. Computations were performed in R [35].
3. Results
As predicted (hypothesis 1), body mass influenced vulnerability to drought, with a second-order effect of rarity-for-size (figure 1). The coefficient (−0.22) for log(M) in our logistic regressions demonstrates that larger species were more likely to be lost. The positive coefficient (0.794) for residuals shows that species that were rare for their size were additionally vulnerable (p < 0.0001; electronic supplementary material, table S1).
Figure 1.

Food web nodes, plotted using the body mass (log10(M)) and abundance (log10(N)) of each taxon. Each panel (a–d) shows a comparison between a replicate control food web and its paired drought treatment: circles denote taxa that were present in both webs, diamonds denote species that were in the drought treatment but not in the control and triangles denote species in the control but lost from the drought webs. Ordinary linear regression lines were used to assess extinction risk and so were fitted to species denoted by circles and triangles only. Panels correspond to blocks.
Several of the fine-grained measures revealed marked changes within the food web, whereas other measures, including some commonly used ones (e.g. connectance), were unaffected (table 1). Drought significantly reduced the numbers of species and links. In agreement with predictions (hypothesis 2), allometric slopes steepened slightly but significantly from −0.50 to −0.52, reflecting reductions in large, rare taxa and increases in some of the smaller taxa: these patterns were also evident in the two additional scenarios that accounted for species loss or gain in the drought treatment (see the electronic supplementary material, table S2). Convex hull area decreased, but not in either of the additional scenarios. Hypothesis 3 was also supported: as species were lost and/or had their links stripped away, the maximum trophic level of the web decreased as the number of links from the base to the highest predator declined. The proportion of intermediate nodes declined, basal nodes increased and top-level nodes remained the same (see the electronic supplementary material, table S2): intermediate nodes were ‘lost’ either via extinction or by promotion to the termini of chains (figure 2). Consequently, the total number of tritrophic food chains declined, with many collapsing into simple pairwise links, even though mean food chain link count did not decline significantly (table 1). Hypothesis 4 was supported: owing to the loss of rare-for-size species, link angles and between-angles were more tightly constrained in the drought treatments than in the controls (figures 3 and 4). Between-angles also became more negative in the drought treatment owing to declines in both body mass and abundance of top predators in tritrophic chains.
Table 1.
Mean ± s.e. community structure measures for the control (c1–c4) and drought (d1–d4) treatments for connected species within the food web. See §2 for details. Paired t-tests were performed to test for significance of mean differences (d) from zero. Results for additional scenarios testing for indirect effects (see §2) are given in the electronic supplementary material, table S2.
| control webs | drought webs | d | t | p | |
|---|---|---|---|---|---|
| pairwise links, tritrophic interactions and food chains | |||||
| median link angle | −27.17 ± 0.24 | −27.59 ± 0.24 | 0.42 | 3.52 | 0.039 |
| mean link length | 18.23 ± 0.18 | 18.62 ± 0.11 | −0.40 | −2.11 | 0.125 |
| median Alower | −26.67 ± 0.40 | −25.76 ± 1.02 | −0.91 | −1.04 | 0.375 |
| median Aupper | −31.80 ± 1.09 | −142.30 ± 9.67 | 110.5 | 10.46 | 0.002 |
| log10 number of tritrophic chains | 2.05 ± 0.20 | 1.29 ± 0.01 | 0.77 | 4.05 | 0.027 |
| median Abetween | −8.99 ± 3.93 | −116.53 ± 9.78 | 107.5 | 13.40 | 0.001 |
| mean two-span | 19.2 ± 0.19 | 18.05 ± 0.11 | 1.11 | 6.21 | 0.008 |
| mean chain span | 19.4 ± 0.17 | 18.7 ± 0.10 | 0.69 | 6.06 | 0.009 |
| mean food chain link count | 1.49 ± 0.17 | 1.09 ± 0.01 | 0.39 | 2.32 | 0.103 |
| trophic level of apex predator (chain length) | 2.53 ± 0.05 | 2.16 ± 0.04 | 0.37 | 7.64 | 0.005 |
| community scaling and whole-network properties | |||||
| allometric slope | −0.50 ± 0.006 | −0.52 ± 0.002 | 0.017 | 3.71 | 0.034 |
| community span | 28.1 ± 0.17 | 27.7 ± 0.08 | 0.33 | 1.94 | 0.148 |
| constraint space area (MN convex hull area) | 60.23 ± 2.45 | 43.09 ± 1.86 | 17.14 | 4.76 | 0.018 |
| S, the number of connected food web nodes | 60 ± 1.3 | 46.5 ± 1.3 | 13.5 | 11.34 | 0.001 |
| log10 L, number of links | 2.48 ± 0.05 | 2.31 ± 0.04 | 0.17 | 3.20 | 0.050 |
| C, directed connectance | 0.08 ± 0.008 | 0.09 ± 0.008 | −0.01 | −0.87 | 0.448 |
Figure 2.

Food webs from the manipulative field experiment, in which eight replicate stream channels were exposed to monthly intermittent drought (d) or permanent flow (c). The webs are ordered vertically by trophic level, from basal resources to apex predators. Numbers correspond to species identifiers (see figure 1 for symbols legend; see the electronic supplementary material for codes and taxonomic identities).
Figure 3.
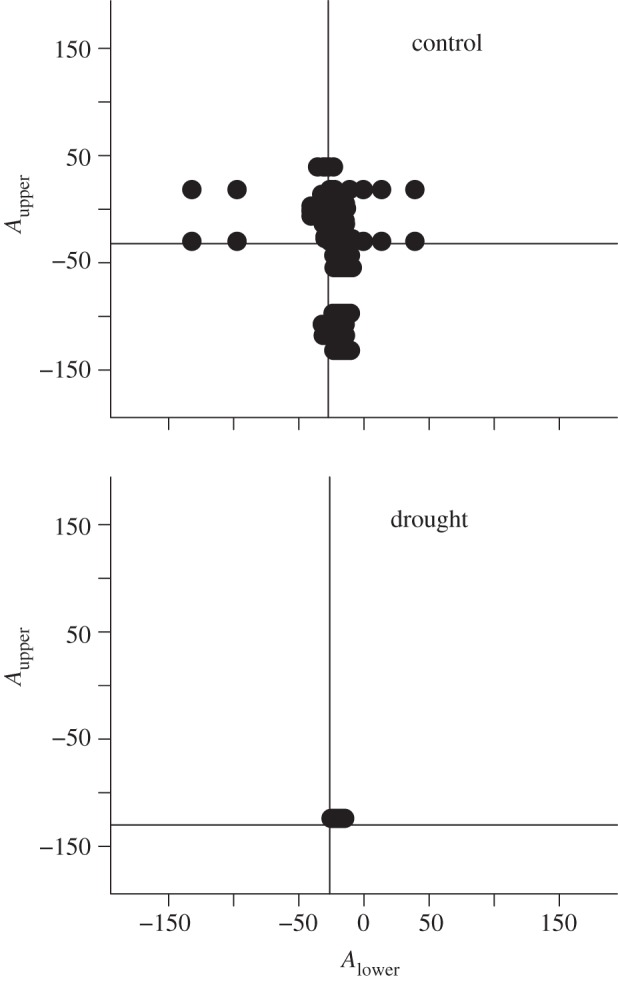
Upper angle (Aupper) versus lower angle (Alower) of all 2-chains within food webs from the control and drought treatments. Vertical and horizontal solid lines represent median lower and upper angles for all 2-chains (see §2). One representative web (c4, d4) per treatment is shown here; all eight (c1–c4, d1–d4) are shown in the electronic supplementary material, figure S3.
Figure 4.
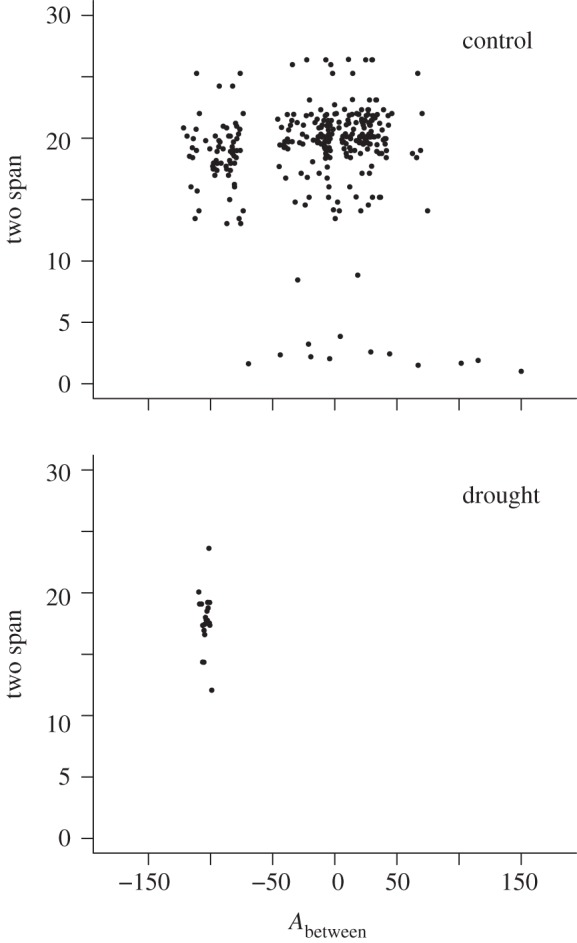
Network substructure in control and drought treatments: two-span as a function of between angle (Abetween) in tritrophic chains within each food web (see §2). One representative web (c4, d4) per treatment is shown here; all eight (c1–c4, d1–d4) are depicted in the electronic supplementary material, figure S4.
Although there were some significant differences between treatments in link lengths and angles, allometric slope, and species richness, many other parameters were unaffected by drought in the two additional scenarios for detecting indirect effects (see the electronic supplementary material, table S2). Thus, indirect effects were generally modest when compared with the direct effects of species change, and the ‘core community’ remained relatively intact: hypothesis 5 was therefore not supported for most measures. Overall, drought tended to simplify and homogenize network size structure, primarily via the direct effects of the loss of larger, rarer (and predominantly, but not always, predatory) species.
4. Discussion
This is the first replicated study of the impact of a component of climate change on the architecture of food web size structure in a long-term field experiment. We found clear evidence that drought triggered the widespread loss of species and links and the homogenization of aspects of size structure. Because larger species and those that were rare for their size were lost, perturbed webs were bounded within a smaller constraint space and fitted more tightly to MN scaling relationships than did controls, causing changes in the finer-grained network properties (e.g. among the webs' pairwise links, tritrophic interactions and food chains). Drought caused a ‘winnowing of the web’ (cf. [36]), as nodes (and links) were stripped out to leave a skeleton outline within the same community span and only slightly steeper overall MN slope (reflecting the relative increase in some of the smaller taxa). The thinning effect explains reductions in community biomass and secondary production reported previously [26]. Other web properties (e.g. connectance) were apparently either insensitive to drought or too coarse-grained to reveal a response. The ‘core food web’ containing species common to both treatments did not respond strongly to drought for most parameters (see the electronic supplementary material, table S2), revealing a lack of obvious emergent effects beyond the direct impacts of species loss. There was no compelling evidence for the widespread cascading effects or secondary extinctions that might be expected due to strong top-down control. More subtle indirect effects of drought were, however, evident on the slopes of the core webs and their respective links.
Large size and absolute rarity are both associated with increased extinction risk and are often correlated with one another [14]. We also found evidence of a second-order, but important rarity-for-size effect that was distinct from overall rarity effects. Ecological drift is unlikely to be driving this, as rare species were common in the source stream and recolonized disturbed patches repeatedly over the 2-year experiment [27], i.e. rather than being opportunistic visitors they were permanent residents that were numerically rare in the system. Species below the general MN-scaling line were especially vulnerable, being already rarer in the controls than expected based on their size. Such species may already be in sub-optimal conditions (hence their relative rarity) and the imposition of additional stress on the system might be sufficient to push them to extinction. Rarity-for-size might therefore help to identify especially vulnerable taxa, without necessarily requiring detailed a priori knowledge of trophic position or environmental tolerances. This could be useful for assessing impacts of stressors in ecological networks in general, and warrants further exploration in systems exposed to perturbations or environmental stress where M and N data exist [17,18].
The larger consumers that were lost were also predominantly aquatic throughout their life cycle, whereas the surviving large insect species possessed a terrestrial adult phase, enabling them to (re)colonize denuded patches. Many of the smaller taxa survived the drought, most likely in patches of wetted refugia, and some even flourished (e.g. certain midge larvae and small oligochaete worms) suggestive of release from competition and/or predation from the larger taxa [26,27]. This might also indicate at least some indirect food web effects are modulated by drought, via apparent competition for enemy-free space, as revealed by the modest but significant steepening in the allometric slope of the web (even in the scenarios where we accounted for species loss or gain).
Identifying which food web parameters are most sensitive to perturbations is key to assessing the impacts of environmental change in natural systems: focusing on the more commonly used properties (e.g. connectance) would have missed subtle yet informative structural changes. The next move towards understanding climate change impacts will necessitate modelling the dynamical consequences of structural change, if we are ultimately to predict impacts on food web stability [4,37]. One important pattern emerging from recent research is that large, rare organisms high in the food web seem to suffer disproportionately from environmental warming [4,13] (but see [2]) and because drought had similar impacts, these two components of climate change could combine to produce potentially lethal synergies in the near future [4].
Acknowledgments
The Freshwater Biological Association (FBA) and the Centre for Ecology and Hydrology supported this research. The project was funded by a FBA/Natural Environmental Research Council (NERC) postdoctoral fellowship to M.E.L. and NERC grant no. NER/B/S/2002/00215. L.N.H. was supported by Microsoft Research, and D.C.R. was partially supported by NERC grant nos. NE/H020705/1, NE/I010963 and NE/I011889/1. The participation of G.W. at the SIZEMIC Workshop in Hamburg was supported by the German Research Foundation (JA 1726/3-1) as well as the Cluster of Excellence CliSAP (EXC177), University of Hamburg funded through the DFG. We thank everyone who helped collect the field data, especially Rebecca Harris, Brian Godfrey, Bethan Ledger and John Murphy. We also thank Ulrich Brose and two anonymous referees, whose insightful comments improved the manuscript considerably.
References
- 1.Ledger M. E., Hildrew A. G. 2001. Recolonization by the benthos of an acid stream following a drought. Arch. Hydrobiol. 152, 1–17 [Google Scholar]
- 2.Woodward G., et al. 2010. Sentinel systems on the razor's edge: effects of warming on Arctic stream ecosystems. Glob. Change Biol. 16, 1979–1991 10.1111/j.1365-2486.2009.02052.x (doi:10.1111/j.1365-2486.2009.02052.x) [DOI] [Google Scholar]
- 3.Petchey O. L., McPhearson P. T., Casey T. M., Morin P. J. 1999. Environmental warming alters food-web structure and ecosystem function. Nature 402, 69–72 10.1038/47023 (doi:10.1038/47023) [DOI] [Google Scholar]
- 4.Woodward G., et al. 2010. Ecological networks in a changing climate. Adv. Ecol. Res. 42, 72–138 10.1016/B978-0-12-381363-3.00002-2 (doi:10.1016/B978-0-12-381363-3.00002-2) [DOI] [Google Scholar]
- 5.Liboriussen L., et al. 2011. Effects of warming and nutrients on sediment community respiration in shallow lakes: an outdoor mesocosm experiment. Freshw. Biol. 56, 437–447 10.1111/j.1365-2427.2010.02510.x (doi:10.1111/j.1365-2427.2010.02510.x) [DOI] [Google Scholar]
- 6.Yvon-Durocher G., Montoya J.M., Trimmer M., Woodward G. 2011. Warming alters the size spectrum and shifts the distribution of biomass in freshwater ecosystems. Glob. Change Biol. 17, 1681–1694 10.1111/j.1365-2486.2010.02321.x (doi:10.1111/j.1365-2486.2010.02321.x) [DOI] [Google Scholar]
- 7.Grieg H. S., et al. 2012. Warming, eutrophication, and predator loss amplify subsidies between aquatic and terrestrial ecosystems. Glob. Change Biol. 18, 504–514 10.1111/j.1365-2486.2011.02540.x (doi:10.1111/j.1365-2486.2011.02540.x) [DOI] [Google Scholar]
- 8.Suttle K. B., Thomsen M. A., Power M. E. 2007. Species interactions reverse grassland responses to changing climate. Science 315, 640–642 10.1126/science.1136401 (doi:10.1126/science.1136401) [DOI] [PubMed] [Google Scholar]
- 9.Jochum M., Schneider F. D., Crowe T. P., Brose U., O'Gorman E. J. 2012. Climate-induced changes in bottom-up and top-down processes independently alter a marine ecosystems. Phil. Trans. R. Soc. B 367, 2962–2970 10.1098/rstb.2012.0237 (doi:10.1098/rstb.2012.0237) [DOI] [PMC free article] [PubMed] [Google Scholar]
- 10.Shurin J. B., Clasen J. L., Greig H. S., Kratina P., Thompson P. L. 2012. Warming shifts top-down and bottom-up control of pond food web structure and function. Phil. Trans. R. Soc. B 367, 3008–3017 10.1098/rstb.2012.0243 (doi:10.1098/rstb.2012.0243) [DOI] [PMC free article] [PubMed] [Google Scholar]
- 11.Lurgi M., López B. C., Montoya J. M. 2012. Novel communities from climate change. Phil. Trans. R. Soc. B 367, 2913–2922 10.1098/rstb.2012.0238 (doi:10.1098/rstb.2012.0238) [DOI] [PMC free article] [PubMed] [Google Scholar]
- 12.Eklöf A., Kaneryd L., Münger P. 2012. Climate change in metacommunities: dispersal gives double-sided effects on persistence. Phil. Trans. R. Soc. B 367, 2945–2954 10.1098/rstb.2012.0234 (doi:10.1098/rstb.2012.0234) [DOI] [PMC free article] [PubMed] [Google Scholar]
- 13.Daufresne M., Lengfellner K., Sommer U. 2009. Global warming benefits the small in aquatic ecosystems. Proc. Natl Acad. Sci. USA 106, 12 788–12 793 10.1073/pnas.0902080106 (doi:10.1073/pnas.0902080106) [DOI] [PMC free article] [PubMed] [Google Scholar]
- 14.Raffaelli D. 2004. How extinction patterns affect ecosystems? Science 306, 1141–1142 10.1126/science.1106365 (doi:10.1126/science.1106365) [DOI] [PubMed] [Google Scholar]
- 15.Woodward G., et al. 2005. Body-size in ecological networks. Trends Ecol. Evol. 20, 402–409 10.1016/j.tree.2005.04.005 (doi:10.1016/j.tree.2005.04.005) [DOI] [PubMed] [Google Scholar]
- 16.Brose U., et al. 2006. Consumer–resource body-size relationships in natural food webs. Ecology 87, 2411–2417 10.1890/0012-9658(2006)87[2411:CBRINF]2.0.CO;2 (doi:10.1890/0012-9658(2006)87[2411:CBRINF]2.0.CO;2) [DOI] [PubMed] [Google Scholar]
- 17.O'Gorman E., Emmerson M. 2010. Manipulating interaction strengths and the consequences for trivariate patterns in a marine food web. Adv. Ecol. Res. 42, 301–419 10.1016/B978-0-12-381363-3.00006-X (doi:10.1016/B978-0-12-381363-3.00006-X) [DOI] [Google Scholar]
- 18.Layer K., Riede J. O., Hildrew A. G., Woodward G. 2010. Food web structure and stability in 20 streams across a wide pH gradient. Adv. Ecol. Res. 42, 265–301 10.1016/B978-0-12-381363-3.00005-8 (doi:10.1016/B978-0-12-381363-3.00005-8) [DOI] [Google Scholar]
- 19.Gilljam D., et al. 2011. Seeing double: size-based versus taxonomic views of food web structure. Adv. Ecol. Res. 45, 67–134 10.1016/B978-0-12-386475-8.00003-4 (doi:10.1016/B978-0-12-386475-8.00003-4) [DOI] [Google Scholar]
- 20.Cohen J. E., Schittler D. N., Raffaelli D. G., Reuman D. C. 2009. Food webs are more than the sum of their tritrophic parts. Proc. Natl Acad. Sci. USA 106, 22 335–22 340 10.1073/pnas.0910582106 (doi:10.1073/pnas.0910582106) [DOI] [PMC free article] [PubMed] [Google Scholar]
- 21.Reuman D. C., Cohen J.E. 2004. Trophic links’ length and slope in the Tuesday Lake food web with species’ body mass and numerical abundance. J. Anim. Ecol. 73, 852–866 10.1111/j.0021-8790.2004.00856.x (doi:10.1111/j.0021-8790.2004.00856.x) [DOI] [Google Scholar]
- 22.IPCC 2007. Contribution of Working Group II to the Fourth Assessment Report of the Intergovernmental Panel on Climate Change. In Climate change 2007: impacts, adaptation and vulnerability (eds Parry M. L., Canziani O. F., Palutikof J. P., van der Linden P. J., Hanson C. E.), p. 976 Cambridge, UK: Cambridge University Press [Google Scholar]
- 23.Cohen J. E., Jonsson T., Carpenter S. R. 2003. Ecological community description using food web, species abundance, and body-size. Proc. Natl Acad. Sci. USA 100, 1781–1786 10.1073/pnas.232715699 (doi:10.1073/pnas.232715699) [DOI] [PMC free article] [PubMed] [Google Scholar]
- 24.Overpeck J., Udall B. 2011. Dry times ahead. Science 328, 1642–1643 10.1126/science.1186591 (doi:10.1126/science.1186591) [DOI] [PubMed] [Google Scholar]
- 25.Vörösmarty C. J., et al. 2010. Global threats to human water security and river biodiversity. Nature 467, 555–561 10.1038/nature09440 (doi:10.1038/nature09440) [DOI] [PubMed] [Google Scholar]
- 26.Ledger M. E., Edwards F. K., Brown L. E., Milner A. M., Woodward G. 2011. Impact of simulated drought on ecosystem biomass production: an experimental test in stream mesocosms. Glob. Change Biol. 17, 2288–2297 10.1111/j.1365-2486.2011.02420.x (doi:10.1111/j.1365-2486.2011.02420.x) [DOI] [Google Scholar]
- 27.Ledger M. E., Harris R. M. L., Armitage P. D., Milner A. M. In press. Community stability depends on disturbance frequency: evidence of drought impacts in stream mesocosm experiments. Adv. Ecol. Res. [Google Scholar]
- 28.Power M. E., Parker M. S., Dietrich W. E. 2008. Seasonal reassembly of a river food web: floods, droughts, and impacts of fish. Ecol. Monogr. 78, 263–282 10.1890/06-0902.1 (doi:10.1890/06-0902.1) [DOI] [Google Scholar]
- 29.Reuman D. C., et al. 2009. Allometry of body size and abundance in 166 food webs. Adv. Ecol. Res. 41, 1–44 10.1016/S0065-2504(09)00401-2 (doi:10.1016/S0065-2504(09)00401-2) [DOI] [Google Scholar]
- 30.Brown L. E., Edwards F., Milner A. M., Woodward G., Ledger M. E. 2011. Food web complexity and allometric scaling relationships in stream mesocosms: implications for experimentation. J. Anim. Ecol. 80, 884–895 10.1111/j.1365-2656.2011.01814.x (doi:10.1111/j.1365-2656.2011.01814.x) [DOI] [PubMed] [Google Scholar]
- 31.Leaper R., Raffaelli D. 1999. Defining the abundance body-size constraint space: data from a real food web. Ecol. Lett. 2, 191–199 10.1046/j.1461-0248.1999.00069.x (doi:10.1046/j.1461-0248.1999.00069.x) [DOI] [Google Scholar]
- 32.Ledger M. E., Harris R. M. L., Armitage P. D., Milner A. M. 2009. Realism of model ecosystems: an evaluation of physicochemistry and macroinvertebrate assemblages in artificial streams. Hydrobiologia 617, 91–99 10.1007/s10750-008-9530-x (doi:10.1007/s10750-008-9530-x) [DOI] [Google Scholar]
- 33.Harris R. M. L., Milner A. M., Armitage P. D., Ledger M. E. 2007. Replicability of physicochemistry and macroinvertebrate assemblages in stream mesocosms: implications for experimental research. Freshw. Biol. 52, 2434–2443 10.1111/j.1365-2427.2007.01839.x (doi:10.1111/j.1365-2427.2007.01839.x) [DOI] [Google Scholar]
- 34.Ledger M. E., Harris R. M. L., Armitage P. D., Milner A. M. 2008. Disturbance frequency influences patch dynamics in stream benthic algal communities. Oecologia 155, 809–819 10.1007/s00442-007-0950-5 (doi:10.1007/s00442-007-0950-5) [DOI] [PubMed] [Google Scholar]
- 35.R Development Core Team 2008. R: A language and environment for statistical computing. Vienna, Austria: R Foundation for Statistical Computing; See http://www.R-project.org [Google Scholar]
- 36.de Ruiter P.C., Wolters V., Moore J. C., Winemiller K.O. 2005. Food web ecology: playing Jenga and beyond. Science 309, 68–71 10.1126/science.1096112 (doi:10.1126/science.1096112) [DOI] [PubMed] [Google Scholar]
- 37.Brose U., Dunne J. A., Montoya J. M., Petchey O. L., Schneider F. D., Jacob U. 2012. Climate change in size-structured ecosystems. Phil. Trans. R. Soc. B 367, 2903–2912 10.1098/rstb.2012.0232 (doi:10.1098/rstb.2012.0232) [DOI] [PMC free article] [PubMed] [Google Scholar]