

Abstract
Traumatic brain injuries (TBIs) are caused by acceleration of the skull or exposure to explosive blast, but the processes by which mechanical loads lead to neurological injury remain poorly understood. We adapted motion-sensitive magnetic resonance imaging methods to measure the motion of the human brain in vivo as the skull was exposed to harmonic pressure excitation (45, 60 and 80 Hz). We analysed displacement fields to quantify the transmission, attenuation and reflection of distortional (shear) waves as well as viscoelastic material properties. Results suggest that internal membranes, such as the falx cerebri and the tentorium cerebelli, play a key role in reflecting and focusing shear waves within the brain. The skull acts as a low-pass filter over the range of frequencies studied. Transmissibility of pressure waves through the skull decreases and shear wave attenuation increases with increasing frequency. The skull and brain function mechanically as an integral structure that insulates internal anatomic features; these results are valuable for building and validating mathematical models of this complex and important structural system.
Keywords: traumatic brain injury, magnetic resonance imaging, MR elastography, displacement, strain, blast
1. Introduction
Traumatic brain injury (TBI) can result from blunt force trauma, rapid inertial loading or extracranial pressure (i.e. explosive blast). Much of the pathway between mechanical insult and neurological injury remains unclear, in part because data on the mechanical response of the brain are difficult to acquire in vivo. Diffuse axonal injury, in which neural axons stressed beyond limit initiate a biochemical cascade culminating in axon destruction, is believed to be a direct consequence of this mechanical response [1–3]. Recent developments in magnetic resonance imaging (MRI) have uncovered a critical mechanical role of brain–skull attachment in determining the locations of high strains when the skull is accelerated [4–7].
The ability to simulate TBI computationally is quite advanced [8–11], but has historically outpaced the data available for validation. The range of data available begins with a study by Holbourn [12], who investigated strains in gel-filled moulds of the human cranium subjected to angular accelerations. Holbourn postulated that injury locations correlate with regions where high shear strain was observed in his gelatin brain models. Others have studied more complex gel-filled head models [13,14]. Hardy et al. [15,16] advanced this type of analysis to the heads of human cadavers, where internal brain motion was measured by tracking implanted neutral-buoyancy markers using high-speed bi-planar X-ray imaging. These studies represented significant progress in the study of brain injury biomechanics. Nevertheless, gels and cadaver heads differ substantially from the human brain in vivo, and the spatial resolution of implanted markers falls far short of capabilities of imaging methods such as MRI.
Presently, MRI is the only non-invasive method capable of determining the mechanical properties of the human brain in vivo. Efforts to characterize the mechanical properties of healthy and diseased human brain parenchyma are on-going [17–26] and the use of MRI to characterize the structural dynamic properties of the living head, especially as related to TBI, is an emerging application [27,28]. In the current study, we implement a motion-sensitive MRI scheme to map mechanical wave propagation in the brain to measured extracranial pressure oscillations. We present here MRI data that suggest the brain–skull attachments, as well as the internal meninges (e.g. falx and tentorium), strongly affect patterns of wave propagation in the brain. We also introduce a novel viscoelastic material property reconstruction scheme and apply it to these data. The transmissibility of oscillatory pressure loading through the skull and the attenuation of shear waves propagating within the brain are quantified. The findings presented here may be useful for the validation of numerical models intended to simulate head trauma.
2. Material and methods
2.1. Motion-sensitive magnetic resonance imaging
Images of tissue motion can be recorded using a standard clinical MRI scanner equipped with a motion-sensitive imaging pulse sequence and an MRI-compatible actuator to produce tissue motion [29]. The nuclear magnetic resonance (NMR) signal used for clinical imaging is produced by precession of 1H proton spin packets in a strong magnetic field (commonly 1.5–3T). Spin precession (Larmor) frequency is determined by the magnetic-field amplitude. In the presence of a spatially varying magnetic field, a spin packet displaced to a location with higher magnetic-field strength will precess faster. Over time, the displaced spin will acquire additional phase relative to a spin in the original configuration. Applying harmonically oscillating magnetic-field gradients into an imaging sequence allows harmonic spin displacement to be recorded as a phase shift in the NMR signal. With this technique, motion sensitivity to displacements as small as 100 nm have been reported [29]. This type of motion-sensitive MRI, known as MR elastography, has been employed to image propagating shear waves, and from the shear wave propagation speed, to infer the mechanical properties of tissue in vivo [29–33].
The physical framework describing the measurement of spatiotemporal displacement fields with motion-sensitive MRI is described in detail by Muthupillai et al. [34]. Here, we briefly review the mathematics. Consider a single 1H proton spin packet originally at position  , undergoing harmonic motion. Its vector displacement
  can be expressed in complex exponential form as
| 2.1 |
The displacement coefficient vector  can also be expressed in terms of its Cartesian components:
  . To measure this motion, a time varying motion-encoding gradient
  is imposed. Accrual of NMR signal phase
  is governed in general by
 |
2.2 |
where γ is the gyromagnetic ratio of 1H nucleus. The duration of the applied gradient is  , which is dependent on the actuator frequency ω (rad/sec) and the number of motion encoding cycles n chosen. In practice, one component of the motion-encoding gradient field is imposed at a time, yielding a corresponding phase image
 |
2.3 |
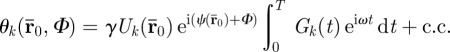
The amplitude and phase, 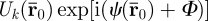 , of each voxel imaged can be determined directly from spin phase θk accrued, since Gk(t) is prescribed. The synchronization delay Φ is a temporal phase shift between the applied motion and the motion-encoding gradient. If multiple images are acquired, each with a different synchronization delay (corresponding to a fraction of the actuation period), a time history of spin phase is measured, cf. figure 1.
Figure 1.

(a) High-resolution anatomic images of the brain slice in which displacement data were recorded highlight anatomic structures and boundaries (e.g. grey and white matter, lateral ventricles, etc.). Displacement data were acquired on approximately transverse slice planes through the superior corpus callosum. (b) In-plane spatiotemporal displacement fields were used to calculate the through-plane component of distortion Γ. Transmission, attenuation and reflection of distortion within the living human cranium were analysed in this study. (S014, 45 Hz).
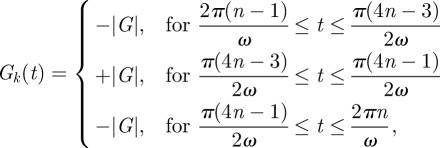
In our experiments, the components Gk(t) took the following form
 |
2.4 |
which has a zero (null) first moment to minimize sensitivity to fluid flow [35–37]. Full displacement vector fields may be acquired by repeating the experiment with the motion-encoding magnetic-field gradients aligned to each axis of an orthogonal coordinate system.
2.2. Measurement procedure and equipment
A motion-sensitized gradient-recalled echo (GRE) MRI pulse sequence (figure 2) was used to acquire data in six healthy male subjects, aged 19–42 years-old (mean: 28.7 year), at actuation frequencies of 45, 60 and 80 Hz. In each subject, data were acquired on single transverse-oblique slice through the top of the corpus callosum. Imaging parameters were repetition time (TR), 111.1–137.5 ms; echo time (TE), 27.5 ms; flip angle, 25°; resolution, 3 × 3 × 3 mm3 (i.e. 3 × 3 mm2 with slice thickness 3 mm). The imaging procedure was repeated three times with different motion-encoding gradient orientations to record three-dimensional displacement vector fields relative to the oblique imaging plane. The Human Research Protection Office Internal Review Board of Washington University approved the experimental protocol.
Figure 2.

(a) Schematic of the experimental apparatus for inducing mechanical waves in the brain by extracranial pressure loading. (b) The specialized gradient-recalled echo (GRE) magnetic resonance imaging pulse sequence used for data acquisition. In addition to the standard radio frequency (RF) pulses and orthogonal magnetic-field gradient orientations (SS, slice select; RO, readout; PE, phase encode) required to create the GRE MR image, a trapezoidal motion-encoding gradient is included.
The absolute peak motion-encoding gradient amplitude  was nominally 25
 for all test frequencies, and spin phase was accrued over a single gradient cycle (n = 1, equation (2.4)). The actuation system was configured to transmit of a 4, 6 and 8 cycle acoustic pressure-wave train at 45, 60 and 80 Hz, respectively. Actuation was initiated by transistor–transistor logic pulse which was generated by the scanner and synchronized with each NMR excitation. MRI motion-encoding gradients were configured to run at the same frequency as the actuator for each experiment. All data were acquired with a temporal resolution of four points per actuation cycle to satisfy the Nyquist–Shannon sampling criterion. Phase-to-displacement conversion factors of 5.63 (45 Hz), 7.66 (60 Hz) and 10.6 µm rad−1 (80 Hz) were calculated by numerical integration of equations (2.3) and (2.4), taking into consideration actual gradient performance specifications. The total scan time to acquire two-dimensional displacement field data in each subject was approximately 14 min per actuation frequency.
Volunteers were imaged in a 1.5 T MAGNETOM Avanto (Siemens) whole-body clinical scanner equipped with a phased-array head coil and imaging gradients with a 5.88 µs · m mT−1 rise time. Harmonic motion was induced in the brain via extracranial pressure generated by an acoustic actuation system (Resoundant, Resoundant Inc., Rochester, MN, USA). The system was modified with two equal lengths of flexible vinyl tubing and a T-fitting so that a single active driver could power two passive drivers with equal amplitude and phase. Each passive actuator pad was positioned on the side of the head near the left and right pterion bone and affixed with an elastic bandage (figure 2). The head of each subject was snugly secured within the imaging coil using foam inserts to prevent subject movement during scans.
Imposed acoustic pressure loads were measured with a PCB Piezotronics (103B01) dynamic pressure sensor. A single sensor was placed inside the flexible tubing on the acoustic actuator side of the T-fitting (figure 2a). The analogue pressure signal was amplified (PCB Piezotronics 494A), digitized (National Instruments DAQCard-6062E) and stored on a laptop PC.
Raw MRI data (k-space) were analysed in Matlab (The MathWorks, Inc., Natick, MA, USA). Motion-encoded MR data were obtained using a switched-polarity acquisition scheme to remove systematic phase errors and enhance displacement contrast [33]. After applying the two-dimensional inverse Fourier transform to the raw data (k-space), phase-contrast images were obtained by complex division of positive and negative polarity phase images. Images of phase-contrast were converted to displacement using the sensitivity factors described above. Displacement fields were filtered to reduce experimental noise. The complex fundamental time harmonic of the displacement field was extracted by Fourier transform along the time dimension, then spatially filtered with a Gaussian kernel (11 × 11; s.d. 0.80). Filtered displacement fields were reconstituted in the time domain via inverse Fourier transform, using only the filtered fundamental time harmonic.
2.3. Analysis of the distortional component of motion
Harmonic oscillation of the skull leads to propagation of waves of distortion and dilatation through brain parenchyma [18,21,30,33]. Analysis of raw displacement data is challenging because both types of wave motion are intrinsically coupled through loading and boundary conditions [38], but the wave speeds differ by several orders of magnitude.
The equations governing wave motion in an extended linear elastic, isotropic, homogeneous material are
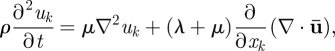 |
2.5 |
where λ and μ are the Lamé constants and ρ is the material density [39]. The dilatational (irrotational) and distortional (equivoluminal, or shear) deformation modes can be decoupled by applying the divergence and curl to equation (2.5)
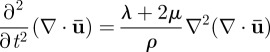 |
2.6a |
and
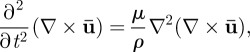 |
2.6b |
respectively [38–40]. Use of the decoupled equations of motion provides a way to isolate the dilatational wave phase velocity  from the shear wave phase velocity
  .
.
We define,
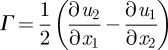 |
2.7 |
the distortional wave component normal to the image plane, which is calculated from the in-plane displacements. The root-mean-squared (r.m.s.) value of the distortion Γ was computed and normalized by the r.m.s. applied pressure load according to the following expression:
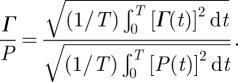 |
2.8 |
These data—distortion normalized by applied pressure—were analysed to quantify the frequency-dependent transmissibility, attenuation and reflection of shear waves in the living human brain.
Transmission of acoustic pressure through the skull and into the brain was assessed by the pressure-normalized distortion averaged over a 1.5 cm wide region immediately interior to the skull.
Attenuation of shear waves in the brain was quantified by the amplitude decay in pressure-normalized distortion as a function of distance from the skull. Regions of interest were obtained by applying a series of concentric elliptical masks to the shear wave field. These masks were created by iteratively eroding the outer boundary of the field inward. Two consecutive masks were subtracted to produce an annular elliptical mask with a thickness of approximately 1 voxel (i.e. 3 mm). The pressure-normalized distortion was averaged over each region of interest and these average values plotted as a function of distance from the brain-skull boundary. Exponential attenuation of shear waves was observed in the brain and is consistent with expected viscoelastic behaviour.
2.3.1. Wave normal extraction and qualitative energy analysis
Reflection of shear waves in the brain was assessed from vector fields of amplitude-weighted average propagation direction. In principle, a scalar field such as  , which is harmonic in time and periodic in space, may be represented as a double Fourier series
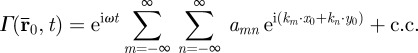 |
2.9 |
The two-dimensional wavenumber  describes the wave length and propagation direction. Here, the angle of propagation
  of each plane wave component is defined as the four-quadrant inverse tangent of
  .
.
Contributions of plane shear waves along a particular direction  may be obtained by applying a directional filter to the distortional wave field as follows:
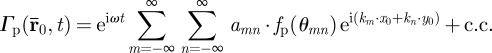 |
2.10 |
In this work, we apply a directional filter defined by
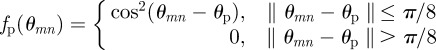 |
2.11 |
to isolate plane wave components propagating along 16 directions;  , for
, for 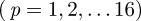 .
.
The amplitude-weighted average propagation direction vector at the location  was calculated as
 |
2.12 |
These vector fields allow both quantitative and qualitative characterizations of shear wave propagation. The divergence of these vector fields was used to qualitatively assess wave energy sources (production) and sinks (dissipation) in the brain. This approach is illustrated in figure 3, which shows radial shear wave propagation in a cylindrical gel sample excited by a central stinger.1
Figure 3.

(a–f) Vector fields of amplitude-weighted average propagation direction in a homogeneous cylinder of gelatin in which both the container and a central rod are coupled to a piezoelectric actuator. Vector fields are superimposed on (a,b) estimated distortion fields Γ and (c,d) high-resolution ‘anatomical’ images. (e,f) Divergence of the propagation direction field highlights energy production (source) and dissipation (sink). (a,c,e) At 150 Hz, shear waves propagate predominantly outward. (b,d,f) At 400 Hz, shear waves propagate both inward and outward, and interfere destructively at intermediate radial locations. Standing waves owing to constructive interference are also possible. Standing waves in this system would be indicated by distortion fields with significant amplitude but near-zero average propagation velocity.
2.3.2. Material property estimation
Local frequency estimation (LFE) [42] has been used to locally extract the wavenumber  from displacement wave fields in order to estimate the elastic shear modulus [32,33]. LFE-based inversion is attractive because it allows material parameters to be estimated without explicitly invoking the coupled or uncoupled equations of motion (equations (2.5)–(2.6b)), thus obviating the need to numerically compute second- or third-order spatial derivatives. LFE applied to displacement fields is challenging in practice since the effects of dilatational waves, rigid body motion, boundary reflections and standing wave patterns can corrupt wavelength estimates. Investigators have attempted, not always successfully, to circumvent these effects by aggressively filtering displacement data [33] or by taking the curl of the equation of motion [43], which requires third-order spatial derivatives.
In this study, viscoelastic properties of brain tissue at multiple frequencies were obtained by LFE applied to distortion fields. According to equation (2.6b), all components of the distortional wave field ( ) depend only on the shear modulus and density of the media. Therefore, in mechanically isotropic and locally homogeneous media as we assume here, the shear modulus can be extracted from any one component of the distortion field so long as that component is activated. Application of LFE to the distortion component identified in this study (Γ) avoids inversion artefacts attributed to dilatational waves and rigid body motion in displacement data.
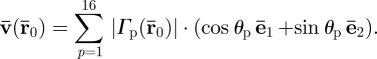
Implicit in existing LFE-based inversion formulations [32,33,44] is the wave phase velocity relation  , which permits elastic material property reconstruction. Nevertheless, the equation describing planar shear wave propagation in an isotropic lossy medium,
 |
2.13 |
could be employed to extract viscoelastic shear moduli [39,40]. We used the LFE implementation provided by Grimm et al. [44] to locally obtain the wavenumber k, then applied equation (2.13) with our global estimates of attenuation constant α to extract viscoelastic shear moduli regionally. An exponential form of α was assumed because it is a simple and a intuitive model of dissipation and approximates the observed behaviour. This approach is illustrated in MRE data obtained in cylindrical gel sample actuated at 150 Hz. Estimates of viscoelastic moduli G′ and G″ are presented in figure 4. These estimates (mean G′ = 1111 Pa; mean G″ = 260 Pa) are consistent with those reported in Okamoto et al. [41] (mean G′ = 1106 Pa; mean G″ = 151 Pa).
Figure 4.

The presented viscoelastic inversion scheme was tested on MRE data obtained in gelatin [41]. (a) Distortion wave field (Γ). Viscoelastic moduli (b) G′ and (c) G″. (150 Hz).
3. Results
3.1. Extracranial pressure and brain deformation
Acoustic pressure applied to the head near the left and right pterion produces distortional (shear) waves in the brain (figure 5). Spatiotemporal patterns of distortion reflected propagation of shear waves which was generally, but not exclusively, from the skull inward. One might expect anatomical differences in the skull and brain of individual subjects to cause differences in the responses of the brain. Averaged over the entire brain slice, the pressure-normalized distortion ( ) showed consistent magnitude (figure 6a). Some subject-to-subject variation was observed; however, among subjects who experienced all three frequencies of excitation, the decrease in response with frequency is consistent.
Figure 5.

(a) Waveforms of the pressure applied to the skull in one subject at (i) 45 Hz, (ii) 60 Hz and (iii) 80 Hz. The pressure signal for two successive lines of k-space acquisition is shown; hence, two wave-trains of sinusoidal pressure are shown. (b) Distortion wave fields (Γ, dimensionless) observed in the human brain in response to applied extracranial pressure shown above. Arcs on the left and right denote the locations of passive actuator pads. (S008).
Figure 6.

Pressure-normalized distortion  (equation (2.8)) was used to evaluate transmission and attenuation. (a) (i) The amplitude of
  was spatially averaged over the entire brain (ii) and plotted for each subject. Subject-to-subject variability exists; however when data were acquired at all three frequencies in the same subject, the response amplitude consistently decreased with increasing acoustic frequency. (b) (i) The amplitude of
  was spatially averaged in a 1.5 cm wide annular region of brain tissue immediately interior of the skull/dura mater (ii) and plotted as a function of acoustic frequency. Transmission coefficients were extracted by exponential curve fit:
  ; min
; min  (S014), max
  (S009), mean
  . (c) (i) The amplitude of
  was regionally averaged in concentric annular elliptical rings (ii) and plotted as a function of depth from the brain skull boundary. Attenuation coefficients were extracted by exponential curve fit:
  ; 45 Hz,
  ; 60 Hz,
  ; 80 Hz,
  .
.
3.2. Quantitative analysis of shear wave energy transmission into the brain
The transmission of mechanical loads through the skin, skull and meninges was evaluated via pressure-normalized distortion ( ) in the annular region of interest in the brain adjacent to the skull (figure 6b). This regionally averaged quantity was calculated for each subject, plotted as a function of frequency and fit to an exponential model. A clear decrease in transmissibility with frequency is evident over this range.
3.3. Quantitative analysis of shear wave energy attenuation within the brain
The attenuation of pressure-normalized distortion  ) was averaged within annular regions of interest and plotted as a function of depth from the brain–skull boundary (figure 6c). Data from all subjects were averaged together for a given frequency. The shear wave attenuation parameter α, which characterizes the dissipative behaviour of brain matter, was extracted for each frequency by performing a least-squares fit with a model of exponentially decaying amplitude.
3.4. Reflection of shear waves at anatomical interfaces
Vector fields of amplitude-weighted average propagation direction of shear waves in the human brain were calculated and presented in figure 7. These vectors highlight that propagation is generally inward from the skull towards the interior of the brain, but anomalies are apparent at the anterior and posterior extremes of the midline of the brain. This is more pronounced and occurs over a larger region, in the posterior midline region. The locations of these anomalies correspond to the intersections of the tough, relatively stiff membranous insertion of the dura mater, the falx cerebri, with the brain in the images. The falx extends from the roof of the skull down between the hemispheres of the brain. Wave propagation near the posterior midline may be affected by the tentorium, which lies below the image plane. The tentorium is a tent-like structure that supports the occipital lobe of the cerebrum and separates the cerebrum from the cerebellum. Propagation vector and divergence fields for all subjects at 45 Hz are presented in the electronic supplementary material, figures S1 and S2.
Figure 7.

Vector fields of amplitude-weighted average propagation direction superimposed on (a–c) estimated distortion fields and (d–f) high-resolution anatomical images in one human subject at three frequencies. Shear waves in the brain appear to propagate inward from the brain–skull boundary towards the ventricles. (g–i) Divergence of the propagation direction field at the anterior/posterior falx and above the tentorium indicates that these membranous structures may act like sources of shear wave excitation. (a,d,g) 45 Hz;  60 Hz and
  80 Hz. (S008).
3.5. Estimates of viscoelastic parameters from shear wave fields
The viscoelastic shear moduli  and G″ of the brain parenchyma were calculated for all subjects using local frequency analysis of the distortion field Γ. In figure 8, viscoelastic estimates are presented spatially in one subject at 45 Hz. In table 1, ensemble average moduli for all subjects were calculated in white and grey matter regions of interest. Magnitude images were used to manually segment grey and white matter regions of interest in each subject. The attenuation coefficient α was assumed to be approximately constant over the brain, which provides an estimate of loss modulus G″.
Figure 8.

Spatial maps of the viscoelastic material properties of intact, living human brain were calculated using a distortion-based LFE approach (equation (2.13)). (a) T1-weighted anatomical image of the analysis slice. Viscoelastic moduli (b)  and (c) G″. (S005, 45 Hz).
Table 1.
Viscoelastic properties of brain tissue (mean ± 1 s.d.).
k ( ) ) |
α (1 ) ) |
 (kPa) (kPa) |
G″ (kPa) |
|||||
|---|---|---|---|---|---|---|---|---|
| frequency (Hz) | grey | white | grey | white | grey | white | grey | white |
| 45 (n = 6) | 1.68 ± 0.142 | 1.46 ± 0.161 | 23.7 | 23.7 | 2.8 ± 0.5 | 3.7 ± 0.8 | 0.80 ± 0.2 | 1.3 ± 0.4 |
| 60 (n = 5) | 1.99 ± 0.126 | 1.89 ± 0.305 | 51.1 | 51.1 | 3.1 ± 0.3 | 3.3 ± 0.1 | 1.7 ± 0.3 | 2.0 ± 0.1 |
| 80 (n = 4) | 2.26 ± 0.104 | 2.17 ± 0.131 | 54.3 | 54.3 | 4.4 ± 0.3 | 4.7 ± 0.6 | 2.3 ± 0.2 | 2.4 ± 0.5 |
4. Discussion
In this study, the living human head was subjected to harmonic, laterally symmetric, extracranial pressure loading at 45, 60 and 80 Hz. The applied loading produced propagating distortional (shear) waves in the brain parenchyma. Distortion Γ was normalized by the applied r.m.s. pressure load and analysed to characterize the structural dynamic properties of the head. Transmission of harmonic extracranial acoustic pressure load through the skull decreases as the acoustic frequency increases (figure 6b). On average, outer regions of the brain experience pressure-normalized distortion  amplitudes of approximately
  at 45 Hz, but less than 30
 at 80 Hz. Attenuation of propagating shear (distortional) waves within the brain increases as the extracranial acoustic frequency increases (figure 6c) as expected for a viscoelastic system [39], such as the brain.
Reflection of shear waves in the brain was assessed from amplitude-weighted average propagation vector fields (figure 7). Amplitude-weighted average propagation vector fields permit qualitative and quantitative characterization of shear wave propagation. Propagation was generally inward from the skull towards the interior of the brain, with important anomalies apparent at the anterior and posterior extremes of the brain midline. This was more pronounced, and occurred over a larger region, in the posterior midline region. The locations of these anomalies correspond to the intersections of the brain with the tough, relatively stiff membranous insertion of the dura mater: the falx cerebri. The falx extends from the roof of the skull down between the hemispheres of the brain, serving as a transmission barrier. The posterior wave field may also be affected by reflections from the tentorium cerebelli, even though the tentorium lies below, and does not intersect, the image plane. The tentorium is a tent-like structure that supports the occipital lobe of the cerebrum and separates the cerebellum from mechanical waves in the cerebrum. Divergence of the propagation vector fields indicates anatomical boundaries are regions of energy production (source) and dissipation (sink). This technique was illustrated by characterization of shear waves in a simple cylindrical gel sample (figure 3).
Viscoelastic shear moduli were estimated from approximations of the local wavenumber k and global attenuation parameter α as evident from distortional wave fields Γ. Estimates of brain viscoelasticity provided here are within the wide range of values reported in a comprehensive review [45] of the mechanical properties of human brain tissue estimated by various methods. Scan duration limited our multi-frequency study to data collection on a single slice. The assumption that variations in the through-plane direction are small (inherent in the use of single-slice in-plane displacement data rather than multi-slice three-dimensional displacement data) leads to wavelength estimates that may be longer than the true wavelength. Accordingly, estimates of  presented here may be higher than the values that would be estimated from multi-slice three-dimensional displacement data. Spatial heterogeneity in
  is consistent with expected differences in stiffness of interior white matter [46,47], which is composed of myelinated axonal fibres, relative to cortical grey matter. This technique was illustrated by characterization of shear waves in a cylindrical gel sample (figure 4).
MRE displacement data consist of the volume-averaged NMR signal within discrete volume elements (voxels). Consequently, NMR signal decreases with decreasing voxel volume. The voxel size in this study  provides adequate signal-to-noise ratio without requiring multiple NMR excitations, which would lengthen scan duration. Spatial resolution in this study is comparable to other MRE studies in the human brain at 1.5 T [22,23,25,26]. In some cases [22,25,26], the investigators have decreased the in-plane voxel dimension
  while increasing the through-plane dimension (slice thickness), to 6 mm, for example. The smallest isotropic voxels used to date for human brain MRE are 2
  , as reported by Romano et al. [48]. The current voxel dimension is considerably smaller than the shear wave wavelength at 45 Hz (figures 5a and 7a). This resolution is also sufficient to resolve major anatomical features and regions of the brain (figure 8), although at boundaries and thin structures some ‘volume-averaging’ occurs within each voxel. Errors owing to numerical approximations of derivatives are a primary concern when working with discrete samples of continuous data. An advantage of the viscoelastic inversion scheme introduced in this study is that longitudinal wave and rigid body contributions can be minimized at the expense of only one spatial derivative.
5. Conclusions
Data were limited to low-pressure levels and strain levels far below any suspected for TBI. Nevertheless, these data provide important quantitative and qualitative insights into the structural dynamic response of the living head for validation of mathematical models.
— Frequency-dependent transmission of energy into the brain. Over the range of conditions tested, the skin, skull and meninges (e.g. the dura, pia and arachnoid matters) behave as a low-pass filter. Transmission of mechanical energy into the brain decreases with increasing acoustic frequency. The measured values of transmissibility are important parameters to replicate in mathematical models of brain biomechanics.
— Frequency-dependent dissipation of energy within the brain. The approximately exponential decay in shear wave amplitude with depth into the brain confirms and quantifies the expected viscoelastic response of brain tissue. The measured values of attenuation, and the increase in attenuation with frequency, are also important to replicate in simulations.
— Membranous structures within the skull affect wave propagation patterns. The propagation direction of waves was predominantly radially inward, from the brain–skull boundary towards the ventricles, but outward propagation from membranous structures including the falx cerebri is also observed. Interactions from structures outside the image plane (e.g. tentorium cerebelli) may also affect the wave field. The effects of these membranous structures on wave propagation direction may be very important in determining the response of brain to impact and blast.
These data illuminate fundamental mechanical properties of the skull, brain and associated intracranial anatomy. The quantitative details of the response of the intact living head to extracranial acoustic pressure load could be used to asymptotically validate computer simulations of blast-induced TBI by illuminating the expected behaviour at lower amplitude levels that are governed by linear system theory. These data also highlight an emerging role of MRI as a tool for not only material characterization, but also for the structural function characterization of organ systems.
Acknowledgments
Financial support for this study was provided by NIH grant R01 NS055951 (Bayly). The authors gratefully acknowledge Dr Bradley Bolster and Dr Agus Priatna at Siemens Healthcare for supporting MR pulse sequence development as well as technologists Glenn Foster, Scott Love and Mark Nolte at Washington University's Center for Clinical Imaging Research for assistance with MRI data acquisition.
Footnotes
cf. Okamoto et al. [41] for gel experiment details.
References
- 1.Strich S. J. 1956. Diffuse degeneration of the cerebral white matter in severe dementia following head injury. J. Neurol. Neurosurg. Psychiatry 19, 163–185 10.1136/jnnp.19.3.163 (doi:10.1136/jnnp.19.3.163) [DOI] [PMC free article] [PubMed] [Google Scholar]
- 2.Strich S. J. 1961. Shearing of nerve fibres as a cause of brain damage due to head injury: a pathological study of twenty cases. Lancet 278, 443–448 10.1016/S0140-6736(61)92426-6 (doi:10.1016/S0140-6736(61)92426-6) [DOI] [Google Scholar]
- 3.Smith D. H., Meaney D. F., Shull W. H. 2003. Diffuse axonal injury in head trauma. J. Head Trauma Rehabil. 18, 307–316 10.1097/00001199-200307000-00003 (doi:10.1097/00001199-200307000-00003) [DOI] [PubMed] [Google Scholar]
- 4.Bayly P. V., Cohen T. S., Leister E. P., Ajo D., Leuthardt E. C., Genin G. M. 2005. Deformation of the human brain induced by mild acceleration. J. Neurotrauma 22, 845–856 10.1089/neu.2005.22.845 (doi:10.1089/neu.2005.22.845) [DOI] [PMC free article] [PubMed] [Google Scholar]
- 5.Sabet A. A., Christoforou E., Zatlin B., Genin G. M., Bayly P. V. 2008. Deformation of the human brain induced by mild angular head acceleration. J. Biomech. 41, 307–315 10.1016/j.jbiomech.2007.09.016 (doi:10.1016/j.jbiomech.2007.09.016) [DOI] [PMC free article] [PubMed] [Google Scholar]
- 6.Feng Y., Abney T. M., Okamoto R. J., Pless R. B., Genin G. M., Bayly P. V. 2010. Relative brain displacement and deformation during constrained mild frontal head impact. J. R. Soc. Interface 7, 1677–1688 10.1098/rsif.2010.0210 (doi:10.1098/rsif.2010.0210) [DOI] [PMC free article] [PubMed] [Google Scholar]
- 7.Abney T. M., Feng Y., Pless R., Okamoto R. J., Genin G. M., Bayly P. V. 2011. Principal component analysis of dynamic relative displacement fields estimated from MR images. PLoS ONE 6, e22063. 10.1371/journal.pone.0022063 (doi:10.1371/journal.pone.0022063) [DOI] [PMC free article] [PubMed] [Google Scholar]
- 8.Kleiven S., Hardy W. N. 2002. Correlation of an FE model of the human head with local brain motion—consequences for injury prediction. Stapp Car Crash J. 46, 123–144 [DOI] [PubMed] [Google Scholar]
- 9.Ho J., Kleiven S. 2007. Dynamic response of the brain with vasculature: a three-dimensional computational study. J. Biomech. 40, 3006–3012 10.1016/j.jbiomech.2007.02.011 (doi:10.1016/j.jbiomech.2007.02.011) [DOI] [PubMed] [Google Scholar]
- 10.Taylor P. A., Ford C. C. 2009. Simulation of blast-induced early-time intracranial wave physics leading to traumatic brain injury. J. Biomech. Eng. T ASME 131, 061007. 10.1115/1.3118765 (doi:10.1115/1.3118765) [DOI] [PubMed] [Google Scholar]
- 11.Nyein M. K., Jason A. M., Yu L., Pita C. M., Joannopoulos J. D., Moore D. F., Radovitzkya R. A. 2010. In silico investigation of intracranial blast mitigation with relevance to military traumatic brain injury. Proc. Natl Acad. Sci. USA 107, 20703–8 10.1073/pnas.1014786107 (doi:10.1073/pnas.1014786107) [DOI] [PMC free article] [PubMed] [Google Scholar]
- 12.Holbourn A. H. S. 1943. Mechanics of head injuries. Lancet 242, 438–441 10.1016/S0140-6736(00)87453-X (doi:10.1016/S0140-6736(00)87453-X) [DOI] [Google Scholar]
- 13.Margulies S. S., Thibault L. E., Gennarelli T. A. 1990. Physical model simulations of brain injury in the primate. J. Biomech. 23, 823–836 10.1016/0021-9290(90)90029-3 (doi:10.1016/0021-9290(90)90029-3) [DOI] [PubMed] [Google Scholar]
- 14.Meaney D. F., Smith D. H., Shreiber D. I., Bain A. C., Miller R. T., Ross D. T., Gennarelli T. A. 1995. Biomechanical analysis of experimental diffuse axonal injury. J. Neurotrauma 12, 689–694 10.1089/neu.1995.12.689 (doi:10.1089/neu.1995.12.689) [DOI] [PubMed] [Google Scholar]
- 15.Hardy W. N., Foster C. D., Mason M. J., Yang K. H., King A. I, Tashman S. 2001. Investigation of head injury mechanisms using neutral density technology and high-speed biplanar X-ray. Stapp Car Crash J. 45, 337–368 [DOI] [PubMed] [Google Scholar]
- 16.Hardy W. N. et al. 2007. A study of the response of the human cadaver head to impact. Stapp Car Crash J. 51, 17–80 [DOI] [PMC free article] [PubMed] [Google Scholar]
- 17.Klatt D., Hamhaber U., Asbach P., Braun J., Sack I. 2007. Noninvasive assessment of the rheological behavior of human organs using multifrequency MR elastography: a study of brain and liver viscoelasticity. Phys. Med. Biol. 52, 7281–7294 10.1088/0031-9155/52/24/006 (doi:10.1088/0031-9155/52/24/006) [DOI] [PubMed] [Google Scholar]
- 18.Hamhaber U., Sack I., Papazoglou S., Rump J., Klatt D., Braun J. 2007. Three-dimensional analysis of shear wave propagation observed by In vivo magnetic resonance elastography of the brain. Act Biomater. 3, 127–137 10.1016/j.actbio.2006.08.007 (doi:10.1016/j.actbio.2006.08.007) [DOI] [PubMed] [Google Scholar]
- 19.Sack I., Beierbach B., Hamhaber U., Klatt D., Braun J. 2008. Non-invasive measurement of brain viscoelasticity using magnetic resonance elastography. NMR Biomed. 21, 265–271 10.1002/nbm.1189 (doi:10.1002/nbm.1189) [DOI] [PubMed] [Google Scholar]
- 20.Kruse S. A., Rose G. H., Glaser K. J., Manduca A., Felmlee J. P., Jack C. R., Ehman R. L. 2008. Magnetic resonance elastography of the brain. NeuroImage 39, 231–237 10.1016/j.neuroimage.2007.08.030 (doi:10.1016/j.neuroimage.2007.08.030) [DOI] [PMC free article] [PubMed] [Google Scholar]
- 21.Green M. A., Bilston L. E., Sinkus R. 2008. In vivo brain viscoelastic properties measured by magnetic resonance elastography. NMR Biomed. 21, 755–764 10.1002/nbm.1254 (doi:10.1002/nbm.1254) [DOI] [PubMed] [Google Scholar]
- 22.Wuerfel J. et al. 2010. MR-elastography reveals degradation of tissue integrity in multiple sclerosis. NeuroImage 49, 2520–2525 10.1016/j.neuroimage.2009.06.018 (doi:10.1016/j.neuroimage.2009.06.018) [DOI] [PubMed] [Google Scholar]
- 23.Hamhaber U., Klatt D., Papazoglou S., Hollmann M., Stadler J., Sack I., Bernarding J., Braun J. 2010. In vivo magnetic resonance elastography of human brain at 7 T and 1.5 T. J. Magn. Reson. Imaging p32,577–583. 10.1002/jmri.22294 (doi:10.1002/jmri.22294) [DOI] [PubMed] [Google Scholar]
- 24.Zhang J., Green M. A., Sinkus R., Bilston L. E. 2011. Viscoelastic properties of human cerebellum using magnetic resonance elastography. J. Biomech. 44, 1909–1913 10.1016/j.jbiomech.2011.04.034 (doi:10.1016/j.jbiomech.2011.04.034) [DOI] [PubMed] [Google Scholar]
- 25.Streitberger K. J., Sack I., Krefting D., Pfüller C., Braun J., Paul F., Wuerful J. 2012. Brain viscoelasticity alteration in chronic-progressive multiple sclerosis. PLoS ONE. 7, e29888. 10.1371/journal.pone.0029888 (doi:10.1371/journal.pone.0029888) [DOI] [PMC free article] [PubMed] [Google Scholar]
- 26.Streitberger K. J. et al. 2010. In vivo viscoelastic properties of the brain in normal pressure hydrocephalus. NMR Biomed. 24, 385–392 10.1002/nbm.1602 (doi:10.1002/nbm.1602) [DOI] [PubMed] [Google Scholar]
- 27.McCracken P. J., Manduca A., Felmlee J. P., Ehman R. L. 2004. Transient MR elastography: modeling traumatic brain injury. In Int. Conf. on Medical Image Computing and Computer Assisted Intervention (MICCAI), Saint-Malo, France, 26–29 September 2004, pp. 1081–1082 Berlin, Germany: Springer [Google Scholar]
- 28.McCracken P. J., Manduca A., Ehman R. L. 2003. MR elastography for studying the biomechanics of traumatic brain injury. In Int. Society for Magnetic Resonance in Medicine, Toronto, Ontario, Canada, 10–16 July 2003, p. 799 Berkeley, CA: ISMRM [Google Scholar]
- 29.Muthupillai R., Lomas D. J., Rossman P. J., Greenleaf J. F., Manduca A., Ehman R. L. 1995. Magnetic resonance elastography by direct visualization of propagating acoustic strain waves. Science 269, 1854–1857 10.1126/science.7569924 (doi:10.1126/science.7569924) [DOI] [PubMed] [Google Scholar]
- 30.Kruse S. A. et al. 2000. Tissue characterization using magnetic resonance elastography: preliminary results. Phys. Med. Biol. 45, 1579–1590 10.1088/0031-9155/45/6/313 (doi:10.1088/0031-9155/45/6/313) [DOI] [PubMed] [Google Scholar]
- 31.Sinkus R., Lorenzen J., Schrader D., Lorenzen M., Dargatz M., Holtz D. 2000. High-resolution tensor MR elastography for breast tumour detection. Phys. Med. Biol. 45, 1649–1664 10.1088/0031-9155/45/6/317 (doi:10.1088/0031-9155/45/6/317) [DOI] [PubMed] [Google Scholar]
- 32.Braun J., Buntkowsky G., Bernarding J., Tolxdorff T., Sack I. 2001. Simulation and analysis of magnetic resonance elastography wave images using coupled harmonic oscillators and Gaussian local frequency estimation. Magn. Reson. Imaging 19, 703–713 10.1016/S0730-725X(01)00387-3 (doi:10.1016/S0730-725X(01)00387-3) [DOI] [PubMed] [Google Scholar]
- 33.Manduca A., Oliphant T. E., Dresner M. A., Mahowald J. L., Kruse S. A., Amromin E., Felmlee J. P., Greenleaf J. F., Ehman R. L. 2001. Magnetic resonance elastography: non-invasive mapping of tissue elasticity. Med. Image Anal. 5, 237–254 10.1016/S1361-8415(00)00039-6 (doi:10.1016/S1361-8415(00)00039-6) [DOI] [PubMed] [Google Scholar]
- 34.Muthupillai R., Rossman P. J., Lomas D. J., Greenleaf J. F., Riederer S. J., Ehman R. L. 1996. Magnetic resonance imaging of transverse acoustic strain waves. Magn. Reson Med. 36, 266–274 10.1002/mrm.1910360214 (doi:10.1002/mrm.1910360214) [DOI] [PubMed] [Google Scholar]
- 35.Perman W. H., Moran P. R., Moran R. A., Bernstein M. A. 1986. Artifacts from pulsatile flow in MR imaging. J. Comput. Assist. Tomogr. 10, 473–483 [PubMed] [Google Scholar]
- 36.Ehman R. L., Felmlee J. P. 1990. Flow artifact reduction in MRI: a review of the roles of gradient moment nulling and spatial presaturation. Mag. Reson. Med. 14, 293–307 10.1002/mrm.1910140214 (doi:10.1002/mrm.1910140214) [DOI] [PubMed] [Google Scholar]
- 37.Moran P. R. 1991. Experiments for two MR imaging theories of motion phase sensitivity. Radiology 180, 115–119 [DOI] [PubMed] [Google Scholar]
- 38.Whitham G. B. 1974. Linear and nonlinear waves. New York, NY: Wiley [Google Scholar]
- 39.Kolsky H. 1963. Stress waves in solids. New York, NY: Dover Publications [Google Scholar]
- 40.Auld B. A. 1990. Acoustic fields and waves in solids. New York, NY: R. E: Krieger [Google Scholar]
- 41.Okamoto R. J., Clayton E. H., Bayly P. V. 2011. Viscoelastic properties of soft gels: comparison of magnetic resonance elastography and dynamic shear testing in the shear wave regime. Phys. Med. Biol. 56, 6379–6400 10.1088/0031-9155/56/19/014 (doi:10.1088/0031-9155/56/19/014) [DOI] [PMC free article] [PubMed] [Google Scholar]
- 42.Knutsson H., Westin C. F., Granlund G. H. 1994. Local multiscale frequency and bandwidth estimation. In Proc. IEEE Int. Conf. on Image Processing, Austin, TX, 13–16 November 1994, p. 36–40 Washington, DC: IEEE [Google Scholar]
- 43.Sinkus R., Tanter M., Xydeas T., Catheline S., Bercoff J., Fink M. 2005. Viscoelastic shear properties of In vivo breast lesions measured by MR elastography. J. Magn. Reson. Imaging 23, 159–165 10.1016/j.mri.2004.11.060 (doi:10.1016/j.mri.2004.11.060) [DOI] [PubMed] [Google Scholar]
- 44.Grimm R. C., Lake D. S., Manduca A., Ehman R. L. 2006. MRE/Wave (Version: 1 July 2006). Mayo Clinic. See http://mayoresearch.mayo.edu/mayo/research/ehman_lab/mrw-wave.cfm [Google Scholar]
- 45.Chatelin S., Constantinesco A., Willinger R. 2010. Fifty years of brain tissue mechanical testing: from in vitro to In vivo investigations. Biorheology 47, 255–276 [DOI] [PubMed] [Google Scholar]
- 46.Hrapko M., van Dommelen J. A., Peters G. W., Wismans J. S. 2008. The influence of test conditions on characterization of the mechanical properties of brain tissue. ASME J. Biomech. Eng. 130, 031003 10.1115/1.2907746 (doi:10.1115/1.2907746) [DOI] [PubMed] [Google Scholar]
- 47.van Dommelen J. A., van der Sande T. P., Hrapko M., Peters G. W. 2010. Mechanical properties of brain tissue by indentation: interregional variation. J. Mech. Behav. Biomed. Mater. 3, 158–166 10.1016/j.jmbbm.2009.09.001 (doi:10.1016/j.jmbbm.2009.09.001) [DOI] [PubMed] [Google Scholar]
- 48.Romano A. J., Scheel M., Hirsch S., Braun J., Sack I. In press. In vivo waveguide elastography of white matter tracts in the human brain. Magn. Reson Med. (doi:10.1002/mrm.24141) [DOI] [PubMed] [Google Scholar]