Abstract
Positron emission tomography (PET) is an important in vivo molecular imaging technique for translational research. Imaging unanaesthetized rats using motion-compensated PET avoids the confounding impact of anaesthetic drugs and enables animals to be imaged during normal or evoked behaviour. However, there is little published data on the nature of rat head motion to inform the design of suitable marker-based motion-tracking set-ups for brain imaging—specifically, set-ups that afford close to uninterrupted tracking. We performed a systematic study of rat head motion parameters for unanaesthetized tube-bound and freely moving rats with a view to designing suitable motion-tracking set-ups in each case. For tube-bound rats, using a single appropriately placed binocular tracker, uninterrupted tracking was possible greater than 95 per cent of the time. For freely moving rats, simulations and measurements of a live subject indicated that two opposed binocular trackers are sufficient (less than 10% interruption to tracking) for a wide variety of behaviour types. We conclude that reliable tracking of head pose can be achieved with marker-based optical-motion-tracking systems for both tube-bound and freely moving rats undergoing PET studies without sedation.
Keywords: rat head motion, motion tracking, brain imaging, positron emission tomography
1. Introduction
Positron emission tomography (PET) is a non-invasive molecular imaging technique used to study functional processes in humans and animals in vivo. Its applications include studying the functional changes associated with disease, monitoring response to therapy, studying the role of specific genes in disease and drug development [1]. The most common PET tracer is the glucose analogue [18F]-fluorodeoxyglucose (FDG), which is used to image the rate of glucose utilization in tissue.
In PET, molecular probes labelled with a positron (anti-electron)-emitting radionuclide are traced within the living body. When injected into a subject, positrons released from the radioactive decay of the unstable atom combine with electrons in the tissue, resulting in the complete annihilation of the two particles and the production of two 511 keV photons in opposite directions. A PET scanner uses rings of photon detectors to detect the annihilation photons, and sophisticated timing circuitry to electronically distinguish the pairs of photons (‘coincidences’) belonging to each annihilation event. Each pair is assigned to a line-of-response (LOR) between two detector crystals. Based on these data, images representing the changing three-dimensional distribution of the probe in the body over time can be reconstructed. A typical PET study involves an emission scan lasting several minutes to an hour, followed by a transmission scan (computed tomography) so that photon attenuation can be accounted for. A detailed coverage of the principles and applications of PET is given in Cherry et al. [2].
PET imaging of small animals using purpose-built scanners [3] with high spatial resolution (approx. 1 mm) enables longitudinal studies of the molecular changes resulting from controlled interventions that would not be possible in human studies [1,4]. The vast majority of such studies are performed on anaesthetized animals to ensure that the tomographic reconstruction is free of motion artefacts. However, anaesthetic drugs can readily mask or alter signals of interest and make it harder to quantify the effects of intervention and distinguish normal and abnormal responses [5–8]. Moreover, because anaesthetized animals cannot move or respond to external stimuli, it is generally not possible to study specific biological correlates of behaviour (i.e. neurochemical or receptor changes). Physical restraint [9–11] and paralysing drugs [12] represent possible approaches to avoid anaesthesia, but both can induce unacceptable levels of stress in the subject [12–14]. Another approach for rats is to use a miniaturized PET tomograph that attaches rigidly to the animal's head [15]. However, this requires a surgical procedure for attachment and also seems likely to limit the range of behaviours possible and the freedom of head motion.
A potentially more flexible and general approach for imaging unanaesthetized animals, which makes use of conventional small animal scanners, is to use motion compensation. Here, the three-dimensional motion of the animal's head is recorded during the study and subsequently accounted for before or during image reconstruction. A popular method to compensate for motion in PET, referred to as LOR-rebinning, involves spatially transforming each measured LOR based on the motion, at any given time, relative to the animal's pose at the start of the scan [16–18].
Regardless of which motion compensation method is used, a fundamental requirement for motion compensation of continuously moving subjects is accurate, well-sampled motion measurements with as few interruptions to tracking as possible. Previously, we have studied the accuracy and sampling issues; here, we are interested in uninterrupted tracking. However, there is little published data on the nature of rodent head motion and its measurement to inform the design of a motion-tracking system for imaging experiments involving unanaesthetized rats. Therefore, our aim in this work was to perform a systematic study of this subject with a view to designing a motion-tracking system well matched to the application.
Using marker-based optical tracking, we studied the head motion of normal, unanaesthetized rats, both tube-bound and freely moving, and evaluated the ability of a range of motion tracker configurations to provide uninterrupted measurements. Tube-bound rats were situated inside a snug-fitting plastic tube with their head protruding, affording them relative freedom of head movement. Rats in this set-up can respond to external stimuli, thus enabling a more diverse range of experiments compared with using anaesthetized subjects. The freely moving rat was able to move uninhibited within an observation chamber approximately the size of a shoebox. This environment permits a greater range of animal behaviour, making it better suited to studying correlations between behaviour and function [15]. While chamber-based PET imaging of animals with motion compensation has great potential and progress has been made towards this goal, there remain significant technical and algorithmic challenges that currently prevent its practical implementation [19]. Despite this, we have analysed it from a motion-tracking perspective to ascertain the feasibility of continuous tracking using a minimum of hardware.
2. Related work
2.1. Rodent head motion
Many studies have attempted to automate the recording of different behaviours or postures exhibited by caged rodents. Such studies are not considered here and instead the discussion is focused on investigations where motion parameters (e.g. velocity) were investigated explicitly.
Studies looking at one-dimensional and two-dimensional head motion parameters include [20–22]. In Emmi et al. [20] and Crescimanno et al. [21], rats with specific brain lesions were found to execute single-axis head turns with a maximum speed of 130 deg s−1. The study of Jobbagy et al. [22] reported head location and direction measurements of rats housed in inclined tubes, but the temporal resolution of the measurements (250 ms) was not suitable for assessing instantaneous speed [23].
Three-dimensional rat head motion data have been reported in a number of studies investigating spatial correlates of neuronal discharge. Head direction, pitch, and linear and angular velocity were measured for foraging, freely moving rats within a small enclosure [24–26] and for rats being moved by hand [27]. The foraging animals performed a mixture of complex behaviours such as sniffing, running, grooming, rearing, turning, swallowing and eating [24], making these data informative for imaging studies involving unanaesthetized, active rats. In all cases, rats had a rod affixed to the head with a light-emitting diode at each end. Video sequences of the rats with this attachment were processed to obtain head motion parameters. A maximum angular velocity of approximately 400 deg s−1 was reported for the freely moving rats compared with mean and maximum angular velocities of approximately 100 and 850 deg s−1, respectively, for rats moved by hand. Linear velocities were not reported in this series of studies. However, the mean and maximum linear velocities measured for two of the freely moving rats were in the range 80–130 and 250–400 mm s−1, respectively (J. Taube 2009, personal communication).
Three-dimensional head motion data have also been reported for several tube-bound mice in single photon emission computed tomography studies. Head pose was measured using three stereo-calibrated cameras with passive optical markers attached to the head [28] or using natural features on the animal [29]. However, no detailed analysis of the motion or tracking performance was provided.
2.2. Sensor planning
Sensor planning refers to choice of the type, number and arrangement of sensors to accomplish a measurement task. Vision-related tasks involving camera sensors include object modelling, pose estimation and object tracking, and are used in applications such as human motion capture (e.g. animation, biomechanics), robotics, automated visual inspection and computer graphics (e.g. virtual reality). Camera attributes that can be optimized include geometric parameters (location, orientation, motion) as well as optical parameters (resolution, field-of-view (FOV), lens characteristics) [30]. Collectively, these parameters define a generalized viewpoint [31].
The performance of a candidate camera network for a vision task is determined according to a performance metric such as accuracy or visibility [32,33]. For example, the metric in Chen [33] combined a geometric error related to camera resolution and a probabilistic error related to feature occlusions. This was minimized to obtain an optimal camera configuration to maximize visibility in human motion capture systems.
Various approaches are used to optimize a solution [30]. Generate-and-test methods involve a discrete search of specific system set-ups [34,35]. Although this can be time-consuming, when used within a simulation framework it can be very efficient. By contrast, a synthesis approach involves describing a sensor network analytically and finding a solution directly [36–38]. In general, this approach is complicated for anything other than simple sensor networks because of the large number of parameters involved. However, in the study of Allen & Welch [38], stochastic modelling of a generalized sensor network was used to visualize the impact of network adjustments (e.g. cameras added or relocated) on the performance of a measurement task.
In this work, we consider a network of marker-based binocular vision sensors for monitoring the head pose of rats during imaging. The task was to maximize uninterrupted tracking of head motion in different imaging situations. Therefore, performance was assessed using a metric based on continuity of tracking, a concept closely related to the classical ‘art-gallery’ sensor-planning problem in mathematics [39].
In summary, to our knowledge, there has not been a detailed analysis of rat head motion or consideration of how such motion can be measured in an uninterrupted fashion. Given the increasing interest in using motion compensation methods to image unanaesthetized rats, it is timely to conduct a detailed study of both of these aspects in order to inform the design of motion-tracking systems currently being developed for this purpose.
3. Methods
3.1. Animal experiments
Animals were cage-housed in same-sex pairs or triples, maintained on a 12 L : 12 D cycle, with food and water provided ad libitum. Every effort was made to minimize stress to the animals throughout experimental procedures.
3.2. Motion tracking
Motion tracking was performed using the MicronTracker Sx60 (ClaronTech. Inc., Toronto, Canada), a binocular-tracking system that computes a best-fit pose of printed markers in the field of measurement. Its relative compactness (baseline of 120 mm), accuracy (0.2 mm r.m.s. for individual target points) and frame rate capability (up to 48 Hz) suit it to the tracking of fast-moving objects in space-limited, high-resolution contexts such as the microPET (Preclinical Solutions, Siemens Healthcare Molecular Imaging, Knoxville, TN, USA) FOV. Further details on the MicronTracker and its suitability for small-scale motion tracking can be found in Kyme et al. [40].
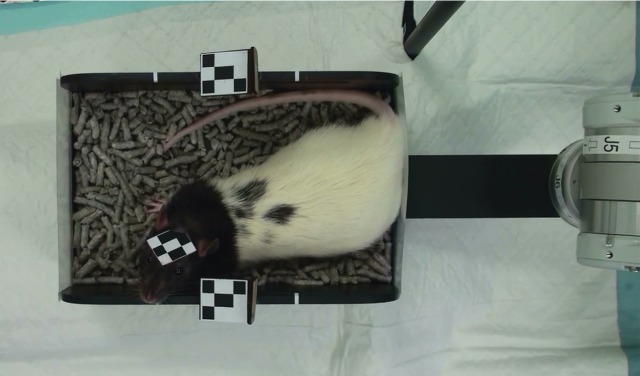
For both the tube-bound and freely moving rats, a marker measuring 18 mm × 22 mm (figure 1) was glued to the fur on the animal's forehead so that it did not obstruct the eyes or ears (figure 2). The marker comprised a printed pattern on a thin piece of polycarbonate. A curved plastic mount point was glued to the base of the marker to better conform to the head contour (figure 1a). The total structure weighed 0.7 g.
Figure 1.
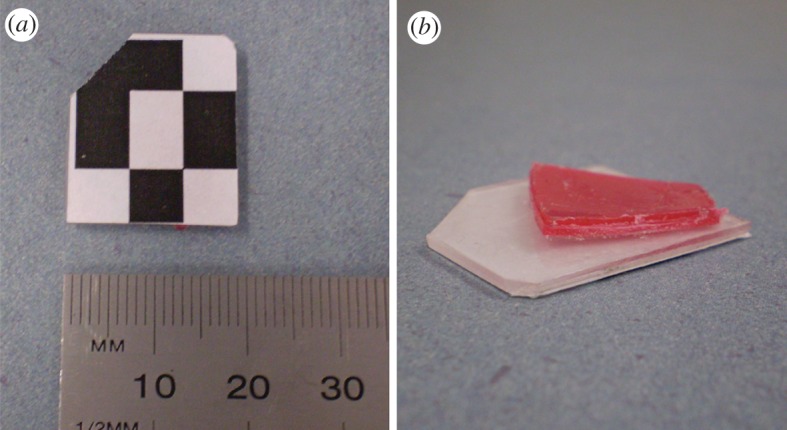
The animal head marker. (a) Printed marker pattern recognized by the tracking system; (b) underside of the marker showing the polycarbonate substrate and curved mounting point. (Online version in colour.)
Figure 2.
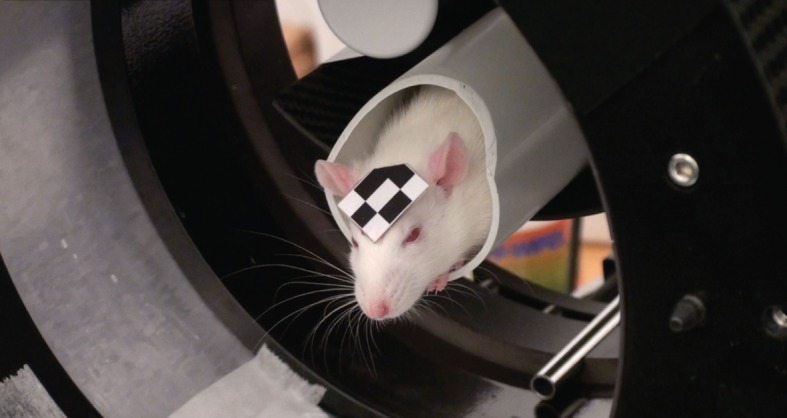
A tube-bound rat positioned in the microPET scanner. One marker was attached to the animal's forehead and a reference marker (not visible here) to the scanner gantry (details in §3.2). (Online version in colour.)
Calibration of the tracker and scanner, to enable conversion of tracker pose measurements to scanner coordinates, was performed as in Kyme et al. [40]. This calibration was adjusted for subsequent experiments to account for the change in pose of the motion-tracking system relative to the scanner FOV.
3.3. Tube-bound rats
Rats were placed inside a 60 mm diameter PVC tube with their head protruding into the scanner FOV (figure 2). The tube diameter was small enough to prevent the animals from turning around but large enough to avoid restraint related stress [41]. Prior to any imaging/motion tracking, rats were acclimatized to this set-up using sugar water (20% sucrose) as a food reward. Seven rats were studied in this set-up, including five Sprague Dawley (three female, two male) and two Long Evans (males), age ranging from 8 to 16 weeks at the time of experiment. Emission scans were 10–20 min in duration and in all cases the compound used for imaging was 18F-FDG (approx. 50 MBq injected via the tail vein). Table 1 summarizes the PET emission and transmission scans performed on the tube-bound rats.
Table 1.
A summary of PET studies performed for tube-bound rats.
| rat ID | emission scans | transmission scans | total time (min) |
|---|---|---|---|
| 1 | 3 × 10 min | 1 × 10 min, 2 × incomplete (<5 min) | 45 |
| 2 | 4 × 10 min | 3 × 20 min | 100 |
| 3 | 3 × 20 min | 3 × 20 min | 120 |
| 4 | 3 × 20 min, 1 × 10 min | 3 × 20 min, 1 × 10 min | 140 |
| 5 | 2 × 20 min, 2 × 10 min | 4 × 20 min | 140 |
| 6 | 1 × 60 min | 1 × 20 min | 80 |
| 7 | 1 × 60 min | 1 × 20 min | 80 |
To enable tracking of the forehead marker through a large angular range, the tracker was elevated and tilted downwards (approx. 30°) to align the tracker's optical axis with the marker surface normal in the rat's resting pose (i.e. head level and facing directly forward). Tilting was facilitated using a modified camera tripod mounted to the scanner bed (figure 3). In each of the 39 tube-bound scans listed in table 1, the working distance (tracker to centre of scanner FOV) was 0.5 m and tracking was performed at 30 Hz.
Figure 3.
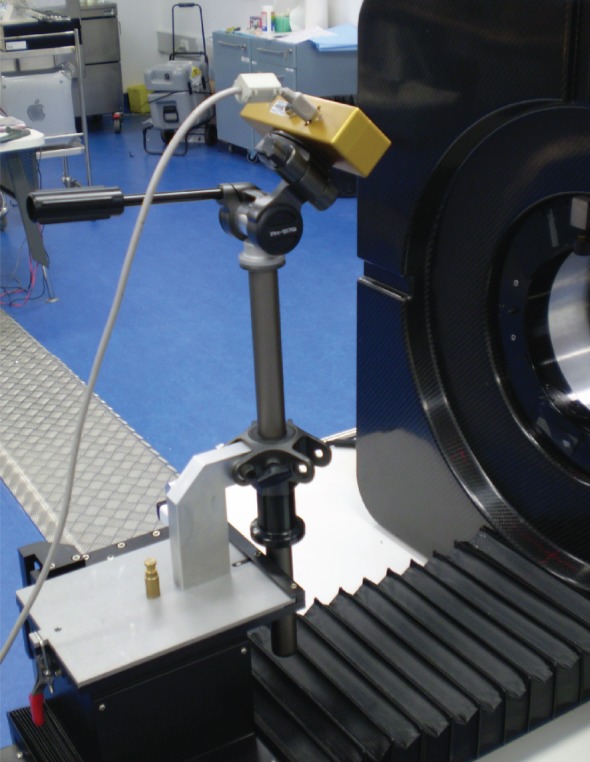
Attachment of the tracker to the microPET using a modified camera tripod and custom mounting plate. (Online version in colour.)
Tracking data from the 39 trials were analysed in five ways:
Identification of common trends/patterns of rat head motion.
- Calculation of the range and rate of motion with respect to the scanner coordinate system. For position given by P = [Px, Py, Pz] and rotation given by the 3 × 3 orthonormal rotation matrix R (where R can equally be expressed as three ordered Euler rotation angles αx, αy and αz about the x, y and z axes, respectively), the sample-sample rates of change for translation and rotation, respectively, were calculated according to
and
3.1a
Here i is the sample number, ti refers to the time of the ith sample, and the bracket notation in the numerator of (3.1b) indicates the component of rotation about either the x-, y- or z-axis with k identifying the particular axis. Without filtering the raw data, equation (3.1b) resulted in unreliable rotational speed estimates because these parameters were susceptible to measurement jitter, especially for slowly moving markers. Therefore, the motion data were pre-filtered using a weighted moving average pose filter as described in Kyme et al. [42]. An appropriate filter kernel was determined by comparing rotational speed estimates derived using the rat marker and a larger (low-jitter) marker. Simulated rat motion, generated as in Kyme et al. [23], was used for this comparison. A five-sample Gaussian kernel (s.d. 1 sample) resulted in rotational speed estimates within 2 deg s−1 of the true (low-jitter) values, compared with discrepancies of up to 35 deg s−1 without filtering.
3.1b Calculation of mean sample-sample displacement of selected head voxels of interest. Motion correction of the emission data was performed using the LOR-rebinning technique [18] and images were reconstructed using ordered-subsets expectation maximization [43]. The location of the central voxel of the brain was identified from the reconstruction and its trajectory throughout the scan computed based on the known motion. From this trajectory, the mean sample-sample displacement was calculated as a measure of the severity of motion within and across studies. To illustrate the utility of this method for distinguishing the motion of different regions of interest, we repeated the analysis for a voxel located at the tip of the snout—the most rapidly moving point on the rat's head due to its distance from the fulcrum of motion (i.e. the neck).
Calculation of uninterrupted tracking performance based on the number of missed samples compared with the number of total (attempted) samples.
Assessment of head direction statistics based on the marker surface normal. We used the Lambert azimuthal equal-area projection (LAP) [44] to map head directions onto a two-dimensional plane for visualization of the distribution and quantification of the uninterrupted tracking performance.
With the exception of (iv) and (v), analyses were performed after replacing any missed poses with the last detected pose.
3.4. Freely moving rat
In addition to the tube-bound scenario, we also analysed the head tracking requirements for a rat that was free to move within a small enclosure. Although it is not currently possible to obtain quantitative brain PET images for this scenario owing to several as yet unsolved technical challenges, our aim was to determine the number and arrangement of binocular trackers needed to achieve close to uninterrupted tracking of the head for a freely moving animal during various high-level behaviour types. Below, we describe the performance metric used, the simulation approach to sample various configurations and the experimental validation using a live animal.
3.4.1. Performance criterion for uninterrupted tracking
A marker pivoting about a fixed origin will be detected by a fixed tracker only for certain marker orientations, namely those for which the vector normal of the marker falls within a cone of detection (figure 4); tracking will be interrupted for other orientations unless there are additional (suitably located) trackers. The cone of detection can be thought of as a property of the tracker, varying with the working distance (a resolution effect) and marker pattern (a resolution and algorithmic effect). Provided these factors remain constant, the cone of detection is fixed. We determined the cone of detection for the MicronTracker/head marker combination at a working distance of 0.5 m by attaching the head marker to the end-effector of the Epson C3-A601S 6-axis robot (SEIKO Corp., Japan) and pivoting it by known azimuthal and polar angles.
Figure 4.
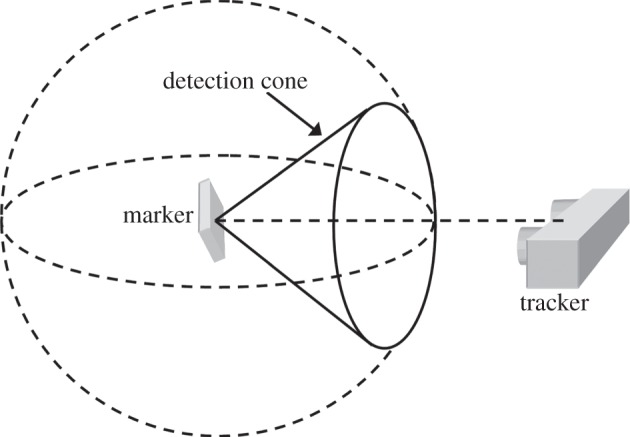
Marker detection. A pivoting marker is detected for all directions of the marker's vector normal within a detection cone, roughly symmetric about the tracker's optical axis. We refer to the hemispheres above and below the horizontal plane as the upper hemisphere (UH) and lower hemisphere (LH), respectively.
For tube-bound rats, the pivoting marker model is a good approximation because the animal's body is relatively fixed. The distribution of head marker direction for tube-bound rats was almost entirely in the upper hemisphere (UH) of an imaginary sphere surrounding the marker (see §4.1.4 and figure 9). Extrapolating this result, we hypothesized that the distribution of head marker direction for a freely moving animal would similarly fall within the UH but potentially occupy all of the UH compared with the small fraction occupied for ‘forward-facing’ tube-bound rats (figure 9). On the basis of this hypothesis, uninterrupted tracking of a freely moving rat would require a tracker network able to detect the entire UH of possible marker orientations. Therefore, we defined the performance metric for uninterrupted tracking as the proportion of the UH intersected by the detection cones of the trackers in a given test configuration. Simplified calculation of the metric, in two dimensions rather than three dimensions, was facilitated using the area-preserving LAP. Note that the earlier-mentioned hypothesis assumes that the pivoting marker model is equally valid for freely moving animals, which, in general, is not true. However, as will be described in §3.4.3, it is justified provided the head is kept relatively localized, which we achieve using compensatory movements applied by a robot (see §§3.4.3 and 4.2.5).
Figure 9.
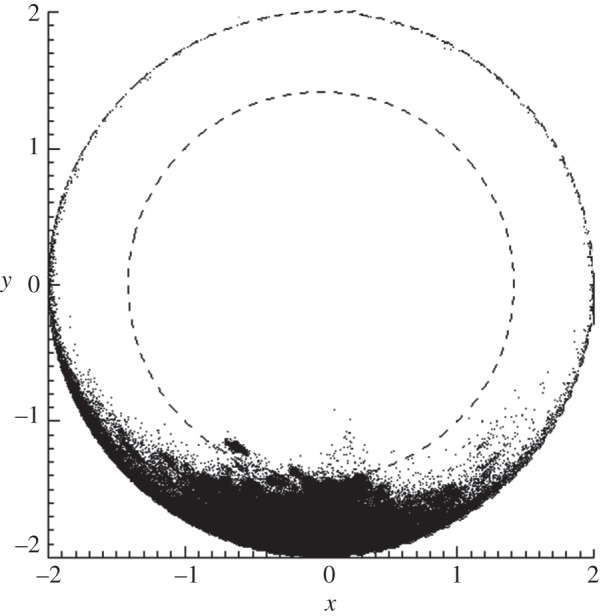
Head marker direction for tube-bound rats. Lambert azimuthal equal-area projection (LAP) plot showing the distribution of head marker directions for approximately 700 min of tube-bound rat tracking data. Units are arbitrary.
3.4.2. Simulations
Five tracker configurations were simulated and assessed based on the performance metric described in §3.4.1. The configurations, shown in figure 5, involved one, two and four trackers. In all cases, the trackers were 0.5 m from, and directed at, the scanner centre. Apart from configuration (e), all configurations took account of the presence of the physical scanner gantry. Configuration (e) was tested to compare the uninterrupted tracking performance for a single, hypothetical tracker positioned directly above the animal. For a single tracker, this represents the positioning likely to provide the best coverage of a freely moving animal. On the basis of the performance criterion described in §3.4.1, the uninterrupted tracking performance of each simulated tracking configuration was estimated as the proportion of the LAP annulus (UH) intersected by the cones of detection (projected to two-dimensional using the LAP) of trackers composing the configuration.
Figure 5.
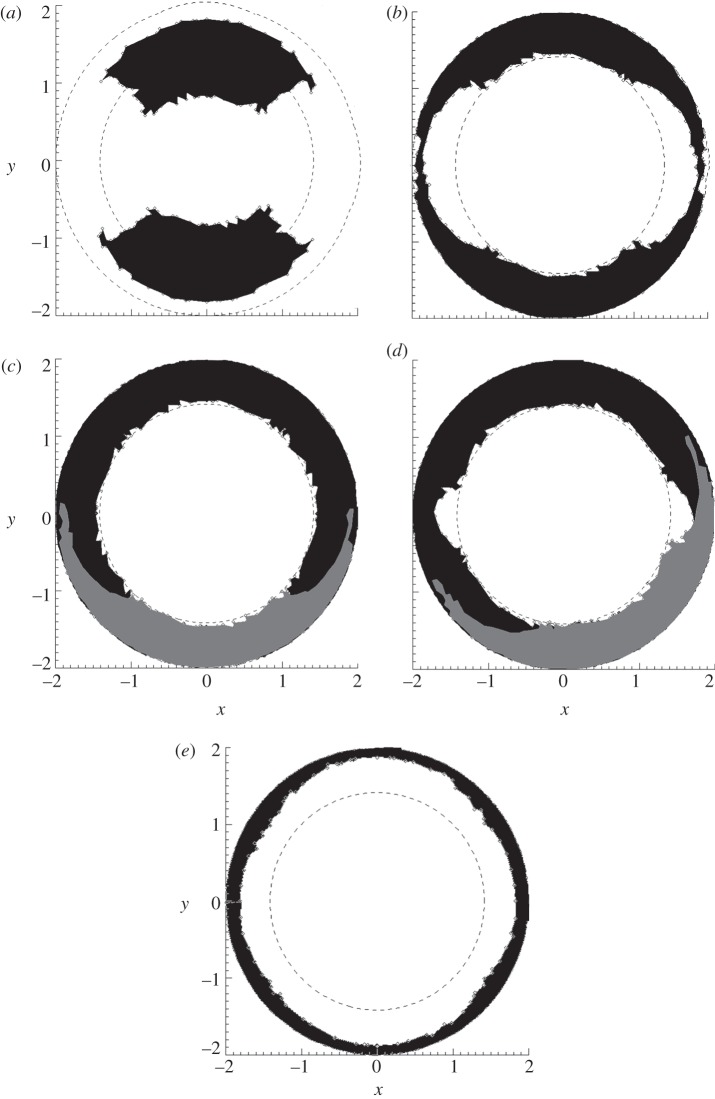
Simulated tracker configurations as viewed from above the microPET scanner: (a) two opposed trackers with no elevation; (b) two opposed trackers elevated by 45°; (c) four trackers arranged symmetrically around the scanner, each elevated by 45°; the azimuthal angle between each pair on a given side of the scanner is 90°; (d) similar to (c) except the azimuthal angle between each pair on a given side of the scanner is 60°; (e) a single tracker viewing from above with its baseline aligned with the axial direction of the scanner. Elevation angles are with respect to the horizontal plane through the centre of the scanner. All trackers were 0.5 m from the centre of the scanner FOV with optical axes directed at this point.
3.4.3. Validation
Simulation estimates of uninterrupted tracking performance were compared with estimates measured experimentally using a live subject in an open-top Perspex chamber of dimensions 200 mm (length) × 100 mm (width) × 70 mm (height). The chamber afforded an adolescent rat freedom to manoeuvre (figure 7). To facilitate imaging a freely moving animal in the space-limited microPET (axial FOV 76 mm), a robotic system was used to adjust the chamber smoothly in the x–z plane and thereby maintain the head near the centre of the axial FOV [19]. This also ensured the assumption of a fixed marker (§3.4.1) was reasonable.
Figure 7.
Top view of the motion-adaptive chamber showing the two-part marker for tracking the chamber. This marker was angled to be in constant view of one of the trackers. (Online version in colour.)
Two of the simulated tracking configurations were tested: the first consisted of two opposed trackers elevated by 45° (figure 5b). This was chosen, based on the simulation results, as a potentially good trade-off between the number of trackers and uninterrupted tracking performance. It also enabled both cameras to run from a single FireWire bus (and therefore automatically synchronize) with a sampling rate of greater than 20 Hz. The second configuration was a single tracker directly above the FOV (figure 5e). Both configurations were run simultaneously so that performance could be compared directly. A video camera was set up alongside the vertically located tracker for filming the experimental trials and enabling a retrospective categorization of the animal's behaviour. Filming was synchronized with tracking for each trial. The complete set-up is shown in figure 6 and an example frame from the video camera is shown in figure 7.
Figure 6.
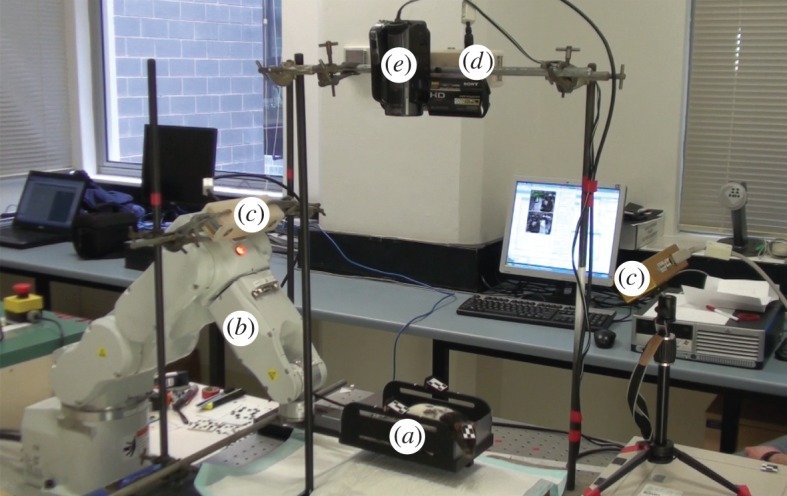
Tracking a freely moving rat inside a ‘virtual’ microPET scanner. The rat was confined to a chamber (a) controlled by a robot (b). Tracking was performed using a two-tracker configuration (c) as in figure 5b, and a single-tracker (d) mounted above the chamber as in figure 5e. A video camera (e) was also mounted above the set-up to record the trials. (Online version in colour.)
For convenience, the experiments were conducted without the microPET in place, using instead a virtual scanner coordinate system. The trackers were calibrated to the virtual scanner using the method described in Kyme et al. [42]. For the configuration comprising two trackers, all measurements (regardless of which tracker was involved in the detection) were automatically referenced to a common coordinate frame (that of ‘tracker 1’) so that only one calibration was necessary. A marker fixed to the laboratory bench was used as a calibration reference in case the trackers were inadvertently moved during or between trials. In addition, a two-part marker located midway along the length of the chamber (figure 7) was used to determine the location (in the horizontal plane) of the chamber centre, in scanner coordinates, for each tracker measurement. These data were used within the robot control algorithm to generate the chamber adjustments.
An eight-week-old male Long Evans rat was acclimatized to the motion-adaptive chamber using reward-based training similar to that used for the tube-bound rats. Then, using the two tracking configurations described already, the rat underwent numerous motion-tracking trials inside the chamber over a period of five weeks (age 8–12 weeks). Altogether, approximately 300 min of tracking data were collected for this animal. Motion data were collected at 26 Hz.
The tracking data were analysed by:
Categorization of behaviour using the video footage from each trial.
Computation of the range and rate of head motion similar to the method described in §3.3.2. Compensatory chamber movements were taken into account; so ranges and rates were relative to the world (scanner).
Computation of uninterrupted tracking performance based on the number of missed samples compared with total (attempted) samples. This was carried out for the different behaviour types identified in (i).
4. Results
4.1. Tube-bound rats
4.1.1. Patterns of head motion
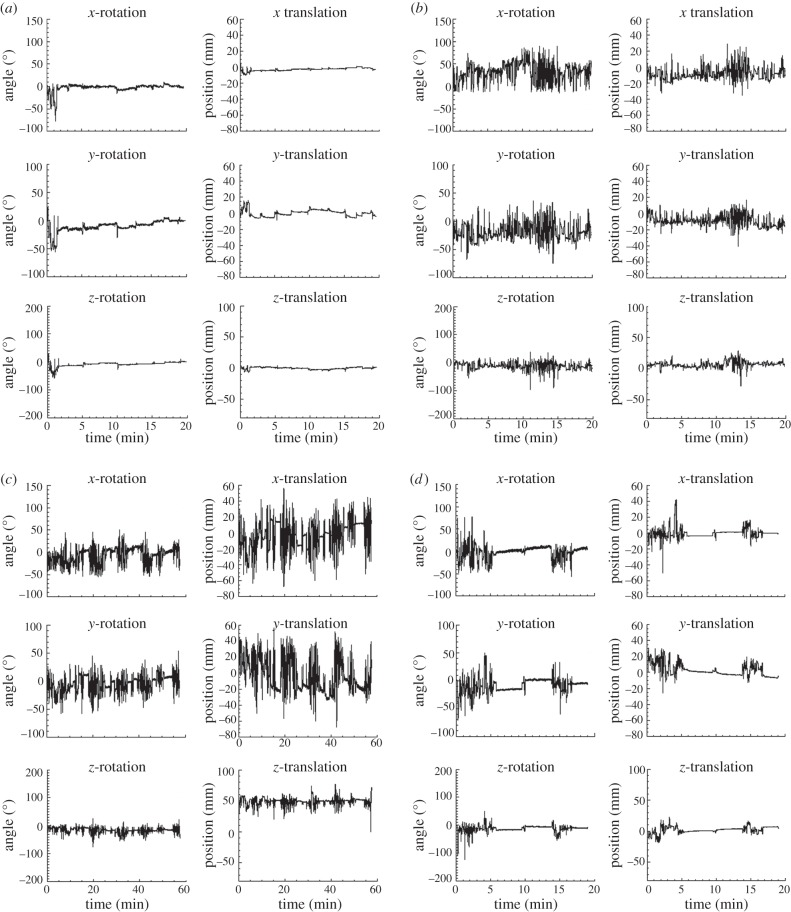
The tube environment permitted relative freedom of head movement and tube-bound rats were observed to exhibit resting, exploring, sniffing and grooming behaviour. Plots of the head motion for different subjects indicated a variety of motion patterns, including low-frequency drift, extended periods of low and high-amplitude motion in the same study, sustained activity throughout a study, and short-lived, extreme excursions (in range or speed). Approximately, a quarter of studies showed consistent low-amplitude motion (rotational variation less than 20° and translational variation less than 20 mm) and about a third showed consistent high-amplitude motion (rotational variation 50–150° and/or translational variation greater than 20 mm). Figure 8 shows examples of the various patterns; data are in scanner coordinates and show the motion relative to the initial pose of the animal.
Figure 8.
Examples of head motion patterns exhibited by tube-bound rats. (a) Consistent small-moderate amplitude motion; (b) consistent moderate-large amplitude motion; (c) mixture motion-extended periods of relative activity and restfulness; (d) slow drift. See main text for definitions. All data are shown in scanner coordinates, relative to the initial head pose.
4.1.2. Range and rate of motion
Table 2 shows the range and rate of motion for the tube-bound rat studies. The median angular and translational range was approximately 90° and 35 mm, respectively. However, 75 per cent of samples collected were within the smaller range of 20° and 10 mm. The maximum absolute angular and translational rates of motion were approximately 200 deg s−1 and 150 mm s−1, respectively. Mean values were less than 10 deg s−1 for angular motion and less than 2 mm s−1 for translational motion. For 75 per cent of the time, angular motion was less than 20 deg s−1 and translational motion was less than 5 mm s−1.
Table 2.
Range* and rate* of head motion for tube-bound rats. *Values represent the median of the given statistic across all studies.
| range (mm, deg) |
rate (mm s−1, deg s−1) |
|||
|---|---|---|---|---|
| d.f. | max. abs. | 75% range | max. abs. | 75% rate |
| x-rot | 88 | 21 | 220 | 16 |
| y-rot | 86 | 22 | 235 | 10 |
| z-rot | 89 | 15 | 195 | 8 |
| x | 40 | 9 | 155 | 2 |
| y | 41 | 11 | 175 | 3 |
| z | 32 | 8 | 135 | 3 |
4.1.3. Continuity of tracking
Table 3 shows a summary of the motion-tracking statistics for all tube-bound rat studies. Altogether, there were approximately 700 min of data. On average, 3.5 per cent of the samples in each study were missed because the marker was out of range or, on rare occasions, because the animal briefly withdrew into the tube. This corresponded to approximately one missed sample every second. In all cases, missed samples were sporadically distributed throughout the acquired data. Only 4/39 studies had greater than 10 per cent missed samples (maximum 13%).
Table 3.
Tracking statistics for tube-bound studies.
| total scan time (min) | 696 |
| total samples missed | 44534 |
| total time missed (min) | 24.8 |
| per cent missed (mean, median) | 3.5, 2.0 |
| average rate missed (s−1) | 1.1 |
4.1.4. Head direction
Figure 9 shows the distribution of marker normal directions for all tube-bound rat studies. Because there was less than 4 per cent loss of tracking (§4.1.3), these data represent greater than 96 per cent of all head directions assumed by the rat during the 700 min of data collected. In this LAP plot, the annulus defined by the inner and outer dotted circles maps points on the UH and the central circular region maps points on the lower hemisphere (LH). Points were almost exclusively on the UH and were concentrated in the ‘forward’ direction due to the tube preventing the animal from turning around.
4.1.5. Voxel motion
Table 4 shows the sample-sample voxel displacement of a selected brain and snout voxel. Only the reconstructed emission scans (n = 19) were considered for this analysis. The selected brain voxel was at the centre of the brain and moved 0.3 mm on average in each sample interval with root mean square error (r.m.s.e.) 0.3 mm and mode 0.1 mm. Corresponding values for a voxel at the tip of the snout were 0.4 mm (average distance), 0.6 mm (r.m.s.e.) and 0.1 mm (mode). The median value of maximum sample-sample displacement across all studies was 6.1 and 7.8 mm for the brain and snout voxel, respectively. Global maximum sample-sample displacements were 27 and 35 mm, respectively.
Table 4.
Voxel motion statistics for tube-bound rats. Units are in millimetre.
| brain | snout | |
|---|---|---|
| meana | 0.24 (0.12–0.36)b | 0.43 (0.17–0.62) |
| modea | 0.09 (0.01–0.16) | 0.07 (0–0.26) |
| maxa | 6.1 (1.9–27) | 7.8 (3.5–35) |
| r.m.s.a | 0.28 (0.15–0.57) | 0.64 (0.33–1.0) |
| global max | 27 | 35 |
aValues represent the median of the given statistic across all studies.
bValues in parentheses indicate the range across all studies.
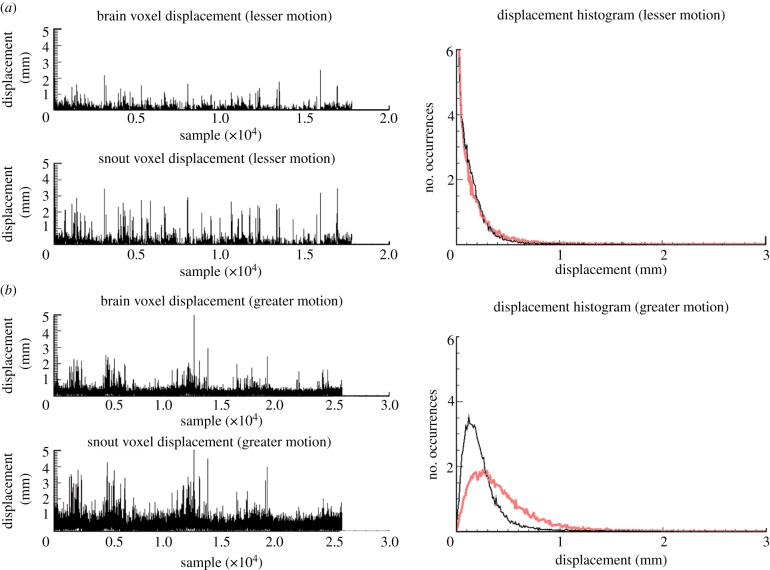
Figure 10 compares the sample-sample voxel displacement and displacement histograms for the brain and snout voxel during a ‘low activity’ (figure 10a) and ‘high activity’ (figure 10b) study. This relative classification of the motion was based on qualitative assessment of the video record. Sample-sample voxel displacements were greater for the high-activity study and the mean displacement of the snout voxel was greater than that of the brain voxel regardless of the classification. The broader, right-shifted histograms in the high-activity case confirm the observation that motion was greater for this study. Quantitatively, the mean, r.m.s.e. and maximum brain voxel displacements for the low-activity study were 0.12, 0.15 and 2.5 mm, respectively, compared with corresponding values of 0.24, 0.21 and 8.6 mm, respectively, for the high-activity study. In this instance, we concluded that head motion was approximately twice as great for the high-activity study.
Figure 10.
Sample-sample displacement and displacement histograms for a selected brain (black) and snout (grey) voxel during a study with (a) lesser motion and (b) greater motion. (Online version in colour.)
4.2. Freely moving rats
4.2.1. Simulations
Uninterrupted tracking performance of the five configurations tested is shown in figure 11. The percentage coverage of the UH was smallest for two non-elevated trackers (34%, figure 11a). In this case, some of the tracking coverage was ‘wasted’ on the LH. Elevating the trackers by 45° resulted in approximately twice the performance (69%, figure 11b). The two configurations involving four elevated trackers resulted in 96 per cent and 90 per cent coverage of the UH, respectively (figure 11c,d). Finally, the single vertical tracker resulted in 35 per cent coverage (figure 11e). Thus, the symmetric four-tracker arrangement performed the best in terms of tracking coverage of the UH.
Figure 11.
(a–e) Tracking coverage for the five tracker configurations in figure 5a–e. Coverage of the UH was 34%, 69%, 96%, 90% and 35%, respectively. Note that for (c) and (d) the coverage for one tracker has been shaded grey to indicate the extent. Axis units are arbitrary.
4.2.2. Patterns of behaviour
We defined five high-level behaviour types based on the video record of the freely moving animal (note that the number of times each behaviour type was observed for 10 s or longer is indicated in parentheses):
Low-to-medium activity (n = 66)—rat inactive and restful and occasionally moving around the chamber; body remaining in the same location for 30 s or longer before relocating; not actively exploring.
Medium-to-high activity (n = 44)—frequently moving around the chamber (i.e. not stationary for more than a few seconds); noticeable whisker movement; active sniffing and exploring.
Grooming (n = 27)—grooming of any part of the body (e.g. head, tail, paws).
Agitation (n = 27)—attempting to remove the head marker by scratching and/or forcing.
Sleeping (n = 17)—sleeping accompanied by almost no movement of the head for extended (greater than 5 min) periods.
4.2.3. Range and rate of motion
Head motion range (75% threshold) was 360°, 98° and 360° for x, y and z rotations, respectively, and 104, 51 and 316 mm for x, y and z translations, respectively. The z translation range exceeded the chamber length because the animal could extend its head over the sides. Table 5 summarizes the rate data and indicates a clear distinction in rates for the different high-level behaviour types. Grooming and agitation reflected the highest rates, and the average overall rates matched very closely those for the low-to-medium activity behaviour type.
Table 5.
Rate* of head motion for the freely moving rat during different behaviours. Units are in mm s−1 and deg s−1. *Values represent the 75% threshold, i.e. 75% of the time the speed was less than the values indicated.
| d.f. | low-to-med | med-to-high | grooming | agitation | sleeping | all |
|---|---|---|---|---|---|---|
| x-rot | 19 | 38 | 56 | 52 | 7 | 18 |
| y-rot | 14 | 31 | 35 | 32 | 3 | 12 |
| z-rot | 13 | 26 | 52 | 38 | 5 | 12 |
| x | 8 | 18 | 28 | 25 | 1 | 7 |
| y | 8 | 20 | 41 | 39 | 1 | 7 |
| z | 12 | 23 | 25 | 25 | 4 | 11 |
4.2.4. Head direction
Figure 12 shows the distribution of forehead marker directions for the freely moving animal experiments, representing approximately 300 min of tracking data obtained using the two-tracker configuration. During these experiments, tracking was maintained approximately 90 per cent of the time. As with the tube-bound animals, the distribution of head directions was largely in the UH. This supports our hypothesis that a reasonable definition of optimal tracking coverage for a freely moving animal consists of tracking over the entire UH.
Figure 12.
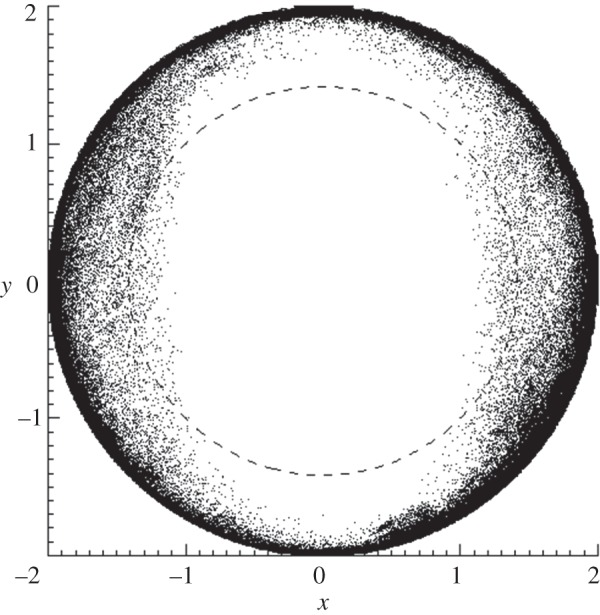
Head marker direction for a freely moving rat. Lambert azimuthal equal-area projection (LAP) plot showing the distribution of head marker directions for approximately 300 min of freely moving rat tracking data collected using the two-tracker configuration. Units are arbitrary.
4.2.5. Continuity of tracking
Overall, 10.5 per cent of samples were missed because the marker was out of range. This corresponded to approximately one missed sample every 2.5 s. Generally, missed samples were distributed sporadically throughout the acquired data but occasionally became concentrated if a resting pose that was difficult to detect was adopted for an extended period. Table 6 shows the breakdown of behaviour for all trials and the associated tracking performance for the two configurations tested. Low-to-medium activity was the dominant behaviour (60%) and together with resting comprised 80 per cent of all observed behaviour. Medium-to-high activity comprised 15 per cent and grooming and agitation 5 per cent. Uninterrupted tracking performance for the low-to-moderate activity was similar for the two tracking configurations (approx. 6% interruption), but for all other behaviours the two-tracker configuration outperformed the single-tracker configuration. The greatest (percentage) discrepancy between the two configurations occurred during grooming and agitated behaviour. Overall, the two-tracker configuration resulted in interrupted tracking 8.7 per cent of the time compared with 11.3 per cent for the single-tracker configuration.
Table 6.
Uninterrupted tracking performance for freely moving animal trials.
| two-tracker configuration (figure 5b) |
one-tracker configuration (figure 5e) |
|||||
|---|---|---|---|---|---|---|
| behaviour type | time (min) | fraction (%) | time missed (min) | per cent missed | time missed (min) | per cent missed |
| low-to-medium | 170.9 | 60.6 | 10.0 | 5.9 | 10.4 | 6.1 |
| medium-to-high | 41.1 | 14.6 | 6.6 | 16.0 | 9.0 | 21.7 |
| grooming | 7.2 | 2.5 | 3.3 | 45.1 | 5.8 | 80.4 |
| agitated | 5.5 | 2.0 | 2.3 | 40.7 | 3.8 | 69.6 |
| sleeping | 57.2 | 20.3 | 2.3 | 4.0 | 3.1 | 5.4 |
| all | 281.9 | 100 | 24.4 | 8.7 | 32.1 | 11.4 |
5. Discussion
5.1. Tube-bound rats
The head motion of tube-bound rats was characterized by a roughly constant level of activity or alternating, sustained periods of greater and lesser activity. Although rats frequently rested for extended periods, the head cannot be assumed stationary (except perhaps for brief periods when the animal is asleep), warranting continuous regular sampling of the motion. Generally, the head moves quite slowly with respect to the scanner (less than 20 deg s−1 rotation and less than 5 mm s−1 translation) while brief, rapid movements with maximal rates of greater than 200 deg s−1 rotation and greater than 150 mm s−1 translation occur far less frequently.
For forward-facing tube-bound rats, it was typical to observe the head rotating through a 90° range about each scanner axis. Therefore, to achieve uninterrupted tracking, it is preferable to use a tracking system whose cone of detection subtends a sufficiently large solid angle at the required working distance. Furthermore, the surface normal of a forehead marker sweeps out directions almost exclusively above the horizontal plane. Therefore, tracking is best performed from an elevated position. We demonstrated that using a single state-of-the-art tracker aligned with the animal's resting head pose led to a mean tracking interruption rate of 1 sample s−1 for a 30 Hz sampling rate, i.e. an interruption rate of less than 5 per cent.
Quantifying complex rigid body motion in an intuitive fashion is a challenging problem. The method presented, based on the distribution of sample-sample displacements of selected voxels (or regions) of interest, provides a single intuitive metric describing the severity of motion in and across studies, regardless of how unpredictable, complex or arbitrary motion may be. This approach inherently accounts for the performance characteristics of the tracker and scanner, and the specific task requirements (e.g. motion correction of the brain). Although we did not set out to investigate sampling rate requirements in this work, the voxel motion results suggest that reducing the sampling rate to 10 Hz would still maintain the average sample-sample displacement of brain voxels in the sub-millimetre range. Therefore, to make full use of the microPET spatial resolution (approx. 1 mm), sampling at greater than or equal to 10 Hz is recommended. This requirement is consistent with the finding in Kyme et al. [23] and is well within the specifications of many state-of-the-art three-dimensional tracking systems.
5.2. Freely moving rats
For the case of freely moving rats, we developed a simulation framework to assess the uninterrupted head tracking performance of specified tracker configurations. Results for several practical configurations showed that an attractive trade-off is achieved between the number of trackers and uninterrupted tracking performance when two opposed and elevated trackers are used. This configuration resulted in uninterrupted tracking approximately 90 per cent of the time. Although the result probably does not generalize to other rats because they could exhibit the behaviour types in different proportions, it does generalize to the behaviour types themselves. Specifically, the two-tracker configuration provides acceptable performance for resting through to high-activity behaviour but performs poorly for grooming and agitated behaviour. We expect the latter behaviours to be relatively infrequent, however, especially if adequate time is given to acclimatizing animals to the marker and environment. For all behaviours, better performance is likely with additional trackers, though the benefit may be outweighed by the added cost and complexity of such set-ups—especially if an animal's behaviour profile reflects that of the rat we studied (grooming and agitation less than 5%).
Imaging of a freely moving rat in a small space necessitated the use of the robotic chamber control system [19]. Compensatory movements associated with this system, especially large accelerations, could influence the behaviour and motion of the rat. The slow and smooth motion used in this work (less than 50 mm s−1) did not appear to disconcert the animal, and there were no noticeable differences in behaviour when the chamber was stationary.
The obvious location for a single tracker would be directly above the animal. For conventional PET scanner designs, this remains a hypothetical configuration owing to obstruction by the gantry, but it could be a viable configuration for novel scanner designs such as a horizontally oriented PET detector ring. Nevertheless, the configuration did not perform well in simulation and was also inferior to the two-tracker configuration in practice. Therefore, multiple trackers are warranted for uninterrupted tracking of a freely moving rat.
5.3. Study limitations
Both the tube-bound and open chamber approaches studied allow rats to leave the apparatus. In 80 per cent of the tube-bound studies, and occasionally during the chamber-based trials, brief intervention in the form of stroking the fur or offering sugar water was used to prevent this. Tracking was often lost briefly during such interventions in tube-bound rats owing to occlusion of the marker, and this had the effect of reducing continuous tracking estimates. In the freely moving animal, to avoid biasing the behaviour categorization, we did not consider behaviour immediately following intervention. In general, administering a food reward or handling the animals during an experiment (unless part of the protocol) is undesirable owing to its potential influence on animal behaviour and/or function. Additional training or, for the freely moving rat, enclosing the chamber with a transparent cover could be used to avoid this.
Another limitation of our study was the marker attachment method that can allow motion of the marker relative to the head, e.g. during agitated behaviour and sometimes during grooming. Pose measurements during this time were prone to greater error. However, as table 6 indicates, behaviour associated with marker interference is likely to be brief compared with other behaviours. Moreover, the marker appears to return to its original placement after interference, and this is confirmed by the absence of obvious blurring artefacts in the motion-corrected images [23]. Therefore, we do not expect the attachment method to affect the usefulness of the results.
Finally, we reiterate that the foregoing study relates to marker-based motion tracking, in which the size and geometry limitations of an attached marker impose limitations on tracker placement and the range of motion detectable. One possible alternative to overcome these limitations is to track natural features on the animal. We are currently investigating the feasibility and robustness of such an approach in rats.
In summary, we have shown that for tube-bound and freely moving rats, one or two state-of-the-art binocular trackers, respectively, are sufficient to provide less than 10 per cent interruption to tracking. We conclude that reliable tracking of head pose can be achieved with marker-based optical-motion-tracking systems for both tube-bound and freely moving rats undergoing PET studies while unanaesthetized.
Acknowledgements
All animal experiments were conducted in accordance with a protocol approved by the University of Sydney Animal Ethics Committee (protocol no. K00/12-2008/2/4891).
This work was supported by the Australian Research Council Discovery Projects nos. DP 0663519 and DP0988166.
References
- 1.Phelps M. E. 2000. Positron emission tomography provides molecular imaging of biological processes. Proc. Natl Acad. Sci. USA 97, 9226–9233 10.1073/pnas.97.16.9226 (doi:10.1073/pnas.97.16.9226) [DOI] [PMC free article] [PubMed] [Google Scholar]
- 2.Cherry S. R., Sorenson J. A., Phelps M. E. 2003. Physics in nuclear medicine, 3rd edn Philadelphia, PA: Saunders/Elsevier Science [Google Scholar]
- 3.Chatziioannou A. 2002. Molecular imaging of small animals with dedicated PET tomographs. Eur. J. Nucl. Med. 29, 98–114 10.1007/s00259-001-0683-3 (doi:10.1007/s00259-001-0683-3) [DOI] [PubMed] [Google Scholar]
- 4.Lancelot S., Zimmer L. 2010. Small-animal positron emission tomography as a tool for neuropharmacology. Trends Pharmacol. Sci. 31, 411–417 10.1016/j.tips.2010.06.002 (doi:10.1016/j.tips.2010.06.002) [DOI] [PubMed] [Google Scholar]
- 5.Santarelli R., Arslan E., Carraro L., Conti G., Capello M., Plourde G. 2003. Effects of isoflurane on the auditory brainstem responses and middle latency responses of rats. Acta Otolaryngol. 123, 176–181 10.1080/0036554021000028108 (doi:10.1080/0036554021000028108) [DOI] [PubMed] [Google Scholar]
- 6.Dong H. L., Fukuda S., Murata E., Higuchi T. 2006. Excitatory and inhibitory actions of isoflurane on the cholinergic ascending arousal system of the rat. Anaesthesiology 104, 122–133 10.1097/00000542-200601000-00018 (doi:10.1097/00000542-200601000-00018) [DOI] [PubMed] [Google Scholar]
- 7.Martin C., Martindale J., Berwick J., Mayhew J. 2006. Investigating neural-hemodynamic coupling and the hemodynamic response function in the awake rat. Neuroimage 32, 33–48 10.1016/j.neuroimage.2006.02.021 (doi:10.1016/j.neuroimage.2006.02.021) [DOI] [PubMed] [Google Scholar]
- 8.Kilbourn M., Ma B., Butch E., Quesada C., Sherman P. S. 2007. Anaesthesia increases in vivo N-([18F]fluoroethyl)piperidinyl benzilate binding to the muscarinic cholinergic receptor. Nucl. Med. Biol. 34, 479–482 10.1016/j.nucmedbio.2007.04.008 (doi:10.1016/j.nucmedbio.2007.04.008) [DOI] [PubMed] [Google Scholar]
- 9.Lahti K., Ferris C., Li F., Sotak C., King J. 1998. Imaging brain activity in conscious animals using functional MRI. J. Neurosci. Meth. 82, 75–83 10.1016/S0165-0270(98)00037-5 (doi:10.1016/S0165-0270(98)00037-5) [DOI] [PubMed] [Google Scholar]
- 10.Martín J., Jiménez A., Seco F., Calderón L., Pons J., Ceres R. 2002. Estimating the 3D-position from time delay data of US-waves: experimental analysis and a new processing algorithm. Sens. Actuators A Phys. 101, 311–321 10.1016/S0924-4247(02)00211-X (doi:10.1016/S0924-4247(02)00211-X) [DOI] [Google Scholar]
- 11.Hosoi R., Matsumura A., Mizokawa S., Tanaka M., Nakamura F., Kobayashi K., Watanabe Y., Inoue O. 2005. MicroPET detection of enhanced 18F-FDG utilisation by PKA inhibitor in awake rat brain. Brain Res. 1039, 199–202 10.1016/j.brainres.2005.01.064 (doi:10.1016/j.brainres.2005.01.064) [DOI] [PubMed] [Google Scholar]
- 12.Peeters R., Tindemans I., De Schutter E., Van der Linden A. 2001. Comparing BOLD fMRI signal changes in the awake and anaesthetized rat during electrical forepaw stimulation. Magn. Reson. Imaging 19, 821–826 10.1016/S0730-725X(01)00391-5 (doi:10.1016/S0730-725X(01)00391-5) [DOI] [PubMed] [Google Scholar]
- 13.Keim K., Sigg E. 1976. Physiological and biochemical concomitants of restraint stress in rats. Pharmacol. Biochem. Behav. 4, 289–297 10.1016/0091-3057(76)90244-6 (doi:10.1016/0091-3057(76)90244-6) [DOI] [PubMed] [Google Scholar]
- 14.Patel V., Lee D., Alexoff D., Dewey S., Schiffer W. 2008. Imaging dopamine release with Positron Emission Tomography (PET) and 11C-raclopride in freely moving animals. Neuroimage 41, 1051–1066 10.1016/j.neuroimage.2008.02.065 (doi:10.1016/j.neuroimage.2008.02.065) [DOI] [PubMed] [Google Scholar]
- 15.Shultz D., et al. 2011. Simultaneous assessment of rodent behavior and neurochemistry using a miniature positron emission tomograph. Nat. Methods 8, 347–352 10.1038/nmeth.1582 (doi:10.1038/nmeth.1582) [DOI] [PubMed] [Google Scholar]
- 16.Fulton R., Nickel I., Tellmann L., Meikle S., Pietrzyk U., Herzog H. 2003. Event-by-event motion compensation in 3D PET. In Proc. 2003 IEEE Nuclear Science Symp. and Medical Imaging Conf., Portland, Oregon, pp. 3286–3289 [Google Scholar]
- 17.Bloomfield P., Spinks T., Reed J., Schnorr L., Westrip A., Livieratos L., Fulton R., Jones T. 2003. The design and implementation of a motion correction scheme for neurological PET. Phys. Med. Biol. 48, 959–978 10.1088/0031-9155/48/8/301 (doi:10.1088/0031-9155/48/8/301) [DOI] [PubMed] [Google Scholar]
- 18.Zhou V., Kyme A., Meikle S., Fulton R. 2008. An event driven motion correction method for neurological PET studies of awake laboratory animals. Mol. Imaging Biol. 10, 315–324 10.1007/s11307-008-0157-0 (doi:10.1007/s11307-008-0157-0) [DOI] [PubMed] [Google Scholar]
- 19.Zhou V., Eisenhuth J., Kyme A., Akhtar M., Fulton R., Meikle S. 2010. A motion adaptive animal chamber for PET imaging of freely moving animals. In Proc. 2010 IEEE Nuclear Science Symp. and Medical Imaging Conf., Knoxville, Tennessee, USA, pp. 3049–3053 [Google Scholar]
- 20.Emmi A., Crescimanno G., Amato G. 1995. Modifications of head turning and circling movement following sulpiride microinjections into nucleus accumbens in the rat. Brain Res. Bull. 38, 99–103 10.1016/0361-9230(95)00064-L (doi:10.1016/0361-9230(95)00064-L) [DOI] [PubMed] [Google Scholar]
- 21.Crescimanno G., Emmi A., Amato G. 1998. Effects of intraaccumbens microinjections of quipirole on head turning and circling movement in the rat. Pharmacol. Biochem. Behav. 60, 829–834 10.1016/S0091-3057(98)00033-1 (doi:10.1016/S0091-3057(98)00033-1) [DOI] [PubMed] [Google Scholar]
- 22.Jobbagy A., Gyongy L., Monos E. 2002. Quantitative evaluation of long-term locomotor activity in rats. IEEE Trans. Instrum. Meas. 51, 393–397 10.1109/19.997842 (doi:10.1109/19.997842) [DOI] [Google Scholar]
- 23.Kyme A., Zhou V., Meikle S., Baldock C., Fulton R. 2011. Optimised motion tracking for positron emission tomography studies of brain function in awake Rats. PLoS ONE 6, e21727 10.1371/journal.pone.0021727 (doi:10.1371/journal.pone.0021727) [DOI] [PMC free article] [PubMed] [Google Scholar]
- 24.Taube J. 1995. Head direction cells recorded in the anterior thalamic nuclei of freely moving rats. J. Neurosci. 15, 70–86 [DOI] [PMC free article] [PubMed] [Google Scholar]
- 25.Stackman R., Taube J. 1998. Firing properties of rat lateral mammillary single units: head direction, head pitch, and angular head velocity. J. Neurosci. 18, 9020–9037 [DOI] [PMC free article] [PubMed] [Google Scholar]
- 26.Bassett J., Taube J. 2001. Neural correlates for angular head velocity in the rat dorsal tegmental nucleus. J. Neurosci. 21, 5740–5751 [DOI] [PMC free article] [PubMed] [Google Scholar]
- 27.Bassett J., Zugaro M., Muir G., Golob E., Muller R., Taube J. S. 2005. Passive movements of the head do not abolish anticipatory firing properties of head direction cells. J. Neurophysiol. 93, 1304–1316 10.1152/jn.00490.2004 (doi:10.1152/jn.00490.2004) [DOI] [PubMed] [Google Scholar]
- 28.Weisenberger A., Kross B., Majewski S., McKisson J., Popov V., Proffitt J., Stolin A., Baba J., Goddard J., Lee S., Smith M., Tsui B., Pomper M. 2008. Awake animal SPECT: Overview and initial results. In Proc. 2008 IEEE Nuclear Science Symp. and Medical Imaging Conf., Dresden, Germany, pp. 5588–5591 [Google Scholar]
- 29.Goddard J., Baba J., Lee S., Weisenberger A., Stolin A., McKisson J., Smith M. 2009. Intrinsic feature pose measurement for awake animal SPECT imaging. In Proc. 2009 IEEE Nuclear Science Symp. and Medical Imaging Conf., Dresden, Germany, pp. 2557–2560 [Google Scholar]
- 30.Tarabanis K., Allen P., Tsai R. 1995. A survey of sensor planning in computer vision. IEEE Trans. Robot. Autom. 11, 86–104 10.1109/70.345940 (doi:10.1109/70.345940) [DOI] [Google Scholar]
- 31.Tarabanis K., Tsai R. 1991. Computing viewpoints that satisfy optical constraints. In Proc. 1991 IEEE Computer Society Conf. on Computer Vision and Pattern Recognition, Maui, HI, USA, pp. 152–158 [Google Scholar]
- 32.Sanders-Reed J. 2002. Impact of tracking system knowledge on multi-sensor 3D triangulation. Proc. SPIE 4714, 33–41 [Google Scholar]
- 33.Chen X. 2002. Design of many-camera tracking systems for scalability and efficient resource allocation. PhD dissertation, Stanford University, Stanford, CA [Google Scholar]
- 34.Sakane S., Sato T. 1991. Automatic planning of light source and camera placement for an active photmetric stereo system. In Proc. 1991 IEEE Int. Conf. on Robotics and Automation, Sacramento, California, USA, pp. 1080–1087 [Google Scholar]
- 35.Yi S., Haralick R., Shapiro L. 1989. Automatic sensor and light positioning for machine vision. Technical Report Intelligent Systems Laboratory, University of Washington, Seattle, WA [Google Scholar]
- 36.Cowan C., Kovesi P. 1988. Automatic sensor placement from vision task requirements. IEEE Trans. Pattern Anal. Mach. Intell. 10, 407–416 10.1109/34.3905 (doi:10.1109/34.3905) [DOI] [Google Scholar]
- 37.Tarabanis K., Tsai R., Kaul A. 1996. Computing occlusion-free viewpoints. IEEE Trans. Pattern Anal. Mach. Intell. 18, 279–292 10.1109/34.485556 (doi:10.1109/34.485556) [DOI] [Google Scholar]
- 38.Allen B., Welch G. 2005. A general method for comparing the expected performance of tracking and motion capture systems. In ACM Symp. on Virtual Reality Software and Technology 2005, Monterey, California, USA, pp. 201–210 [Google Scholar]
- 39.O'Rourke J. 1987. Art gallery theorems and algorithms. New York, NY: Oxford University Press [Google Scholar]
- 40.Kyme A., Zhou V., Meikle S., Fulton R. 2008. Real-time 3D motion tracking for small animal brain PET. Phys. Med. Biol. 53, 2651–2666 10.1088/0031-9155/53/10/014 (doi:10.1088/0031-9155/53/10/014) [DOI] [PubMed] [Google Scholar]
- 41.Fulton R., Meikle S., Kyme A., Zhou V., Popovic K., Kassiou M., Akhtar M. 2008. Motion-corrected microPET brain imaging of conscious rats. Abstract. In Proc. 2009 World Molecular Imaging Conf., Montreal, Canada http://www.wmicmeeting.org/abstracts/data/papers/1162.html. [Google Scholar]
- 42.Kyme A., Maclaren J., Meikle S., Baldock C., Fulton R. 2011. The effect of time domain pose filtering on accuracy of small marker based motion correction in awake animal PET. In Proc. 2011 IEEE Nuclear Science Symp. and Medical Imaging Conference, Valencia, Spain, pp. 2557–2560 [Google Scholar]
- 43.Hudson M., Larkin R. 1994. Accelerated image reconstruction using ordered subsets of projection data. IEEE Trans. Med. Imaging 13, 601–609 10.1109/42.363108 (doi:10.1109/42.363108) [DOI] [PubMed] [Google Scholar]
- 44.Bugayevskiy L., Snyder J. 1995. Map projections: a reference manual. Bristol, PA: Taylor and Francis Inc [Google Scholar]


