

Abstract
The cell walls in plants are made up of just four basic building blocks: cellulose (the main structural fibre of the plant kingdom) hemicellulose, lignin and pectin. Although the microstructure of plant cell walls varies in different types of plants, broadly speaking, cellulose fibres reinforce a matrix of hemicellulose and either pectin or lignin. The cellular structure of plants varies too, from the largely honeycomb-like cells of wood to the closed-cell, liquid-filled foam-like parenchyma cells of apples and potatoes and to composites of these two cellular structures, as in arborescent palm stems. The arrangement of the four basic building blocks in plant cell walls and the variations in cellular structure give rise to a remarkably wide range of mechanical properties: Young's modulus varies from 0.3 MPa in parenchyma to 30 GPa in the densest palm, while the compressive strength varies from 0.3 MPa in parenchyma to over 300 MPa in dense palm. The moduli and compressive strength of plant materials span this entire range. This study reviews the composition and microstructure of the cell wall as well as the cellular structure in three plant materials (wood, parenchyma and arborescent palm stems) to explain the wide range in mechanical properties in plants as well as their remarkable mechanical efficiency.
Keywords: plant materials, mechanics, wood, parenchyma, palm stems
1. Introduction
The cell walls of plants are made up of just four basic building blocks: cellulose, hemicellulose, lignin and pectin. Cellulose is the main structural fibre in the plant kingdom and has remarkable mechanical properties for a polymer: its Young's modulus is roughly 130 GPa, and its tensile strength is close to 1 GPa. The properties of hemicellulose and lignin are similar to common engineering polymers: lignin, for instance, has a modulus of roughly 3 GPa and a strength of about 50 MPa. Broadly speaking, the cell walls of plants are made up of cellulose fibres reinforcing a matrix of hemicellulose and either lignin or pectin in one or more layers, with the volume fraction and orientation of the cellulose fibres varying in each layer. The geometrical structure of plant cells also varies, from the mostly honeycomb-like prismatic cells of wood to the foam-like polyhedra in the parenchyma cells of apples and potatoes.
The variations in the hierarchical microstructure of plants (the microstructure at different length scales, including the volume fraction of each of the basic building blocks, the cell wall microstructure and the cellular structure) give rise to a remarkably wide range of mechanical properties, illustrated in figure 1, which plots, on log–log scales, the strength against Young's modulus for three groups of plant materials: woods, parenchyma and arborescent palm stems. Young's modulus of parenchyma tissue is as low as 0.3 MPa, while that of the densest palm is 30 GPa, a factor that is 100 000 times higher. The strengths of parenchyma and the densest palm span from 0.3 to 300 MPa, a factor that is 1000 times higher. Interestingly, there are plants with moduli and strengths spanning nearly this entire range. Here, we explain how the microstructural arrangements of the four basic building blocks in wood, parenchyma and arborescent palm stems, arising from their different growth patterns, yield the enormous range in the modulus and strength of plants.
Figure 1.

Strength plotted against Young's modulus for selected plant materials. Note the large range in properties produced by varying the arrangement of the four building blocks (cellulose, lignin, hemicellulose and pectin) in the cell wall as well as the cellular structure. The properties of the cellulose and lignin are indicated in red. Adapted from Gibson et al. [1] with kind permission from Cambridge University Press. (Online version in colour.)
1.1. Basic building blocks
Cellulose is the main structural fibre in the plant kingdom. It is a long-chain polysaccharide made up of 7000–15 000 glucose monomer units, which are alternately rotated 180° (figure 2a). Cellulose molecules align to form microfibrils, diameter of about 3–4 nm [4–6]. The microfibrils have both crystalline and non-crystalline regions that merge together [6]. The cellulose microfibrils themselves are aligned and bound together into fibril aggregates (or macrofibrils), roughly 10–25 nm diameter, by a matrix of hemicellulose and either pectin or lignin [7,8] (figure 2b). Hemicelluloses are short chain, amorphous polysaccharides with 500–3000 monomer units with acidic groups [3,9]. They include xyloglucans, xylans, glucomannans and galactoglucomannans. Their composition and structure are discussed in detail by Ebringerova et al. [10]. Pectins are a group of polysaccharides rich in galacturonic acid units; for reviews on their composition and structure, see Ridley et al. [11] or Brejnholt [12]. Lignin is an amorphous, complex phenolic [2] compound; the biosynthesis and structure of lignin are reviewed in Boerjan et al. [13].
Figure 2.

The hierarchical structure of plant cell walls showing: (a) the molecular structure of cellulose, with glucose molecules alternately rotated 180° (solid line, covalent bonds; dashed line, hydrogen bonds); (b) cellulose microfibrils, with both crystalline and non-crystalline regions, aggregated into a macrofibril; (c) a macrofibril from a primary cell wall and (d) the cell wall of wood, made up of a primary layer and three secondary layers (S1, S2 and S3), with the cellulose microfibrils arranged in different orientations in each layer. Neighbouring cells are attached to each other by the middle lamella (not indicated) (a,b,d adapted from Gibson et al. [1], with kind permission from Cambridge University Press; based on Dinwoodie [2]; figure 2c is reproduced from Niklas [3] with kind permission from the University of Chicago Press).
Data for the density, Young's modulus and the strength of cellulose and lignin, and the modulus of hemicellulose are given in table 1; data for the density and strength of hemicellulose and for the properties of native pectin from plant cell wall are not available. Data for Young's modulus of cellulose have been obtained from X-ray diffraction measurements on unstrained and strained bleached ramie fibres [14–16]. Also included in table 1 is the theoretical estimate, from lattice dynamics modelling, for Young's modulus of crystalline cellulose along the chain axis [22]. Data for Young's moduli of hemicellulose and lignin have been obtained by isolating powders of each, compressing the powders into a compact in a mould and then performing unconfined compression tests [18–20]. Data for the tensile strength of cellulose are from tensile tests on bast fibres from hemp, jute, flax and ramie, which all have a high concentration of cellulose.
Table 1.
Mechanical properties of cellulose, lignin and hemicellulose.
1.2. Plant cell walls
Plant cell walls are secreted by the living protoplast of the cell, external to the plasma membrane that encloses the protoplast. The cell wall is composed of distinct layers, secreted sequentially by the protoplast such that the oldest layer is furthest from the plasma membrane and the youngest layer is closest. As a cell is growing, the primary cell wall layer, composed of cellulose fibres in a matrix of hemicellulose and pectin, is first secreted; hemicellulose binds to the surface of the cellulose microfibrils, while pectin cross-links the hemicellulose molecules of adjacent microfibrils (figure 2c). Glycoproteins, a minor constituent of the cell wall, are also thought to be involved in the cross-linking. During cell growth, enzymes reduce the yield strength of the primary cell walls, allowing significant deformation under the pressure within the cell. Once growth is complete, the stiffness and strength of the cell wall increases. Adjacent cells are bound together by the middle lamella, which is initially high in pectin. The above description of the plant cell wall follows that of Niklas [3]. A more detailed discussion of the synthesis of the primary cell wall is available in Fry [28].
After cell growth is complete, a number of additional processes may occur [3]. In some plant materials, such as wood and palms, additional secondary layers, with cellulose fibres in a matrix of lignin and hemicellulose, are deposited. The cellulose fibres are typically oriented at different angles in each secondary layer and the layers may differ in thickness. Lignification of the secondary cell wall layers increases their stiffness and strength compared with unlignified primary layers. In some mature plant cells, such as in wood, the protoplast itself may die, but the remaining cell walls continue to provide mechanical support, while the lumen allows transport of water and other nutrients. With age, both the middle lamella and the primary cell wall may become lignified and less distinct, so that the middle lamella and its two neighbouring primary cell walls are collectively known as the compound middle lamella. As an example of the structure of plant cell walls, a schematic of wood, showing the primary and secondary cell wall layers, is shown in figure 2d.
The orientation of the cellulose microfibrils in the cell wall gives rise to anisotropy in the mechanical properties of the cell wall. This has been studied extensively for woods, as a result of their commercial value in structural products, and is discussed in more detail in the section on woods.
1.3. Cellular structure of plant materials
Here, we use models for engineering cellular solids, such as honeycombs and foams, to describe the mechanical behaviour of plant materials. Engineering honeycombs and foams can now be fabricated from a wide range of materials, including polymers, metals, ceramics, glasses and composites. Honeycombs have prismatic cells, with the cell shape defined in the plane normal to the prism axis. The cells can be periodic (often hexagonal, but sometimes rectangular or triangular) or random (as in Voronoi honeycombs, generated by constructing the perpendicular bisectors between random seed points). Foams have polyhedral cells, typically without a repeating unit cell, although space-filling tetrakaidecahedra are sometimes used to model the cell structure in foams. Open-cell foams have solid only at the edges of the polyhedra, while closed-cell foams have solid membranes spanning the faces of the polyhedra.
Plant materials are made up of plant tissues, either simple tissues (made up of a single type of cell), or complex tissues (made up of different types of cells), each with their own structure. Apples and potatoes are examples of a simple tissue: parenchyma with thin-walled, polyhedral cells resembling an engineering closed-cell foam. Woods derive from complex plant tissues. Softwoods are made up of two types of cells: tracheids, which make up the bulk of the cells and have a roughly honeycomb-like structure, and parenchyma, which make up the rays and, in this case, have a box-like structure. Hardwoods are made up of three types of cells: fibres, vessels and parenchyma. The fibre cells provide structural support and have a honeycomb-like structure. The vessels are larger diameter tubes used for the transport of fluids and nutrients. And, in hardwoods, the parenchyma appear as box-like cells within the rays, as well as longer, tubular cells associated with the vessels. Arborescent palm stems consist of vascular bundles along with the ground tissue surrounding the vascular bundles (neglecting the outer epidermal layer). The cells within the vascular bundles are tubes with a honeycomb-like structure, while the ground tissue is made up of thin-walled, polyhedral parenchyma cells. Each of these plant materials (parenchyma, wood and arborescent palm stem) are described in more detail later, along with micrographs illustrating their cellular structure.
With this background on the basic building blocks, plant cell wall structure and cell structure, we now examine three plant materials—wood, parenchyma and arborescent palm stems—in more detail to describe how the basic building blocks are arranged in the cell wall in each case and how the cellular structure varies across different types of plants to give the wide range of mechanical properties seen in figure 1.
2. Wood
Trees increase in diameter as wood cells are added by the cambium, a dividing layer of cells at the periphery of the tree just inside the bark [2]. Outer cells in the cambial zone develop into bark, while inner cells differentiate into wood, with a layer of cambial cells remaining between the two. Over a period of about three weeks as the cells differentiate, they change shape and form the secondary cell wall; once secondary wall formation is complete, the cell dies. There are some variations in the density of cells within wood: for instance, in softwoods, the cells that form in the spring and early summer (earlywood) have thinner walls than those that form later in the season (latewood), giving rise to the well-known annual growth rings in trees.
The cellular structures of a representative softwood (cedar) and a hardwood (oak) are shown in figure 3. In softwoods, the bulk of the cells (85–95%) are highly elongated tracheids that provide both structural support and a conduction path for fluids (through small openings, called bordered pits, along their sides) [9]. In hardwoods, structural support is provided by fibre cells (which make up 35–70% of the wood), while fluid conduction is through vessels, enlarged cells with thin walls and large pore spaces (which make up 6–55% of the wood). Both softwoods and hardwoods have rays, made up of smaller, more rectangular parenchyma cells that store sugars; in softwoods, the rays make up 5–12% of the wood, while in hardwoods, they make up 10–32%. The relative densities of woods (the density of the wood divided by that of the solid cell wall) vary from about 0.05 for balsa to 0.88 for lignum vitae.
Figure 3.

Scanning electron micrographs of woods: (a) cedar, cross section; (b) cedar, longitudinal section; (c) oak, cross section; (d) oak, longitudinal section. Adapted from Gibson et al. [1] with kind permission from Cambridge University Press.
The cell walls in wood are made up of a primary layer, with cellulose fibrils randomly distributed in the plane of the layer, and three secondary layers, S1, S2 and S3, with cellulose fibrils helically wound in varying patterns in each of the three layers (figure 2d). The S2 layer accounts for most of the thickness of the cell wall; in Norway spruce (Pices abies), it makes up about 80 per cent of the cell wall, while the primary layer accounts for about 3 per cent, the S1 layer 10 per cent and the S3 layer 4 per cent [29]. The composition of the cell wall varies through the four layers, with the highest fraction of lignin in the primary layer and the highest fraction of cellulose in the S2 layer [9] (table 2).
Table 2.
Approximate composition of tracheid cell wall (by dry weight).
| cell wall layer | cellulose (%) | hemicellulose (%) | lignin (%) |
|---|---|---|---|
| primary | 15 | 15 | 70 |
| S1 | 28 | 27 | 45 |
| S2 | 45 | 35 | 20 |
| S3 | 47 | 38 | 15 |
Data from Bodig & Jayne [9].
In the S1 layer, the cellulose microfibrils are wound roughly circumferentially around the cell wall, nearly perpendicular to the longitudinal axis of the cells. While some studies have found a cross-fibrillar structure, with microfibrils wound in alternate left-handed and right-handed helices (for example, [30–33]), others have reported that the microfibrils were wound in a single helical orientation, although with variation from left- to right-handed orientations in different tracheids within the same tree [34–36]. The S2 layer is composed of roughly 45 per cent cellulose, 35 per cent hemicellulose and 20 per cent lignin [9], with the cellulose fibrils wound at a slight angle (the microfibrillar angle), typically 10–30° to the vertical [2]. The orientation of the cellulose microfibrils in the S3 layer remains unresolved. Some studies report a cross-fibrillar structure, with alternating left- and right-handed helices, while others find a single handedness of the helices (again, with different handedness in different cells from the same tree [36]; for a review, see Brandstom [37]).
As a result of the thickness of the S2 layer and the high volume fraction and alignment of cellulose fibrils, the mechanical properties of the cell wall in the longitudinal direction largely depend on those of the S2 layer. A higher microfibrillar angle in the S2 layer decreases the modulus and tensile strength of the cell wall; for instance, the longitudinal modulus of the cell wall measured in Pinus radiata decreased from roughly 45 GPa for a microfibrillar angle of 10° to 10 GPa for a microfibrillar angle of 40° [38]. Models for loading wood cell wall in the transverse direction indicate that the microfibrillar angle (in the S2 layer) has little effect on the transverse modulus; instead, the S1 layer contributes significantly, as a result of the circumferential orientation of the cellulose microfibrils, and the properties of the matrix constituents, especially hemicellulose, are more relevant [39]. Additional models of the mechanical properties of the wood cell wall are available in, for instance [40–45].
While the variations in the microfibrillar angle and details of the composite nature of the wood cell wall lead to some variations in its properties, as a rough approximation, they are similar across different species. Measured values for the density, Young's modulus and tensile yield strength of the solid cell wall material are summarized in table 3. The Young's modulus and tensile strength of the cell wall in the axial direction, along the grain, are measured to be up to 4.5 times those in the transverse direction, across the grain, reflecting the large fraction of the cell wall occupied by the S2 layer, the large volume fraction of cellulose in the S2 layer and the orientation of the cellulose microfibrils in the S2 layer of the cell wall. For loading along the grain, the compressive strengths of woods are roughly one-third of their tensile strengths [2]. The compressive strength of the cell wall material may also be lower than the tensile strength reported in table 3, but data to confirm this are unavailable.
Table 3.
Cell wall properties for wood.
| property | literature value | value inferred from figure 4 |
|---|---|---|
| density (ρs; kg m−3) | 1500 [2] | — |
| Young's modulus (axial, Es; GPa) | 35 [38]a, 28 [46]b, 25 [47]c | 35 |
| Young's modulus (transverse; GPa) | 10 [38]a | 9–19 |
| tensile yield strength (axial, σys; MPa) | 350 [38]a | |
| tensile yield strength (transverse; MPa) | 135 [38]a | |
| compressive strength (axial; MPa) | 120 | |
| compressive strength (transverse; MPa) | 50 |
aFrom tensile tests on 2 × 2 × 60 mm specimens.
bFrom cell walls loaded as cantilever beams using an atomic force microscope tip mounted on a micromanipulator.
cFrom tensile tests on single tracheids.
All ≤12% moisture content (2–5).
Data for the Young's modulus and compressive strength of woods, plotted against density are shown in figure 4. The Young's modulus and compressive strength along the grain vary roughly linearly with relative density, while those across the grain vary roughly with the square of relative density. The lower axis shows the density normalized by that of the cell wall (1500 kg m−3). That on the left-hand side shows the modulus normalized by Cave's [53] value for the axial modulus of the cell wall (Es = 35 GPa) or the strength normalized by Cave's [38] value for the axial strength of the cell wall in tension (σys = 350 MPa). The un-normalized data are shown on the remaining axes. The strength data for loading along the grain are from bending tests, while those for loading across the grain are from uniaxial compression tests. The small clear specimens (free of defects such as knots) used in these tests fail in compression in bending tests, as their compressive strength is about one-third of their tensile strength [2]. Compressive strength data from uniaxial compression tests are slightly lower than those from bending tests [51]. The data are for a moisture content of 12 per cent.
Figure 4.

(a) Young's modulus and (b) compressive strength of wood plotted against density. Data for loading across the grain are for loading in the radial or tangential directions; the direction of loading is not specified. Data from Goodman & Bodig [48,49] Bodig & Goodman [50]; Wood Handbook [51]; Dinwoodie [2]; Bodig & Jayne [9] and Easterling et al. [52]. Adapted from Gibson et al. [1], with kind permission from Cambridge University Press.
The cellular structure of wood can be modelled, to first-order, as a honeycomb with prismatic cells [52,54]. For loading along the grain, the cell walls compress axially and then fail by yield followed by either local plastic buckling or by fracture of the ends of the cells. As a result, both the Young's modulus, E*, and compressive strength, σ*, of wood along the grain depend linearly on the relative density, ρ*/ρs:
 |
2.1 |
and
 |
2.2 |
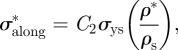
where Es and σys are the Young's modulus and the strength of the solid cell wall along the grain and properties with an asterisk refer to those of the cellular material, in this case, wood. The constant C2 = 0.34 is introduced to account for the difference in the measured value of tensile strength, σys = 350 MPa [38] and the value found from extrapolation of the data for the compressive strength of woods along the grain at a relative density of 1, corresponding to the fully dense solid cell wall, of 120 MPa (figure 4b). Note that the compressive strength of wood is roughly one-third its tensile strength; the factor of 0.34 may relate to the differences in tensile and compressive strength of the cell wall.
When loaded across the grain, the wood cell walls bend and, at sufficiently high loads, form plastic hinges. It is relatively straightforward to show, using models for honeycombs, that [52,54]:
 |
2.3 |
and
 |
2.4 |
The data for Young's moduli lie on a line closer to a slope of 2 than 3, with the data for loading in the tangential direction closer to a slope of 3 and those for loading in the radial direction closer to a slope of 2. When wood is loaded across the grain in the radial direction, the rays act as reinforcement that is loaded more axially rather than in bending, decreasing the slope to a value less than 3.
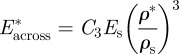
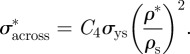
The modulus and compressive strength of the wood across the grain depend on those of the solid cell wall in the transverse direction. Extrapolation of the moduli data to a relative density of 1 gives the transverse Young's modulus for the cell wall in the range of 9–19 GPa, for the slopes of 2 and 3, respectively. Extrapolation of the strength data to a relative density of 1 gives the transverse strength of the cell wall equal to 50 MPa. In figure 4, the data have been normalized by literature values for the modulus and strength of the solid cell wall in the axial direction (35 GPa and 350 MPa, respectively) to allow a comparison of the normalized data along and across the grain. For the modulus, the constant C3 = 0.26–0.54 then incorporates the ratio of the transverse to axial cell wall modulus, as well as any differences between the measured cell wall modulus and the extrapolated value from figure 4 at a relative density of 1 (given in table 3). Similarly, for the yield strength, the constant C4 = 0.14 then incorporates the ratio of the transverse to axial cell wall strength, as well as any differences between the measured cell wall strength and the extrapolated value from figure 4 at a relative density of 1 (given in table 3).
The interplay between the influence of the fibre composite cell wall and the cellular structure of wood on modulus and compressive strength is shown in figure 5. The figure shows envelopes of modulus and strength for the basic building blocks (cellulose, lignin and hemicellulose), the cell wall and for a number of species of woods. The upper and lower bounds for the moduli and strength of composites made from them can be estimated to first-order by simple composites theory; they are plotted within the envelope bounded by the data for cellulose and lignin. The modulus and strength for the wood cell wall parallel to the grain are largely determined by the large volume fraction of cellulose microfibrils typically oriented 10–30° off the cell axis in the thick S2 layer, while those perpendicular to the grain depend more on the circumferentially oriented cellulose microfibrils in the S1 layer and the properties of the matrix, especially hemicellulose. The moduli and strength of the wood along the grain varies linearly with the density, while those across the grain vary roughly with the square of the density.
Figure 5.

(a) Young's modulus and (b) strength plotted against density for woods and their constituents. (a) Adapted from Gibson et al. [1] with kind permission from Cambridge University Press.
The great ranges in the moduli of woods (a factor of over 1000) and the strengths (a factor of over 100) arise primarily from their honeycomb-like structure. Loading along the grain results in axial deformation of the cell wall, giving rise to a linear dependence of modulus and strength on relative density. Loading across the grain results in bending of the cell wall giving rise to a roughly squared dependence of modulus and strength on relative density. The different mechanisms of deformation and failure for loading along and across the grain, along with the large range in relative densities of woods, from 0.05 to 0.88, then produces the large range of measured moduli and strengths. The fibre composite nature of the cell wall contributes relatively little in comparison, as the moduli and strength of the cell wall differ by a factor of less than 4.5 along and across the grain.
3. Parenchyma from fruits and root vegetables
Fruits such as apples and root vegetables such as potato tubers and carrots are largely made up of parenchyma tissue that stores sugars. The microstructures of carrot and potato tuber are shown in figure 6. The cells of parenchyma are polyhedral, with thin cell walls. The living protoplasm in the cell consists of water along with the organelles and molecules within it, surrounded by the plasma membrane which secretes the cell wall. In most parenchyma tissues, the cells are densely packed together: they can be thought of as a pressurized, liquid-filled closed-cell foam. As noted earlier, parenchyma cells with different structures also exist in woods (e.g. box-like parenchyma in the rays); here, we consider only parenchyma from fruits and root vegetables.
Figure 6.

Scanning electron micrographs of (a) carrot and (b) potato showing the relatively thin-walled cells. The ellipsoidal objects within the potato tissue are starch granules. Adapted from Gibson et al. [1], with kind permission from Cambridge University Press.
Measurements of cell dimensions for potato tuber parenchyma indicate that the average cell diameter is 212 μm (s.d. = 22 μm), the average edge length of a polyhedral cell face is 115 μm (s.d. = 47 μm) and average the cell wall thickness 1 μm (s.d. = 0.5 μm) [55]. Assuming a tetrakaidecahedral cell, the relative density or volume fraction of solid for the potato parenchyma can be estimated from these dimensions to be 0.010.
The thin cell walls in the parenchyma consist of only a primary layer; unlike woods, they lack lignified secondary wall layers. Within the cell wall, cellulose fibres reinforce a matrix of hemicellulose, pectin and glycoproteins [3], with pectin making up about one-third of the cell wall [56]. Micro-indentation tests on fresh, wet potato tuber parenchyma have been used to estimate the Young's modulus and tensile strength of the cell wall [57]. For the cell dimensions in the specimens studied by Hiller et al. as well as by Hepworth & Bruce [55], the Young's modulus of the cell wall, Es, is estimated to be 0.5–0.6 GPa. The tensile strength of the wall depends on the geometry of the deformed cell wall. Assuming a conical shape, Hiller et al. calculated a tensile strength of the wall of 114 MPa; using a more realistic parabaloid of revolution, with a sharper angle where the indenter meets the cell wall, gives a tensile strength of 60 MPa. This rough estimate suggests that the tensile strength, σys, of the potato tuber cell wall is in the range of 60–100 MPa.
Measured Young's moduli and compressive strengths of parenchyma from apple, potato and carrot are listed in table 4. The moduli range from 0.3 to 14 MPa, while the compressive strengths range from 0.25 to 1.3 MPa.
Table 4.
Elastic moduli and compressive strengths for parenchyma.
| plant material | Young's modulus, E* (MPa) | compressive strength,  (MPa) (MPa) |
reference |
|---|---|---|---|
| apple | 0.31–3.28a | 0.66 | [58] |
| apple | 2.8–5.8 | 0.25–0.37 | [59] |
| potato | 3.6 | 1.3 | [59] |
| potato | 3.5 | [60] | |
| potato | 5.5 | 0.27 | [57] |
| carrot | 2–14 | [61] |
aThe stress–strain curves from the study of Oye et al. [58] were nonlinear, with a long toe region, reflecting initial cell wall deformation by bending, followed by a linear portion, reflecting cell wall deformation by stretching. The average initial modulus was 0.31 MPa, while the average modulus at 80% of the failure stress was 3.28 MPa.
Data for fresh, wet tissue, at normal turgor.
At normal or high turgor pressures, the cell walls are taut, and deformation is dominated by stretching of the cell walls. The Young's modulus and strength of the parenchyma tissue are then directly proportional to its relative density [1]:
 |
3.1 |
and
 |
3.2 |
where the relative density is equivalent to the volume fraction of solids (i.e. is calculated without the protoplasm filling the cells). At low turgor pressure within the cell, the cell walls are no longer taut and initial deformation is by bending, giving a lower initial modulus. As deformation continues, the cell walls become taut and the slope of the stress–strain curve increases, reaching a value similar to the modulus of the tissue at normal or high turgor pressure.
There is sufficient information for potato tuber parenchyma to allow a comparison between the data of table 4 and the liquid-filled, closed-cell foam model (equations (3.1) and (3.2)). For a relative density of 0.01 [55], and with Es = 0.5–0.6 GPa and σys = 60–100 MPa [62], the model gives values of Young's modulus of potato parenchyma, E* = 5–6 MPa, and the compressive strength, σ* = 0.6–1.0 MPa, in good agreement with the measured values of E* = 3.5–5.5 MPa and σ* = 0.27–1.3 MPa.
4. Palm
Arborescent palms can grow to heights of 20–40 m, similar to many trees. Unlike trees, palms lack a cambium so that they cannot add cells at their periphery to increase their diameter: arborescent palm stems typically remain roughly constant in diameter throughout their lives. Instead, as the stem ages and grows taller, the increased load is resisted by increasing the thickness of the cell walls. Interestingly, palms do not do this uniformly throughout their cross section; instead, a radial density distribution develops, with denser tissue at the base and periphery of the stem, where the bending stresses on the stem are greatest.
The microstructure and mechanical properties of four species of palm have been studied in detail by Rich [63–65]. Micrographs of the cross sections of Iriartea gigantea reveal vascular bundles, with their cells aligned along the length of the stem, similar to a honeycomb, separated by ground tissue with more equiaxed parenchyma cells, similar to a closed-cell foam (figure 7a,b). The increased cell wall thickness in older vascular bundle tissue can be seen. The concentration of vascular bundles, as well as the concentration of fibres within the bundles, is greater at the periphery of the stem than in the central tissue. Cell wall thickening is also more pronounced in the peripheral tissue than in the central tissue. Higher magnification scanning electron micrographs of a different palm, Cocus nucifera, indicate that the thicker cell walls have additional secondary layers [66] (figure 7c,d).
Figure 7.

(a,b) Optical micrographs of cross sections of Iriartea gigantea showing the peripheral stem tissue of (a) a young individual and (b) an older individual. B denotes vascular bundle of honeycomb-like cells, including xylem (X) and phloem (P), which conduct water and sap; G denotes ground tissue, made up of polyhedral parenchyma cells, similar to a closed-cell foam. (c,d) Scanning electron micrographs of cross sections of coconut palm Cocus nucifera, showing cells near (c) the centre of the stem, with a primary layer and one secondary layer and (d) the periphery of the stem, with a primary cell wall and three or four secondary layers. (a,b) Adapted from Rich [64, figs 22 and 23], with kind permission of the Botanical Society of America Inc.; (c,d) Reprinted from Kuo-Huang et al. [66], fig. 1e,f, with kind permission of the International Association of Wood Anatomists (IAWA).
The radial density distribution at breast height as well as the vertical density distribution are shown in figure 8. There is a remarkable range in density within a single stem: the dry density of the Iriartea gigantea tissue varies from less than 100 to over 1000 kg m−3, spanning nearly the entire range of densities of all species of woods, from balsa (75 kg m−3) to lignum vitae (1300 kg m−3).
Figure 8.

Density plotted against (a) radial position (at breast height) and (b) against height above ground in the stem for a 19 m tall Welfia georgii and for a 17 m tall Iriartea gigantea. All adapted from Rich [65]. Filled triangles, peripheral wet; filled squares, central wet; open squares, peripheral dry; open triangles, central dry.
Data for the cell wall properties of palm are limited. The only available studies are those of Ruggeberg et al. [67,68], who performed tensile tests on small (120 μm × 80 μm × 3 mm), wet specimens taken at varying radial positions within vascular bundles of the Mexican fan palm, Washingtonia robusta. The Young's modulus of both the bulk tissue as well as the solid cell wall were calculated by normalizing the measured load by the cross-sectional area of the entire specimen and by that of the solid cell wall material, respectively. The bulk tissue Young's moduli ranged from roughly 20 MPa to 1.14 GPa, while the solid cell wall moduli ranged from 0.1 to 3.0 GPa, with the stiffest tissue corresponding to the highest cell wall modulus. The lowest tissue and cell wall moduli occurred at the periphery of the vascular bundle furthest away from the phloem, while the highest values occurred near the phloem. Staining for lignin revealed that the most lignified tissue was nearest the phloem, consistent with the higher measured values of cell wall modulus; lignification of the thinnest wall cells was negligible.
The lower value of the solid cell wall Young's modulus, 0.1 GPa, is similar to the cell wall modulus of potato tuber parenchyma, 0.5 GPa. The higher value of the solid cell wall modulus, 3 GPa, is substantially less than that of wood (Es = 35 GPa) with its primary and three secondary cell wall layers; one would expect the cell wall modulus to be lower if the wall had few secondary layers, with less aligned cellulose fibrils.
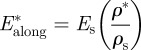
Measurements of the Young's modulus, E*, and bending strength (modulus of rupture), σ*, along the grain of fresh palm tissue indicate that (figure 9 and [65]):
| 4.1 |
and
| 4.2 |
where ρ* is the dry density of the specimen. The moduli range from 10 MPa to about 30 GPa and the bending strength from 0.3 to 300 MPa; both vary over three orders of magnitude. The values of moduli and strength at the lowest densities are similar to those for parenchyma tissue (table 4), reflecting their low relative density (about 0.03) and low cell wall properties associated with primary cell walls. Those for the highest densities are even greater than the properties of wood (figure 4). Ruggeberg's data for palm tissue moduli, from 20 MPa to 1.14 GPa, were at the lower range, for lower densities, of Rich's data.
Figure 9.
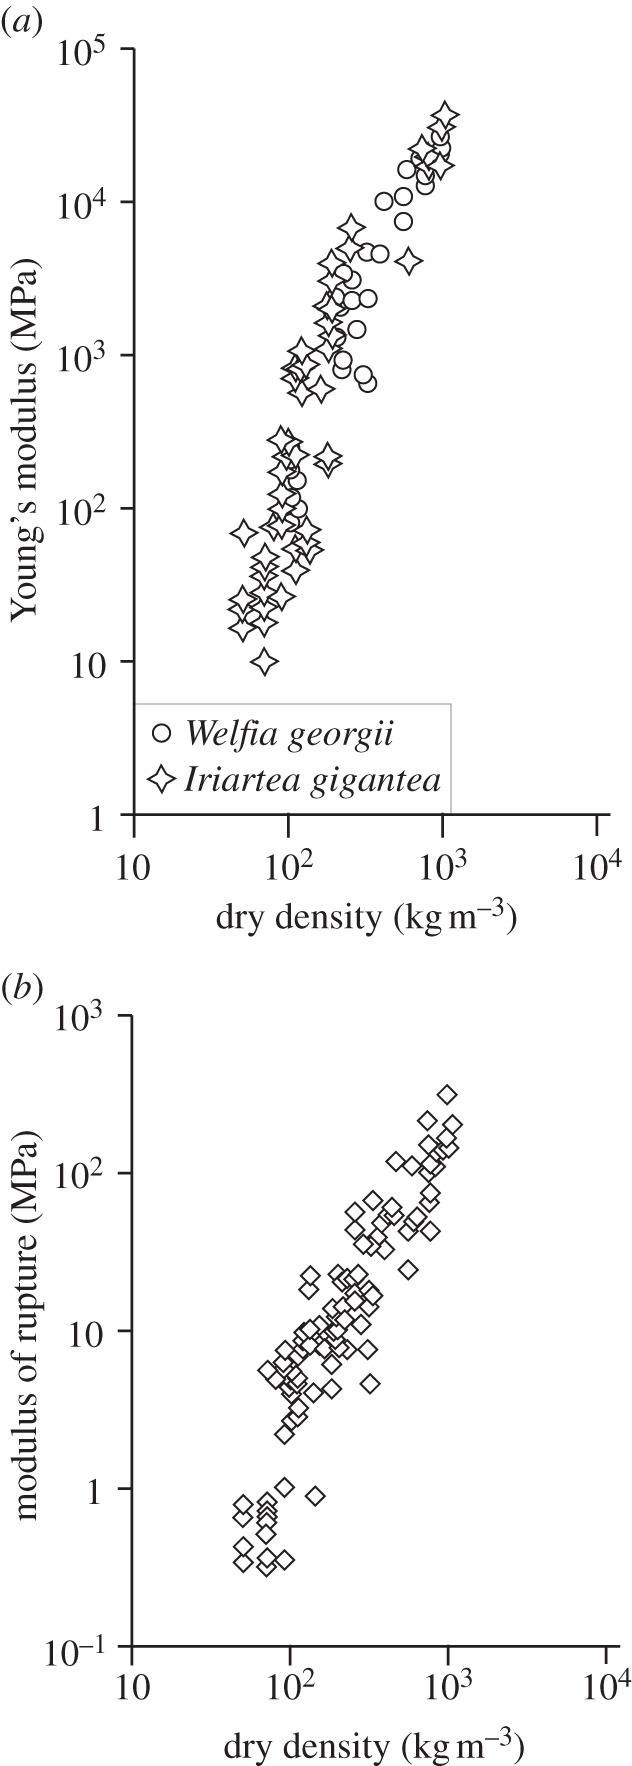
(a) Young's modulus and (b) modulus of rupture plotted against dry density for two species of palm, Welfia georgii and Iriartea gigantea. (b) Modulus of rupture plotted against dry density for six species of palm: W. georgii, I. gigantea, Socratea durissima, Euterpe macrospadix, Prestoea decurrens and Cryosophila albida. Adapted from Rich [65].
Palm stems have both vascular bundles, with a honeycomb-like structure, similar to wood, and parenchyma, with foam-like cells. The data in figure 9, from Rich's [65] study, are based on beam bending tests of 10 × 10 × 700 mm samples of palm tissue that include numerous vascular bundles as well as parenchyma. Under loading along the grain, both the vascular bundles and the parenchyma cells deform axially, so that the model indicates that tissue modulus is simply
 |
4.3 |
where Es is the Young's modulus of the solid cell wall at the density, ρ*, of the palm tissue and ρs is the density of the solid cell wall. (Unlike wood and parenchyma, the solid cell wall properties vary as the number of layers in the cell wall and the density of the tissue increases.) Note that for axial loading and deformation of the cell walls, the modulus of a honeycomb material depends only on the relative density and is independent of the details of the cell cross-sectional shape (so that, for instance, hexagonal honeycombs of different shapes all follow equation (4.3)).
The lowest density material tested in Rich's [65] study was roughly 50–100 kg m−3, with tissue moduli, E*, ranging from 10 to 300 MPa. Vascular bundle tissue of similar modulus in the Ruggeberg et al. [67] study had a solid cell wall modulus, Es, between 0.1 and 2.1 GPa, within a single vascular bundle. Using these values for Es, along with the tissue density of 50–100 kg m−3 and a solid density, ρs = 1500 kg m−3, the model gives a value of the tissue modulus, E* = 3–140 MPa, close to the measured range in Rich's data. Specimens with a density of 100–300 kg m−3 in Rich's [65] study had a tissue modulus of roughly 50 MPa–3 GPa. Specimens with a tissue modulus of about 1 GPa in Ruggeberg et al. [68] study had a solid cell wall modulus Es of 2.5 GPa. In this case, the tissue modulus estimated from the model is 170–500 MPa, in the middle of the range measured by Rich [65]. One of the limitations of these estimates is that Rich [65] and Ruggeberg et al. [67,68] studied different species of palms and used different testing methods. Rich's data for the Young's modulus of two species, Welfia georgii and Iriartea gigantea, overlap, suggesting that at least for these two species, the tissue moduli are similar over the same range of densities. There are no measurements of the solid cell wall modulus for higher density palm tissue nor any measurements of solid cell wall strength.
The modulus data for palm give values of E* of roughly 30 GPa at a density of 1000 kg m−3 (figure 9a). Extrapolating linearly, corresponding to axial cell wall deformation and assuming that there is little change in the solid cell wall properties at higher densities, to fully dense material (at about 1500 kg m−3), gives a solid cell wall modulus of Es = 45 GPa, somewhat higher than wood (35 GPa) and bamboo (35–40 GPa, based on linear extrapolation of tensile test data of Nogata & Takahashi [69]). The high value of Es for palm reflects the additional secondary layers in the cell wall of the densest tissue. Similarly, a linear extrapolation of strength from 300 MPa at a density of 1000 kg m−3 gives the solid cell wall strength of σys = 450 MPa, between that of wood (120–350 MPa; table 1) and bamboo (800 MPa; [69]).
This rather simple analysis shows how the large range of density of palm tissue (from 50 to 1000 kg m−3) and of modulus of the solid cell wall material (from 0.1 to 45 GPa) give rise to the remarkable range of modulus in palm tissue, which spans over three orders of magnitude. The range in density arises from the variation in the number of layers within the cell wall, while the range in the solid cell wall modulus also depends on the degree of lignification of the various layers and the orientation of the cellulose fibrils within each layer. While there are no measurements of the strength of the solid cell wall in palm, we expect a similar variation, giving rise to the large range in measured tissue strength.
5. Discussion
5.1. Mechanical properties
The three plant materials described in this study have exceptionally large ranges of mechanical properties: Young's moduli span from 0.3 MPa to 30 GPa, while the compressive strengths span from about 0.3 to 300 MPa. These large ranges arise from the composition of the cell wall, the number of layers in the cell wall and the volume fraction and arrangement of cellulose fibres in those layers, as well as the cellular structure of the plant tissue. The composition, the structure and properties of the cell wall and the cellular structure of wood, parenchyma and arborescent palm are summarized in figure 10.
Figure 10.

A comparison of the cell wall and cellular structure of wood, parenchyma and arborescent palm stem. Left: the cell wall composition, microstructure, modulus and strength. Centre: schematic showing the structure of each plant material. Right: plant cellular microstructure, and ranges of density, relative density, modulus and strength. Top and centre schematics from Gibson et al. [1], with kind permission from Cambridge University Press.
Wood cells form and grow at the cambium layer under the bark. Within a few weeks of cell division, the cells have reached their mature dimensions and three secondary layers are laid down and lignified. The mechanical properties of the cell wall in the axial direction, which are roughly constant across species, are largely determined by the middle secondary layer, which makes up most of the cell wall (approx. 85%) and has roughly 50 per cent cellulose fibres aligned close to the vertical axis of the cell (10–30° off vertical). Wood tissue has a honeycomb-like structure, with densities ranging from about 75 kg m−3 for low-density balsa to 1300 kg m−3 for the densest wood, lignum vitae. Models for the mechanical behaviour of honeycombs indicate that for loading along the grain, the cell walls deform axially and the modulus and strength vary linearly with relative density, while for loading across the grain, the cell walls bend, and the modulus and strength vary with the cube and square of density, respectively. The large range of density, as well as the different mechanisms of deformation and failure along and across the grain, give rise to the wide range in modulus and strength of wood.
In parenchyma cells in fruits such as apples and root vegetables such as carrots and potatoes, the walls have only a primary layer, with randomly distributed cellulose fibres reinforcing a matrix of hemicellulose, pectin and glycoproteins. The cell wall modulus is much lower than that of wood, owing to the lack of lignification, while the cell wall strength is similar, reflecting the role of the cellulose fibres. Parenchyma tissue has roughly equiaxed, polyhedral cells that can be modelled as a liquid-filled closed-cell foam. The cell walls in parenchyma are thin, relative to their length, giving low relative densities, of the order of 1 per cent. Models for liquid-filled closed-cell foams indicate that at normal or high turgor pressures, the cell walls are taut and deform axially, leading to a linear dependence of modulus and strength on relative density. The low modulus of the cell wall, combined with the low relative density, gives rise to low tissue moduli, a few MPa. The tissue modulus and strength are both well described by the model.
Palm tissue is made up of honeycomb-like vascular bundles surrounded by ground tissue. The vascular bundles have honeycomb-like prismatic cells and dense fibres aligned along the length of the stem, while the ground tissue is made up of thin-walled, polyhedral parenchyma. Palms lack a cambium and so cannot increase their radius by cell division at the cambial layer, as woods do. Instead, as the palm stem increases in height, additional layers are added to the cell walls in the vascular bundles, increasing their density and mechanical properties. Within a single palm stem, there is a density gradient that can be as great as from 60 to 1000 kg m−3, with denser material towards the base and periphery of the stem. The cell wall moduli of palm tissue varies from 0.1 to 45 GPa, with the lower value reflecting the parenchymal tissue with only an unlignified primary layer and the higher value reflecting the modulus of the vascular bundles, with four or more lignified secondary layers with highly aligned cellulose fibres in at least some of those layers. The strength of the cell wall is estimated to be similar to that of parenchyma for the ground tissue (60–100 MPa) and 450 MPa for the densest tissue. The combination of low cell wall properties and low relative density of the parenchyma leads to low tissue modulus and strength (E* < 0.1 GPa, σ* < 10 MPa), while the combination of high cell wall properties and high relative density of the vascular bundles gives rise to high mechanical properties (E* ∼ 30 GPa, σ* ∼ 300 MPa). The range of cell wall properties and densities within a single palm stem produces the vast range in modulus and strength of palm tissue.
5.2. Mechanical efficiency
The composition, cell wall structure and cellular structure of wood, parenchyma and arborescent palm stems give rise to remarkable mechanical performance in plants for their mass.
The trunks and branches of trees are loaded primarily in bending (from the wind or their self-weight). For a beam of given stiffness, span and cross-sectional dimensions, the material that minimizes the weight of a beam is that with the maximum value of E1/2/ρ [70]. For the composite wood cell wall, Es = 35 GPa and ρs = 1.5 Mg m−3, giving a value of  = 3.94 GPa1/2 m3 Mg−1. The performance index of woods (for loading along the grain, as is the case in the tree) can be related to that of the solid cell wall material, using equation (2.1):
 |
5.1 |
Wood has a value of E1/2/ρ that is higher than that of the solid it is made from, by a factor of (ρs/ρ*)1/2. For a typical softwood, such as pine, with a relative density of 0.33, E*1/2/ρ* ∼ 7 GPa1/2 m3 Mg−1, close to that of the best engineering materials, uniaxially aligned carbon fibre reinforced composites (E1/2/ρ ∼ 8.5). Similarly, for a beam of a given strength, span and cross-sectional dimensions, the material that minimizes the weight is that with the maximum value of σ2/3/ρ. Again, woods have values of σ*2/3/ρ* for loading along the grain that are higher than that of the solid cell wall, by a factor of (ρs/ρ*)1/3 (from rearranging equation (2.2)). For loading along the grain, woods have values of σ*2/3/ρ* (approx. 45 MPa2/3 m3 Mg−1) that are comparable to those of engineering composites (approx. 65 MPa2/3 m3 Mg−1). The performance of woods compared with that of engineering materials is illustrated in figure 11.
Figure 11.

(a) Young's modulus–density chart for engineering materials, including woods. The performance index E1/2/ρ gives the performance of a material for resisting bending deflections: every point on a single line E1/2/ρ has the same value of E1/2/ρ. As the line moves to the upper left, the value of E1/2/ρ increases. Woods loaded along the grain have comparable values to the best engineering materials, fibre composites (adapted from figure from MF Ashby, with permission). (b) Strength–density chart for engineering materials, including woods. The performance index σ2/3/ρ gives the performance of a material for resisting bending stresses: every point on a single line σ2/3/ρ has the same value of σ2/3/ρ . As the line moves to the upper left, the value of σ2/3/ρ increases. Woods loaded along the grain have comparable values to the best engineering materials, fibre composites. Adapted from figure from Ashby, with permission. (Online version in colour.)
While the circular cross section of tree trunks and branches allows them to resist loading equally in all directions and to accommodate growth through the circumferential layer of cambium beneath the bark, it is not a highly efficient cross section for resisting bending. Engineering materials can be fabricated in more efficient shapes (e.g. a circular tube), further increasing the performance of engineered components.
In parenchyma cells, the low properties of the cell wall (Es ∼ 0.5 GPa; σs ∼ 60 MPa) and low relative density (ρ*/ρs ∼ 0.01) combine to give low mechanical properties (E* = 3–6 MPa; σ* = 0.27–1.3 MPa). In spite of their low mechanical properties, parenchyma tissue can contribute to the mechanical efficiency of plants. For instance, the leaves of monocotyledon plants, such as grasses, irises and maize, have a foam-like core of parenchyma separating two fibre-composite-like faces, with dense, stiff, strong sclerenchyma fibres embedded in a matrix of cuticle cells (figure 12). The leaves behave mechanically like an engineering sandwich beam: the separation of the faces by the lightweight core increases the moment of inertia of the beam with little increase in weight, making them efficient in resisting bending, the primary mode of loading in monocotyledon leaves. Studies of iris leaves [71]; reanalysed in Gibson et al. [1]) and maize leaves [72] indicate that they do, indeed, behave mechanically like efficient sandwich beams.
Figure 12.

Scanning electron micrograph of the iris leaf, showing the core of foam-like parenchyma tissue and the outer faces of dense sclerenchyma fibres in a matrix of cuticle (reproduced from Gibson et al. [71], with kind permission of Springer).
The radial density gradient in arborescent palm stems also leads to mechanical efficiencies [1]. For I. gigantea, the density data in figure 8a can be shown to follow:
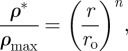 |
5.2 |
where ρ* is the dry density of the palm tissue at radius, r, ρmax is the maximum dry density of the palm tissue in that cross section, r is the radial distance from the centre of the stem, ro is the outer radius of the stem and n is a constant. The moduli, E*, and bending strength, σ*, data in figure 9 can be described by
 |
5.3 |
and
 |
5.4 |
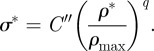
The exponents n, m and q in equations (5.2) to (5.4) vary slightly for different species of palm: for I. giantea, n = 2, m = 2.5 and q = 2 [66]. C′ and C″ are constants.
The flexural rigidity for the palm stem, with the radial density gradient, is then
| 5.5 |
The flexural rigidity for a cross section of the same radius and mass, with uniform density across the section, is
 |
5.6 |
For I. gigantea, we find that the cross section with the radial density gradient is about 2.5 times as stiff in bending as the equivalent section with uniform density. A similar analysis for another species of palm, W. georgii, shows that the cross section with the radial density gradient is about 1.6 times as stiff in bending as the equivalent section with uniform density.
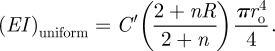
The radial density distribution also gives rise to a nonlinear bending stress distribution in the palm stem, under loading in the linear elastic regime. The bending stress, σ, is
| 5.7 |
where r is the distance from the neutral axis, E* is Young's modulus of the palm tissue at r, ε is strain and κ is the curvature of the section. Substituting equation (5.2) and (5.3) gives
| 5.8 |
or, for I. gigantea, with m = 2.5 and n = 2, the normal bending stress varies as r6. The bending strength, or modulus of rupture, varies as r4 (equation (5.4)). A plot of the radial distribution of bending stress and bending strength is shown in figure 13: the radial distribution of bending strength closely matches that of bending stress, making efficient use of the material.
Figure 13.
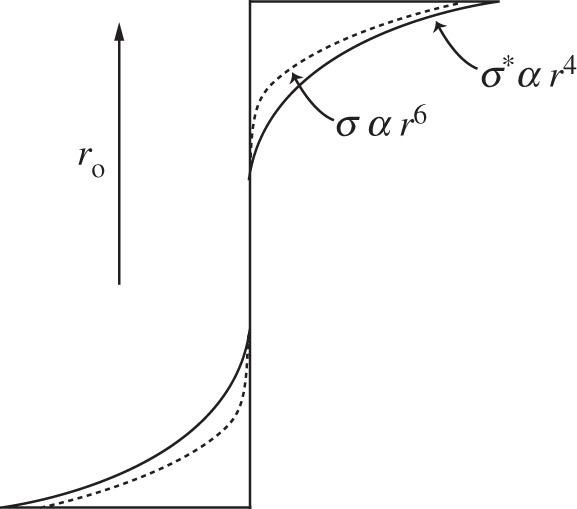
The distribution of bending stress, σ (dashed line) and bending strength, σ* (solid line) in the arborescent palm stem, Iriartea gigantea, with its radial density gradient. The strength of the palm tissue closely matches the stress distribution (adapted from Gibson et al. [1] with kind permission from Cambridge University Press).
5.3. Biomimicking of plant materials
Plant materials achieve their remarkably large range of moduli and strength from just four basic constituents by varying:
— the volume fraction of each of the four basic building blocks within the cell wall;
— the bonding between the cellulose fibrils and the matrix;
— the orientation of the cellulose microfibrils within various layers in the plant cell wall (from random in the primary wall in wood to uniaxial at a microfibrillar angle of 10–40° in the S2 layer in wood);
— the cellular structure (from honeycomb-like to foam-like);
— the relative density of the cellular structure (from 0.01 in potato parenchyma to 0.88 in lignum vitae);
— the volume fraction of different tissues (e.g. vascular bundles and ground tissue in palm); and
— the density distribution of the plant material (from roughly uniform in wood to the radial density distribution in arborescent palm stem).
Typical length scales of the microstructures at the different levels of hierarchy are of the order of:
— cellulose molecule (approx. 1 nm);
— cellulose microfibril (approx. 4 nm × 20–30 nm);
— cell wall layer thickness (approx. 100 nm);
— total cell wall thickness (approx. 1 μm);
— cell dimension (approx. 200 μm in polyhedral parenchyma cells in apples and potatoes; 20 μm × 1–2 mm in tracheids in softwoods); and
— tissue dimensions (approx. mm for the vascular bundles in palm).
In contrast to plants, engineers have developed a vast array of materials, from soft elastomers to stiff, strong alloys. Composites have been reinforced with carbon fibres, and, more recently, with carbon nanotubes. Engineering honeycombs, typically with cell sizes on the order of millimetres, can be made with composite cell walls. But we are not yet able to fabricate fibre composite laminates 1 μm in total thickness, similar to plant cell walls, and then to form these into cellular materials. Periodic metal lattices with tubular struts, having strut lengths on the order of a few millimetres, strut diameters on the order of hundreds of micrometres, strut thicknesses on the order of 100 nm and relative densities as low as 0.01 per cent have recently been fabricated [73]. But engineers have yet to achieve the microstructural control of composite, and cellular structures at multiple length scales, from nanometres to millimetres, exhibited by plant materials. Combining such microstructural control with the large menu of current engineering materials could lead to low-density materials with mechanical properties that are currently unavailable.
6. Summary
The examples of wood, parenchyma and arborescent palm tissue demonstrate how the four basic building blocks in plants (cellulose, hemicellulose, lignin and pectin) are arranged to give an exceptionally wide range of modulus and strength in plant tissues. Trees and leaves of monocotyledon plants and arborescent palms have all developed remarkable strategies for efficiently resisting bending, their main mode of loading: wood has values of the bending performance indices, E1/2/ρ and σ2/3/ρ, comparable to engineering fibre composites; monocotyledon leaves are sandwich beams, with a core of low-density parenchyma tissue separating dense, stiff strong sclerenchyma fibres in the outer faces; and palm tissue has a radial density gradient that increases the flexural rigidity of the cross section of the palm stem by a factor of roughly 2, compared with that of a section of uniform density. The study of plant materials may lead to further insights into the design of engineering materials and structures.
Acknowledgements
I am grateful for helpful discussions with Profs Michael Ashby of Cambridge University, Jacques Dumais of Harvard University and Karl Niklas of Cornell University. The reviewers provided helpful comments that improved the paper. Prof. Mike Ashby kindly provided material selection charts that were slightly modified to produce figures 1 and 11 and Prof. Karl Niklas kindly provided figure 2c. Don Galler took the scanning electron micrographs in figure 6 and Beth Beighlie skillfully assisted in the preparation of the figures. It is a pleasure to acknowledge all their contributions. This project was supported financially by the Matoula S. Salapatas Professorship in Materials Science and Engineering, which is deeply appreciated.
References
- 1.Gibson L. J., Ashby M. F., Harley B. A. 2010. Cellular materials in nature and medicine. Cambridge, UK: Cambridge University Press [Google Scholar]
- 2.Dinwoodie J. M. 1981. Timber: its nature and behaviour. New York, NY: Van Nostrand Reinhold [Google Scholar]
- 3.Niklas K. J. 1992. Plant biomechanics. Chicago, IL: University of Chicago Press [Google Scholar]
- 4.Hori R., Muller M., Watanabe U., Lichtenegger H. C., Fratzl P., Sugiyama J. 2002. The importance of seasonal differences in the cellulose microfibril angle in softwoods in determining acoustic properties. J. Mater. Sci. 37, 4279–4284 10.1023/A:1020688132345 (doi:10.1023/A:1020688132345) [DOI] [Google Scholar]
- 5.Peura M., Muller M., Vainio U., Saren M.-P., Saranpaa P., Serimaa R. 2008. X-ray microdiffraction reveals the orientation of cellulose microfibrils and the size of cellulose crystallites in single Norway spruce tracheids. Trees 22, 49–61 10.1007/s00468-007-0168-5 (doi:10.1007/s00468-007-0168-5) [DOI] [Google Scholar]
- 6.Fernandes A. N., Thomas L. H., Altaner C. M., Callow P., Forsyth V. T., Apperley D. C., Kennedy C. J., Jarvis M. C. 2011. Nanostructure of cellulose microfibrils in spruce wood. Proc. Natl Acad. Sci. USA 108, E1195–E1203 10.1073/pnas.1108942108 (doi:10.1073/pnas.1108942108) [DOI] [PMC free article] [PubMed] [Google Scholar]
- 7.Fahlen J., Salmen L. 2003. Cross-sectional structure of the secondary wall of wood fibers as affected by processing. J. Mater. Sci. 38, 119–126 10.1023/A:1021174118468 (doi:10.1023/A:1021174118468) [DOI] [Google Scholar]
- 8.Donaldson L. 2007. Cellulose microfibril aggregates and their size variation with cell wall type. Wood Sci. Technol. 41, 443–460 10.1007/s00226-006-0121-6 (doi:10.1007/s00226-006-0121-6) [DOI] [Google Scholar]
- 9.Bodig J., Jayne B. A. 1982. Mechanics of wood and wood composites. New York, NY: Van Nostrand Reinhold [Google Scholar]
- 10.Ebringerova A., Hromadkova Z., Heinze T. 2005. Hemicellulose. Adv. Polym. Sci. 186, 1–67 10.1007/b136816 (doi:10.1007/b136816) [DOI] [Google Scholar]
- 11.Ridley B. L., O'Neill M. A., Mohnen D. A. 2001. Pectins: structure, biosynthesis and oligogalacturonide-related signaling. Phytochemistry 57, 929–967 10.1016/S0031-9422(01)00113-3 (doi:10.1016/S0031-9422(01)00113-3) [DOI] [PubMed] [Google Scholar]
- 12.Brejnholt S. M. 2010. Pectin. In Food stabilizers, thickeners and gelling agents (ed. Imerson A.). Oxford, UK: John Wiley and Sons [Google Scholar]
- 13.Boerjan W., Ralph J., Baucher M. 2003. Lignin biosynthesis. Annu. Rev. Plant Biol. 54, 519–546 10.1146/annurev.arplant.54.031902.134938 (doi:10.1146/annurev.arplant.54.031902.134938) [DOI] [PubMed] [Google Scholar]
- 14.Sakurada I., Nukushina Y., Ito T. 1962. Experimental determination of the elastic modulus of crystalline regions in oriented polymers. J. Polym. Sci. 57, 651–660 10.1002/pol.1962.1205716551 (doi:10.1002/pol.1962.1205716551) [DOI] [Google Scholar]
- 15.Sakurada I., Ito T., Nakamae K. 1966. Elastic moduli of the crystal lattices of polymers. J. Polym. Sci. C Polym. Symp. 15, 75–90 [Google Scholar]
- 16.Sakurada I., Kaji K. 1970. Relation between the polymer conformation and the elastic modulus of the crystalline region of polymer. J. Polym. Sci. Polym. Symp. 31, 57–76 10.1002/polc.5070310108 (doi:10.1002/polc.5070310108) [DOI] [Google Scholar]
- 17.Matsuo M., Sawatari C. 1989. Crystal lattice moduli of cellulose I and II estimated in relation to molecular orientation. Polym. Prepr. Jpn. 38, 980 [Google Scholar]
- 18.Cousins W. J., Armstrong R. W., Robinson W. H. 1975. Young's modulus of lignin from a continuous indentation test. J. Mater. Sci. 10, 1655–1658 10.1007/BF00554925 (doi:10.1007/BF00554925) [DOI] [Google Scholar]
- 19.Cousins W. J. 1976. Elastic modulus of lignin as related to moisture content. Wood Sci. Technol. 10, 9–17 10.1007/BF00376380 (doi:10.1007/BF00376380) [DOI] [Google Scholar]
- 20.Cousins W. J. 1978. Young's modulus of hemicellulose as related to moisture content. Wood Sci. Technol. 12, 161–167 10.1007/BF00372862 (doi:10.1007/BF00372862) [DOI] [Google Scholar]
- 21.2008. Granta Design. CES Selector (materials database software)
- 22.Tashiro K., Kobayashi M. 1991. Theoretical evaluation of three-dimensional elastic constants of native and regenerated celluloses: role of hydrogen bonds. Polymer 32, 1516–1526 10.1016/0032-3861(91)90435-L (doi:10.1016/0032-3861(91)90435-L) [DOI] [Google Scholar]
- 23.Wainwright S. A., Biggs W. D., Currey J. D., Gosline J. M. 1976. Mechanical design in organisms. Princeton, NJ: Princeton University Press [Google Scholar]
- 24.Vogel S. 2003. Comparative biomechanics: life's physical world. Princeton, NJ: Princeton University Press [Google Scholar]
- 25.2011. Granta Design. CES Selector (materials database software)
- 26.Hofstetter K., Hellmich C., Eberhardsteiner J., Mang H. A. 2008. Micromechanical estimates for elastic limit states in wood materials, revealing nanostructural failure mechanisms. Mech. Adv. Mater. Struct. 15, 474–484 10.1080/15376490802142387 (doi:10.1080/15376490802142387) [DOI] [Google Scholar]
- 27.Bader T. K., Hofstetter K., Hellmich C., Eberhardsteiner J. 2010. Poromechanical scale transitions of failure stresses in wood: from lignin to the spruce level. Z. Angew. Math. Mech. 90, 750–767 10.1002/zamm.201000045 (doi:10.1002/zamm.201000045) [DOI] [Google Scholar]
- 28.Fry S. C. 2004. Primary cell wall metabolism: tracking the careers of wall polymers in living plant cells. New Phytol. 161, 641–675 10.1111/j.1469-8137.2004.00980.x (doi:10.1111/j.1469-8137.2004.00980.x) [DOI] [PubMed] [Google Scholar]
- 29.Fengel D., Stoll M. 1973. Variation in the cell cross-sectional area, cell-wall thickness and wall layers of spruce tracheids within an annual ring. Holzforschung 27, 1–7 10.1515/hfsg.1973.27.1.1 (doi:10.1515/hfsg.1973.27.1.1) [DOI] [Google Scholar]
- 30.Dunning C. E. 1969. The structure of longleaf pine latewood. I cell-wall morphology and the effect of alkaline extraction. TAPPI J. 52, 1326–1335 [Google Scholar]
- 31.Tang R. C. 1973. The microfibrillar orientation in cell-wall layers of Virginia pine tracheids. Wood Fiber Sci. 5, 181–86 [Google Scholar]
- 32.Abe H., Ohtani J., Fukazawa K. 1991. FE-SEM observations on the microfibrillar orientation in the secondary wall of tracheids. IAWA Bull. New Ser. 12, 431–438 [Google Scholar]
- 33.Kataoka Y., Saiki H., Fujita M. 1992. Arrangement and superposition of cellulose microfibrils in the secondary walls of coniferous tracheids. Mokuzai Gakkaishi 38, 327–335 [Google Scholar]
- 34.Meier H. 1955. Uber den Zellwandabbau durch Holzvermorschungspilze und die submikrosckopische Struktur von Fichtentracheiden und Birkenholzfasern. Holz Roh Werkst. 13, 323–338 10.1007/BF02609052 (doi:10.1007/BF02609052) [DOI] [Google Scholar]
- 35.Khalili S., Nilsson T., Daniel G. 2001. The use of soft rot fungi for determining the microfibrillar orientation in the S2 layer of pine tracheids. Holz. Roh. Werkst. 58, 439–447 10.1007/s001070050458 (doi:10.1007/s001070050458) [DOI] [Google Scholar]
- 36.Donaldson L., Xu P. 2005. Microfibril orientation across the secondary cell wall of Radiata pine tracheids. Trees 19, 644–653 10.1007/s00468-005-0428-1 (doi:10.1007/s00468-005-0428-1) [DOI] [Google Scholar]
- 37.Brandstom J. 2001. Micro- and ultrastructural aspects of Norway spruce tracheids: a review. IAWA J. 22, 333–353 [Google Scholar]
- 38.Cave I. D. 1969. Longitudinal Young's modulus of Pinus radiata. Wood Sci. Technol. 3, 40–48 10.1007/BF00349983 (doi:10.1007/BF00349983) [DOI] [Google Scholar]
- 39.Bergander A., Salmen L. 2002. Cell wall properties and their effects on the mechanical properties of fibers. J. Mater. Sci. 37, 151–156 10.1023/A:1013115925679 (doi:10.1023/A:1013115925679) [DOI] [Google Scholar]
- 40.Yamamoto H., Kojima Y., Okuyama T., Abasolo W. P., Gril J. 2002. Origin of the biomechanical properties of wood related to the fine structure of the multi-layered cell wall. J. Biomech. Eng. 124, 432–440 10.1115/1.1485751 (doi:10.1115/1.1485751) [DOI] [PubMed] [Google Scholar]
- 41.Fratzl P., Burgert I., Keckes J. 2004. Mechanical model for the deformation of the wood cell wall. Zeitschrift Metallkunde 95, 579–584 [Google Scholar]
- 42.Hofstetter K., Hellmich C., Eberhardsteiner J. 2005. Development and experimental validation of a continuum micromechanics model for the elasticity of wood. Eur. J. Mech. A Solids 24, 1030–1053 10.1016/j.euromechsol.2005.05.006 (doi:10.1016/j.euromechsol.2005.05.006) [DOI] [Google Scholar]
- 43.Fratzl P., Weinkame R. 2007. Nature's hierarchical materials. Prog. Mater. Sci. 52, 1263–1334 10.1016/j.pmatsci.2007.06.001 (doi:10.1016/j.pmatsci.2007.06.001) [DOI] [Google Scholar]
- 44.Neagu R. C., Gamstedt E. K. 2007. Modelling of effects of ultrastructural morphology on the hygroelastic properties of wood fibers. J. Mater. Sci. 42, 10 254–10 274 10.1007/s10853-006-1199-9 (doi:10.1007/s10853-006-1199-9) [DOI] [Google Scholar]
- 45.Bader T. K., Hofstetter K., Hellmich C., Eberhardsteiner J. 2011. The poroelastic role of water in cell walls of the hierarchical composite ‘softwood’. Acta Mech. 217, 75–100 10.1007/s00707-010-0368-8 (doi:10.1007/s00707-010-0368-8) [DOI] [Google Scholar]
- 46.Orso A., Wegst U. G. K., Arzt E. 2006. The elastic modulus of spruce wood cell wall material measured by an in situ bending technique. J. Mater. Sci. 41, 5122–5126 10.1007/s10853-006-0072-1 (doi:10.1007/s10853-006-0072-1) [DOI] [Google Scholar]
- 47.Gierlinger N., Schwanninger M., Reinecke A., Burgert I. 2006. Molecular changes during tensile deformation of single wood fibers followed by Raman spectroscopy. Biomacromolecules 7, 2077–2081 10.1021/bm060236g (doi:10.1021/bm060236g) [DOI] [PubMed] [Google Scholar]
- 48.Goodman J. R., Bodig J. 1970. Orthotropic elastic properties of wood. J. Struct. Div. ASCE ST11, 2301–2329 [Google Scholar]
- 49.Goodman J. R., Bodig J. 1971. Orthotropic strength of wood in compression. Wood Sci. 4, 83–94 [Google Scholar]
- 50.Bodig J., Goodman J. R. 1973. Prediction of elastic parameters for wood. Wood Sci. 5, 249–264 [Google Scholar]
- 51.Forest Service US Department of Agriculture 1999. Wood handbook: wood as an engineering material. Forest products laboratory Madison, WI: US Department of Agriculture [Google Scholar]
- 52.Easterling K. E., Harrysson R., Gibson L. J., Ashby M. F. 1982. On the mechanics of balsa and other woods. Proc. R. Soc. Lond. A 383, 31–41 10.1098/rspa.1982.0118 (doi:10.1098/rspa.1982.0118) [DOI] [Google Scholar]
- 53.Cave I. D. 1968. Anisotropic elasticity of the plant cell wall. Wood Sci. Technol. 2, 268–278 10.1007/BF00350273 (doi:10.1007/BF00350273) [DOI] [Google Scholar]
- 54.Gibson L. J., Ashby M. F. 1997. Cellular solids: structure and properties, 2nd edn Cambridge, UK: Cambridge University Press [Google Scholar]
- 55.Hepworth D. G., Bruce D. M. 2000. A method of calculating the mechanical properties of nanoscopic plant cell wall components from tissue properties. J. Mater. Sci. 35, 5861–5865 10.1023/A:1026716710498 (doi:10.1023/A:1026716710498) [DOI] [Google Scholar]
- 56.Jarvis M. C., Forsyth W., Duncan H. J. 1988. A survey of pectin content of non-lignified monocot cell walls. Plant Physiol. 88, 309–314 10.1104/pp.88.2.309 (doi:10.1104/pp.88.2.309) [DOI] [PMC free article] [PubMed] [Google Scholar]
- 57.Hiller S., Jeronimidis G. 1996. Fracture in potato tuber parenchyma. J. Mater. Sci. 31, 2779–2796 10.1007/BF00355984 (doi:10.1007/BF00355984) [DOI] [Google Scholar]
- 58.Oye M. L., Vanstreels E., De Baerdemaeker J., Tijskens E., Ramon H., Hertog M. L. A. T. M., Nicolai B. 2007. Effect of turgor on micromechanical and structural properties of apple tissue: a quantitative analysis. Postharvest Biol. Technol. 44, 240–247 10.1016/j.postharvbio.2006.12.015 (doi:10.1016/j.postharvbio.2006.12.015) [DOI] [Google Scholar]
- 59.Lin T.-T.,, Pitt R. E. 1986. Rheology of apple and potato tissue as affected by cell turgor pressure. J. Texture Stud. 17, 291–313 10.1111/j.1745-4603.1986.tb00554.x (doi:10.1111/j.1745-4603.1986.tb00554.x) [DOI] [Google Scholar]
- 60.Scanlon M. G., Pang C. H., Biliaderis C. G. 1996. The effect of osmotic adjustment on the mechanical properties of potato parenchyma. Food Res. Int. 29, 481–488 10.1016/S0963-9969(96)00055-5 (doi:10.1016/S0963-9969(96)00055-5) [DOI] [Google Scholar]
- 61.Georget D. M. R., Smith A. C., Waldron D. W. 2003. Modelling of carrot tissue as a fluid-filled foam. J. Mater. Sci. 38, 1933–1938 10.1023/A:1023552430136 (doi:10.1023/A:1023552430136) [DOI] [Google Scholar]
- 62.Hiller S., Bruce D. M., Jeronimidis G. 1996. A micropenetration technique for mechanical testing of plant cell walls. J. Texture Stud. 27, 559–587 10.1111/j.1745-4603.1996.tb00094.x (doi:10.1111/j.1745-4603.1996.tb00094.x) [DOI] [Google Scholar]
- 63.Rich P. M. 1986. Mechanical architecture of arborescent rain forest palms. Principes 30, 117–131 [Google Scholar]
- 64.Rich P. M. 1987. Developmental anatomy of the stem of Welfia geogii, Iriartea gigantea and other arborescent palms: implications for mechanical support. Am. J. Bot. 74, 792–802 10.2307/2443860 (doi:10.2307/2443860) [DOI] [Google Scholar]
- 65.Rich P. M. 1987. Mechanical structure of the stem of arborescent palms. Bot. Gaz. 148, 42–50 10.1086/337626 (doi:10.1086/337626) [DOI] [Google Scholar]
- 66.Kuo-Huang L.-L., Huang Y.-S., Chen S.-S., Huang Y.-R. 2004. Growth stresses and related anatomical characteristics in coconut palm trees. IAWA J. 25, 297–310 [Google Scholar]
- 67.Ruggeberg M., Speck T., Paris O., Lapierre C., Pollet B., Koch G., Burgert I. 2008. Stiffness gradients in vascular bundles of the palm Washingtonia robusta. Proc. R. Soc. B 275, 2221–2229 10.1098/rspb.2008.0531 (doi:10.1098/rspb.2008.0531) [DOI] [PMC free article] [PubMed] [Google Scholar]
- 68.Ruggeberg M., Speck T., Burgert I. 2009. Structure–function relationships of different vascular bundle types in the stem of the Mexican fanpalm (Washingtonia robusta). New Phytol. 182, 443–450 10.1111/j.1469-8137.2008.02759.x (doi:10.1111/j.1469-8137.2008.02759.x) [DOI] [PubMed] [Google Scholar]
- 69.Nogata F., Takahashi H. 1995. Intelligent functionally graded material: bamboo. Compos. Eng. 5, 743–751 10.1016/0961-9526(95)00037-N (doi:10.1016/0961-9526(95)00037-N) [DOI] [Google Scholar]
- 70.Ashby M. F. 1999. Materials selection in mechanical design, 2nd edn Oxford, UK: Butterworth Heinemann [Google Scholar]
- 71.Gibson L. J., Ashby M. F., Easterling K. E. 1988. Structure and mechanics of the iris leaf. J. Mater. Sci. 23, 3041–48 10.1007/BF00551271 (doi:10.1007/BF00551271) [DOI] [Google Scholar]
- 72.Moulia B., Fournier M. 1997. Mechanics of the maize leaf: a composite beam model of the midrib. J. Mater. Sci. 32, 2771–2780 10.1023/A:1018604012754 (doi:10.1023/A:1018604012754) [DOI] [Google Scholar]
- 73.Torrents A., Schaedler T. A., Jacobsen A. J., Carter W. B., Valdevit L. 2012. Characterization of nickel-based microlattice materials with structural hierarchy from the nanometer to the millimeter scale. Acta Mater. 60, 3511–3523 10.1016/j.actamat.2012.03.007 (doi:10.1016/j.actamat.2012.03.007) [DOI] [Google Scholar]