Abstract
We propose a model that captures the dynamics of a carnivorous plant, Utricularia inflata. This plant possesses tiny traps for capturing small aquatic animals. Glands pump water out of the trap, yielding a negative pressure difference between the plant and its surroundings. The trap door is set into a meta-stable state and opens quickly as an extra pressure is generated by the displacement of a potential prey. As the door opens, the pressure difference sucks the animal into the trap. We write an ODE model that captures all the physics at play. We show that the dynamics of the plant is quite similar to neuronal dynamics and we analyse the effect of a white noise on the dynamics of the trap.
Keywords: bladderwort, carnivorous plant, fast motion, excitable dynamics, Utricularia
1. Introduction
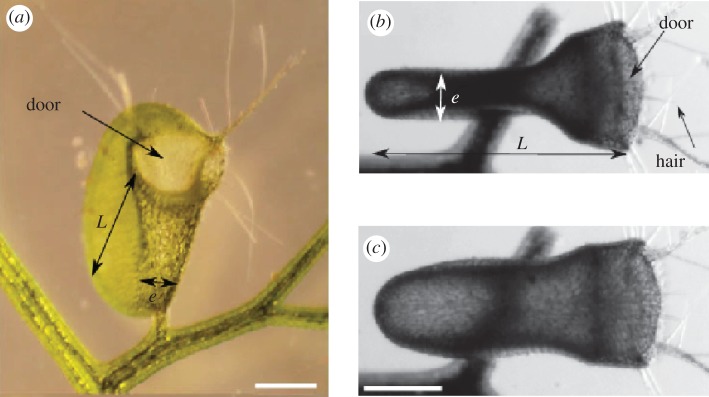
Utricularia inflata is an amazing, aquatic, rootless plant. At first sight, they are long stems topped by yellow flowers, but their underwater leaves are endowed with millimetre-sized traps. These traps are ingenious systems developed by the plant in order to survive in nutrient-poor habitats. When a prey comes too close to the trap, it touches some trigger hairs (figure 1a). This mechanical stimulus allows the opening of the trap: the door buckles, slides inwards and finally unlocks. Thus, the prey and its surrounding water are quickly sucked into the inflating trap (figure 1c). Then, Utricularia deflates slowly, thanks to the activity of membranar bifid glands, which actively pump the water out of the trap. Actually, the pumping is based on the transport of chloride ions, which creates a local osmotic gradient in the trap membrane and an accompanying flux of water [1,2]. As a result, the trap deflates and returns into a capturing configuration (figure 1b).
Figure 1.
Trap of Utricularia inflata. (a) Frontal view of the trap. The light green disc is the door of the trap. (b,c) Top view of a trap. The two extreme states of the trap are displayed. In (b), the trap is in the deflated, capturing configuration. The fine threads are the trigger hairs. In (c), the trap has just fired and is inflated. Scale bars, 500 µm. (Online version in colour.)
In order to fully understand the mechanical behaviour of this trap, we built a full dynamical model. Indeed, previous studies focus only on the mechanics of the trap body [3], or on the door [4] but no model was proposed to link those two aspects. Here, we introduce the hydrodynamics in order to couple these two elastic parts. We present our model in §2 by linking the internal pressure and the position of the door with a set of two coupled differential equations. Our dynamical model predicts a wide range of behaviours, including excitability leading to a fast suction, and spontaneous or periodic firings, which are all observed experimentally on Utricularia [5]. Note that our purely mechanical system is described by a set of equations that are similar to that of other models developed for electrically excitable media, such as the FitzHugh–Nagumo model for spike generation in nerves [6]. We find the relevant parameters that completely characterize the whole dynamics. Numerical results are analysed in §3. In §4, we discuss the suitability of our model by comparing our results with the real behaviour of Utricularia. Fluctuations are introduced in the last section, in order to account for the statistics of spontaneous firings of the trap [5].
2. Derivation of the model
The mechanism for capturing prey is based on the suction of the fluid near the door, induced by the trap deformation. The bifid glands, by expelling water, build up a high pressure difference between the interior and the exterior of the trap, with a characteristic time of a hundred minutes. For a critical volume, the closed door can no longer sustain this pressure difference, and the trap inflates in a few milliseconds while sucking in the exterior fluid (with the potential prey). The existence of a critical threshold yielding an explosive response followed by a slow recovery are the signature of an excitable system, like for the neuronal dynamics [6].
We first describe the geometric properties of the trap, then we model the temporal variations of the volume and we approximate the door opening/closing dynamics. Finally, we close our model by coupling this dynamics with the volume equation.
2.1. Geometry of the trap body
The trap, which is a biconcave disc, as pictured in figures 1 and 2, can be approximated as a deformable cylinder [4] of diameter L ≈ 1.5 mm and variable height e. The volume is approximated by
 |
2.1 |
Figure 2.
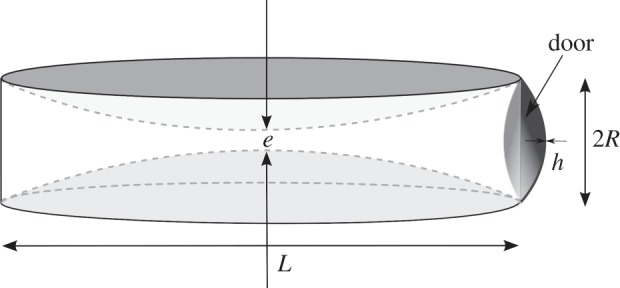
Cylindrical geometry of the trap, with a diameter L and a height e. The door is visible on the right as a circular shell of radius R (R = 3 × 10⁻⁴ m) and thickness h (h = 3 × 10⁻⁵ m) [3].
When the trap is fully inflated, e = 0.8 mm, and the maximum volume is Vmax = 1.41 mm3. As the trap is fully deflated, e = 0.4 mm, and the minimal volume is Vmin = 0.67 mm3 [4]. The area of the membrane of the trap Sm is approximately given by
| 2.2 |
2.2. Temporal variation of the volume
We now consider the temporal variations of V, as observed in [5]. Experiments show that V decays exponentially to a final volume V0 [4]. The fluid flux has three contributions. First, the bifid glands of the membrane actively pump the water out of the trap to decrease V. The flow rate corresponding to this mechanism is −q with q positive. The second effect is related to the porosity of the trap. The membrane pores induce a Darcy flow that is proportional to the pressure difference ΔP, the surface of the membrane Sm and the porosity δe. Osmotic pressure could also be at the origin of this leakage. Finally, if the door is opened, there is an additional flux that tends to equilibrate the pressure difference between the exterior and the interior of the trap. For now, we simply write the balance of fluxes related to the membrane:
| 2.3 |
where q = 2.3 × 10⁻¹³ m3 s−1 [4] (equivalent to a transport velocity of 4 × 10⁻⁸ m s−1 through the surface Sm) and we choose δe = 2.4 × 10⁻¹² m s−1 Pa−1 of the same order of magnitude as those reported for vegetal cells [7,8]. The membrane elasticity connects the volume loss to the pressure load: the pressure difference ΔP varies almost linearly with V in experiments and in simulations [4]:
| 2.4 |
with Vmax the volume for which the bending energy of the trap is minimum. Here, d mixes the effects of the elasticity and the geometry of the trap. Experimental results show that a variation from V = Vmax to V = Vmin yields a pressure difference equal to 0.15 bar [4]; so we evaluate d = 2.027 × 10¹³ Pa m−3. As a consequence, we conclude from (2.3) and (2.4):
| 2.5 |
where 1/τ = δe dSm and V0 = Vmax − qτ is the volume at final equilibrium.
At this stage, we can model the action of the door with the following argument: as V becomes smaller than Vc, the door opens and V is settled instantly to a given value Vmax. This crude approximation will be refined as we develop the model of the door displacement (§2.3).
If at t = 0, V = Vmax, then the temporal evolution of the volume is
| 2.6 |
Consequently, depending on the relative value of V0 to Vc, we can observe two distinct behaviours (figure 3):
— if Vc < V0, the volume of the trap converges to V0. Furthermore, if Vc ∼ V0, the trap dynamics is similar to an excitable system [9]. A small external perturbation can potentially decrease V under Vc, leading to the opening of the door, which in turn increases V up to Vmax.
- — if Vc > V0, the volume will oscillate between the value Vmax and Vc. The period of the oscillation TV can be easily obtained. At t = TV, the door opens as V = Vc. We therefore deduce from (2.6) that
These two distinct behaviours have been described in Vincent et al. [5].
2.7
Figure 3.
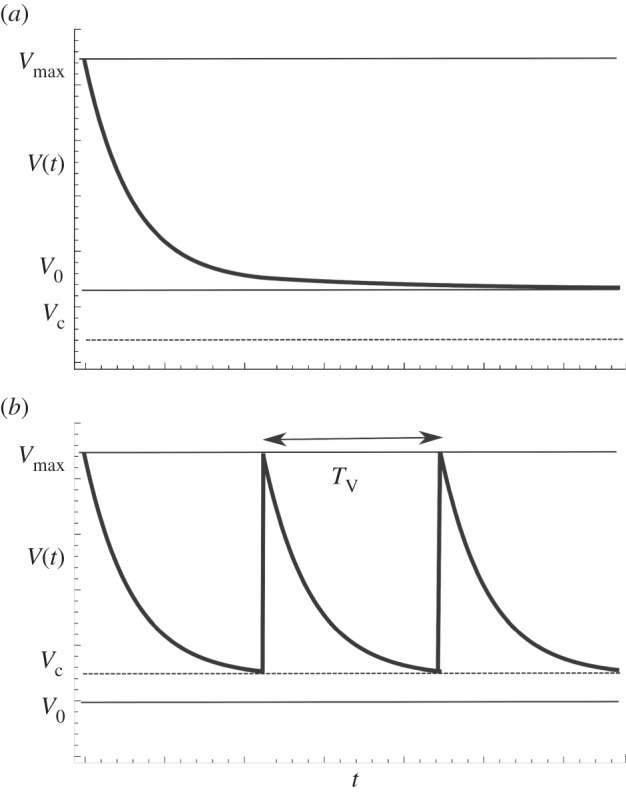
Temporal variations of the volume V, with a simple model neglecting the door dynamics. (a) Vc<V0: convergence of the trap volume to V0. (b) Vc>V0: oscillations of the volume V.
The critical volume Vc will be assessed by studying the door dynamics.
2.3. Dynamics of the door
We model the door as an elastic circular shell of radius R = 3 × 10⁻⁴ m and thickness h = 3 × 10⁻⁵ m [4], with half of its edge clamped in the membrane. This door is compressed against a flat and rigid substrate, leading to a bent shape as pictured in figure 4a. In this configuration, we assume that no fluid leaks through the door, which slightly deforms to sustain an increase in pressure difference ΔP. When this latter exceeds a critical value, a buckling instability occurs (figure 4b), yielding to a fast opening of the door that permits a fast entrance of the fluid that equilibrates the pressure (figure 4c). Once ΔP vanishes, the door comes back quickly to its original configuration (figure 4a), driven by the minimization of its elastic energy.
Figure 4.
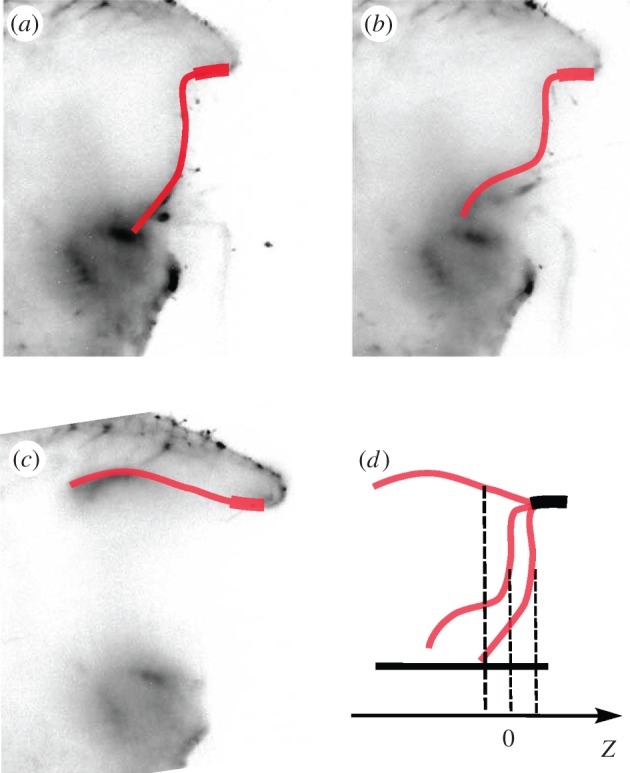
Experimental images of the opening of the door of Utricularia australis. (a) Initial shape prior opening, (b) 7.6 ms after opening and (c) full opening at 8.6 ms. The height of the door is around 400 µm. It is thicker near top. The pictures are based on light-sheet fluorescence microscopy recording and they are here displayed in grey inversion. (d) The conventions for the position of the centre of the door Z are represented. When the door is closed and the trap is in the ‘ready to capture’ configuration, Z =+Z0. The door is buckling: Z = 0. The curvature of the door is inverted and the door is open: Z =−Z0. (Online version in colour.)
We note Z the position of the centre of mass of the door. The door is subject to elastic forces, to the external load −πR2ΔP exerted by the pressure and to damping. The effective mass m of the door can be approximated by
| 2.8 |
where ρ measures its density (approx. equal to ρwater = 103 kg m−3). The first term is the mass of the door, and the second term represents the added mass. The factor κ is of order 1 [10]. The cubic dependance models the fluid volume that the door needs to displace during its motion. We consequently write:
| 2.9 |
Very roughly, the damping terms can be written with a sum of two contributions. As the door moves fast, the fluid is at a high Reynolds number and generates a drag proportional to  [11]. For small movements, the latter damping is small compared with the viscous friction, proportional to the Stokes force
  [11], where η is the dynamical viscosity of water. Consequently, we write:
| 2.10 |
where the two constants a and b are of order 1, and depends on the geometry of the door. It remains to define the elastic forces. We approximate the door with a cylindrical shell, against a rigid substrate using a bending energy ℰ:
| 2.11 |
For such systems, the plate has two stable buckled equilibria separated by an unstable state. The bending energy should display two minima separated by one maximum, this is why we propose
 |
2.12 |
where Pb is the critical pressure provoking the door buckling. In the case of a spherical shell of radius R and thickness h, it writes Pb = Eh2/R2 [12].
The energy (2.12) predicts an unstable state Z = 0 with two stable states Z =±Z0. Following figure 4, we choose the door to be closed when Z > 0 and opened when Z < 0. The door is not articulated on freely rotating hinges, as would be a real door. Actually, it is clamped to the main body by a thicker and less deformable part (figure 4). The deformation of this thicker part means that the opened state is energetically unfavoured. To account for the deformation cost of the thick part, we therefore break the symmetry Z → −Z by adding a term proportional to −Z in the energy and we introduce a prefactor c:
 |
2.13 |
In figure 5, we plot the elastic energy ℰ as a function of Z. The effect of the constant c > 0 renders the closed door configuration to be more stable from an energetic point of view. In particular, when  , this potential exhibits a single minimum, with Z > 0, which corresponds to the closed door state.
Figure 5.
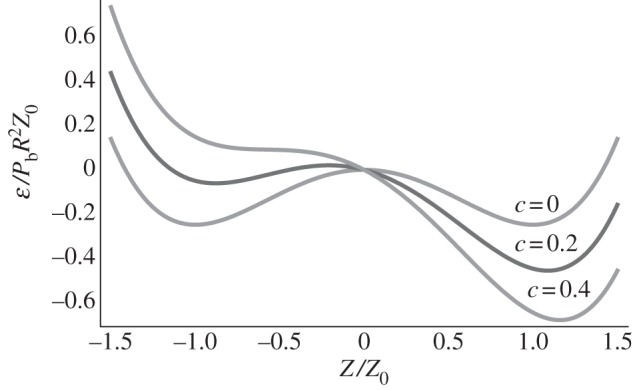
ℰ versus Z for c = 0, 0.2, 0.4.
2.4. Mass flux induced by the door
It remains to couple the volume equation (2.6) to the door dynamics (2.9). We model the flow rate Q in the channel induced by the opened door, in the presence of a pressure difference:
 |
2.14 |
Here, πR2s(Z/Z0) is the surface of the channel. The non-dimensional surface s(Z/Z0) is approximated with
| 2.15 |
where ℋ(x) is the unit step function. The constant f is a geometric factor.
The fluid velocity U can be assessed using Bernouilli relation [11], because the Reynolds number of the incoming flow is quite high (around 1000 [3]). We therefore write
 |
2.16 |
As consequence, we deduce the flux Q
 |
2.17 |
2.5. Model closure
In order to close the model, we need to couple the volume, the door position and the pressure difference. Adding the contribution of the open door (2.17) to the flux balance (2.3), we obtain
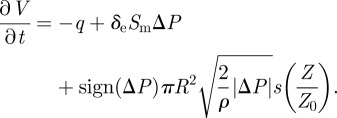 |
2.18 |
Injecting the link (2.4) between ΔP and V into the earlier-mentioned relation, we deduce our dynamical model for the trap:
 |
2.19 |
and
 |
2.20 |
We now set our system in a non-dimensional form with the scalings Z = Z0z, ΔP = Pbp, and t = Θs. Because the characteristic length scale for Z0 is proportional to R, we set Z0 = R. Using (2.20), the balance between the acceleration term with the elastic response gives the characteristic timescale Θ of the opening door:
 |
2.21 |
where we used E = 2.7 MPa. Θ is the shortest time of the system; so the non-dimensional time s is very long. As consequence, our non-dimensional system can be written as
| 2.22 |
and
| 2.23 |
with
| 2.24 |
| 2.25 |
 |
2.26 |
| 2.27 |
| 2.28 |
| 2.29 |
The dynamical viscosity is η = 10−3 Pa s.
3. Analysis of the model
The system (2.22) and (2.23) presents two very different timescales. The door motion is generally very fast compared with the pressure recovery time: it is reminiscent of excitable system, for which a qualitative analysis is performed using nullclines. Owing to the slow temporal variation of p, the equation (2.22) is a nonlinear, damped oscillator for the variable z. When  , the door accelerates positively if πp < f(z), with f(z) = z − z3 + c, and negatively otherwise.
If z > 0, the equation (2.23) is
| 3.1 |
and the pressure increases as p0 > p, and decreases on the other case.
If z < 0, the door is opened and the fluid flow (through the opening) controls the pressure variation; the equation (2.23) becomes
| 3.2 |
In consequence, if z < 0 and p > 0, the pressure difference p decreases whereas if z < 0 and p < 0, p increases. These behaviours can be summarized in figure 6, where we plot the functions p(z) at which  and
and  , defining the two nullclines.
Figure 6.
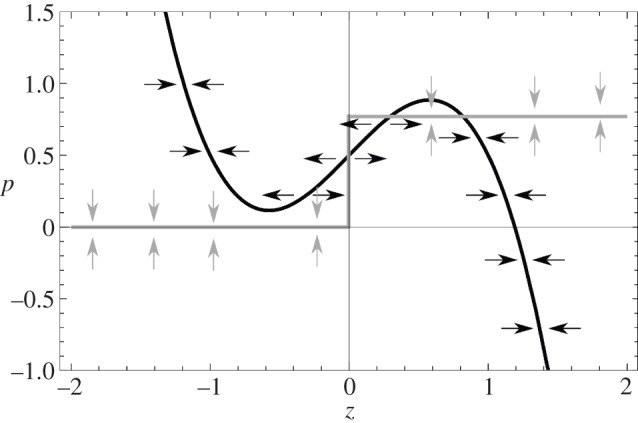
Nullclines for the vector field (z, p). The black curve represents stationary points for which  , i.e. p = f(z), the grey curve represents the location where
  .
.
The temporal evolution of  is very small compared with
  , except in the close neighbourhood of
  .
.
3.1. Stationary states
In this section, we investigate the stationary states  of the model, and we need to solve the following system of equations:
| 3.3 |
and
| 3.4 |
They can be guessed by studying the intersections of the two curves plotted in figure 6. Because the temporal evolution of p is very small compared with those of z, we can assess the linear stability of the fixed points by using the equation (2.22) with p = ps; then the evolution of the perturbation  around zs obeys to
| 3.5 |
As a consequence, the stationary points zs will be stable if f′(zs)< 0, because β is always positive.
Depending on the signs of zs and ps, we meet two cases:
— zs > 0, the fixed points are ps = p0 (from (3.1)) and the roots zs of πp0 = zs − zs3 + c. This last equation has two real solutions if
 . A close look at figure 6 permits us to conclude that only the highest root is stable. If p0 < c/π, then the system has only one stable stationary point. Perturbations of the door position around these stable states will create damped oscillations, while p will decrease very slowly to p0.
— zs < 0: in such a case, the flow through the door dominates the dynamics for the pressure. Therefore, ps = 0 (from equation (3.2)). It is necessary to solve zs − zs3 + c = 0, which admits two real negative solutions only if
 . Again, figure 6 predicts that only the most negative root will be stable.
3.2. Phase diagram
The previous study of stationary states and their linear stability yields the construction of the phase diagram of the trap. Depending on the number of stable states, we distinguish four regions (figure 7):
— Region A and A′: the only stable state is the closed door. Notice that when the pumping generates a pressure difference close to spontaneous buckling, i.e. when
 , the system will exhibit a strong sensibility to a variation of the pressure or to the position of the door. It is in this regime that the system is understood as excitable. We made a simulation of the dynamics in this case, as shown in figure 8: a small increment of pressure will lead to a quick opening of the door, producing damped oscillations while it comes back to the closed state, and that the bifids glands pump the fluid out. The pressure difference equilibrates to p0, and the trap will be ready to capture another prey.
— Region B and B′: in this range of parameters, the trap has two stable steady states: depending on initial conditions, the door remains opened or closed. An example of these dynamics is shown in figure 9.
— Region C: the only stable state is the door opened. An example of these dynamics is shown in figure 10.
— Region D: because the trap does not offer stable stationary points, it undergoes relaxation oscillations between
 and
and  . An example of these dynamics is shown in figure 11.
Figure 7.
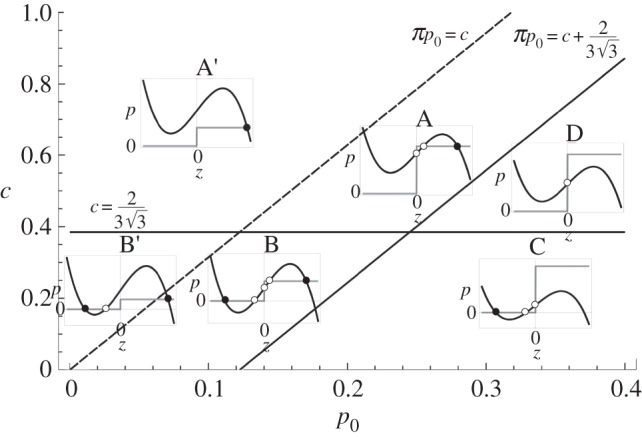
A phase diagram of the dynamical model as a function of the two controlling parameters (p0, c). The lines separate the different behaviours that the trap can exhibit. The insets represent the nullclines in the (z, p) plane, where the black discs mark a stable stationary point, whereas the white discs represent unstable points. See the main text for the description of each region.
Figure 8.
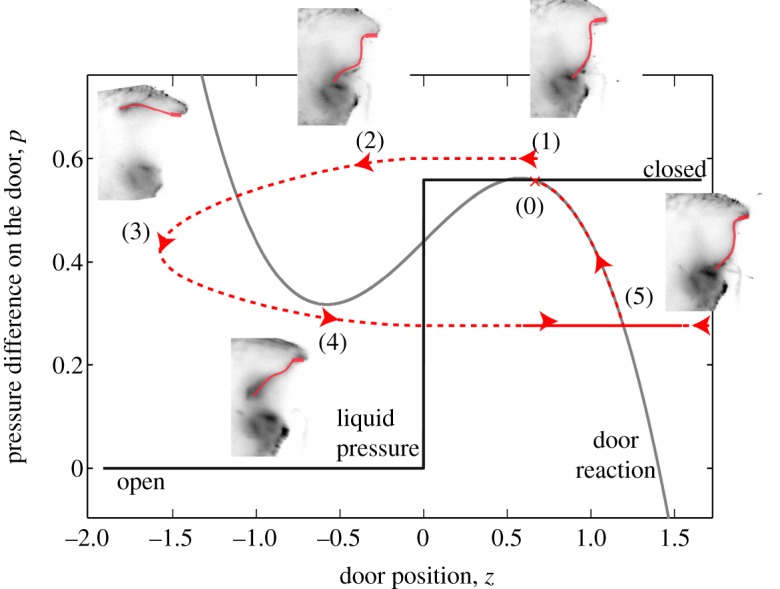
Dynamical evolution of a trap that is near spontaneous buckling: (0) rest position. (1) A mechanical disturbance is added, as a consequence of a prey touching a trigger hair, elevating the pressure difference above buckling threshold, (2) the door is thus opening and (3) is fully opened, so that the pressure difference decreases. (4) Owing to its elasticity, the door closes back; after some oscillations, (5) the pressure difference slowly rises again because of active pumping of fluid, recovering the equilibrium position (0). These results are computed for region A with the following parameters c = 1.38 and p0 = 0.5581 and initial conditions: z = 1,  , p = 0 and v = 1. (Online version in colour.)
Figure 9.
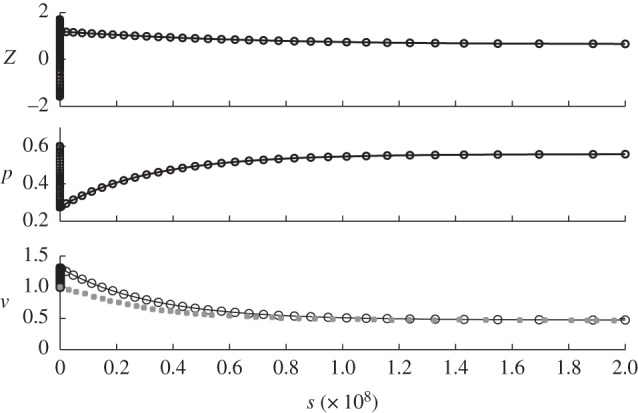
Results for region A, with the time evolution of the normalized door position, pressure and volume. Parameters are same as those of the previous figure. Experimental points for the evolution of the volume are added: vexp. Circles, v; squares, vexp [4].
Figure 10.
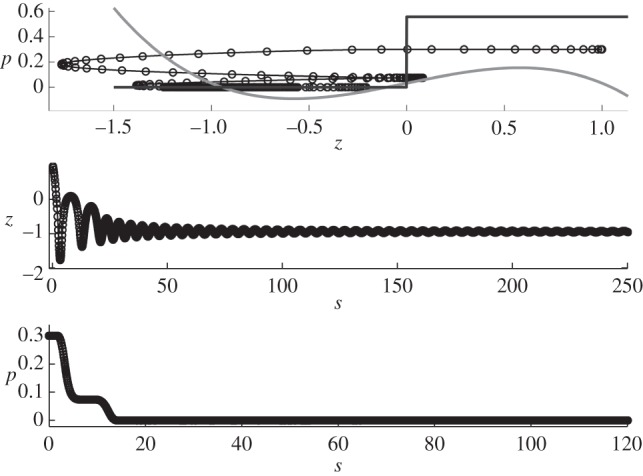
Results for region C with the following parameters c = 0.1 and p0 = 0.5581, and initial conditions: z = 1,  , p = 0.3 and v = 1. Note that the timescale is zoomed in order to see the fast variations. The behaviour remains the same at long timescale: no more variation.
Figure 11.
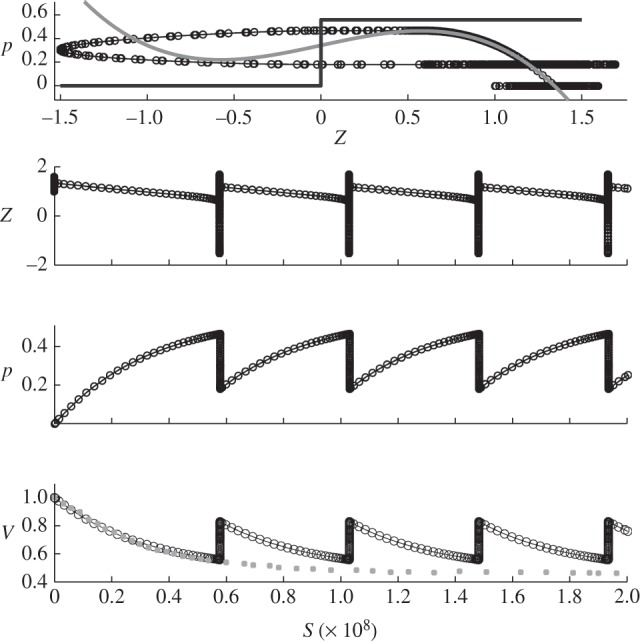
Results for region D with the following parameters c = 1.0733 and p0 = 0.5581 and initial conditions: z = 1,  , p = 0 and v = 1. Circles, v; squares, vexp.
4. Discussion
4.1. Comparison with experiments
Experimentally, the trap presents the three states: excitable, metronomic and dead, described in §3. If the plant is dead, the trap is not functioning anymore, and the trap remains opened as shown in the region C of figure 7. In normal conditions, the trap is in state A of figure 7, with  : a small amount of extra pressure can force the door to open, yielding the suction of some liquid around it. For the simulations presented in figure 12, the variation in pressure difference rises to approximately 16 kPa,with the parameter values proposed in §2.5. This perfectly agrees with the experimental value of 10–20 kPa [4]. The duration for the trap to come back to its stable state is evaluated by τ ∼ 54 min, which fairly matches the experimental values of 25–50 min [5]. Finally, we numerically find (figure 10) that the time for the door buckling is around 3.6 ms, namely in the same order of magnitude as those reported in Vincent et al. [5].
Figure 12.
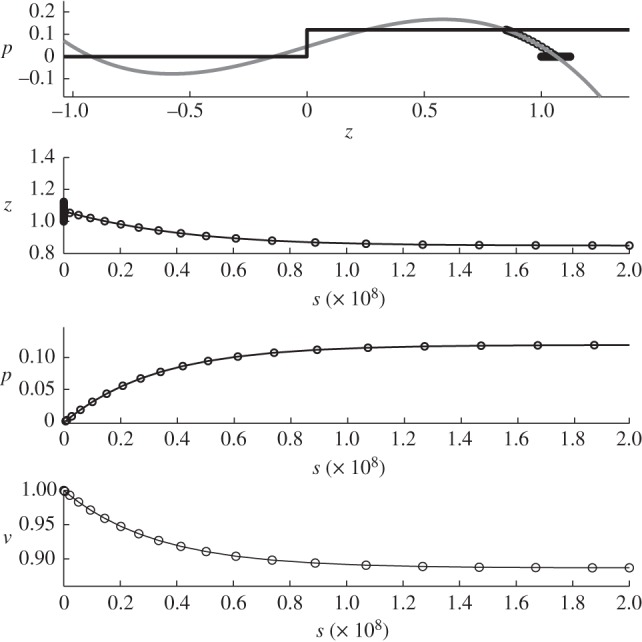
Results for region B with the following parameters c = 0.14 and p0 = 0.12, and initial conditions: z = 1,  , p = 0 and v = 1.
Obviously, our simple model does not pretend to be accurate enough to exactly match the experiments; however, our non-dimensional parameters can be fit to experimental measures. The model shows that the trapping function is obtained only in one regime, when the mechanical parameters of the trap are in a specific range.
4.2. Effect of noise on the system
This highly sensitive trigger renders the mechanism for capturing preys very efficient; nevertheless, we shall investigate the effect of noise. In fact, for high enough amplitudes, some noise induces stochastic trapping events because of the excitable behaviour.
The relaxation oscillations observed in the D region of the phase diagram have been recently described as spontaneous firings [5]. To investigate the effect of the noise, we consider the membrane as N interconnected ‘particles’ submitted to an external noise. Accordingly, the positions of the particles follow the Langevin equations:
| 4.1 |
where DL is the diffusion coefficient, kb is the Boltzmann constant, T is the temperature, fj is the external force on the jth particle. The Gaussian random drifts are defined by
 |
4.2 |
This description allows us to access the stochastic fluctuations of the volume V (see appendix A for details):
| 4.3 |
where 1/τ = δe dSm and V0 = Vmax − qτ is the trap volume at equilibrium. The stochastic forcing for the volume is defined by
 |
4.4 |
where ϕDL is a macroscopic volume diffusion coefficient computed in appendix A.
We need to compute the minimum volume Vc that the trap can sustain, corresponding to the highest pressure difference ΔPc that the system can maintain:
 |
4.5 |
The critical volume is straightforwardly deduced from the relation (2.4):
| 4.6 |
If V <Vc, the doors opens and the trap volume instantaneously reaches Vmax.
We translate (4.3) with the following change of variable:
| 4.7 |
| 4.8 |
| 4.9 |
Then, (4.3) becomes:
| 4.10 |
with
| 4.11 |
Depending on the sign of x0, the trap can exhibit some oscillations. As x0 > 0, i.e. Vc < V0, and for xmax > 0, the variable x can never become negative, and the trap stays into a capturing state. On the contrary, if x0 becomes negative, i.e. Vc > V0, x will oscillate between the values 0 and xmax with the period T defined in equation (2.7). This period diverges as x0 becomes positive because no oscillations are possible. So we approximate the trap dynamics via an Ornstein–Uhlenbeck process [13]. Actually, a stochastic period arises from the noise effect in the domain x0 > 0.
The general solution of equation (4.10) is
 |
4.12 |
where the initial condition is x(0) = xmax, i.e. V(0) = Vmax. The Fokker–Planck equation [14] describes the time evolution of the probability density function of x; it can be written as follows:
| 4.13 |
where
 |
4.14 |
The dimension of D is s−1. Here we take the diffusion coefficient for a bilipid: DL = 10−11 m2 s−1 [15]. The initial condition at t = 0 is c(x, 0) = δ(x − xmax), and the boundary conditions are c(0,t) = c(∞, t) = 0. We focus on the system behaviour for x = 0. In fact, if x = 0 (V = Vc), the value of the volume is instantaneously reset to Vmax. The probability flux j(t) at x = 0 is
| 4.15 |
By integrating this flux over the whole temporal domain, we deduce the probability ε that the system escapes at x = 0:
| 4.16 |
We note  the Laplace transform of c(x, t). By performing the Laplace transform of (4.13) and by imposing the initial boundary condition, we obtain
 |
4.17 |
The solution  of the earlier-mentioned equation allows us to compute the Laplace transform
  of the probability flux:
| 4.18 |
Because  , we deduce the following Taylor expansion:
 |
4.19 |
As a consequence, a Taylor expansion for small s of the latter quantity permits us to identify the average first escape time
 |
4.20 |
which can be evaluated once  is known.
The computation of the probability flux is described in appendix B.
4.3. Computation of average escape time
We can evaluate the average first exit time 〈t〉 using (4.20):
 |
4.21 |
where Hz(y) is the Hermite polynomial of degree z. As shown in figure 13, for low noise, the stochastic period of the oscillations given by (4.21) tends to the deterministic period TV (2.7). In terms of the variable x:
 |
4.22 |
Figure 13.
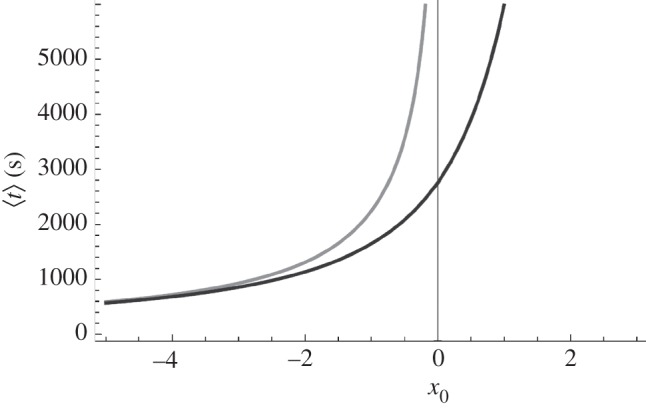
Average period of oscillation versus x0. The grey curve represents the deterministic period (4.22). The black curve represents the average period for the stochastic system (4.21). As x0 tends to minus infinity, we can neglect the influence of the noise, and the two curves join together. D ∼ 3.6 × 10⁻⁴ s−1 and τ ∼ 3232 s.
As x0 becomes negative, the system exhibits oscillations. In the simulation of the metronomic system (region D) displayed in figure 11, x0 = −0.2023 and we find TV ∼ 95 min, which is in good agreement with [5] (from 45 min to several hours). In figure 13, we see that the fluctuations reduce the oscillation period.
In the excitable regime, x0 is small. In figure 14, we can see that the noise extends the periodic behaviour for x0 > 0. Unsurprisingly, an increasing noise intensity shortens the period.
Figure 14.
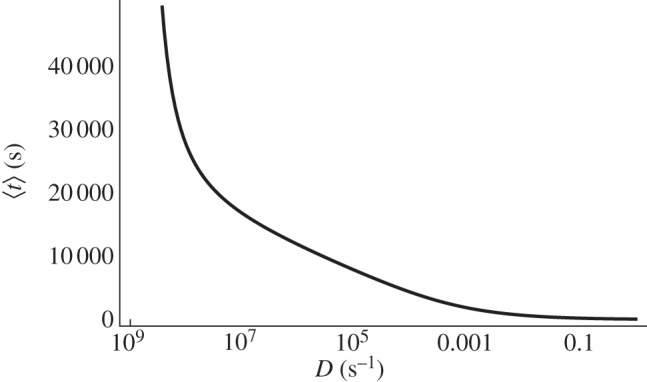
Average period of oscillation versus the noise intensity D in the excitable regime (region A). x0 = 0.0066 and τ = 3232 s.
5. Conclusion
The model is found to capture all the features of the mechanical system of Utricularia traps.
On the basis of simple mechanical ingredients, nonlinear elasticity and fluid coupling, the present analysis could be useful for other mechanical systems exhibiting oscillations, in the plant or animal kingdoms.
The precise quantification of all noise sources (physiological variations, fatigue, mechanism of pumping, variability in door elasticity or closure, etc.), is yet to be analysed, and opens perspective for future research.
Appendix A. Stochastic volume equation
A.1. Statistical description of the membrane
Let us assume that the membrane may be described by a collection of N interconnected ‘particles’. The positions of those ‘particles’ follow the Langevin equations that we write in the barycentric coordinates (for the sake of simplicity) as
| A1 |
where fj is the external force on the jth particle and where the Gaussian random drifts are defined by
 |
A2 |
The gyradius Rg of the membrane is defined by
 |
A3 |
This is a measure of the statistical expansion of the membrane. That gyradius allows us to define the volume of gyration of the membrane as
 |
A4 |
which is the average statistical volume enclosed by the membrane. Accordingly,
 |
A5 |
then
 |
A6 |
A.2. Fluctuations near the resting volume
Normally, we expect the Gaussian noise to be negligible against the external forces. So we are interested only in the case where the sum of the external forces is about zero on each ‘particle’, that is when the second term in (A 6) tends to vanish. If we assume that we have small fluctuations, then we can approximate that all the rj are near their initial values. Consequently, rj.ηbj ≃ rj η′b , where η′b is the projection of a Gaussian random drift on a constant direction, so that
 |
A7 |
By the statistical summation of Gaussian random variables, we obtain
 |
A8 |
where η′b possesses the same properties than one of the η′bj. Finally, the evolution of the volume can be approximated by
 |
A9 |
The first (stochastic) term can be expressed as an overall Gaussian noise. Then the linearization of the second (deterministic) term near the resting volume Vg,0 shall mandatorily produce a first-order relaxation. This yields
| A10 |
where Λg(t) is a Gaussian volume drift with
 |
A11 |
where Sg = 4πRg2 is by definition the gyration surface.
A.3. Application to Utricularia
The equation for the trap may be deduced by
 |
A12 |
with
 |
A13 |
and
| A14 |
where
 |
A15 |
Taking into account the cylindrical geometry
 |
A16 |
with
 |
A17 |
we can compute
 |
A18 |
This crude modelling allows us to connect a microscopic particular diffusion coefficient DL to a macroscopic volume diffusion coefficient 2ϕDL.
Appendix B. Computation of the probability flux
We first solve (4.17). The presence of the dirac function localized at x = xmax suggests to consider two intervals. On the first interval [0, xmax], we compute the solution  , whereas we note
  the solution on the interval [xmax, ∞[, such that we have to solve the following equation:
 |
B1 |
We find the asymptotic solution:
| B2 |
The sought solutions of (B 1) are written:
| B3 |
| B4 |
 |
B5 |
The index i stands for a,b. Hn(z) is the Hermite polynomial of degree n and 1F1 (a′;b′;z) is the Kummer confluent hypergeometric function. Note the similarity of the function f1 with the wave function of the quantum harmonic oscillator. The function f2(x,s) behaves as 1/x, as x tends to infinity, and this slow convergence to zero imposes that b2 = 0, because we aim in deriving a finite density probability. As consequence we have three unknowns (a1,2 and b1) for the three boundary conditions:
| B6 |
| B7 |
| B8 |
The last condition is the consequence of the presence of the dirac function located at x = xmax. The inversion of system (B 6)–(B 8) gives
 |
B9 |
 |
B10 |
 |
B11 |
where w(x,s) = f2(x,s) x
f1(x,s) − f1(x,s)
 x
f2(x,s) is the Wronskian of the equation (B 1). It obeys the equation
| B12 |
which has as a solution w(x,s) = Ae−(x−x0)2/2Dτ. Consequently, we deduce that the probability flux defined in (4.18) takes the following form:
 |
B13 |
Furthermore, we can compute the probability ε that the system escapes at x = 0 is 1 because
 |
B14 |
and H0(z) = 1. This means that a noisy trap shall always fire.
References
- 1.Sydenham P. H., Findlay G. P. 1975. Transport of solutes and warter by resetting bladders of Utricularia. Aust. J. Plant Physiol. 2, 335–351 [Google Scholar]
- 2.Juniper B. E., Robins R. J., Joel D. M. 1989. The carnivorous plants. London, UK: Academic Press [Google Scholar]
- 3.Vincent O., Weißkopf C., Poppinga S., Masselter T., Speck T., Joyeux M., Quilliet C., Marmottant P. 2011. Ultra-fast underwater suction traps. Proc. R. Soc. B 278, 2909–2914 10.1098/rspb.2010.2292 (doi:10.1098/rspb.2010.2292) [DOI] [PMC free article] [PubMed] [Google Scholar]
- 4.Joyeux M., Vincent O., Marmottant P. 2011. Mechanical model of the ultrafast underwater trap of Utricularia. Phys. Rev. E 83, 021911. 10.1103/PhysRevE.83.021911 (doi:10.1103/PhysRevE.83.021911) [DOI] [PubMed] [Google Scholar]
- 5.Vincent O., Roditchev I., Marmottant P. 2011. Spontaneous firings of carnivorous aquatic Utricularia traps: temporal patterns and mechanical oscillations. PLoS ONE 6, e20205. [DOI] [PMC free article] [PubMed] [Google Scholar]
- 6.Burkitt A. N. 2006. A review of the integrate-and-fire neuron model: I. Homogeneous synaptic input. Biol. Cybern. 95, 1–19 10.1007/s00422-006-0068-6 (doi:10.1007/s00422-006-0068-6) [DOI] [PubMed] [Google Scholar]
- 7.Frensch J., Steudle E. 1989. Axial and radial hydraulic resistance to roots of maize (Zea mays L.). Plant Physiol. 91, 719–726 10.1104/pp.91.2.719 (doi:10.1104/pp.91.2.719) [DOI] [PMC free article] [PubMed] [Google Scholar]
- 8.Forterre Y., Skotheim J. M., Dumais J., Mahadevan L. 2005. How the Venus flytrap snaps. Nature 433, 421–425 10.1038/nature03185 (doi:10.1038/nature03185) [DOI] [PubMed] [Google Scholar]
- 9.Kuramoto Y. 2003. Chemical oscillations, waves, and turbulence. New York, NY: Dover Books [Google Scholar]
- 10.Lamb H. 1982. Hydrodynamics. Cambridge, UK: Cambridge University press [Google Scholar]
- 11.Landau L. D., Lifshitz E. M. 1987. Fluid mechanics. Oxford, UK: Pergamon Press [Google Scholar]
- 12.Landau L. D., Lifshitz E. M. 1987. Theory of elasticity. Oxford, UK: Pergamon Press [Google Scholar]
- 13.Uhlenbeck G. E., Ornstein L. S. 1930. On the theory of Brownian motion. Phys. Rev. 36, 823–841 10.1103/PhysRev.36.823 (doi:10.1103/PhysRev.36.823) [DOI] [Google Scholar]
- 14.Van Kampen N. G. 1981. Stochastic processes in physics and chemistry. Amsterdam, The Netherlands: North-Holland Publishing Co [Google Scholar]
- 15.Eriksson P. O., Lindblom G. 1993. Lipid and water diffusion in bicontinuous cubic phases measured by NMR. Biophys. J. 64, 129–136 10.1016/S0006-3495(93)81347-X (doi:10.1016/S0006-3495(93)81347-X) [DOI] [PMC free article] [PubMed] [Google Scholar]


