

Abstract
This paper presents a novel application of magnetic particles for biosensing, called label-acquired magnetorotation (LAM). This method is based on a combination of the traditional sandwich assay format with the asynchronous magnetic bead rotation (AMBR) method. In label-acquired magnetorotation, an analyte facilitates the binding of a magnetic label bead to a nonmagnetic solid phase sphere, forming a sandwich complex. The sandwich complex is then placed in a rotating magnetic field, where the rotational frequency of the sandwich complex is a function of the amount of analyte attached to the surface of the sphere. Here, we use streptavidin-coated beads and biotin-coated particles as analyte mimics, to be replaced by proteins and other biological targets in future work. We show this sensing method to have a dynamic range of two orders of magnitude.
Keywords: Biosensing, Diagnostics, Magnetic beads, Magnetic rotation, Biotin, Streptavidin, Sandwich Immunoassay
1. Introduction
Magnetic microbeads have been used in a variety of methods as labels to indicate the presence of a biological molecule [1-3]. The basic structure of these assays involves capturing the target of interest, either an antigen or an antibody, on a surface, and using antibody-labeled magnetic beads or particles to bind to the target. The presence of the magnetic labels can be measured in a variety of ways, including changes in magnetoresistance [4,5], relaxation time [6,7], translational motion [8,9], and particle agglutination [10-12]. In this paper, we demonstrate label-acquired magnetorotation, in which the target facilitates the binding of magnetic label beads to a nonmagnetic sphere, and the rotational frequency of the resulting sandwich complex in a rotating magnetic field depends on the number of attached magnetic label beads. Label-acquired magnetorotation is based on the principles of asynchronous magnetic bead rotation (AMBR), where magnetic particles rotate at a different rate than that of a driving magnetic field [18]. AMBR has previously been used in our laboratory to measure magnetic properties of magnetic particles [13], dynamic viscosity [13], detect bacterial cells with single cell sensitivity [14], and for designing a portable sensor [15]. Asynchronous rotation of microparticles has also been studied in a variety of other systems [16-27].
Superparamagnetic beads, which here are micron-sized beads, each typically composed of an inert polymer sphere embedded with superparamagnetic nanoparticles, have several advantageous properties for use as labels [2]. The magnetic material of the superparamagnetic beads is stable over time, and the beads are stable over long term storage and under most physiological conditions. Biological samples typically have little, if any, naturally occurring magnetic material, thus reducing the likelihood of background interference (with the exception of rare counterexamples, such as magnetotactic bacteria [28]). Super-paramagnetic beads are readily manipulated by external magnetic fields, and can be quantitatively detected by a variety of methods.
Sandwich immunoassays are common assay techniques used to detect biological molecules. A sandwich assay includes three components: a solid phase to isolate the analyte from the solution; the analyte itself; and a label or indicator, which binds specifically to the analyte. This results in the analyte being “sandwiched” between the solid phase and the label [29]. Some of the more frequently used labels include fluorescent molecules, enzymes, and superparamagnetic beads [30-32]. Here, we perform a sandwich assay on the surface of a non-magnetic sphere with superparamagnetic beads as labels.
Micron-scale spheres, particles, and magnetic beads are readily available commercially, in a variety of sizes, coated with biotin or streptavidin, making them an ideal model system for developing new immunoassays. Streptavidin is a tetrameric protein (MW~60 kDa) isolated from the bacteria Streptomyces avidinii, and forms a very strong noncovalent bond (Kd ≈ 10−15 M) with the protein biotin (MW~244) [33]. This protein pair has been used previously to develop spin valve sensors [34] and photonic surface crystal wave [35] assays. In this paper, the biotin-coated particles serve as a mimic for a biological analyte. In future work, biotin and streptavidin will be replaced by proteins and antibodies of clinical interest.
A schematic representation of the sensor is shown in Fig. 1. The setup consists of three components: 6.7 μm streptavidin-coated solid phase spheres, 40 nm biotin-coated particles serving as an analyte mimic, and 1 μm streptavidin-coated superparamagnetic label beads. This figure demonstrates the concept of label-acquired magnetorotation: the sandwich complex rotates only when it has acquired magnetic labels, and rotates faster with additional analyte. To the best of our knowledge, this design represents the first combination of label-acquired magnetic rotation with a sandwich assay for the detection of a biological target.
Fig. 1.
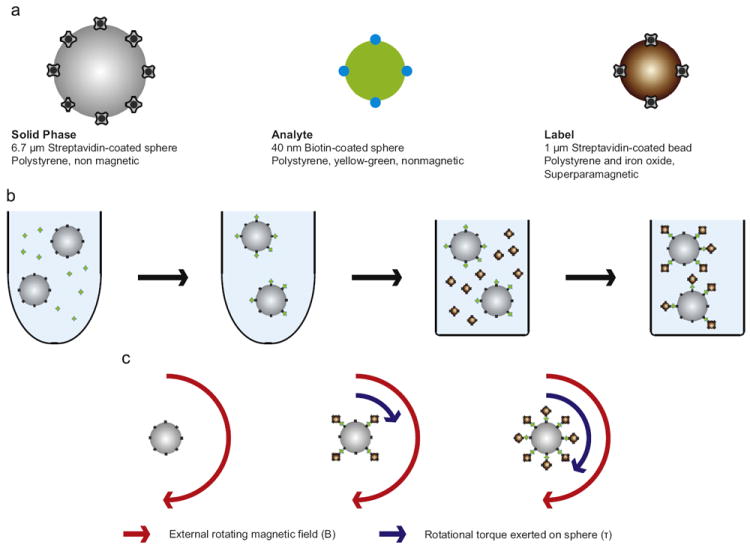
Schematic representation of the design of label-acquired magnetorotation. (a) The three components of the sandwich assay are shown, the solid phase sphere (6.7 μm streptavidin-coated sphere), the analyte mimic (40 nm biotin-coated particle), and the label (1 μm streptavidin-coated superparamagnetic bead). Streptavidin is a 60 kDa tetrameric protein, and is represented by the cloverleaf symbol in the schematic representation. Biotin is a 244 Da molecule, and is represented by blue dots. (b) Initially, the analyte is incubated with the spheres in a microcentrifuge tube. Following removal of the unbound analyte, the solution is transferred to a square-bottom 384-well plate, where the spheres are incubated with magnetic beads that bind selectively to the analyte, which forms a sandwich complex. (c) In the presence of a rotating magnetic field of constant magnitude, its rotational frequency, is a function of the number of attached superparamagnetic label beads.
2. Materials and methods
1 × Dulbecco’s Phosphate-Buffered Saline (PBS) was obtained from MP Biomedicals (Solon, OH). Tween-20 was obtained from Acros Organics (Geel, Belgium). 10% Bovine Serum Albumin (BSA) Blocker solution was obtained from Pierce (Rockford, IL). 6.7 μm streptavidin-coated polystyrene solid phase spheres (Spherotech, Lake Forest, IL), with density ρ = 1 g/cm3, were washed three times by centrifuging and discarding the supernatant. The spheres were then resuspended and diluted 1:10 in a PBS solution that contained 0.1% Tween-20 and 0.1% BSA (which will be referred to as PBS-TB) to reduce nonspecific adsorption, resulting in a final concentration of 3.02 × 10³ spheres/μL. 40 nm yellow–green fluorescent biotin-coated particles (Invitrogen, Carlsbad, CA) were diluted in PBS-TB to final concentrations ranging 1.62 × 10⁵–5.12 × 10⁷ particles/μL. 10 μL of the diluted 6.7 μm streptavidin-coated solid phase spheres were mixed with 10 μL of each biotin-coated particle solution and incubated end-over-end on a Sarmix SR1 (Sarstedt, Numbrecht, Germany) rotating mixer for 18 h. Excess biotin-coated particles were removed by centrifuging the solution and discarding the supernatant three times, and the sample was then resuspended in PBS-TB. (This step was necessary because free biotin-coated particles would cause the streptavidin-coated superparamagnetic label beads to clump.) Successful binding and washing were confirmed by fluorescent microscopy with a 488 nm wavelength light excitation.
1 μm Dynal T1 streptavidin-coated superparamagnetic label beads (Invitrogen), ρ= 1.8 g/cm3, were washed three times, and were then resuspended and diluted 50 × in PBS-TB, for a final concentration of 1.94 × 10⁵ beads/μL. Two microliters of the biotin-coated 6.7 μm spheres and 2 μL of the 1 μm streptavidin-coated superparamagnetic label beads were mixed and diluted with 26 μL of PBS-TB, and then transferred to a well on a non-binding surface 384-well plate (Corning, Corning, NY). The components were incubated at room temperature for 4 h. During the incubation, the 1 μm streptavidin-coated superparamagnetic label beads bound to the exposed biotin-coated particles on the 6.7 μm streptavidin-coated solid phase spheres, forming sphere–particle–bead sandwich complexes. A coverslip fluidic cell was fashioned between two 22 × 40 mm No. 0 thickness coverslips (Pierce, Rockford, IL) separated by a single piece of double-sided clear tape (3M, St. Paul, MN). The sandwich complexes were transferred from the 384-well plate and pipetted into the coverslip fluidic cell. The ends of the fluidic cell were sealed with Apiezon L grease (Apiezon, Manchester, UK) to prevent convection, drift and evaporation.
A schematic representation of the experimental setup is shown in Fig. 2. A rotating magnetic field was created with a pair of orthogonal Helmholtz coils that fits onto an inverted microscope. One pair of coils was driven by a sine wave, and the other pair was driven by a cosine wave, generating a uniform rotating magnetic field between the coils. The driving frequency and amplitude were controlled by an in-house custom-built function generator and amplifier. The field in the center of the coils was 1 mT rotating at a frequency of 20 Hz, as measured by a 3-axis magnetic field transducer (SENIS GmbH, Zurich, Switzerland). The rotation of the spheres was observed using two setups. The first was an Olympus IMT-2 inverted microscope (Olympus, Melville, NY) connected to a Photometrics Cool Snap ES camera (Roper Scientific, Trenton, NJ). Videos were recorded on a computer using MetaMorph (Meta Imaging Software, Downington, PA). The second was an Olympus IX71 inverted microscope with an oil-immersion 100 × objective connected to a Basler piA640-210gm camera (Basler, Highland, IL). Videos were recorded on a computer using an in-house program written in LabVIEW (National Instruments, Austin, TX). Videos were analyzed using the St. Andrews particle tracker (with custom modification to allow for tracking of angular orientation) [36], a sophisticated LabVIEW-based particle tracking program.
Fig. 2.
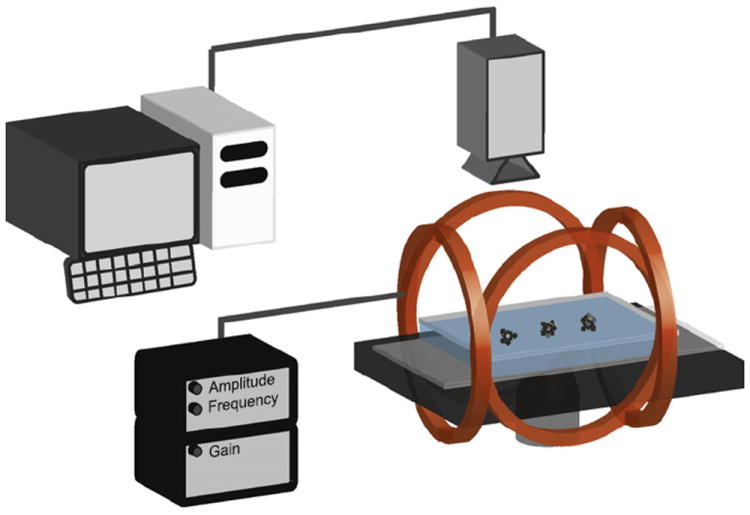
Schematic representation of the setup used in this paper. Sandwich complexes are pipetted into a coverslip fluidic cell. A rotating magnetic field is created by two orthogonally oriented Helmholtz coils with each coil wrapped with 90 turns of copper wire. The field is controlled by a function generator and an amplifier. Parallel coils are considered part of a “pair”. The pairs are driven 90° out-of-phase with each other. The spheres are observed through 60 × and 100 × objectives connected to a digital camera. Videos are analyzed to determine rotational frequency.
3. Theory
3.1. Theoretical overview
For a magnetic object actively rotating in a fluid, the magnetic torque (τmag = m × μ0H) and the rotational fluidic drag (τdrag = γdθ/dt) oppose each other, and are the primary factors determining the rotational dynamics in a low Reynolds number environment. The magnetic torque is composed of the induced (e.g. paramagnetic and superparamagnetic) and permanent (e.g. ferromagnetic) magnetic moments of the bead. This relationship is expressed below
| (1) |
| (2) |
| (3) |
where mind is the induced magnetic moment of the bead, mperm is the permanent magnetic moment of the bead, μ0 is the permeability of free space, H is the magnetizing field, γ is the drag coefficient, θ is the angular orientation of the object, and dθ/dt is the rotational rate in radians/s. Note that for this case, other forces, such as inertial and Brownian, are neglected. For a rotating body in fluid, γ = κηVH, where κ is the shape factor (equal to 6 for a sphere), η is the dynamic viscosity, and VH is the hydrodynamic volume of the rotating body. The magnetic torque arising from the induced magnetic moment can be obtained by combining the relationships mind = MVm and M = χH, where M is the magnetization of the material, χ is the magnetic susceptibility and Vm is the magnetic volume. In a rotating magnetic field, the magnetic susceptibility can be separated into real and imaginary parts χ = χ′–iχ″, corresponding to in-phase and out-of-phase components of the magnetization. When the above relationships are substituted into τind = mind × μ0H and the cross product is carried out (namely |(χ′H–iχ″H) × H| = χ″H2), one arrives at Eq. (4), which describes the torque arising from an induced magnetic moment
| (4) |
The torque arising from the permanent magnetic moment in a rotating magnetic field can be expressed as
| (5) |
where t is time and Ω is the rotational frequency of the field. Combining Eqs. (1)-(5), yields
| (6) |
Eq. (6) describes the behavior of the rotating sandwich complex, composed of 1 μm superparamagnetic beads (with a small ferromagnetic component), in a rotating magnetic field.
The magnetic beads used in this study are composed of 1 μm polymer spheres embedded with superparamagnetic nanoparticles. In the presence of a magnetic field, the magnetic moments of these nanoparticles align with the field, and can undergo Neel relaxation. If the frequency of a rotating field is sufficiently high, the magnetic behavior is dominated by the imaginary susceptibility, which has been discussed in detail in the literature [26,37-40]. When dealing with only an induced moment, Eq. (6) reduces to
| (7) |
When dealing with only permanent magnetic dipoles, Eq. (6) reduces to
| (8) |
As has been previously shown [18,23], Eq. (8) can be analytically solved.
3.2. Theory for rotating sandwich complex
For the frequency and magnetic field amplitude used in this manuscript, 20 Hz and 1 mT, the rotation rate scales with the square of the magnetic field amplitude, as given by dθ/dt ∝ H2 (data not shown). Additionally, the rotation rate increases with increasing driving frequencies between 10 and 1000 Hz, which suggests dependency on imaginary susceptibility in Eq. (7). Both observations indicate that, under these conditions, the induced moment of the beads dominates over their permanent moment and is the primary cause of the driven rotation. As a result, we obtain the following relationship since other variables in Eq. (7) are constant during the experiments, and changes in the drag coefficient are assumed to be negligible
| (9) |
For a collection of particles with induced dipoles, the total moment is approximated as the sum of the individual induced moments of each particle. Therefore, Eq. (9) can be rewritten as
| (10) |
This dependence can be seen in Fig. 5b, and Eq. (8) holds for materials that do not have permanent dipoles. Eq. (10) establishes that the rotational frequency of a sandwich complex in a rotating magnetic field is a function of the number of 1 μm super-paramagnetic beads in the rotating sandwich complex (expressed later in this paper in Hz (e.g. (1/2π)*(dθ/dt)). Assuming the beads attach proportionally to the concentration of the analyte, we can rewrite Eq. (10) as
| (11) |
Fig. 5.
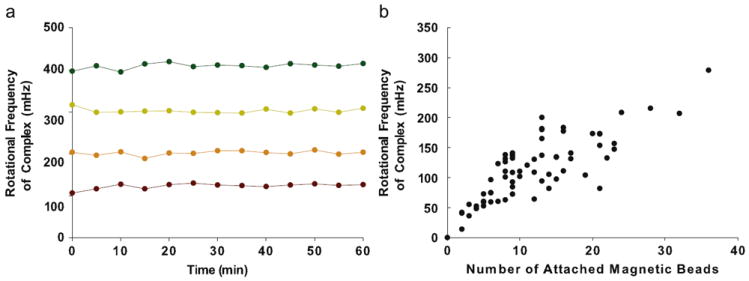
(a) The stability of the rotation of a sandwich complex over time. The rotational frequency of the complex was obtained every 5 min over a 60 min observational period. The mean ± standard deviation of the rotational frequency for the four complexes over the observational period is 124.1 ± 6.2, 203.3 ± 5.1, 302.1 ± 4.2, and 410.8±6.3 mHz. (b) Relationship between the rotational frequency of the sandwich complex and the number of attached superparamagnetic beads. A linear trendline fits the data (r2 = 0.649). Note that a sandwich complex will rotate with as little as two attached beads.
Indeed, this general behavior of an increased rotational rate with increased analyte coverage is observed over two orders of magnitude as shown in Fig. 6, and is discussed in detail below.
Fig. 6.
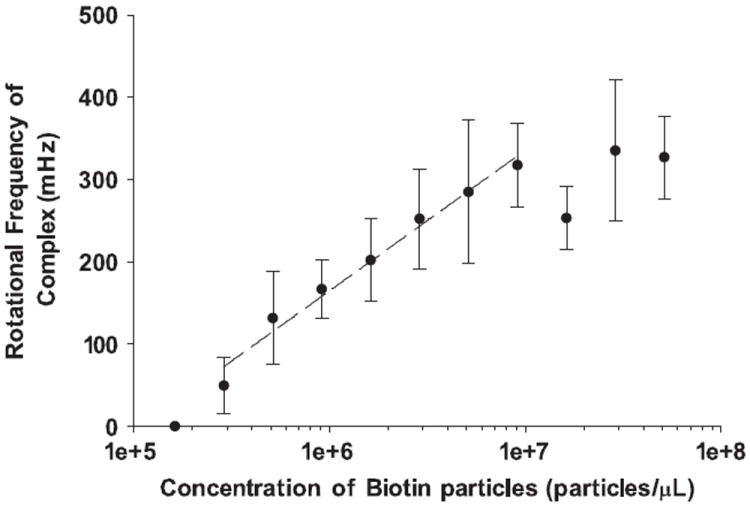
A log–linear plot of the relationship between rotational frequency of the complex and concentration of an analyte incubated with the sphere. Each point represents an average of eight measurements (± SD). At high concentrations of biotin-coated particles, the sensor saturates and the rotational frequency plateaus. The sensor is linear over its dynamic range, indicated by the dashed line, r2 = 0.982.
4. Results and discussion
Sandwich complex assays were performed with biotin-coated particles as the analyte, which mimic a biological target. The concentration of biotin-coated particles was measured by observing the rate of rotation of the (solid phase sphere)–(biotin-coated particle)–(superparamagnetic label bead) sandwich complex. The 6.7 μm solid phase sphere has a surface area of 141 μm2. Given that a 40 nm biotin-coated particle would occupy an area of 1.26 × 10⁻³ μm2, one 6.7 μm sphere could bind up to 105 biotin-coated particles. The superparamagnetic label beads have a diameter of 1 μm, and occupy an area of 0.866 μm2, which, given the limits of the packing efficiency of spheres, suggest that 145 superparamagnetic label beads can bind to that surface. This configuration would be expected to produce a sensor with approximately 2 orders of magnitude of dynamic range, as indicated by Eqs. (7) and (10), assuming that the magnetic moments of the beads are additive. The position at which the beads bind to the sphere should mostly affect the rotation at low numbers of binding beads. A variation in the binding location of a few beads could affect the rotational speed, which would result from differences in location-dependent torque and drag. However, as the number of beads on the sphere increases, this effect will have a smaller contribution. A full theoretical investigation into the specifics of this effect warrants further study, potentially using Hydro++ [41], but is beyond the scope of this manuscript. Furthermore, the 6.7 μm “mother” sphere is more than 300 times bigger than a 1 μm label bead, thus the binding of a single bead to the sphere should not significantly alter the sphere’s center of rotation or shape factor. 1 μm beads were selected as labels for these experiments, so that they could still be individually distinguished by using light microscopy.
Scanning electron micrographs of the sandwich complexes are shown in Fig. 3. The three complexes shown were from samples with total biotin-coated particle concentrations of 2.88 × 10⁷, 2.88 × 10⁶, and 2.88 × 10⁵ particles/μL. Fig. 3a shows a reasonably dense coverage of the sphere by the superparamagnetic label beads, while Fig. 3b shows fewer beads, and Fig. 3c shows only two beads. This trend confirms that a greater number of superparamagnetic label beads are present with increasing amounts of biotin-coated particle.
Fig. 3.
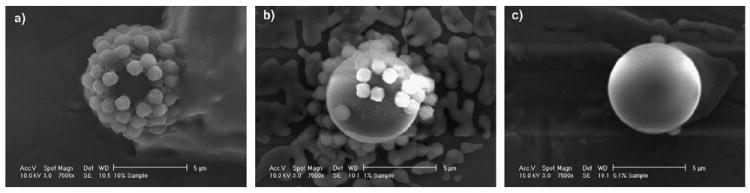
Scanning electron micrographs of sandwich complexes incubated with three different concentrations of biotin-coated particles, (a) 2.88 × 10⁷, (b) 2.88 × 10⁶, and (c) 2.88 × 10⁵ μL−1. The 1 μm superparamagnetic label beads can be seen attached to the surface of the 6.7 μm solid phase spheres. The structures in the background of these images likely resulted from salts left by the buffer after evaporation.
The frame-by-frame analysis of sandwich complexes, from four 15 s videos recorded at 20 frames per second, is shown in Fig. 4a. These four videos are included online as Supplementary Videos S1–S4. The angle of the sandwich complex in each frame is calculated against the first frame in the video, which is defined as the zero angle. One complete rotation is 360°. The sandwich complexes occasionally were out of focus, which caused the tracker to mistrack the complexes for those frames. These outlying points were removed from Fig. 4a, based on calculating the jackknife residuals for each point and discarding outliers, whose residuals exceeded the Bonferroni criteria [42]. The four videos represent sandwich complexes with rotational frequencies of 133, 231, 303, and 396 mHz. The traces demonstrate the stability and consistency of the rotation of a sandwich complex during a 15 s observational period. Ten frames from each of the four videos, 0.5 s apart, are shown in Fig. 4b. These images show the sandwich complexes rotating clockwise.
Fig. 4.
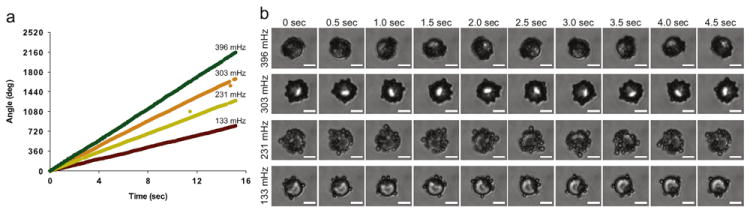
Examination of the behavior of individual sandwich complexes. (a) Frame-by-frame analysis of four different rotating sandwich complexes. The angle at each time point represents the number of degrees through which the complex has rotated since t0 (360° represents one full rotation). The rotational frequency of the complex is shown above each trace. (b) Ten frames from each of the videos in part (a), in 0.5 second intervals. The top sandwich complex completes about 1.75 rotations over the 10 frames, while the bottom sandwich complex completes about 0.75 rotations over the 10 frames. The driving frequency is 20 Hz for all samples. Scale bar is 5 μm.
The stability of the rotational frequency of sandwich complexes was also measured. Sandwich complexes were observed for 60 min, with 15 s videos of the rotating complex captured every 5 min. Eight sandwich complexes were observed in total; four adhered to the coverslip before the end of the 60 min, and were excluded from the analysis. The use of PBS-TB decreased nonspecific adherence to the coverslips, but did not completely prevent it. The average (±SD) rotational frequencies of the four complexes determined from the videos over the observational period are: 124.1 ± 6.2, 203.3 ± 5.1, 302.1 ± 4.2, and 410.8 ± 6.3 mHz. The rotational frequencies of the four sandwich complexes are shown in Fig. 5a, and demonstrate that the rotational frequency of a rotating complex is stable over at least 60 min.
The behavior of individual sandwich complexes was found to determine the relationship between the rotational frequency and the number of attached superparamagnetic label beads. The number of superparamagnetic label beads attached to the complex was determined by visual inspection. The rotating magnetic field was then turned on, and the rotational frequency of each complex was measured. These results are shown in Fig. 5b. (During observations, it was difficult to distinguish individual beads when more than 40 were on a solid phase sphere, so complexes with more than 40 attached beads were excluded from this analysis.) It should also be noted that a complex will rotate with as little as two attached superparamagnetic label beads, which suggests that the theoretical lower detection limit of the system could be on the order of a few analyte molecules bound to the surface, for this solid phase sphere and magnetic label bead combination.
Having established the stability of the rotation of a sandwich complex, and the relationship between rotational frequency and the number of attached superparamagnetic label beads, label-acquired magnetorotation (LAM) was then shown to be capable of measuring the concentration of biotin-coated particles in solution. Sandwich complexes with a range of biotin-coated particle concentrations were prepared as described in the experimental section, transferred into a coverslip fluidic cell, and placed in a rotating magnetic field. Eight sandwich complexes from each concentration of biotin-coated particles were chosen at random and 15 s videos of each sandwich complex were recorded. Complexes that adhered to the surface of the coverslip were not considered for analysis (the number of attached magnetic labels did not appear to be a factor in determining sandwich complex–surface adhesion). The results are shown in Fig. 6. The rotational frequency of the sandwich complex increases with increasing biotin-coated particle concentration over the range 1.62 × 10⁵–9.70 × 10⁶ biotin-coated particles/μL, and then plateaus at higher concentrations. This plateau is likely due to the saturation of the sphere by superparamagnetic beads labels. The lowest detected concentration of biotin-coated particles was 2.88 × 10⁵ particles/μL. No formation of sandwich complexes, or rotation of the 6.7 μm spheres, was observed in control samples with no biotin-coated particles.
These results demonstrate that label-acquired magnetorotation can be used to detect the presence of biological targets. One of the challenges facing this system is the significant size distribution of beads and spheres, which accounts for the wide distributions and large standard deviations in our data (Figs. 5b and 6). When comparing one sandwich complex to another, the uniformity of the solid phase is important. The 6.7 μm solid phase spheres had a coefficient of variability in the diameter of 5.8% as determined by fluorescent activated cell sorting [43]. Since the rotational frequency of the sphere depends on volume, this results in up to a 17.4% variability in rotational frequency. Additionally, the superparamagnetic label beads, composed of magnetic nanoparticles embedded in a 1 μm non-magnetic bead, exhibit significant bead-to-bead variability in magnetic content. Similarly, 2.8 μm superparamagnetic beads from the same manufacturer have been reported to have a variability in magnetic responsiveness (a combination of bead magnetic moment and shape factor) on the order of 30% [44,45], and observations in our laboratory suggest a similar variability for the 1 μm beads (data not shown). These high variabilities could be reflected by the data presented in Fig. 5. Despite the variabilities, averaging through multiple samples allows for validation of this new method.
The potential sensitivity of this method was indicated by the rotation of a sandwich complex which was observed after the attachment of just two superparamagnetic label beads. The system described here presents a number of potential advantages for diagnostic applications, and we are exploring a number of avenues that could turn this new method into a clinically useful technology. We envision that label-acquired asynchronous magnetic bead rotation will be used in future diagnostic devices. Such a system could be applied to detect a wide range of biological targets, including proteins, viruses, bacteria, and cancer cells, or any other target associateable with an affinity molecule. Currently, work is underway on label-acquired magnetorotation for the detection of antigens with antibodies, using a photodiode and a laser for monitoring rotation [15]. Additionally, work is underway to transfer this system onto a microfluidic chip.
5. Conclusion
This paper presents a proof-of-principle for a new kind of biosensor, based on label-acquired asynchronous magnetic bead rotation. The sensor is based on a sandwich assay, with a nonmagnetic sphere as the solid phase and superparamagnetic beads as analyte labels and utilizes asynchronous magnetic bead rotation (AMBR). The rotational frequency of the sandwich complex in a rotating magnetic field depends on the concentration of the analyte present in the solution. This sensor demonstrates the potential for a simple and sensitive technique, with two orders of magnitude in dynamic range, which we hope would improve upon parameter optimization. Although further work remains to be done, this system exhibits potential for integration with other developing diagnostic devices for proteins and other biological macromolecules.
Supplementary Material
Acknowledgments
The authors thank Alex Hrin for creating the video capture LabVIEW program, Ron Smith for assistance with microscopy, Lydia-Ann John Ghuneim for assistance with experiments, and Haiping Sun, Kai Sun, and the University of Michigan Electron Microbeam Analysis Laboratory (EMAL) for assistance with collecting the Scanning Electron Micrographs.
This research was partially supported by the Department of Homeland Security (DHS) Scholarship and Fellowship Program, administered by the Oak Ridge Institute for Science and Education (ORISE) through an interagency agreement between the U.S. Department of Energy (DOE) and DHS. ORISE is managed by Oak Ridge Associated Universities (ORAU) under DOE Contract no. DE-AC05-06OR23100. All opinions expressed in this paper are the author’s and do not necessarily reflect the policies and views of DHS, DOE, or ORAU/ORISE. BHM acknowledges supported by NIH Grant UL1RR024986 (Postdoctoral Translational Scholar Program). Additional support was provided by Grant NSF/DMR 0455330 (RK) and NIH R21 EB009550 (RK).
Abbreviations
- AMBR
Asynchronous Magnetic Bead Rotation
- PBS-TB
Phosphate-Buffered Saline with Tween-20 and Bovine Serum Albumin
Footnotes
Appendix A. Supplementary materials
Supplementary data associated with this article can be found in the online version at doi:10.1016/j.jmmm.2010.09.014.
BHM discloses financial interest in Life Magnetics, Inc.
Contributor Information
Ariel Hecht, Email: hecht@umich.edu.
Paivo Kinnunen, Email: pkkinn@umich.edu.
Brandon McNaughton, Email: bmcnaugh@umich.edu.
Raoul Kopelman, Email: kopelman@umich.edu.
References
- 1.Gijs M. Microfluidics Nanofluidics. 2004;1:22. [Google Scholar]
- 2.Gijs MAM, Lacharme F, Lehmann U. Chem Rev. 2010;110:1518. doi: 10.1021/cr9001929. [DOI] [PubMed] [Google Scholar]
- 3.Pamme N. Lab Chip. 2006;6:24. doi: 10.1039/b513005k. [DOI] [PubMed] [Google Scholar]
- 4.Edelstein RL, Tamanaha CR, Sheehan PE, Miller MM, Baselt DR, Whitman LJ, Colton RJ. Biosensors Bioelectron. 2000;14:805. doi: 10.1016/s0956-5663(99)00054-8. [DOI] [PubMed] [Google Scholar]
- 5.Baselt DR, Lee GU, Natesan M, Metzger SW, Sheehan PE, Colton RJ. Biosensors Bioelectron. 1998;13:731. doi: 10.1016/s0956-5663(98)00037-2. [DOI] [PubMed] [Google Scholar]
- 6.Lee H, Sun E, Ham D, Weissleder R. Nat Med. 2006;14:869. doi: 10.1038/nm.1711. [DOI] [PMC free article] [PubMed] [Google Scholar]
- 7.Chung SH, Hoffmann A, Bader SD, Liu C, Kay B, Makowski L, Chen L. Appl Phys Lett. 2004;85:2971. [Google Scholar]
- 8.Hahn YK, Jin Z, Kang JH, Oh E, Han MK, Kim HS, Jang JT, Lee JH, Cheon J, Kim SH, Park HS, Park JK. Anal Chem. 2007;79:2214. doi: 10.1021/ac061522l. [DOI] [PubMed] [Google Scholar]
- 9.Kim KS, Park JK. Lab Chip. 2005;5:657. doi: 10.1039/b502225h. [DOI] [PubMed] [Google Scholar]
- 10.Baudry J, Bertrand E, Lequeux N, Bibette J. J Phys-Condens Mater. 2004;16:R469. [Google Scholar]
- 11.Baudry J, Rouzeau C, Goubault C, Robic C, Cohen-Tannoudji L, Koenig A, Bertrand E, Bibette J. Proc Natl Acad Sci USA. 2006;103:16076. doi: 10.1073/pnas.0607991103. [DOI] [PMC free article] [PubMed] [Google Scholar]
- 12.Petkus MM, McLauchlin M, Vuppu AK, Rios L, Garcia AA, Hayes MA. Anal Chem. 2006;78:1405. doi: 10.1021/ac0512204. [DOI] [PubMed] [Google Scholar]
- 13.McNaughton BH, Agayan RR, Wang JX, Kopelman R. Sensor Actuators B—Chem. 2007;121:330. [Google Scholar]
- 14.McNaughton BH, Agayan RR, Clarke R, Smith RG, Kopelman R. Appl Phys Lett. 2007;91 [Google Scholar]
- 15.McNaughton BH, Kinnunen P, Smith RG, Pei SN, Torres-Isea R, Kopelman R, Clarke R. J Magn Magn Mater. 2009;321:1648. [Google Scholar]
- 16.McNaughton BH, Agayan RR, Stoica VA, Clarke R, Kopelman R. Nato Sci Peace S. 2008:403. [Google Scholar]
- 17.McNaughton BH, Anker JN, Kopelman R. J Magn Magn Mater. 2005;293:696. doi: 10.1016/j.jmmm.2010.09.014. [DOI] [PMC free article] [PubMed] [Google Scholar]
- 18.McNaughton BH, Kehbein KA, Anker JN, Kopelman R. J Phys Chem B. 2006;110:18958. doi: 10.1021/jp060139h. [DOI] [PubMed] [Google Scholar]
- 19.Helgesen G, Pieranski P, Skjeltorp AT. Phys Rev Lett. 1990;64:1425. doi: 10.1103/PhysRevLett.64.1425. [DOI] [PubMed] [Google Scholar]
- 20.Biswal SL, Gast AP. Anal Chem. 2004;76:6448. doi: 10.1021/ac0494580. [DOI] [PubMed] [Google Scholar]
- 21.Shelton WA, Bonin KD, Walker TG. Phys Rev E Stat Nonlinear Soft Matter Phys. 2005;71:036204. doi: 10.1103/PhysRevE.71.036204. [DOI] [PubMed] [Google Scholar]
- 22.Yellen BB, Erb RM, Son HS, Hewlin R, Jr, Shang H, Lee GU. Lab Chip. 2007;7:1681. doi: 10.1039/b713547e. [DOI] [PubMed] [Google Scholar]
- 23.Cebers A, Ozols M. Phys Rev E. 2006;73:021505. doi: 10.1103/PhysRevE.73.021505. [DOI] [PubMed] [Google Scholar]
- 24.Anker JN, Behrend C, Kopelman R. J Appl Phys. 2003;93:6698. [Google Scholar]
- 25.Anker JN, Kopelman R. Appl Phys Lett. 2003;82:1102. [Google Scholar]
- 26.Janssen XJA, Schellekens AJ, van Ommering K, van Ijzendoorn LJ, Prins MWJ. Biosensors Bioelectron. 2009;24:1937. doi: 10.1016/j.bios.2008.09.024. [DOI] [PubMed] [Google Scholar]
- 27.Bacri JC, Cebers AO, Perzynski R. Phys Rev Lett. 1994;72:2705. doi: 10.1103/PhysRevLett.72.2705. [DOI] [PubMed] [Google Scholar]
- 28.Erglis K, Wen Q, Ose V, Zeltins A, Sharipo A, Janmey PA, Cebers A. Biophys J. 2007;93:1402. doi: 10.1529/biophysj.107.107474. [DOI] [PMC free article] [PubMed] [Google Scholar]
- 29.Wild D. The Immunoassay Handbook. second. Nature Pub. Group; London: 2001. [Google Scholar]
- 30.Baselt DR, Lee GU, Colton RJ. J Vac Sci Technol B. 1996;14:789. [Google Scholar]
- 31.MacBeath G. Nat Genet. 2002;32:526. doi: 10.1038/ng1037. [DOI] [PubMed] [Google Scholar]
- 32.Park S, Durst RA. Anal Biochem. 2000;280:151. doi: 10.1006/abio.2000.4481. [DOI] [PubMed] [Google Scholar]
- 33.Weber PC, Ohlendorf DH, Wendoloski JJ, Salemme FR. Science. 1989;243:85. doi: 10.1126/science.2911722. [DOI] [PubMed] [Google Scholar]
- 34.Ferreira HA, Graham DL, Freitas PP, Cabral JMS. J Appl Phys. 2003;93:7281. [Google Scholar]
- 35.Konopsky VN, Alieva EV. Biosensors Bioelectron. 2010;25:1212. doi: 10.1016/j.bios.2009.09.011. [DOI] [PubMed] [Google Scholar]
- 36.Milne G. Optical Sorting and Manipulation of Microscopic Particles. University of St Andrews; 2007. [Google Scholar]
- 37.Connolly J, St Pierre TG. J Magn Magn Mater. 2001;225:156. [Google Scholar]
- 38.Fannin PC, Cohen-Tannoudji L, Bertrand E, Giannitsis AT, Mac Oireachtaigh C, Bibette J. J Magn Magn Mater. 2006;303:147. [Google Scholar]
- 39.Astalan AP, Ahrentorp F, Johansson C, Larsson K, Krozer A. Biosensors Bioelectron. 2004;19:945. doi: 10.1016/j.bios.2003.09.005. [DOI] [PubMed] [Google Scholar]
- 40.Krishnan K. IEEE Tran Magn. 2010;46:2523. doi: 10.1109/TMAG.2010.2046907. [DOI] [PMC free article] [PubMed] [Google Scholar]
- 41.Garcia de la Torre J, Navarro S, Lopez Martinez MC, Diaz FG, Lopez Cascales JJ. Biophys J. 1994;67:530. doi: 10.1016/S0006-3495(94)80512-0. [DOI] [PMC free article] [PubMed] [Google Scholar]
- 42.Faraway JJ. Linear Models with R. Chapman & Hall/CRC; Boca Raton: 2005. [Google Scholar]
- 43.Kildrew-Shah B. Personal E-mail communication on the variability of spherotech SVP-60-5 lot AA01. 2009 [Google Scholar]
- 44.Hafeli UO, Lobedann MA, Steingroewer J, Moore LR, Riffle J. J Magn Magn Mater. 2005;293:224. [Google Scholar]
- 45.Hafeli U, Ciocan R, Dailey JP. Eur Cells Mater. 2002;3:24. [Google Scholar]
Associated Data
This section collects any data citations, data availability statements, or supplementary materials included in this article.